Modeling the chemical enrichment history of the Bulge Fossil Fragment Terzan 5
Abstract
Terzan 5 is a heavily obscured stellar system located in the inner Galaxy. It has been postulated to be a stellar relic, a Bulge Fossil Fragment witnessing the complex history of the assembly of the Milky Way bulge. In this paper, we follow the chemical enrichment of a set of putative progenitors of Terzan 5 to assess whether the chemical properties of this cluster fit within a formation scenario in which it is the remnant of a primordial building block of the bulge. We can explain the metallicity distribution function and the runs of different element-to-iron abundance ratios as functions of [Fe/H] derived from optical-infrared spectroscopy of giant stars in Terzan 5, by assuming that the cluster experienced two major star formation bursts separated by a long quiescent phase. We further predict that the most metal-rich stars in Terzan 5 are moderately He-enhanced and a large spread of He abundances in the cluster, –0.335. We conclude that current observations fit within a formation scenario in which Terzan 5 originated from a pristine, or slightly metal-enriched, gas clump about one order of magnitude more massive than its present-day mass. Losses of gas and stars played a major role in shaping Terzan 5 the way we see it now. The iron content of the youngest stellar population is better explained if the white dwarfs that give rise to type Ia supernovae (the main Fe factories) sink towards the cluster center, rather than being stripped by the strong tidal forces exerted by the Milky Way in the outer regions.
1 Introduction
The formation and evolution of bulges (encompassing classical and pseudobulges, Kormendy & Kennicutt, 2004) in massive spiral galaxies can be driven by several mechanisms, including violent, early dissipative collapse of gas (Eggen et al., 1962), mergers (Springel & Hernquist, 2005), secular evolution of dynamically unstable discs (Combes et al., 1990), coalescence of giant star-forming clumps (Immeli et al., 2004; Elmegreen et al., 2008), or a combination thereof (see Athanassoula, 2005, for a review).
In our Galaxy the bulge formation process is likely a motley growth, leading to a composite system. Although the central regions of the Milky Way (MW) are notoriously challenging to observe due to crowding and variable extinction on small spatial scales that severely hamper an unbiased view (Baade, 1946; Gonzalez et al., 2012; Nogueras-Lara et al., 2021), it can be plainly argued that the Galactic bulge is a complex environment, where different stellar populations coexist (Bensby et al., 2013; Rojas-Arriagada et al., 2014; Barbuy et al., 2018; Horta et al., 2021; Queiroz et al., 2021; Nieuwmunster et al., 2023, see also Athanassoula et al. 2017).
In the past decades, deep photometry and high-resolution spectroscopy of large samples of individual stars have provided key information on the ages, kinematics and chemical composition of the stellar populations inhabiting the MW bulge. The old ages inferred from colour-magnitude diagrams (CMDs) of different globular clusters (GCs) and fields in the bulge (Ortolani et al., 1995; Zoccali et al., 2003; Clarkson et al., 2008; Valenti et al., 2013; Bica et al., 2016; Saracino et al., 2019; Surot et al., 2019) rule out an extended period of star formation. Yet, some stars with ages Gyr are present (e.g., Bensby et al., 2013, 2017; Catchpole et al., 2016; Schultheis et al., 2017). The significance of this young population is the subject of ongoing debate (Haywood et al., 2016; Renzini et al., 2018; Saha et al., 2019; Rich et al., 2020). Hasselquist et al. (2020) note that the likelihood of ending up with some relatively young stars in a bulge sample depends on the metallicity and height above the plane probed by the observations. Indeed, younger stars are found among the metal-richest ones and closer to the Galactic plane.
Field stars in the bulge cover a broad metallicity range, [Fe/H] (Bensby et al., 2013), with a few extremely metal-poor stars at [Fe/H] (Howes et al., 2015). Metal-poor and metal-rich stars present distinct kinematic properties, overall consistent with belonging, respectively, to an old spheroid (or thick disc) and a buckled bar (Hill et al., 2011; Babusiaux, 2016). In a [/Fe]–[Fe/H] diagram, members of the old, metal-poor, pressure-supported spheroidal component dominate a well-defined upper sequence, while objects inhabiting the metal-rich, boxy/peanut X-shaped bar populate the lower sequence, which sets important constraints on the formation timescale of each component (Rojas-Arriagada et al., 2019). The complexity of the stellar populations further shows up in the metallicity distribution function (MDF), which unveils a clear multimodality111Other works (Bensby et al., 2011; Hill et al., 2011; Rojas-Arriagada et al., 2014; Gonzalez et al., 2015; Zoccali et al., 2017; Schultheis et al., 2017) reveal a bimodality in the MDF, possibly due to smaller sample sizes and/or larger individual measurement errors. with varying proportions of its main components in different fields of view (Bensby et al., 2013; Rojas-Arriagada et al., 2020).
In terms of chemical properties, GCs in the bulge behave as their halo and thick-disc counterparts. Their members show the characteristic anticorrelations among the abundances of light elements, while the abundances of heavy elements do not present internal variations and follow the average abundance patterns traced by field stars (Gratton et al., 2019).
Clusters found in the inner Galaxy possibly had larger masses in the past. Likely, they have lost preferentially low-mass stars, owing to mass segregation and strong tidal forces (Vesperini & Heggie, 1997; Baumgardt & Makino, 2003). These processes may eventually lead to the complete dissolution of the clusters (Portegies Zwart et al., 2002). Recently, Minniti et al. (2018) have reported the first clear observational signature of bulge-crossing shocks for M 62, one of the most massive MW GCs located in the bulge. Another important point is that in -body calculations the stellar remnants strongly concentrate towards the cluster core (e.g., Baumgardt & Makino, 2003).
A few stellar systems in the MW bulge deserve special attention. In fact, up to now, two stellar systems in the MW bulge with the appearance of massive GCs, namely, Terzan 5 and Liller 1, have been found to harbor multiple sub-populations with large differences in age and in iron content (Ferraro et al., 2009, 2016, 2021). The modeling of the star formation history of Liller 1 suggests that this stellar system has been forming stars over its entire lifetime, with three main star formation episodes – the oldest occurring some 12–13 Gyr ago and the most recent one occurring only 1–3 Gyr ago – and some low-level activity in between (Dalessandro et al., 2022). Indeed, the first spectroscopic screening of Liller 1 confirms the presence of multi-iron sub-populations (Crociati et al., 2023).
The case of Terzan 5, which is the target of this study, is better observationally constrained. Terzan 5 is a dense conglomeration of stars formerly classified as a GC, which is now known to harbor two major populations of stars, one old (age = Gyr) and relatively metal-poor, with [Fe/H] and [/Fe] , the other younger (age = Gyr) and metal-rich, with [Fe/H] and [/Fe] (Ferraro et al., 2009, 2016; Origlia et al., 2011, 2013, 2019). A third, minor component is also detected, peaking at [Fe/H] and with [/Fe] (Origlia et al., 2013; Massari et al., 2014). Although an additional ultra metal-rich component at [Fe/H] could be possibly present, the statistics is still too low to firmly confirm its existence. The CMD analysis (Ferraro et al., 2009, 2016) and the reconstructed star formation history (Crociati et al., in preparation) clearly point to two major star formation events, separated by a long quiescent – or low-level activity – period. These characteristics definitely peg Terzan 5 to a more massive progenitor that was able to retain its supernova (SN) ejecta and self-enrich. Such an object would be seen as a giant star-forming clump at high redshift (Bournaud et al., 2008; Elmegreen et al., 2008). Interestingly, the peaks in the MDF of Terzan 5 track closely those in the MDF of the general bulge population, [Fe/H] , , and (Rojas-Arriagada et al., 2020). This would suggest a synchronous formation (Pflamm-Altenburg & Kroupa, 2009; McKenzie & Bekki, 2018), rather than the accretion of a satellite previously evolved in isolation (a scenario that, instead, explains rather well the dynamical and chemical properties of another anomalous GC-like system, Centauri, Bekki & Freeman, 2003; Romano et al., 2007). Indeed, the orbit of Terzan 5 suggests an in-situ origin (Massari et al., 2015; Baumgardt et al., 2019). Is it hence possible that a non-negligible fraction of bulge stars formed within gaseous cocoons that self-enriched and then disrupted, leaving behind a few compact survivors? Could Terzan 5 and Liller 1 be the remnants of these building blocks? In order to answer these questions, here we explore possible evolutionary paths yielding to a stellar system with structure and chemical properties compatible with the present-day configuration of Terzan 5.
The layout of the paper is as follows. The chemical evolution model is described in Sect. 2. The results are compared to the available observations in Sect. 3. Predictions still awaiting the test of future observations are presented in Sect. 4 and discussed in light of existing scenarios for the origin of Terzan 5. Our conclusions are drawn in Sect. 4.
2 Chemical evolution model
We follow the evolution of the abundances of several chemical elements representative of different nucleosynthesis channels (light, , Fe-peak, and neutron-capture elements) in the interstellar medium (ISM) of putative precursors of Terzan 5. To this end, we use a single-zone numerical model (Romano & Starkenburg, 2013; Romano et al., 2015) that solves the classical set of equations of chemical evolution (Tinsley, 1980; Matteucci, 2012, 2021).
We do not implement any detailed treatment of the gas and star dynamics in our model. Nonetheless, we are able to discuss some dynamical effects, by putting our findings into the broader context provided by -body simulations of star cluster evolution (see Sects. 3 and 4).
2.1 Basic assumptions
Raw material for star formation is provided by gas cooling within a giant cloud (for a thorough discussion of gas accretion modes in galaxies see Sánchez Almeida et al., 2014). We consider either pristine gas with primordial chemical composition () or pre-enriched gas with [Fe/H] (). The rate of gas infall is parameterised as
| (1) |
where is the initial mass of the cloud, and the e-folding time, , is a free parameter of the model.
The cold gas is turned into stars following a phenomenological law (Schmidt, 1959; Kennicutt, 1998),
| (2) |
where the star formation efficiency, , is a free parameter of the model (set constant in time) and .
The multi-peaked MDF and CMD morphology of Terzan 5 suggest that the star formation in the proto-cluster was not a smooth, continuous process, but rather proceeded through distinct bursts (Ferraro et al., 2016), possibly interspersed with low-level activity, as is the case for Liller 1 (Dalessandro et al., 2022). It is important to keep in mind that, while the multi-peaked MDF of Terzan 5 clearly indicates the existence of multi-iron components, it cannot be used to weight precisely each sub-population. More stringent constraints to the sizes of the two major populations (the metal-poor one peaking at [Fe/H], generated about 12 Gyr ago, and the metal-rich one peaking at [Fe/H], formed 4.5 Gyr ago) can be derived from photometric properties. In fact, the star counts in the two detected red clumps (see Ferraro et al., 2009) led to the estimate that approximately 38% of the current stellar population of Terzan 5 (namely, M⊙ of stars) originated from the youngest burst (Lanzoni et al., 2010). Regarding the relative ages of the two sub-populations, it is worth emphasizing that the analysis of the main-sequence turnoff region (Ferraro et al., 2016) has definitely removed any age-helium degeneracy (see D’Antona et al., 2010; Nataf & Gould, 2012, for a thorough discussion of this problem). We use the above observational inferences to constrain the star formation history of our models.
The initial masses of newborn stars are distributed according to a Kroupa (2001) stellar initial mass function (IMF). In this work, the IMF is normalized to unity over the 0.1–100 M⊙ mass range.
In some models we also take gas outflows and/or stellar stripping into account. Energetic feedback from SNe, ram pressure and tidal stripping, in fact, may get rid of a large fraction of the gas left over from the star formation process. Clusters born in the inner Galaxy also have their low-mass stars first pushed in the outskirts by mass segregation, then peeled off by strong tidal forces, with complete dissolution of the cluster being a possible outcome (see Portegies Zwart et al., 2002).
2.2 Nucleosynthesis prescriptions
The stellar nucleosynthesis prescriptions are at the core of any chemical evolution model. In this study we adopt stellar yields that have been successfully tested against large chemical abundance datasets for the MW in previous work (Romano et al., 2010, 2017, 2019).
More precisely, the stellar yields are taken from Karakas (2010) for low- and intermediate-mass stars, Doherty et al. (2014a, b) for super-AGB stars, Nomoto et al. (2013) for massive stars, and Iwamoto et al. (1999) for type Ia SNe (SNeIa, thermonuclear explosions of white dwarfs in binary systems that completely disrupt the parent system). Stars more massive than 20 M⊙ may explode as core-collapse SNe (CCSNe), releasing energies of the order of ergs, or as hypernovae (HNe), releasing energies an order of magnitude higher. The HN fraction may vary (for instance, as a function of the metallicity of the system). To encompass all possible cases, we run both models in which all massive stars explode as CCSNe and models in which all stars with initial masses above 20 M⊙ explode as HNe. The yield tables are linearly interpolated as a function of the initial stellar mass and metallicity, and extrapolated to the 40–100 M⊙ regime (not covered by full stellar nucleosynthesis calculations in Nomoto et al. 2013) by keeping the yield constant.
While the number of CCSNe/HNe that explode in a system is plain set by the adopted star formation history and IMF, the number of expected SNIa explosions may depend on additional factors. For instance, orbital hardening and exchange interactions may lead to enhanced SNIa rates in star clusters relative to the field (Shara & Hurley, 2002, 2006). In classic chemical evolution models it is customary to assume that a constant fraction of the stellar mass in the range 3–16 M⊙ enters the formation of binary systems that give rise to SNIa explosions (see, e.g., Matteucci & Recchi, 2001). However, this fraction might be time and/or environment dependent. We discuss this issue in Sect. 3.
3 Results
| Model | stripped | ||||||
| (M⊙) | (Gyr) | (Gyr) | (Gyr-1) | stars | (M⊙) | ||
| (%) | |||||||
| (1) | (2) | (3) | (4) | (5) | (6) | (7) | (8) |
| H01 | 0 | 0.5 | 1.0 | 0.27 | 0 | ||
| H02 | 0 | 1.0 | 1.0 | 0.31 | 0 | ||
| H03 | 0 | 2.0 | 1.0 | 0.44 | 0 | ||
| H04 | 0 | 3.0 | 1.0 | 0.59 | 0 | ||
| H05 | 0 | 4.0 | 1.0 | 0.74 | 0 | ||
| H06 | 0 | 5.0 | 1.0 | 0.89 | 0 | ||
| H07 | 0 | 6.0 | 1.0 | 1.03 | 0 | ||
| H08 | 0 | 7.0 | 1.0 | 1.16 | 0 | ||
| H08s | 0 | 7.0 | 1.0 | 1.16 | 56 | ||
| L01 | 0.005 | 0.5 | 1.0 | 0.27 | 0 | ||
| L02 | 0.005 | 1.0 | 1.0 | 0.31 | 0 | ||
| L03 | 0.005 | 2.0 | 1.0 | 0.44 | 0 | ||
| L04 | 0.005 | 3.0 | 1.0 | 0.59 | 0 | ||
| L05 | 0.005 | 4.0 | 1.0 | 0.74 | 0 | ||
| L06 | 0.005 | 5.0 | 1.0 | 0.89 | 0 | ||
| L06s | 0.005 | 5.0 | 1.0 | 0.89 | 47 | ||
| L07 | 0.005 | 6.0 | 1.0 | 1.03 | 0 | ||
| L08 | 0.005 | 7.0 | 1.0 | 1.16 | 0 | ||
| T01 | 0.005 | 5.0 | 0.1 | 10.0 | 0 | ||
| T01s | 0.005 | 5.0 | 0.1 | 10.0 | 67 | ||
| T02 | 0.005 | 5.0 | 0.5 | 1.81 | 0 | ||
| T03 | 0.005 | 5.0 | 2.0 | 0.43 | 0 | ||
| T04 | 0.005 | 7.0 | 0.1 | 14.2 | 0 | ||
| T04s | 0.005 | 7.0 | 0.1 | 14.2 | 52 |
In this section, we present the results of different sets of models, in which we vary in turn: the mass and initial chemical composition of the gaseous clump out of which Terzan 5 emerges, the infall timescale, the number and duration of the star formation episodes, and the star formation efficiency. Since there is little doubt that the mass of Terzan 5 was larger in the past than what is observed today, M⊙ (Lanzoni et al., 2010), and motivated by dynamical arguments (Baumgardt et al., 2008), we assume that the initial gas cloud mass is in the range – M⊙. We build models that produce a final stellar mass in the range – M⊙, and study the effects of gas and stellar stripping. If stellar stripping is ineffective, the lower limit to the stellar mass range set above is consistent with the lowest value permitted by the observations (Lanzoni et al., 2010), while the upper limit allows for a high stripping efficiency.
Firstly, we develop a series of exploratory models to analyse qualitatively the outcome of an early star formation burst that builds up the majority of the stellar populations in Terzan 5 (Sects. 3.1–3.3). Then, we add the fringe star formation episode that originates the metal-rich, younger stars, paying attention to reproduce quantitatively the fractions of metal-poor and metal-rich stars inferred from the red clump analysis (Sect. 3.4). The values of the input parameters are listed in Table 1 (Table 2) for the single-burst (double-burst) models.
3.1 A pristine, massive parent cloud
We start our analysis by considering a M⊙ gas cloud with primordial chemical composition (). For the moment, we concentrate on the oldest stellar populations and forget about the young, metal-rich stars. We keep the duration of the ancient (age Gyr) star formation episode that generates the old stars fixed to Gyr and vary the e-folding time in Eq. (1) and the star formation efficiency in Eq. (2) so as to obtain the same present-day stellar mass ( M⊙) for different choices of the (, ) parameter couple. The adopted values of the model parameters are reported in Table 1 (models from H01 to H08).
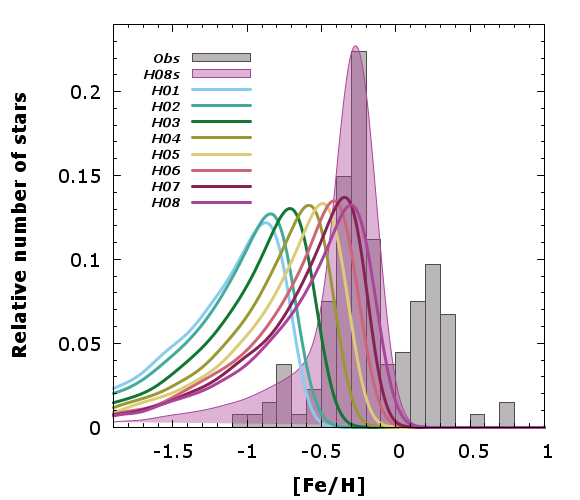
Clearly, the longer the infall time scale, the lower the cold gas mass available to form stars at early times and the higher the star formation efficiency required to end up with the desired total stellar mass. In Fig. 1, the predictions of models from H01 through to H08 (coloured lines) are compared to the observed iron distribution in Terzan 5 Massari et al. (grey histogram, 2014). The longer the infall time scale and the higher the star formation efficiency, the more the peak of the theoretical MDF is skewed towards high metallicities, in better agreement with the observations.
We are facing, unsurprisingly, the well-known problem commonly referred to as the ‘G-dwarf problem’, namely, a predicted excess of low-metallicity stars in systems that evolve as a closed box (van den Bergh, 1962; Pagel & Patchett, 1975; Martinelli & Matteucci, 2000; Greener et al., 2021). It is obvious that Terzan 5 does not evolve as an isolated system. Instead, its evolution is strongly influenced by the surroundings. In fact, a better fit to the observed MDF of Terzan 5 is obtained not only by assuming a somehow inefficient gas cooling ( Gyr for models H08 and H08s versus Gyr for model H01), possibly dictated by lively star formation activity in neighboring areas that keeps the gas warm, but also by accounting for the loss of a significant fraction of metal-poor stars due to mass segregation and tidal stripping222It is reasonable to expect that, as the star formation and the chemical enrichment proceed, cooling flows bring the enriched gas to the cluster center. Therefore, metal-rich stars form in the inner regions, while metal-poor stars are found mainly in the outer regions. For these reasons metal-poor, low-mass stars are more susceptible to stripping. (model H08s). The purple-shaded area in Fig. 1 that best fits the data, in fact, refers to a situation in which 75% of the stars with [Fe/H] have been stripped, corresponding to a 56% reduction of the total stellar mass. This leaves us with M⊙ at present, which is hardly compatible with the observed value for the old stellar component of Terzan 5, within the quoted uncertainty.
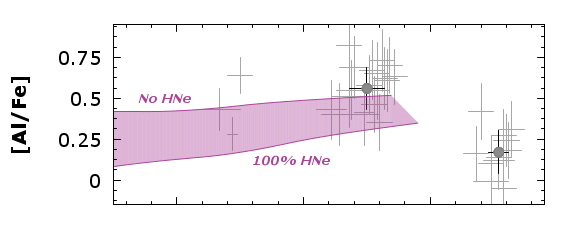
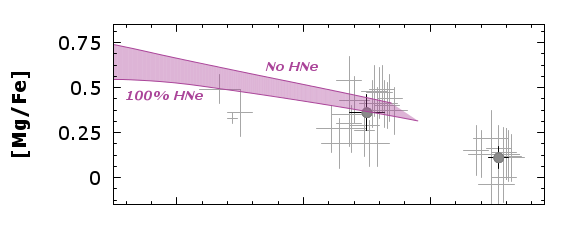
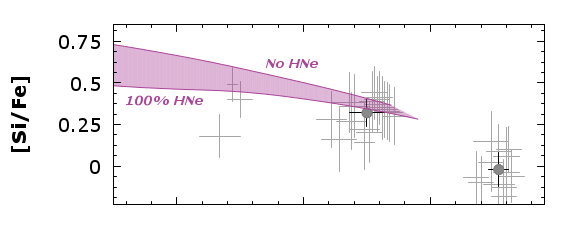
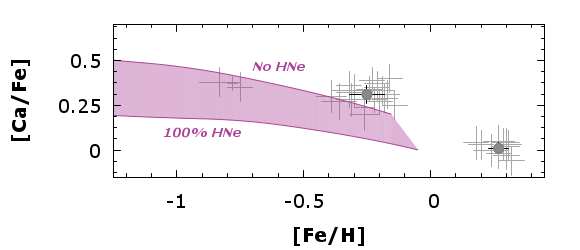
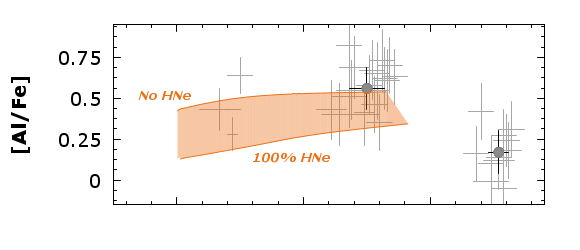
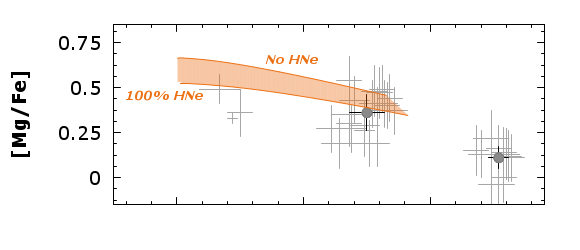
Figure 2 shows the behaviour of the abundance ratios of Al, Mg, Si, and Ca to Fe as a function of metallicity predicted by model H08s. The lower (upper) envelope of the shaded area in each panel refers to the case in which HN nucleosynthesis is (is not) included, with all (no) stars above 20 M⊙ exploding as HNe. The shaded area stands for intermediate figures. The agreement among model predictions and observations is satisfactory333We remind that the metal-rich sub-population is not reproduced by this model by construction., also taking into account the many uncertainties that still affect the stellar nucleosynthesis prescriptions (Romano et al., 2010).
3.2 A pre-enriched, low-mass gas cocoon
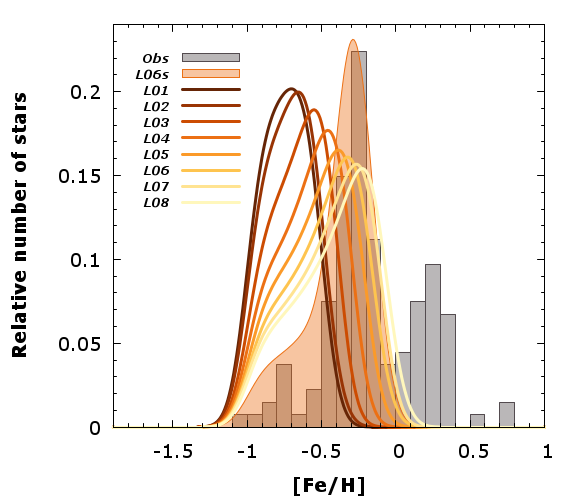
In this section, we discuss the results of a set of models (Table 1, models from L01 to L08) that share the same parameter values with the previous one, bar the total amount ( M⊙) and initial chemical composition () of the gas. The final stellar mass is M⊙, with no synthetic stars created below [Fe/H] by construction.
Similarly to what we have seen in the previous section, the theoretical MDF matches more closely the observed one if: (i) the gas is kept warm (due to strong stellar feedback in the surroundings?), so that the cold gas that fuels the star formation is accreted on long time scales and (ii) the system is deprived of a non-negligible fraction (here, 65%) of its long-lived, low-mass stars with [Fe/H] dex (Fig. 3). After stripping, model L06s ends with a total present-day stellar mass of M⊙, which is marginally compatible with the observational estimate (when also taking into account the increase in stellar mass that is expected as a consequence of the second, late star formation burst). The chemical properties of the sub-solar populations of Terzan 5 are well reproduced by model L06s (Fig. 4), which also matches well the position of the main peak of the MDF.
We note that starting from a slightly pre-enriched gas favours the appearance of a secondary, metal-poor MDF peak. This conclusion is totally unrelated to the assumed mass of the progenitor. What matters, in fact, are the relative proportions between the mass of the cold gas entering the star-forming regions (dictated by the choice of ) and the mass of the stars born in the system (dictated by the choice of ) at each time, and not their absolute values.
While our chemical evolution model can not put stringent constraints on the initial mass of the progenitor of Terzan 5 (though values as high as M⊙ seem somehow disfavoured), it is pretty much consistent with the expectations from dynamical investigations. Baumgardt et al. (2008) suggest that gas clouds with masses in excess of M⊙ tend to retain their gas despite multiple SN events, which would explain the self-enrichment of the most massive clusters. However, it is worth emphasizing that such models are tailored to systems evolving in a much less dense environment than the one provided by the inner Galaxy in its infancy.
3.3 Duration of the first star formation episode
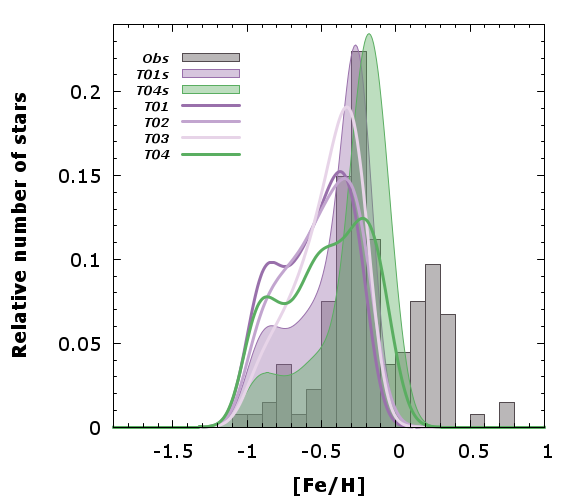
The analysis of the CMD of Terzan 5 allows an estimate of the ages of its stellar populations. Ferraro et al. (2016) find that the sub-solar components are consistent with ages of Gyr. This means that the duration of the star formation episode originating the oldest stars in Terzan 5 is Gyr. In principle, it could be as short as few tens of Myr. The models discussed in the previous sections assume a fiducial value of Gyr. In this section, we examine the effects of variations, from 100 Myr to 2 Gyr (see Table 1, models T01–T04).
Figure 5 illustrates the changes in the shape of the predicted MDF produced by variations of the duration of the main star formation episode compatible with the observed CMD (purple solid lines of progressively lighter shade for progressively longer star formation episodes). Since all the models have to produce the same final stellar mass, the shorter , the higher the required star formation efficiency (Table 1). A higher star formation rate at early times (model T01, darkest purple line) results in a more pronounced secondary peak at [Fe/H] , while such a feature completely disappears if the star formation lasts longer than 1 Gyr (model T03, lightest purple line). On the other hand, the position of the main peak does not change much with changing – it is rather dictated by the adopted value of (compare models T01 and T04, assuming and 7 Gyr, respectively). Not differently from what previously found, a better agreement with the observed MDF of Terzan 5 is obtained by imposing that stellar stripping is removing the majority of the low-mass, metal-poor stars (80% of all stars below [Fe/H] , models T01s and T04s, shaded areas in Fig. 5).
| Model | stripped stars | gas loss | SNIa precursors | |||||||||
|---|---|---|---|---|---|---|---|---|---|---|---|---|
| (M⊙) | (Gyr) | (Gyr) | (Gyr) | (Gyr-1) | (Gyr-1) | (%) | retention | (M⊙) | (M⊙) | |||
| (1) | (2) | (3) | (4) | (5) | (6) | (7) | (8) | (9) | (10) | (11) | (12) | (13) |
| S01s | 0.005 | 5.0 | 0.1 | 0.1 | 10.0 | 10.0 | 41 | no | yes | |||
| S02s | 0.005 | 5.0 | 0.1 | 0.1 | 10.0 | 10.0 | 58 | yes | yes | |||
| S03s | 0.005 | 5.0 | 0.1 | 0.1 | 10.0 | 10.0 | 58 | yes | no |
In principle, the duration of the star formation activity affects also the predicted trend of the elemental abundance ratios as a function of [Fe/H]. The longer , in fact, the larger the amount of iron restored by SNeIa on long time scales that enters the formation of subsequent stellar generations, resulting in a prominent reduction of several element-to-iron abundance ratios at high metallicities (especially for those elements that are produced for the most part by massive stars). However, the request that the final stellar mass be the same for all models translates into the demand for greater star formation efficiencies when the star formation lasts less. This leads to a larger production of Fe from massive stars on short time scales in the models with quicker bursts, which accompanies the enhanced, fast making of all other massive star products. The net result is that different models reach similar final metallicities, while the element-to-iron ratios differences amount to 0.2 dex at most. The most effective ‘litmus test’ of the duration of the star formation burst is, thus, the observed MDF of the system.
3.4 The two-burst models
The sub-solar metallicity components of Terzan 5 have chemical properties consistent with being born on a relatively short timescale ( Myr) from a slightly metal-enriched gas cocoon significantly more massive (with a mass of a few M⊙) than the present system. In order to reproduce the chemical properties of the youngest (age Gyr) population of Terzan 5 that accounts for a non negligible fraction (38%, Lanzoni et al., 2010) of the present-day total mass of the cluster, we suggest a second, short ( Myr) star-formation episode, after a long (7.5 Gyr) interlude where stars are basically not formed, as inferred from CMD analyses. Hereinafter, we use the I/II subscript when referring to the first/second star-formation episode. Notice that our models give no clues about the physical reasons for this long quiescent phase, and that a very low-level star formation activity in between the two major events (similar to what is inferred for Liller 1, Dalessandro et al., 2022) could still be accommodated, with no major impact on the model results. In future work we will make use of hydrodynamical simulations (Calura et al., 2019; Lacchin et al., 2021) to study in more detail the formation of the young stellar populations.
We start from a configuration that reproduces the chemical properties of the oldest stars of Terzan 5. Model T01s offers a good starting point (see previous section), but it leaves behind only M⊙ of stars (see Table 1, 20th row), which is too low compared to the current total mass of Terzan 5, namely, M⊙ (Lanzoni et al., 2010). Thus, we consider a four times more massive progenitor, M⊙, yielding a present-day mass M⊙444This value takes into account stripping of 80% of the long-lived stars with [Fe/H] , which allows a better fit to the observed MDF in the low-metallicity regime. for the sub-solar metallicity component, in excellent agreement with the empirical mass estimate of Lanzoni et al. (2010).
We thus explore three models, namely S01s, S02s, and S03s, that have the same star formation parameters but differ in the amount of gas losses/stellar stripping and in the possibility or not of preferentially retaining SNIa progenitors, as shown in Table 2.
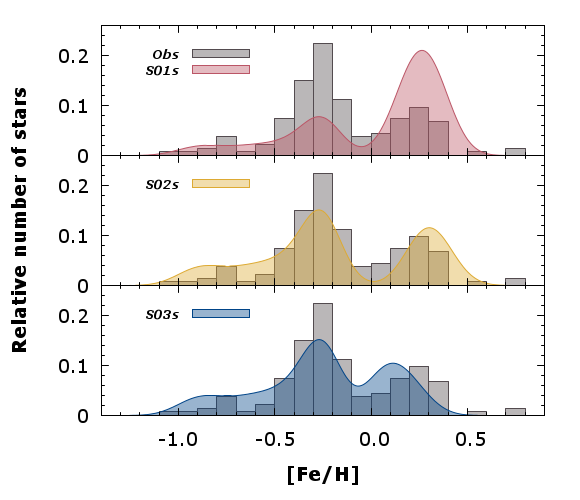
Model S01s (see Table 2 and the shaded red area in Fig. 6, upper panel) makes the young stars forming with the same efficiency of conversion of gas into stars as the old ones (50%), without any gas loss from the system. This results in the young population dominating the total mass budget, at variance with the empirical mass estimates.
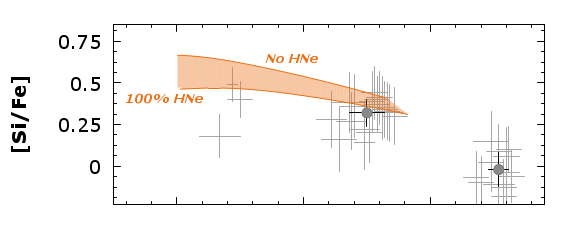
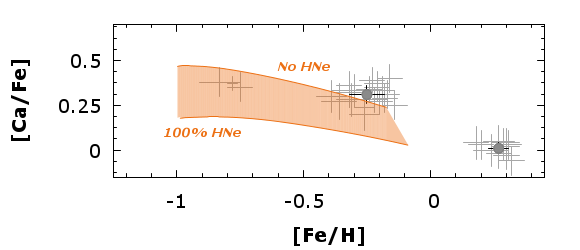
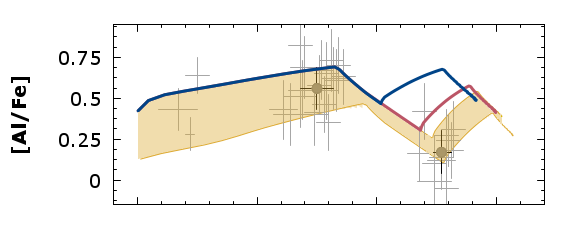
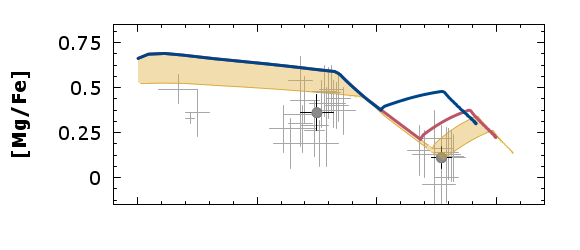
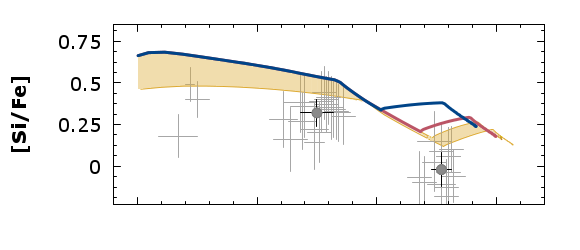
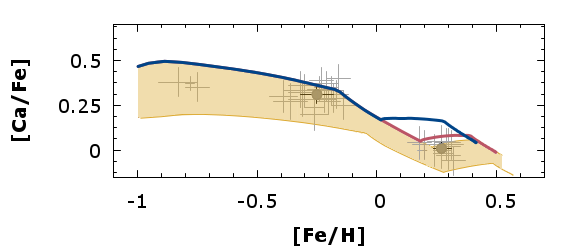
At odds with the previous one, model S02s allows gas losses (see Table 2). The removal of a major fraction of the gas leftover from the first star formation episode yields the right proportions of young to old stars, as shown in Table 2, last two columns (see also the yellow shaded area in Fig. 6, middle panel). It is worth emphasising that in model S02s, and in model S01s as well, the white dwarfs leading to SNIa explosions that form during the first star formation burst are not lost from the system, but settle in the central regions of the proto-cluster, so that the SNIa rate is boosted in the inner, star-forming regions. Therefore, the youngest stars that are generated in the center reflect the Fe-enriched composition of a medium polluted by all these SNeIa. This well reproduces the observed trends of [Al/Fe], [Mg/Fe], [Si/Fe], and [Ca/Fe] vs [Fe/H] of both the sub-solar and the metal-rich populations (see Fig. 7).
Model S03s assumes that most (80%) of the SNIa precursors are lost together with the low-mass, low-metallicity single stars (Table 2). Although the model predictions are still compatible with the observed MDF (blue shaded area in Fig. 6), they fail to reproduce the observed low [Al/Fe] and [/Fe] ratios of the metal-rich component (upper blue line in all panels of Fig. 7).
Hence, this analysis shows that gas loss and the retention of a major fraction of Fe produced by SNeIa are fundamental ingredients to reproduce both the MDF and the abundance ratios of the metal-rich population in Terzan 5. As a result, only model S02s succeeds in predicting all the observational constraints simultaneously (mass of the two main populations, MDF, and abundance ratios).
4 Discussion and conclusions
Terzan 5 is a complex stellar system located in the outskirts of the inner bulge and characterized by peculiar features that clearly distinguish it from a typical globular cluster. It harbours at least three sub-populations with distinct ages and chemical properties (Ferraro et al., 2016, and references therein) and the largest population of millisecond pulsars hitherto identified in the MW (Ransom et al., 2005; Cadelano et al., 2018; Martsen et al., 2022). All these characteristics are readily accounted for if Terzan 5 is the compact remnant of a more massive system that self-enriched before losing most of its initial mass.
Alternative scenarios have been proposed in the literature. The hypothesis of a dwarf galaxy progenitor can be rejected straight away, for several reasons. First, the orbit of Terzan 5 clearly points to an object formed in situ (Massari et al., 2015, 2019; Baumgardt et al., 2019; Callingham et al., 2022). Second, the location in the age-metallicity space of its main stellar population perfectly matches the trend followed by in-situ systems (at [Fe/H] , ex-situ objects are more than 2 Gyr younger; see, e.g., Massari et al. 2019; Kruijssen et al. 2019). Finally, it is important to keep in mind that the extreme metallicity regime observed for the two main sub-populations of Terzan 5 is characteristic of the MW bulge environment, while it is clearly incompatible with the iron abundance of any known dwarf galaxy in the local universe.
Matsui et al. (2019) investigated the formation and evolution of young massive clusters during major galaxy mergers. These authors find that several clusters distribute within a few kpc from the centre of the merger remnant (see their figure 4) and that the cluster mass function has an excess around 107 M⊙ (see their figure 6)555In this respect, it would be interesting to investigate in simulations if the accretion of the Heracles satellite (Horta et al., 2021) could have triggered the formation of massive clusters in the MW bulge as well.. Some of the clusters in Matsui et al.’s (2019) simulations have multi-aged populations, which originate from gas capture when the clusters pass through dense gas regions. However, the models of (Matsui et al., 2019) predict just a mild metallicity enhancement, certainly not able to reproduce the super-solar population of Terzan 5, likely due to the short time lapse between the main bursts and/or to the neglection of SNeIa. In fact, their second-generation stars are enriched by SNeII only, while the chemical patterns observed in Terzan 5 (Origlia et al., 2011) clearly demonstrate that the metal-rich component has been enriched by both Type II and Type Ia SNe.
The possibility that Terzan 5 has been originated by the collision between a GC and a giant molecular cloud of appropriate metallicity has been suggested by several authors (McKenzie & Bekki, 2018; Bastian & Pfeffer, 2022). As discussed by the authors themselves, such events are extremely rare, because they require very fine-tuned combinations of events. However, the increasing number of discovered objects similar to Terzan 5 (Ferraro et al., 2021) and the evidence in favor of prolonged star formation histories or more than two star formation bursts (Dalessandro et al. 2022; Crociati et al., in preparation) make these scenarios less likely.
Instead, it is possible that Terzan 5 is the relic of a gaseous clump that originated from the fragmentation of an early disc. Bulges of disc galaxies are known to take their shapes through varied (and not mutually exclusive) formation mechanisms, and the coalescence of sub-systems originating from the fragments of an early, unstable disc is one possibility (e.g., Elmegreen et al., 2008). Strong radiative stellar feedback can disperse even the most massive clumps after they turn 5–20% of their mass into stars in a time-scale of 10–100 Myr, but the stars might remain bound (Hopkins et al., 2012, see also Mandelker et al. 2017).
In this work we explored a set of chemical evolution models aimed at reproducing the mass, the metallicity distribution function (MDF), and the chemical abundance patterns measured so far in Terzan 5, under the assumption that it was the product of the self-enrichment process of one of those primordial gas clumps that could have contributed to the formation of the Galactic bulge at the epoch of the Milky Way bulge assembly. The model that best reproduces the observations is model S02s, which rests on a number of assumptions that will be explored in detail in future work focusing on the dynamical aspects. We summarize our current findings as follows.
-
•
Among the explored models, model S02s in Table 2 is the one that allows to reasonably account for all the observables, namely, mass, MDF and abundance ratios of both the old, metal-poor and the young, metal-rich sub-populations.
-
•
The relative weights of the metal-poor and metal-rich sub-populations of Terzan 5 (comprising about 62% and 38% of the current mass of the cluster, respectively) are explained by assuming that Terzan 5 formed via two major star formation episodes separated by a long period (7.5 Gyr) of quiescence or low-level star formation activity, in agreement with CMD analyses. It remains to be seen if delayed energy release from SNeIa allows to keep some gas warm, while still trapped in the potential well of the system, for later star formation.
-
•
The oldest stars (ages Gyr) are formed from a gas clump with a mass of a few M⊙. According to our simulations, if the gas clump has a slightly pre-enriched () chemical composition, a secondary, more metal-poor peak in the MDF is more easily produced.
-
•
After its formation, the proto-Terzan 5 should lose a large fraction (50%) of its metal-poor, low-mass stars (owing to mass segregation and tidal stripping) as well as most of the gas left over from the first star formation episode (owing to the combined effects of SN feedback, ram pressure and tidal stripping). In order to explain the chemical properties of the second generation stars, it is crucial to incorporate in the calculations a detailed treatment of the ejecta of the first stellar generations.
-
•
In particular, the white dwarfs formed during the first star formation burst should settle at the center of the cluster and escape stripping, so that the rate of SNIa explosions is enhanced and Fe production maximized there. This is a necessary condition to reproduce the high-metallicity peak of the MDF and the observed abundance ratios of the metal-rich sub-populations. If this were not the case, the recent star formation burst would tend to restore the abundance ratios to values more typical of massive star ejecta, in disagreement with the observations (see the blue lines in Fig. 7).
-
•
To produce the right proportion of young stars, we need to mix the ejecta of older stellar generations into a fraction of ambient gas. Our model can not discriminate if such gas is coming from cooling of warm gas surrounding the proto-cluster (see the second item above), or if it is collected through interactions with a giant molecular cloud. Hydrodynamical simulations (Pflamm-Altenburg & Kroupa, 2009; McKenzie & Bekki, 2018; Matsui et al., 2019) have shown that, in principle, the latter is a viable hypothesis (but see the above discussion). In future work, we will couple the passive evolution of the oldest stellar populations of Terzan 5 with gas accretion via bound cluster-cloud collisions to study self-consistently the rejuvenation of the cluster by means of high-resolution 3D hydrodynamical simulations (Calura et al., 2019; Lacchin et al., 2021).
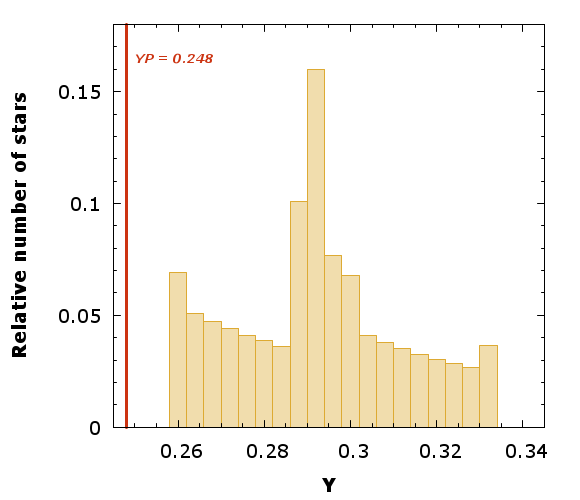
Finally, we use our most representative two-burst model to make a prediction on the expected He abundance distribution. Model S02s (see Sect. 3.4, Table 2, and Figs. 6–7) returns a wide He abundance distribution, ranging from for the oldest stars to for the youngest ones, with a main peak at and two local maxima at and (see Fig. 8). This model, like all the others discussed in this paper, starts from a primordial He abundance , consistent with the standard model primordial value and with the abundance measured in near-pristine intergalactic gas (see Cooke & Fumagalli, 2018, and references therein). Note that normally stellar isochrones, as those used by Ferraro et al. (2016) or by Bensby et al. (2013) in studying the populations of, respectively, giants and microlensed dwarfs/subgiant bulge stars, adopt a primordial value of . Isochrone fitting of the double turn-off in Terzan 5 (Ferraro et al., 2016) returns an old age of 12 Gyr, adopting a helium mass fraction , for the dominant, metal-poor component, and an intermediate age of 4.5 Gyr, adopting , for the centrally-concentrated, super-solar metallicity component.
If Terzan 5 is helium-enhanced, as we predict, it will require the development of ad hoc isochrones and stellar model atmospheres. Moreover, a self-consistent evaluation of the proto-Terzan 5 chemical enrichment would require the use of stellar yields computed specifically for He-enhanced stars. Unfortunately, the advanced evolution, chemical yields, and final fates of He-rich stars have been explored only in limited ranges of initial stellar mass and metallicity so far (Shingles et al., 2015; Althaus et al., 2017).
Another potential problem affecting the yields and, thus, the chemical evolution model predictions, is the neglect of the effects of binary interactions among massive stars, which may be particularly relevant in the high-density environment of the proto-Terzan 5. Investigations of the effects of stellar multiplicity on massive star yields are still very limited, but promising studies are ongoing (Farmer et al., 2021, 2023).
References
- Althaus et al. (2017) Althaus, L. G., De Gerónimo, F., Córsico, A., Torres, S., & García-Berro, E. 2017, A&A, 597, A67, doi: 10.1051/0004-6361/201629909
- Athanassoula (2005) Athanassoula, E. 2005, in American Institute of Physics Conference Series, Vol. 804, Planetary Nebulae as Astronomical Tools, ed. R. Szczerba, G. Stasińska, & S. K. Gorny, 333–340, doi: 10.1063/1.2146306
- Athanassoula et al. (2017) Athanassoula, E., Rodionov, S. A., & Prantzos, N. 2017, MNRAS, 467, L46, doi: 10.1093/mnrasl/slw255
- Baade (1946) Baade, W. 1946, PASP, 58, 249, doi: 10.1086/125835
- Babusiaux (2016) Babusiaux, C. 2016, PASA, 33, e026, doi: 10.1017/pasa.2016.1
- Barbuy et al. (2018) Barbuy, B., Chiappini, C., & Gerhard, O. 2018, ARA&A, 56, 223, doi: 10.1146/annurev-astro-081817-051826
- Bastian & Pfeffer (2022) Bastian, N., & Pfeffer, J. 2022, MNRAS, 509, 614, doi: 10.1093/mnras/stab3081
- Baumgardt et al. (2019) Baumgardt, H., Hilker, M., Sollima, A., & Bellini, A. 2019, MNRAS, 482, 5138, doi: 10.1093/mnras/sty2997
- Baumgardt et al. (2008) Baumgardt, H., Kroupa, P., & Parmentier, G. 2008, MNRAS, 384, 1231, doi: 10.1111/j.1365-2966.2007.12811.x
- Baumgardt & Makino (2003) Baumgardt, H., & Makino, J. 2003, MNRAS, 340, 227, doi: 10.1046/j.1365-8711.2003.06286.x
- Bekki & Freeman (2003) Bekki, K., & Freeman, K. C. 2003, MNRAS, 346, L11, doi: 10.1046/j.1365-2966.2003.07275.x
- Bensby et al. (2011) Bensby, T., Adén, D., Meléndez, J., et al. 2011, A&A, 533, A134, doi: 10.1051/0004-6361/201117059
- Bensby et al. (2013) Bensby, T., Yee, J. C., Feltzing, S., et al. 2013, A&A, 549, A147, doi: 10.1051/0004-6361/201220678
- Bensby et al. (2017) Bensby, T., Feltzing, S., Gould, A., et al. 2017, A&A, 605, A89, doi: 10.1051/0004-6361/201730560
- Bica et al. (2016) Bica, E., Ortolani, S., & Barbuy, B. 2016, PASA, 33, e028, doi: 10.1017/pasa.2015.47
- Bournaud et al. (2008) Bournaud, F., Daddi, E., Elmegreen, B. G., et al. 2008, A&A, 486, 741, doi: 10.1051/0004-6361:20079250
- Cadelano et al. (2018) Cadelano, M., Ransom, S. M., Freire, P. C. C., et al. 2018, ApJ, 855, 125, doi: 10.3847/1538-4357/aaac2a
- Callingham et al. (2022) Callingham, T. M., Cautun, M., Deason, A. J., et al. 2022, MNRAS, 513, 4107, doi: 10.1093/mnras/stac1145
- Calura et al. (2019) Calura, F., D’Ercole, A., Vesperini, E., Vanzella, E., & Sollima, A. 2019, MNRAS, 489, 3269, doi: 10.1093/mnras/stz2055
- Catchpole et al. (2016) Catchpole, R. M., Whitelock, P. A., Feast, M. W., et al. 2016, MNRAS, 455, 2216, doi: 10.1093/mnras/stv2372
- Clarkson et al. (2008) Clarkson, W., Sahu, K., Anderson, J., et al. 2008, ApJ, 684, 1110, doi: 10.1086/590378
- Combes et al. (1990) Combes, F., Debbasch, F., Friedli, D., & Pfenniger, D. 1990, A&A, 233, 82
- Cooke & Fumagalli (2018) Cooke, R. J., & Fumagalli, M. 2018, Nature Astronomy, 2, 957, doi: 10.1038/s41550-018-0584-z
- Crociati et al. (2023) Crociati, C., Valenti, E., Ferraro, F. R., et al. 2023, ApJ, in press
- Dalessandro et al. (2022) Dalessandro, E., Crociati, C., Cignoni, M., et al. 2022, ApJ, 940, 170, doi: 10.3847/1538-4357/ac9907
- D’Antona et al. (2010) D’Antona, F., Ventura, P., Caloi, V., et al. 2010, ApJ, 715, L63, doi: 10.1088/2041-8205/715/2/L63
- Doherty et al. (2014a) Doherty, C. L., Gil-Pons, P., Lau, H. H. B., Lattanzio, J. C., & Siess, L. 2014a, MNRAS, 437, 195, doi: 10.1093/mnras/stt1877
- Doherty et al. (2014b) Doherty, C. L., Gil-Pons, P., Lau, H. H. B., et al. 2014b, MNRAS, 441, 582, doi: 10.1093/mnras/stu571
- Eggen et al. (1962) Eggen, O. J., Lynden-Bell, D., & Sandage, A. R. 1962, ApJ, 136, 748, doi: 10.1086/147433
- Elmegreen et al. (2008) Elmegreen, B. G., Bournaud, F., & Elmegreen, D. M. 2008, ApJ, 688, 67, doi: 10.1086/592190
- Farmer et al. (2021) Farmer, R., Laplace, E., de Mink, S. E., & Justham, S. 2021, ApJ, 923, 214, doi: 10.3847/1538-4357/ac2f44
- Farmer et al. (2023) Farmer, R., Laplace, E., Ma, J.-z., de Mink, S. E., & Justham, S. 2023, arXiv e-prints, arXiv:2303.04520, doi: 10.48550/arXiv.2303.04520
- Ferraro et al. (2016) Ferraro, F. R., Massari, D., Dalessandro, E., et al. 2016, ApJ, 828, 75, doi: 10.3847/0004-637X/828/2/75
- Ferraro et al. (2009) Ferraro, F. R., Dalessandro, E., Mucciarelli, A., et al. 2009, Nature, 462, 483, doi: 10.1038/nature08581
- Ferraro et al. (2021) Ferraro, F. R., Pallanca, C., Lanzoni, B., et al. 2021, Nature Astronomy, 5, 311, doi: 10.1038/s41550-020-01267-y
- Gonzalez et al. (2012) Gonzalez, O. A., Rejkuba, M., Zoccali, M., et al. 2012, A&A, 543, A13, doi: 10.1051/0004-6361/201219222
- Gonzalez et al. (2015) Gonzalez, O. A., Zoccali, M., Vasquez, S., et al. 2015, A&A, 584, A46, doi: 10.1051/0004-6361/201526737
- Gratton et al. (2019) Gratton, R., Bragaglia, A., Carretta, E., et al. 2019, A&A Rev., 27, 8, doi: 10.1007/s00159-019-0119-3
- Greener et al. (2021) Greener, M. J., Merrifield, M., Aragón-Salamanca, A., et al. 2021, MNRAS, 502, L95, doi: 10.1093/mnrasl/slab012
- Hasselquist et al. (2020) Hasselquist, S., Zasowski, G., Feuillet, D. K., et al. 2020, ApJ, 901, 109, doi: 10.3847/1538-4357/abaeee
- Haywood et al. (2016) Haywood, M., Di Matteo, P., Snaith, O., & Calamida, A. 2016, A&A, 593, A82, doi: 10.1051/0004-6361/201628816
- Hill et al. (2011) Hill, V., Lecureur, A., Gómez, A., et al. 2011, A&A, 534, A80, doi: 10.1051/0004-6361/200913757
- Hopkins et al. (2012) Hopkins, P. F., Kereš, D., Murray, N., Quataert, E., & Hernquist, L. 2012, MNRAS, 427, 968, doi: 10.1111/j.1365-2966.2012.21981.x
- Horta et al. (2021) Horta, D., Schiavon, R. P., Mackereth, J. T., et al. 2021, MNRAS, 500, 1385, doi: 10.1093/mnras/staa2987
- Howes et al. (2015) Howes, L. M., Casey, A. R., Asplund, M., et al. 2015, Nature, 527, 484, doi: 10.1038/nature15747
- Immeli et al. (2004) Immeli, A., Samland, M., Gerhard, O., & Westera, P. 2004, A&A, 413, 547, doi: 10.1051/0004-6361:20034282
- Iwamoto et al. (1999) Iwamoto, K., Brachwitz, F., Nomoto, K., et al. 1999, ApJS, 125, 439, doi: 10.1086/313278
- Karakas (2010) Karakas, A. I. 2010, MNRAS, 403, 1413, doi: 10.1111/j.1365-2966.2009.16198.x
- Kennicutt (1998) Kennicutt, Robert C., J. 1998, ApJ, 498, 541, doi: 10.1086/305588
- Kormendy & Kennicutt (2004) Kormendy, J., & Kennicutt, Robert C., J. 2004, ARA&A, 42, 603, doi: 10.1146/annurev.astro.42.053102.134024
- Kroupa (2001) Kroupa, P. 2001, MNRAS, 322, 231, doi: 10.1046/j.1365-8711.2001.04022.x
- Kruijssen et al. (2019) Kruijssen, J. M. D., Pfeffer, J. L., Reina-Campos, M., Crain, R. A., & Bastian, N. 2019, MNRAS, 486, 3180, doi: 10.1093/mnras/sty1609
- Lacchin et al. (2021) Lacchin, E., Calura, F., & Vesperini, E. 2021, MNRAS, 506, 5951, doi: 10.1093/mnras/stab2061
- Lanzoni et al. (2010) Lanzoni, B., Ferraro, F. R., Dalessandro, E., et al. 2010, ApJ, 717, 653, doi: 10.1088/0004-637X/717/2/653
- Magg et al. (2022) Magg, E., Bergemann, M., Serenelli, A., et al. 2022, A&A, 661, A140, doi: 10.1051/0004-6361/202142971
- Mandelker et al. (2017) Mandelker, N., Dekel, A., Ceverino, D., et al. 2017, MNRAS, 464, 635, doi: 10.1093/mnras/stw2358
- Martinelli & Matteucci (2000) Martinelli, A., & Matteucci, F. 2000, A&A, 353, 269, doi: 10.48550/arXiv.astro-ph/9907008
- Martsen et al. (2022) Martsen, A. R., Ransom, S. M., DeCesar, M. E., et al. 2022, ApJ, 941, 22, doi: 10.3847/1538-4357/aca156
- Massari et al. (2019) Massari, D., Koppelman, H. H., & Helmi, A. 2019, A&A, 630, L4, doi: 10.1051/0004-6361/201936135
- Massari et al. (2014) Massari, D., Mucciarelli, A., Ferraro, F. R., et al. 2014, ApJ, 795, 22, doi: 10.1088/0004-637X/795/1/22
- Massari et al. (2015) Massari, D., Dalessandro, E., Ferraro, F. R., et al. 2015, ApJ, 810, 69, doi: 10.1088/0004-637X/810/1/69
- Matsui et al. (2019) Matsui, H., Tanikawa, A., & Saitoh, T. R. 2019, PASJ, 71, 19, doi: 10.1093/pasj/psy139
- Matteucci (2012) Matteucci, F. 2012, Chemical Evolution of Galaxies, doi: 10.1007/978-3-642-22491-1
- Matteucci (2021) —. 2021, A&A Rev., 29, 5, doi: 10.1007/s00159-021-00133-8
- Matteucci & Recchi (2001) Matteucci, F., & Recchi, S. 2001, ApJ, 558, 351, doi: 10.1086/322472
- McKenzie & Bekki (2018) McKenzie, M., & Bekki, K. 2018, MNRAS, 479, 3126, doi: 10.1093/mnras/sty1557
- Minniti et al. (2018) Minniti, D., Fernández-Trincado, J. G., Ripepi, V., et al. 2018, ApJ, 869, L10, doi: 10.3847/2041-8213/aaf1cd
- Nataf & Gould (2012) Nataf, D. M., & Gould, A. P. 2012, ApJ, 751, L39, doi: 10.1088/2041-8205/751/2/L39
- Nieuwmunster et al. (2023) Nieuwmunster, N., Nandakumar, G., Spitoni, E., et al. 2023, arXiv e-prints, arXiv:2301.10271, doi: 10.48550/arXiv.2301.10271
- Nogueras-Lara et al. (2021) Nogueras-Lara, F., Schödel, R., & Neumayer, N. 2021, A&A, 653, A133, doi: 10.1051/0004-6361/202140996
- Nomoto et al. (2013) Nomoto, K., Kobayashi, C., & Tominaga, N. 2013, ARA&A, 51, 457, doi: 10.1146/annurev-astro-082812-140956
- Origlia et al. (2013) Origlia, L., Massari, D., Rich, R. M., et al. 2013, ApJ, 779, L5, doi: 10.1088/2041-8205/779/1/L5
- Origlia et al. (2011) Origlia, L., Rich, R. M., Ferraro, F. R., et al. 2011, ApJ, 726, L20, doi: 10.1088/2041-8205/726/2/L20
- Origlia et al. (2019) Origlia, L., Mucciarelli, A., Fiorentino, G., et al. 2019, ApJ, 871, 114, doi: 10.3847/1538-4357/aaf730
- Ortolani et al. (1995) Ortolani, S., Renzini, A., Gilmozzi, R., et al. 1995, Nature, 377, 701, doi: 10.1038/377701a0
- Pagel & Patchett (1975) Pagel, B. E. J., & Patchett, B. E. 1975, MNRAS, 172, 13, doi: 10.1093/mnras/172.1.13
- Pflamm-Altenburg & Kroupa (2009) Pflamm-Altenburg, J., & Kroupa, P. 2009, MNRAS, 397, 488, doi: 10.1111/j.1365-2966.2009.14954.x
- Portegies Zwart et al. (2002) Portegies Zwart, S. F., Makino, J., McMillan, S. L. W., & Hut, P. 2002, ApJ, 565, 265, doi: 10.1086/324141
- Queiroz et al. (2021) Queiroz, A. B. A., Chiappini, C., Perez-Villegas, A., et al. 2021, A&A, 656, A156, doi: 10.1051/0004-6361/202039030
- Ransom et al. (2005) Ransom, S. M., Hessels, J. W. T., Stairs, I. H., et al. 2005, Science, 307, 892, doi: 10.1126/science.1108632
- Renzini et al. (2018) Renzini, A., Gennaro, M., Zoccali, M., et al. 2018, ApJ, 863, 16, doi: 10.3847/1538-4357/aad09b
- Rich et al. (2020) Rich, R. M., Johnson, C. I., Young, M., et al. 2020, MNRAS, 499, 2340, doi: 10.1093/mnras/staa2426
- Rojas-Arriagada et al. (2019) Rojas-Arriagada, A., Zoccali, M., Schultheis, M., et al. 2019, A&A, 626, A16, doi: 10.1051/0004-6361/201834126
- Rojas-Arriagada et al. (2014) Rojas-Arriagada, A., Recio-Blanco, A., Hill, V., et al. 2014, A&A, 569, A103, doi: 10.1051/0004-6361/201424121
- Rojas-Arriagada et al. (2020) Rojas-Arriagada, A., Zasowski, G., Schultheis, M., et al. 2020, MNRAS, 499, 1037, doi: 10.1093/mnras/staa2807
- Romano et al. (2015) Romano, D., Bellazzini, M., Starkenburg, E., & Leaman, R. 2015, MNRAS, 446, 4220, doi: 10.1093/mnras/stu2427
- Romano et al. (2010) Romano, D., Karakas, A. I., Tosi, M., & Matteucci, F. 2010, A&A, 522, A32, doi: 10.1051/0004-6361/201014483
- Romano et al. (2007) Romano, D., Matteucci, F., Tosi, M., et al. 2007, MNRAS, 376, 405, doi: 10.1111/j.1365-2966.2007.11446.x
- Romano et al. (2019) Romano, D., Matteucci, F., Zhang, Z.-Y., Ivison, R. J., & Ventura, P. 2019, MNRAS, 490, 2838, doi: 10.1093/mnras/stz2741
- Romano et al. (2017) Romano, D., Matteucci, F., Zhang, Z. Y., Papadopoulos, P. P., & Ivison, R. J. 2017, MNRAS, 470, 401, doi: 10.1093/mnras/stx1197
- Romano & Starkenburg (2013) Romano, D., & Starkenburg, E. 2013, MNRAS, 434, 471, doi: 10.1093/mnras/stt1033
- Saha et al. (2019) Saha, A., Vivas, A. K., Olszewski, E. W., et al. 2019, ApJ, 874, 30, doi: 10.3847/1538-4357/ab07ba
- Sánchez Almeida et al. (2014) Sánchez Almeida, J., Elmegreen, B. G., Muñoz-Tuñón, C., & Elmegreen, D. M. 2014, A&A Rev., 22, 71, doi: 10.1007/s00159-014-0071-1
- Saracino et al. (2019) Saracino, S., Dalessandro, E., Ferraro, F. R., et al. 2019, ApJ, 874, 86, doi: 10.3847/1538-4357/ab07c4
- Schmidt (1959) Schmidt, M. 1959, ApJ, 129, 243, doi: 10.1086/146614
- Schultheis et al. (2017) Schultheis, M., Rojas-Arriagada, A., García Pérez, A. E., et al. 2017, A&A, 600, A14, doi: 10.1051/0004-6361/201630154
- Shara & Hurley (2002) Shara, M. M., & Hurley, J. R. 2002, ApJ, 571, 830, doi: 10.1086/340062
- Shara & Hurley (2006) —. 2006, ApJ, 646, 464, doi: 10.1086/504679
- Shingles et al. (2015) Shingles, L. J., Doherty, C. L., Karakas, A. I., et al. 2015, MNRAS, 452, 2804, doi: 10.1093/mnras/stv1489
- Springel & Hernquist (2005) Springel, V., & Hernquist, L. 2005, ApJ, 622, L9, doi: 10.1086/429486
- Surot et al. (2019) Surot, F., Valenti, E., Hidalgo, S. L., et al. 2019, A&A, 623, A168, doi: 10.1051/0004-6361/201833550
- Tinsley (1980) Tinsley, B. M. 1980, Fund. Cosmic Phys., 5, 287, doi: 10.48550/arXiv.2203.02041
- Valenti et al. (2013) Valenti, E., Zoccali, M., Renzini, A., et al. 2013, A&A, 559, A98, doi: 10.1051/0004-6361/201321962
- van den Bergh (1962) van den Bergh, S. 1962, AJ, 67, 486, doi: 10.1086/108757
- Vesperini & Heggie (1997) Vesperini, E., & Heggie, D. C. 1997, MNRAS, 289, 898, doi: 10.1093/mnras/289.4.898
- Zoccali et al. (2003) Zoccali, M., Renzini, A., Ortolani, S., et al. 2003, A&A, 399, 931, doi: 10.1051/0004-6361:20021604
- Zoccali et al. (2017) Zoccali, M., Vasquez, S., Gonzalez, O. A., et al. 2017, A&A, 599, A12, doi: 10.1051/0004-6361/201629805