WISP Searches on a Fiber Interferometer under a Strong Magnetic Field
Abstract
A novel table-top experiment is introduced to detect photon-axion conversion: WISP Searches on a Fiber Interferometer (WISPFI). The setup consists of a Mach-Zehnder-type interferometer with a fiber placed inside an external magnetic field (), where mixing occurs and is detected by measuring changes in phase/amplitude. We will use hollow-core photonic crystal fibers (HC-PCF) to achieve resonant mixing that is tuneable by regulating the gas pressure in the fiber. An unexplored axion mass-range () can be probed reaching the two-photon coupling expected for the QCD axion.
I Introduction
Axions are weakly-interacting pseudoscalar particles introduced to solve the strong CP problem in quantum chromodynamics (QCD) which have been identified to be a candidate for Cold Dark Matter (CDM) [1, 2, 3, 4]. The QCD axion with mass inherits a non-vanishing two-photon coupling-strength that is model dependent. This two-photon coupling provides a rich phenomenology that can be explored both experimentally as well as observationally. While cosmological and astrophysical searches are sensitive to a wide range of the axion parameter space, laboratory experiments searching for axions as CDM (so-called haloscopes) have achieved so far the best sensitivity and start to rule-out the benchmark QCD axion models for a narrow mass-range from [5]. However, these results depend upon the local density of CDM, which is poorly constrained and could be substantially smaller than the average at similar galactocentric distances [6]. On the other hand, laboratory experiments that do not rely on axions to form CDM (e.g. light-shining-through-wall [4]) are less sensitive and none of the existing (and projected) experiments achieve sufficient sensitivity to probe the QCD axion (for an overview see e.g. [7]).
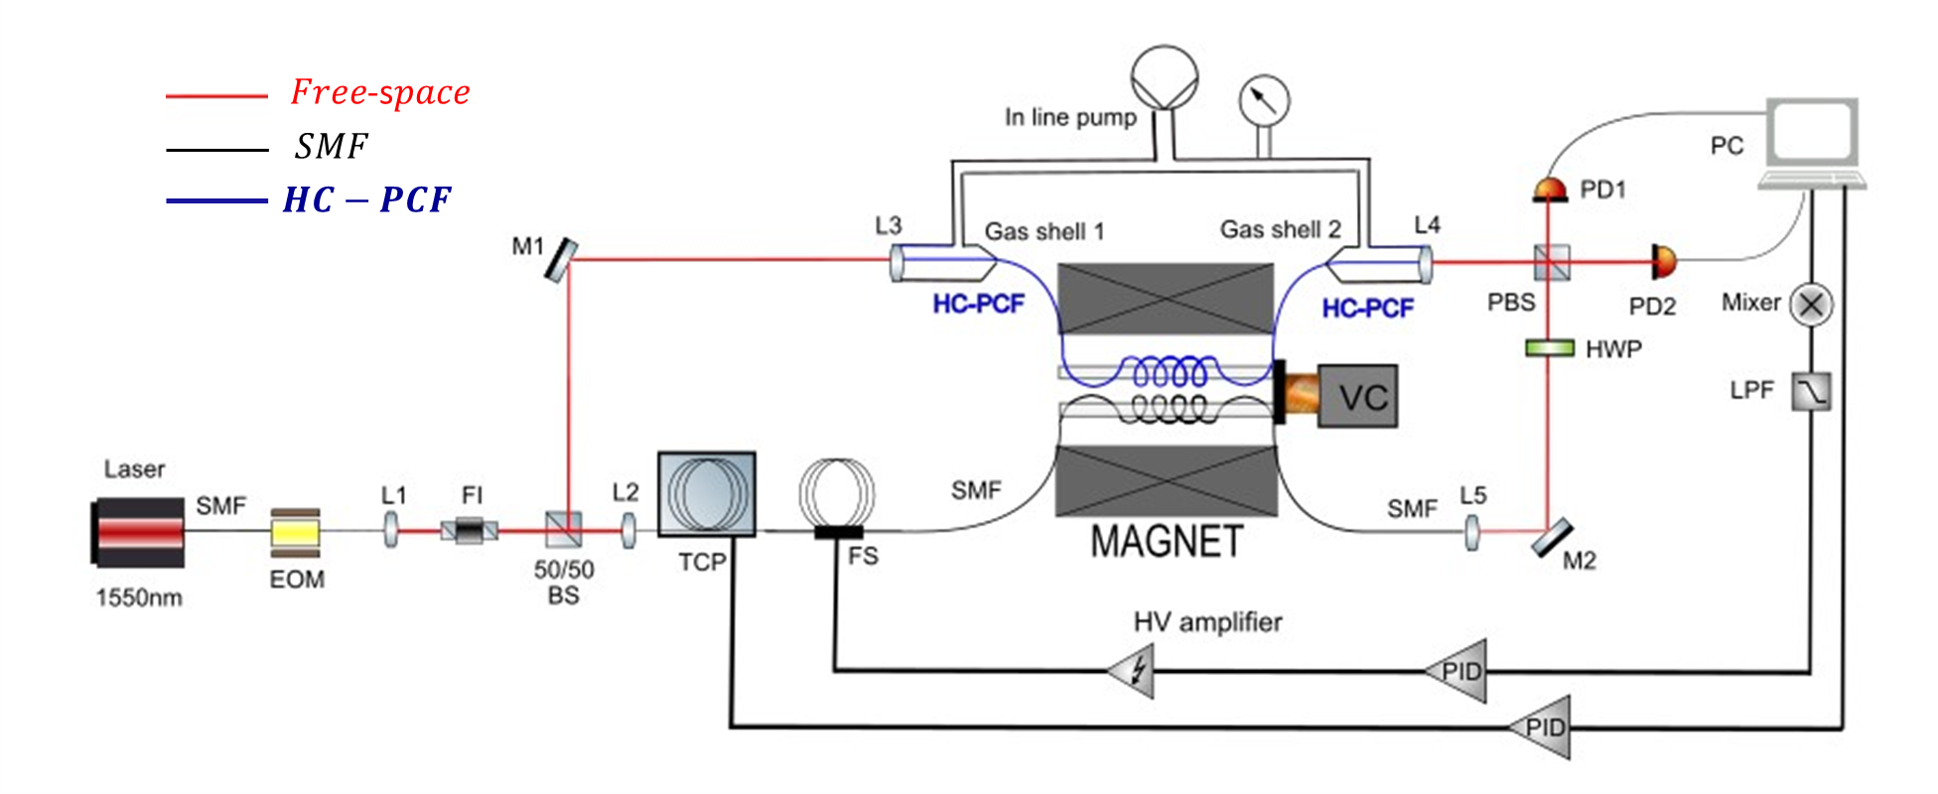
In this paper, we introduce a new experimental setup called WISPFI (WISP searches on a Fiber Interferometer) that focuses on photon-axion conversion in a waveguide by measuring photon reduction in the presence of a strong external magnetic field [8]. In this novel approach, light guiding over long distances can be achieved together with resonant detection at a spatially-confined region inside the bore of a strong magnet. The basic idea of WISPFI is to use a Mach-Zehnder type interferometer (MZI) where a laser beam is split into two arms with one arm used as a reference and the other arm placed inside a strong magnetic field which induces a photon-to-axion conversion (see Fig. 1, further details are given in a later section). Then, a phase shift and amplitude reduction can be measured in the presence of a non-vanishing photon-axion coupling . The measurable effect of axion-photon mixing relies on the Primakoff effect. The resulting conversion probability [9] , where is the axion-photon coupling coefficient, is the product of the transversal magnetic field and the length that the photon beam passes through the external magnetic field. As a comparison, in light-shining-through-wall experiments, the signal rate depends on the product of photon-to-axion and axion-to-photon conversion probabilities which therefore scales .
II Photon-axion mixing in hollow-core photonic crystal fibers (HC-PCF)
The photon-to-axion conversion probability assuming a mode propagating in the z-direction [9] is:
| (1) |
where is the oscillation wave-number. The first term in Eq. 1 accounts for the amplitude of the oscillations while the second term accounts for the oscillations. The mixing angle is deduced from the diagonalisation of the mixing matrix with the off-diagonal term in Eq. 9 in the appendix:
| (2) |
where is the photon-axion transfer momenta, given in terms of the photon with energy , , and axion wave-momenta, , propagating in the core-media of the fiber. In the following, we will focus on the conversion at or close to the resonant condition such that , where the resulting probability is energy-independent and the oscillation wave-number simplifies to . Under the assumption of , Eq. 1 can be simplified and evaluated for typical values for the magnetic field and length of the fiber:
| (3) |
II.1 Resonant conversion
The resonant condition is achieved with either for large energy or equal momenta for the photon and axion: . At resonance, the mixing angle from Eq. 2 is which maximizes the amplitude term in Eq. 1. The resonant conversion occurs in a medium with effective refractive index for an axion mass given by:
| (4) |
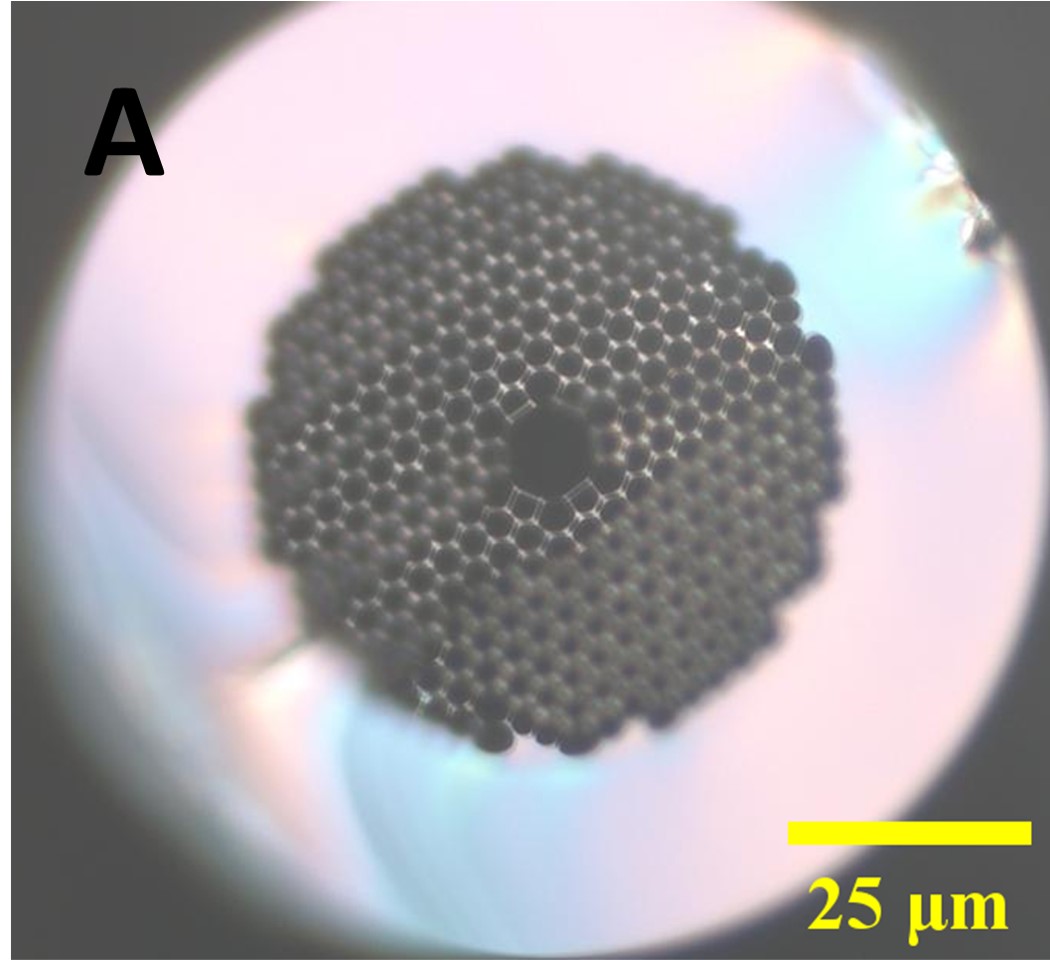
This condition can not be fulfilled for wave-guides based on dielectric materials. However, the resonance condition can be fulfilled by using a hollow-core photonic crystal fiber (HC-PCF) [10, 11], which is a particular type of optical fiber with exceptional applications in detection and sensing [12]. The light is guided through a low-refractive index hollow core, which can be filled either with gases or fluids. The core is surrounded by a hexagonal periodic arrangement of holes in the cladding, generating the photonic bandgap structure of the material. See Fig. 4A for a microscopic view of the cross-section of a commercially available HC-PCF. Additionally, HC-PCFs have a higher damage threshold for the guided laser power compared to standard step-index fibers [13]. By exploiting the bandgap structure of HC-PCF, the propagating mode can acquire a refractive index below 1 (see also further below) which based on Eq. 4 leads to real axion masses at resonant mixing.
II.2 Effective mode index of HC-PCF
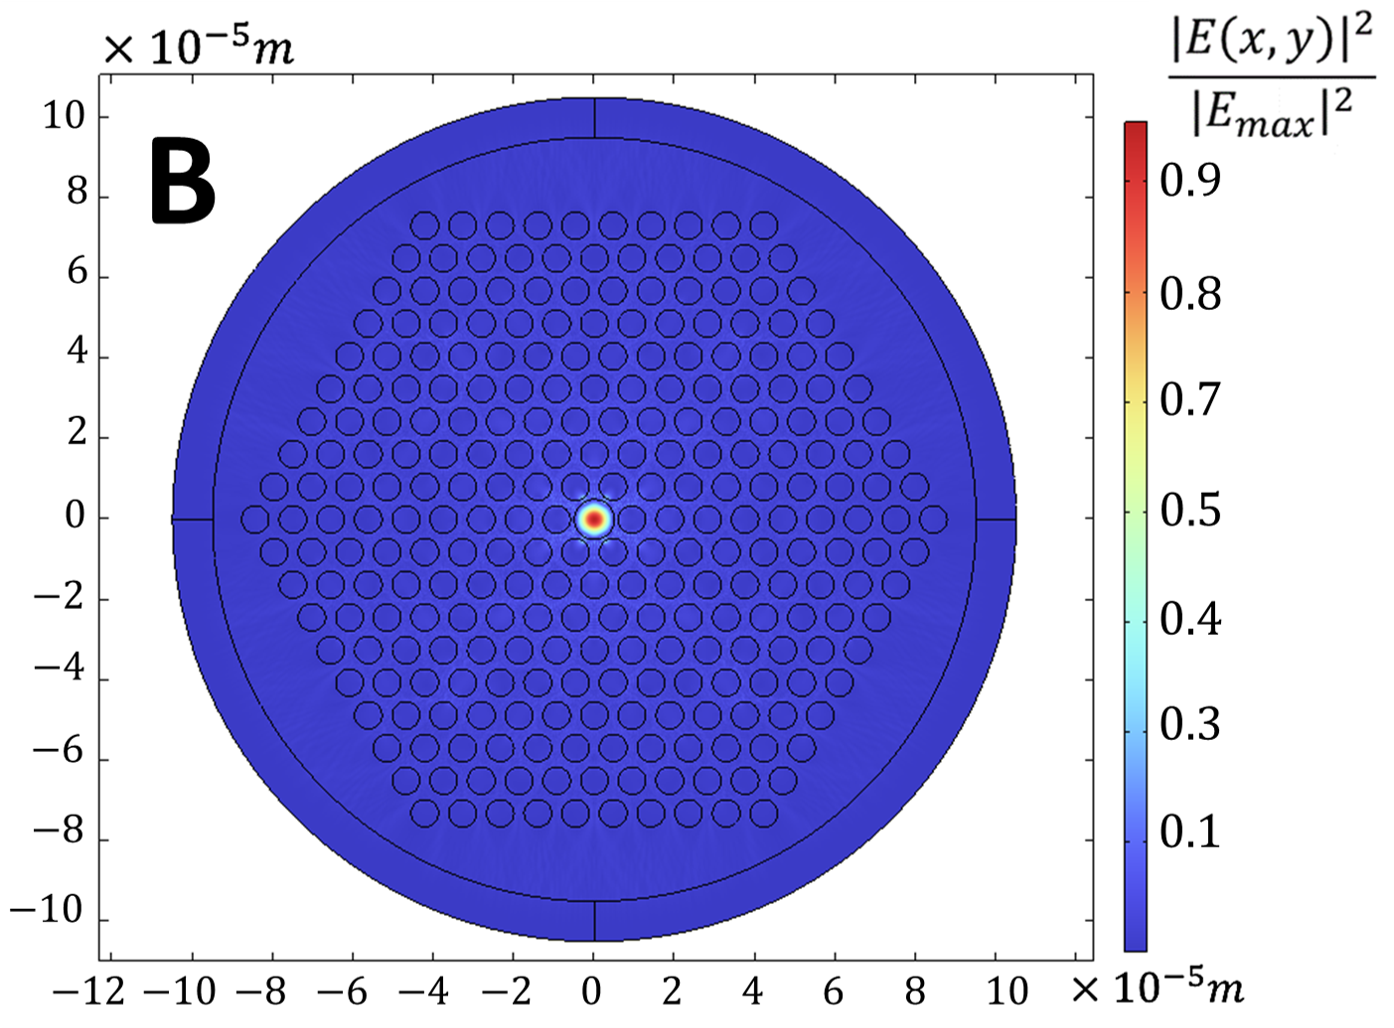
From Eq. 4 we can observe that the axion mass in resonance depends on the refractive index of the propagating mode. Here, we investigated the effective mode index for a HC-PCF configuration (see also Fig. 4B in the Appendix) by solving the Maxwell equations with the finite-element method (FEM).
The effective mode index of the ground mode in a HC-PCF depends on parameters such as the core radius , pressure , wavelength , and bending radius of the fiber. In turn, the resonant conversion is limited to an axion mass close to the value given in Eq. 4. We consider the difference and consequently for
| (5) |
for .
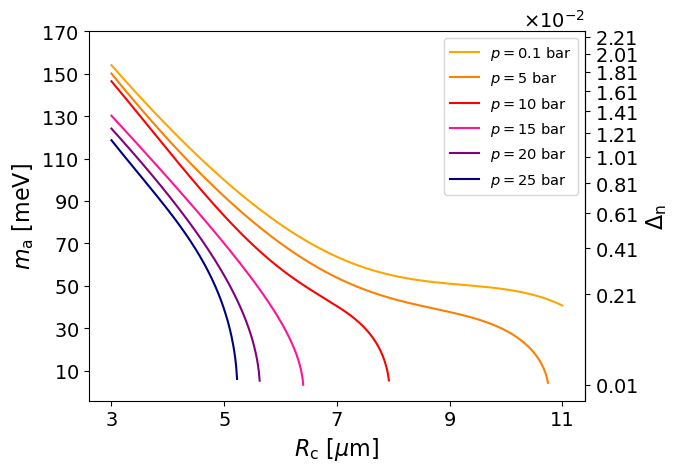
The resulting FEM simulations for a varying core radius and pressure are shown in Fig. 2. The probed axion masses for resonant conversion based on different core radii and different pressures of air that fill the hollow core of the fiber vary between . The observed increase of the effective mode index with increasing core radius or pressure matches the analytical approximation (see in the appendix).
III Overview of the experimental setup
The general setup for the WISPFI experiment is based on a partial free-space MZI with the sensing arms implemented by wave-guides that can be easily integrated in the confined space of the magnetic bore. The two beam-splitters (BS) are implemented in the free-space part of the interferometer. This way, we achieve the necessary control to match and balance the interferometer arms by using a BS and a polarized beam-splitter (PBS) together with a half-wave plate (HWP). The interferometric detection principle has been introduced by [8] for a Michelson-type interferometer. The axion-photon oscillation leads to a relative amplitude loss and phase-shift of the sensing arm embedded in the magnetic field with respect to the reference arm of the interferometer. In the setup shown in Fig. 1, the sensing arm is a HC-PCF where the photon-axion conversion takes place in resonant conditions while the reference arm is a step-index fiber (SMF) where conversion is strongly suppressed. Both arms are mounted on a voice-coil (VC) actuator which is used to shift the position of the fiber coils in the inhomogeneous magnetic field in the bore. In this way, the conversion probability and therefore the recorded signal is modulated with the frequency () that is used to drive the VC. Since both arms are mounted in the same way, the mechanical strain on the fibers is similar leading to phase-coherent noise between the two arms. The HC-PCF can be optionally pressurized in order to change the mass range for resonant conversion as demonstrated in the previous Section. The control of the conditions of the medium inside of the HC-PCF is one of the major advantages of this type of wave-guide and has been demonstrated in several experimental setups [14, 15]. The working point of the interferometer is locked via a PID-driven fiber stretcher (FS) to compensate for perturbations up to frequencies of a few kHz. The temperature difference between the two fibers results in a slow drift of the working point. This is compensated by a PID-regulated temperature control pad (TCP) (see e.g. [16]). Both, the FS and TCP provide a stable lock of the interferometer over extended periods of time as has been demonstrated in a prototype setup [17].
IV Sensitivity analysis
The sensitivity of the WISPFI setup as introduced in the preceding section is estimated under the following assumptions: (i) The MZI is operated at a dark fringe, (ii) the instrumental noise is dominated by the dark current of the photo-detector (PD), (iii) there are no additional losses included. The signal-to-noise ratio (SNR) is then given by the ratio of the power received in the dark port for a conversion probability in resonance (see Eq. 3) and the noise induced by the dark current. For an uncooled InGaAs photodiode, the noise-equivalent power (NEP) amounts to approximately . The currently foreseen VC will modulate the signal at a frequency of , limited by the range of motion and the expected mass of the fiber coils. Alternatively, with a tuneable laser, the wavelength can be modulated, such that the resulting modulation amplitude can reach up to . For a commercial laser with and , a fiber length of and an operation time of , the resulting sensitivity on is given by:
| (6) | ||||
It is noted that since the HC-PCF is winded on a coil and does not maintain a fixed polarization direction, we have assumed a random polarization for the propagation of the light along the fiber. This adds a coefficient of 1/2 on the resulting axion-photon conversion probability. Additionally, for the calculation of the effective mode index, a temperature of and a pressure of is assumed to be applied on the -long HC-PCF.
The mass for resonant conversion in the HC-PCF (see Eq. 4) is mainly determined by the core radius (see Eq. 14). The production process of a HC-PCF leads to random variations of the core radius along the fiber. Since the fiber is drawn from a heated mandrel, initial variations are stretched such that the largest variations of core radii occur on the longest length scale of the resulting fiber. The resulting variations resemble a or red noise behaviour with a cut-off at a length scale of . In order to characterize the impact of the random variations introduced at the time of drawing the fiber, we assume a mean value for of with , , and . The resulting sensitivity is then determined from a simulation of a large number of fiber realizations. In each case, the resulting conversion probability is calculated using the transfer-matrix approach (see [18, 19]). This way, we can calculate for each realization the range of resonant mass and coupling that can be probed. In Fig. 3A, the 15, 50, and 85 percentile are shown in different colors. With the projected sensitivity, for and 50 percentile, the WISPFI experiment will probe the coupling for the QCD axion in the KSVZ scenario within 6 months. The probed axion mass range can be varied between by changing the gas pressure inside the core of the fiber between (see also Fig. 6). In the case of a wider variation of core radii in the fiber considered in Fig. 3A, the axion mass range will extend without additional tuning, however, with decreased sensitivity.
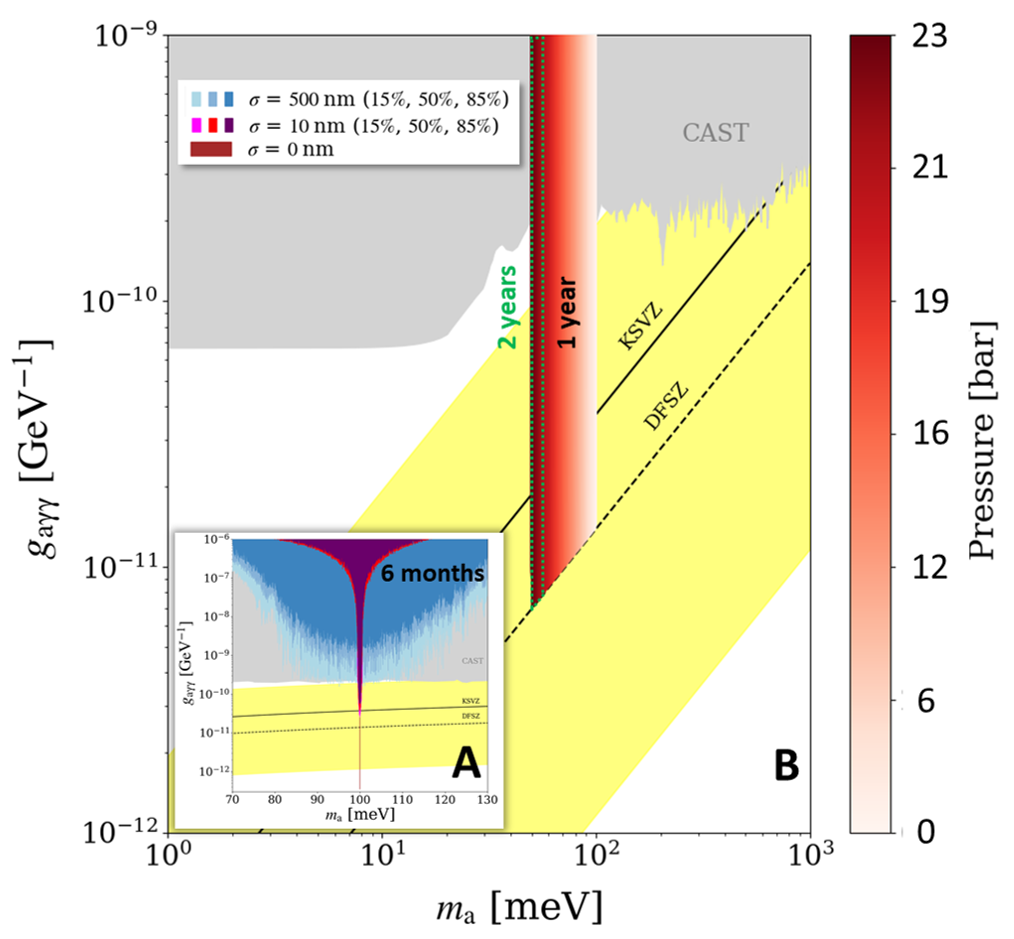
B: WISPFI’s long-term prospects including a laser and a -long PM HC-PCF fiber with a core radius of and . The data-taking time is 1 year and 2 years (green-dotted region). The 50 percentile chosen for this case, results in DFSZ sensitivity. The tuning is performed by modulating the air pressure in the core of the HC-PCF from . This results in an axion mass range between .
As discussed in a previous section, the probed axion mass at resonance can be tuned by changing the air pressure inside the HC-PCF. The tuning step size is determined by the FWHM of the resonance and therefore, in our setup, it will be adjusted based on the actual core radius variations of the used HC-PCF which will also determine the reached sensitivity.
V Discussion
The WISPFI experiment will be sensitive to the QCD axion in a narrow mass range close to that is so-far unexplored experimentally. The baseline configuration presented above (Fig. 3A) can be substantially improved by installing several optimized interferometers tuned individually to a resonant-conversion for different axion masses (e.g., by choosing gas pressure, wavelength, and core radii). The resulting sensitivity and mass range covered is therefore scaleable without the need to develop new methods. The novel approach to search for resonant conversion in a HC-PCF opens additional unique opportunities: By attaching electrode strips to the fiber, it is possible to probe the photon-axion conversion in strong electric fields that has been predicted in scenarios based upon modified Quantum-Electromagnetodynamics [21]. Polarization-Maintaining (PM) HC-PCF [22, 23] would additionally improve the sensitivity by orienting the polarization of the guided mode with the external magnetic field. In a setup with PM HC-PCF only, the laser power could be increased beyond the limits set by the step-index fiber. Such an example using a laser of and -long PM HC-PCF with while measuring for a total of 1 and 2 years is shown in Fig. 3B. For the case of 2 years, a total pressure change of is applied in steps of in order to reach axion masses between with a DFSZ sensitivity.
VI Summary and outlook
We have introduced a compact MZI embedded in an external magnetic field that is sensitive to the conversion of photons to axions. The conversion takes place resonantly in a HC-PCF. By changing the gas pressure in the hollow core, the refractive index for the guided mode can be tuned. In the approach presented, the resulting sensitivity reaches the QCD axion band for the photon-axion coupling in a so-far unexplored mass range at . The approach is scalable and we have introduced several avenues to improve the sensitivity and mass range further. The experiment in its baseline configuration is currently under construction to be operated in the warm bore of a dedicated superconducting solenoid magnet with a maximum field of .
Acknowledgements
This project is funded by the Deutsche Forschungsgemeinschaft (DFG, German Research Foundation) under Germany’s Excellence Strategy – EXC 2121 ”Quantum Universe” – 390833306, and through the DFG funds for major instrumentation grant DFG INST 152/824-1. YG acknowledges funding from the Chinese Scholarship Council Scholarship No. 201708060377. We thank Oliver Gerberding, Rebecca Harte, Le Hoang Nguyen, and Martin Tluczykont for their useful comments, discussions, and contributions to the WISPFI prototype development. We acknowledge initial discussions with Roman Schnabel and Pascal Geweke on using squeezed light for WISPFI. This article is based upon work from COST Action COSMIC WISPers CA21106, supported by COST (European Cooperation in Science and Technology).
VII Appendices
VII.1 Equation of motion
From the axion-modified Ampere and Faraday Laws the Axion-Maxwell-Helmholtz equation focusing on the z-direction of propagation can be deduced as:
| (7) |
where being the electric field and the axion field, respectively. The variables and are the angular frequencies of the photon and axion fields, respectively, which will be assumed to be the same in the following calculations. In the ultra-relativistic limit , Eq. 7 is linearized in the context of observing plane-waves, as done in Ref [9]. Regarding that, the mixing matrix is
| (8) |
where and give the photon and axion momenta respectively in the core media of the fiber, and is the mixing energy which is proportional to the external magnetic field and the coupling strength. To obtain the proper propagation constants of the photon and axion fields a change of basis is required to decouple the system. For that reason, we work in a new basis so that both fields can be treated independently and the standard Maxwell boundary conditions of continuity and differentiability can be applied. By finding the mixing angle that decouples the fields and makes the mixing matrix diagonal, the eigenvalues can be estimated. We then have all the information for dealing with each field separately.
| (9) |
where with . The mixing angle can be obtained from the non-diagonal terms of the resulting matrix operation in Eq. 9:
| (10) |
Note that the mixing angle in Eq. 10 has a dependence on the refractive index of the media.
VII.2 Photon-Axion conversion probability in a fiber
The photon-axion conversion probability inside a fiber will now be estimated. In the simple linearized case, the resulting decoupled electric and axion fields propagating inside the fiber in the z-direction can be expressed as and , respectively. The original fields can be then expressed in terms of the rotated and their respective factorized amplitude coefficients ():
| (11) |
where and are normalized as a function . Given the total energy of the system and losing one degree of freedom by normalizing the amplitude coefficients, the total intensity can be expressed as , being real amplitude coefficients. We can then observe how our system conserves the total amplitude. The electric and axion fields in the direction can be therefore deduced by applying the rotation back to our original basis.
| (12) |
Regarding that, the resulting conversion probability is:
| (13) |
VII.3 Estimation of the effective mode index
To analytically calculate the effective mode index in a HC-PCF the fiber-core is commonly approximated considering a circular capillary, expressing the mode profile as in the case of a hollow waveguide [24]. Under that approach, only the core mode properties are considered, acting independently from the cladding modes. To ensure good confinement and simplification of the calculation, we assume that the ratio between the core radius and the wavelength in vacuum is much higher than one ().
The effective mode index can then be calculated as in Eq. 14 from the real part of the propagation constant, , divided by the photon wave-number in vacuum, . We only consider the real (loss-less) part of the propagation constant regarding that optical fibers are normally made of dielectric materials with a predominantly real refractive index. The effective mode index (), and eventually the axion mass, are principally affected by the core radius () or by changing the refractive index of the filled gas (), by varying pressure (), temperature (), and wavelength () [24]:
| (14) |
where is the zero of the -order Bessel function of the first kind. This so-called Marcatili’s formula is generally valid when the ratio between the core radius and the applied wavelength is [25]. However, for smaller values of , it overestimates the resulting effective mode index. Because of that, we consider a more suitable model based on a hollow core surrounded by a ring of dielectric tubes. Each tube is separated from each other by a trapezoidal-shape gap as given in Ref. [25]. In this approximation, the core radius in Eq. 14 is replaced by an effective core radius (see Eq. 10 of [25]). This approximation is known as tube-lattice fiber (TLF).
Since the actual geometry of the HC-PCF under study contains additional rings of hollow tubes, the effective mode index is also calculated through simulations where the cylindrical two-dimensional geometry of the system has been implemented in the commercial software package COMSOL-Multiphysics [26] (see the black outline in Fig. 4B). Based on the available HC-PCF in the market (HC-1550, Fig. 4A) the hollow core radius is assumed to be and the cladding is composed of pure silica glass (). We consider a capillary-to-core radius ratio of [27]. The cylindrical geometry is matched by a boundary condition that corresponds to an infinite radial extension of the cladding. The resulting effective mode index is found by scanning the solution of the Maxwell equations for propagating modes that are confined to the core. As an example, for such a solution with the pressure and temperature fixed at and respectively, we show in Fig. 4B in color-scale the electric field strength along the propagation direction which shows a clear maximum collocated with the hollow core.
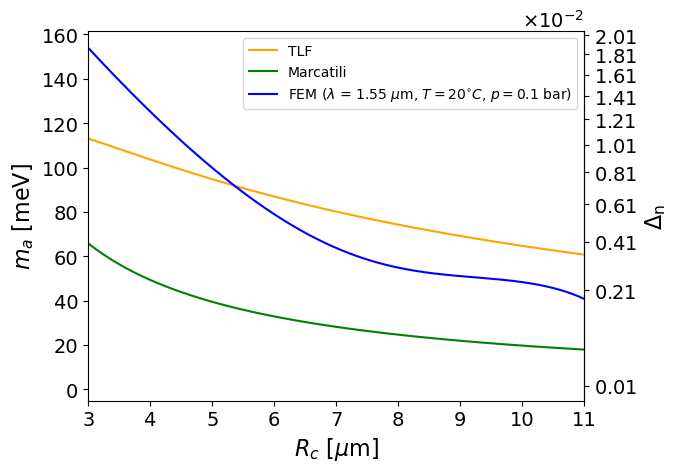
The solutions obtained with the FEM calculations with the core radius varying between are shown in Fig. 5 in comparison with the analytical solutions introduced above (see Eqs. 14, 5). The TLF approximation is closer to the numerical solution for core radii and larger while the differences are more pronounced at smaller core radii as expected. The Marcatili-based solution shows a qualitatively similar behaviour but the overall value for is smaller. These differences with the FEM simulation are already discussed in [28]. The resulting range of varies between for a pressure of . It is noted that a smaller core radius leads to a smaller effective mode index (larger axion mass), as the mode experiences stronger interaction with the cladding.
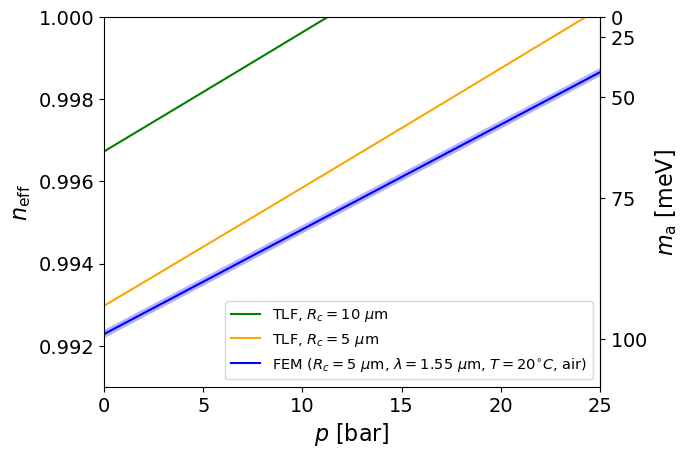
Besides changes in the geometry, the effective mode index is also affected by changes in the refractive index of the medium that fills the hollow core through changes in pressure and temperature. First, the refractive index for humid air is calculated using least squares to fit the raw data from [29] under the standard conditions (, , relative humidity ) for . Then, as shown in Fig. 6, the resulting variation of the effective mode index can be simulated when varying the pressure between and . As expected, and it reaches vacuum-like conditions () for . It is noted, that for a larger core radius of , vacuum-like conditions are reached for .
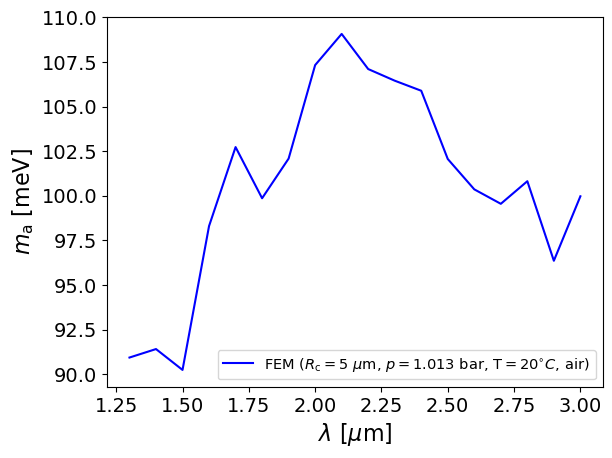
Finally, in Fig. 7, the wavelength of the propagating light is modulated to see the effect in the effective mode index of the HC-PCF and the subsequent probed axion mass. It should be mentioned, that longer wavelengths experience less confinement and a lower effective mode index, which can lead to a reduction in the overall transmission efficiency of the fiber. Furthermore, at larger wavelengths, the confinement loss can limit the transmission band of the core of the fiber. Analogously to the application of pressure changes, a fine-tuning of the wavelength can result in lower axion masses.
References
- Peccei and Quinn [1977] R. D. Peccei and H. R. Quinn, Physical Review Letters 38, 1440 (1977).
- Kim [1979] J. E. Kim, Physical Review Letters 43, 103 (1979).
- Dine et al. [1981] M. Dine, W. Fischler, and M. Srednicki, Physics Letters B 104, 199 (1981).
- Sikivie [1983] P. Sikivie, Phys. Rev. Lett. 51, 1415 (1983).
- T. Braine, et al., (2020) [ADMX Collaboration] T. Braine, et al., (ADMX Collaboration), Physical Review Letters 124, 101303 (2020).
- Eggemeier et al. [2022] B. Eggemeier, C. A. J. O’Hare, G. Pierobon, J. Redondo, and Y. Y. Y. Wong, Axion minivoids and implications for direct detection (2022), arXiv:2212.00560 [hep-ph] .
- Zyla et al. [2020] P. A. Zyla et al. (Particle Data Group), Progress of Theoretical and Experimental Physics 2020, 10.1093/ptep/ptaa104 (2020), 083C01.
- Tam and Yang [2012] H. Tam and Q. Yang, Physics Letters B 716, 435 (2012).
- Raffelt and Stodolsky [1988] G. Raffelt and L. Stodolsky, Physical Review D 37, 1237 (1988).
- Cregan et al. [1999] R. F. Cregan, B. J. Mangan, J. C. Knight, T. A. Birks, P. S. J. Russell, P. J. Roberts, and D. C. Allan, Science 285, 1537 (1999).
- Russell [2003] P. Russell, Science 299, 358 (2003).
- Nikodem [2020] M. Nikodem, Materials 13, 10.3390/ma13183983 (2020).
- Michaille et al. [2004] L. F. Michaille, D. M. Taylor, C. R. H. Bennett, T. J. Shepherd, C. Jacobsen, and T. P. Hansen, in Integrated Optical Devices, Nanostructures, and Displays, Vol. 5618, edited by K. L. Lewis, International Society for Optics and Photonics (SPIE, 2004) pp. 30 – 38.
- Cao et al. [2014] Y. Cao, W. Jin, F. Yang, and H. L. Ho, Opt. Express 22, 13190 (2014).
- Triches et al. [2015] M. Triches, A. Brusch, and J. Hald, Applied Physics B 121, 251 (2015).
- Slavík et al. [2015] R. Slavík, G. Marra, E. N. Fokoua, N. Baddela, N. V. Wheeler, M. Petrovich, F. Poletti, and D. J. Richardson, Scientific Reports 5, 15447 (2015).
- Gu [2023] Y. Gu, Searching for Axion-like particles using a fiber interferometer in a strong magnetic field, Ph.D. thesis, Universität Hamburg (2023).
- Mirizzi and Montanino [2009] A. Mirizzi and D. Montanino, JCAP 12, 004, arXiv:0911.0015 [astro-ph.HE] .
- De Angelis et al. [2011] A. De Angelis, G. Galanti, and M. Roncadelli, Phys. Rev. D 84, 105030 (2011), [Erratum: Phys.Rev.D 87, 109903 (2013)], arXiv:1106.1132 [astro-ph.HE] .
- V. Anastassopoulos, et al., (2017) [CAST Collaboration] V. Anastassopoulos, et al., (CAST Collaboration) (CAST), Nature Phys. 13, 584 (2017).
- Sokolov and Ringwald [2022] A. V. Sokolov and A. Ringwald, Electromagnetic Couplings of Axions (2022).
- Fini et al. [2014] J. M. Fini, J. W. Nicholson, B. Mangan, L. Meng, R. S. Windeler, E. M. Monberg, A. DeSantolo, F. V. DiMarcello, and K. Mukasa, Nature Communications 5, 5085 (2014).
- Chen et al. [2016] K. Chen, C. Wang, H. Hu, X. Shu, and C. Liu, IEEE Photonics Technology Letters 28, 2617 (2016).
- Marcatili and Schmeltzer [1964] E. A. J. Marcatili and R. A. Schmeltzer, Bell System Technical Journal 43, 1783 (1964).
- Rosa et al. [2021] L. Rosa, F. Melli, and L. Vincetti, Fibers 9, 58 (2021).
- COMSOL AB [2021] COMSOL AB, COMSOL Multiphysics, https://www.comsol.com/ (2021), cOMSOL Multiphysics® v. 6.1.
- Uebel et al. [2016] P. Uebel, M. C. Günendi, M. H. Frosz, G. Ahmed, N. N. Edavalath, J.-M. Ménard, and P. S. J. Russell, Optics letters 41, 1961 (2016).
- Finger et al. [2014] M. A. Finger, N. Y. Joly, T. Weiss, and P. S. Russell, Opt. Lett. 39, 821 (2014).
- Mathar [2007] R. J. Mathar, Journal of Optics A: Pure and Applied Optics 9, 470 (2007).