CrowdWeb: A Visualization Tool for Mobility Patterns in Smart Cities
Abstract
Human mobility patterns refer to the regularities and trends in the way people move, travel, or navigate through different geographical locations over time. Detecting human mobility patterns is essential for a variety of applications, including smart cities, transportation management, and disaster response. The accuracy of current mobility prediction models is less than 25%. The low accuracy is mainly due to the fluid nature of human movement. Typically, humans do not adhere to rigid patterns in their daily activities, making it difficult to identify hidden regularities in their data. To address this issue, we proposed a web platform to visualize human mobility patterns by abstracting the locations into a set of places to detect more realistic patterns. However, the platform was initially designed to detect individual mobility patterns, making it unsuitable for representing the crowd in a smart city scale. Therefore, we extend the platform to visualize the mobility of multiple users from a city-scale perspective. Our platform allows users to visualize a graph of visited places based on their historical records using a modified PrefixSpan approach. Additionally, the platform synchronizes, aggregates, and displays crowd mobility patterns across various time intervals within a smart city. We showcase our platform using a real dataset.
Index Terms:
Human Mobility, Mobility Pattern, Crowd Mobility, Social Networks, Flexible PatternHuman Mobility Patterns are the series of places frequently visited by an individual [1]. Detecting these mobility patterns is crucial in various domains such as pandemic prevention [2], urban planning [3], crowd management [4, 5], and location-based services [6, 7]. Several studies have demonstrated that human mobility is highly predictable due to the regularity of daily routines [1, 8]. The acquisition of human mobility patterns involves examining spatio-temporal attributes and uncovering potential regularities in individual and population movement trajectories [2, 9]. Several models have been proposed to represent and predict human mobility patterns [10]. The availability of location-based data through social networks offers a unique opportunity to comprehensively investigate these patterns from both quantitative and detailed perspectives [2].
The detection of individual mobility patterns necessitates analyzing the historical data of the places visited by individuals. Deep learning approaches have been suggested for forecasting a user’s next point of interest [11, 10]; however, these methods have limited accuracy, ranging from 8% to 25%. Detecting an exact mobility pattern for a user is challenging because of the inherent flexibility of human movement [1, 2]. For example, a user who regularly eats Thai food for lunch between 12:00 and 13:00 may visit a different Thai eatery each day, e.g., Thai Express on the first day, Seasoning Thai on the second day, and Thai Pothong on the third day. Despite the user’s consistent dining habits, it is difficult to recognize this pattern due to the varying locations of the restaurants. Consequently, we proposed a platform for visualizing the mobility patterns of labeled locations to more accurately define users’ mobility patterns [12].The platform displays a set of frequent mobility patterns by using a modified PrefixSpan algorithm [13]. However, the platform was designed to detect individual mobility patterns, making it unsuitable for representing a group of users (i.e., a crowd) on a smart-city scale.
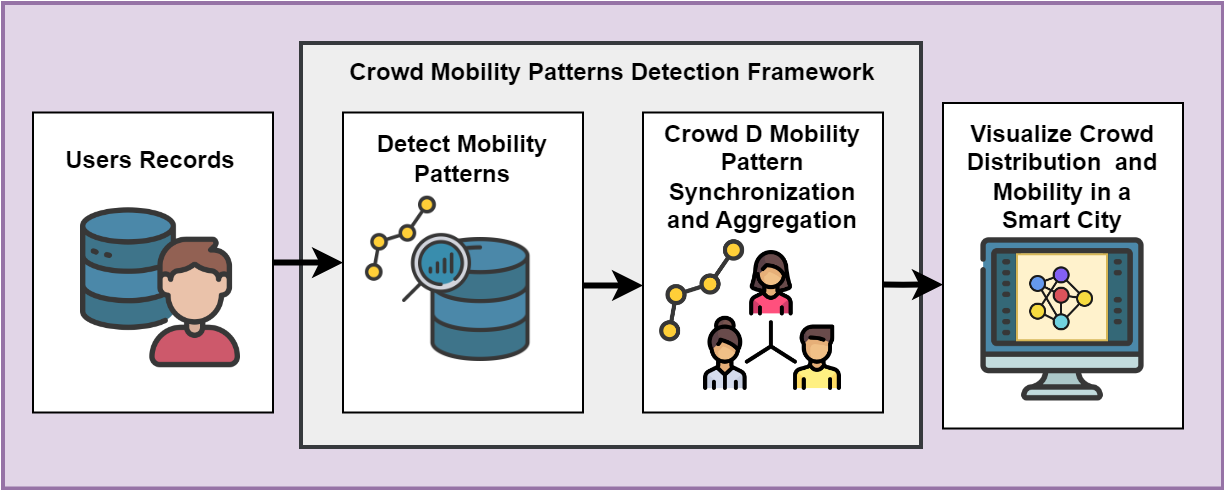
Detecting crowd mobility in a smart city is crucial in applications such as crowd management [4, 14, 15], IoT services [16, 17] and pandemic control [2]. Detecting crowd mobility is challenging because people have different spatio-temporal patterns [12, 18]. In this paper, we extend the aforementioned platform to compute and visualize the patterns of a crowd in a smart city over various time periods (See Fig.1). The platform utilizes users’ records after labeling the locations and their computed mobility patterns to compute the crowd mobility patterns and distribution (See Fig.3). The mobility patterns of each user are detected using a modified PrefixSpan algorithm [13]. Our platform synchronizes the mobility patterns of crowds by identifying a map of their visited places (see Fig.3. Moreover, we align the crowd’s patterns using different time windows. Our platform facilitates the analysis and comprehension of a crowd’s movement within a city.
I Crowd Mobility Patterns Detection Framework
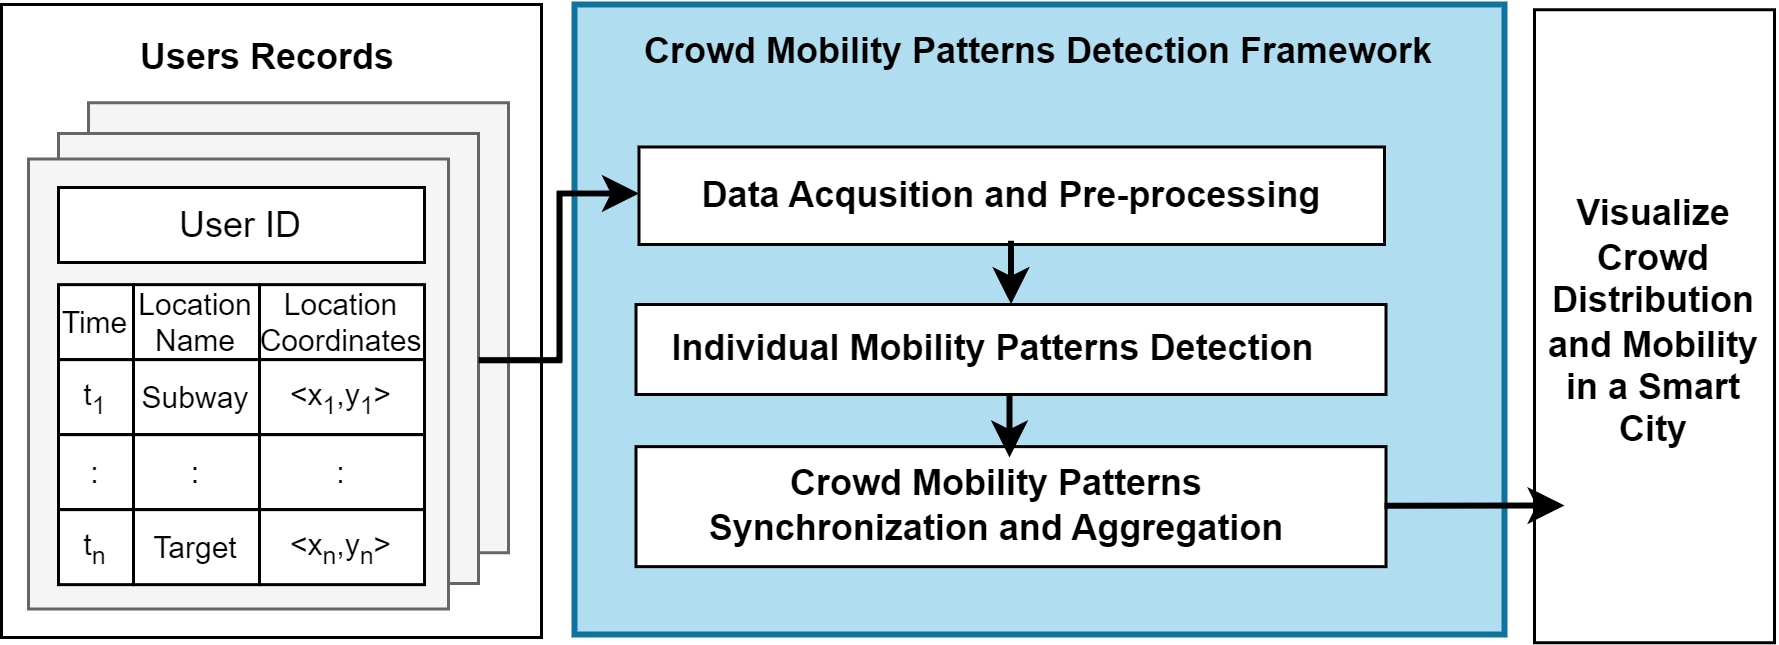
The crowd mobility patterns detection framework aims to synchronize, aggregate, and display crowd distributions and mobility patterns across various time intervals within a smart city. The framework comprises three phases: data acquisition and pre-processing, individual mobility patterns detection, and crowd distribution and mobility patterns synchronization and aggregation (See Fig. 2). In what follows, we discuss each phase in details:
I-1 Data Acquisition and Pre-processing
During this phase, users’ information and daily visited places data are acquired from a geo-location dataset. In this demonstration, we used a public Foursquare dataset as our default dataset [12]. The Foursquare dataset is a geo-tagged social media (GTSM) dataset, where users check in at the venues they visit. We used the New York dataset, which comprises 227,428 check-in records. The dataset was collected over an 11-month period (April 2012 to February 2013). As the GTSM dataset is collected by allowing users to check in voluntarily, it is possible that users are not checking in regularly. This leads to a sparse dataset. To confirm this, the average number of records for each user is examined. The average is approximately 210, and the median is 153. As there are approximately 330 days in the data collection period, there would be less than one record per day. Hence, the dataset is sparse. In addition, there are 1083 users in the dataset. Therefore, to address the data sparsity, we aimed to extract data from months with rich check-in records. After investigating, we found that the best month is the period of time from April to June. Therefore, for the experiment, we employed data from these three months. Moreover, we discovered that users were not recording their movement patterns on a daily basis. However, in order to extract a descriptive human mobility pattern for the users, we would need to ensure the user records are rich. Hence, we selected users with less than 2 hours check-in records for more than 50 days within the 3-month period.
I-2 Individual Mobility Patterns Detection
I-3 Crowd Mobility Patterns Synchronization and Aggregation
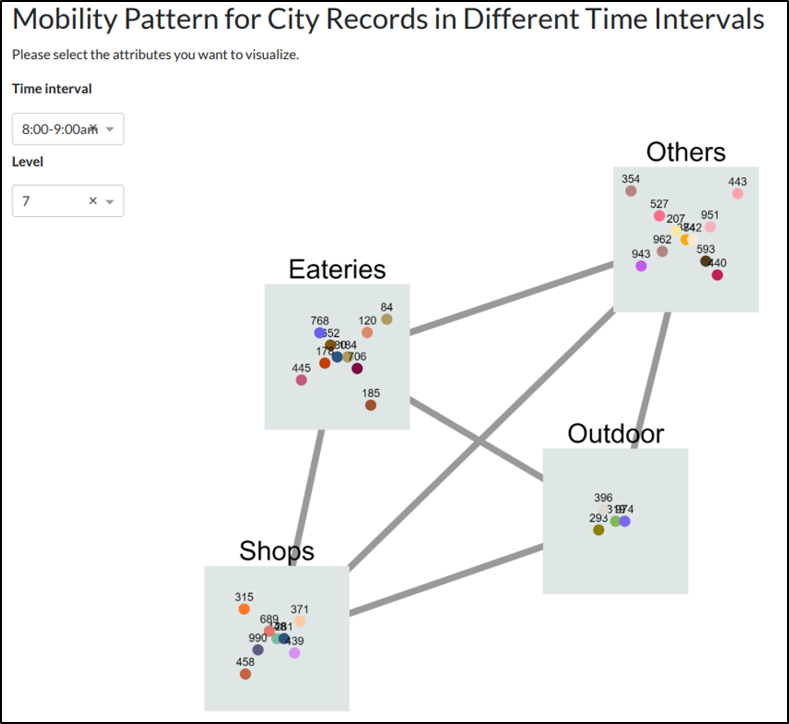
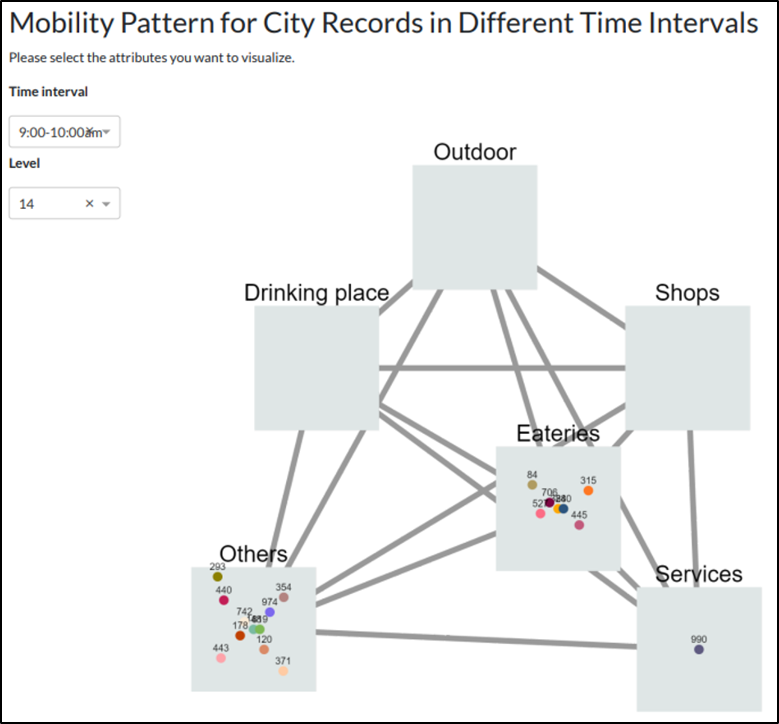
In this step, we synchronize and aggregate all the users’ mobility patterns based on time. Users who frequently visit a specific location at a particular time are categorized together as a group (See Fig.3). For example, any user with a pattern of visiting a certain microcell (e.g., shops) at a certain selected time (e.g., 8:00 am) will appear in the smart city at the selected time (See Fig.3). Moreover, if we change the time, the crowd locations may change to other microcells, depending on their patterns (See Fig.4). Our platform uses the aggregated patterns and distributions to visualize the crowd movement in a smart city.
II Demo Setup
Our interactive web application demonstrates crowd mobility in a smart city. We will also present a recorded video that presents the entire process of using the platform to display and interact with the default users’ patterns in real-time. The video can be found at this link: . Booth visitors can select from a list of available users to visualize their networks and mobility patterns. Additionally, they can choose the city visualization and observe crowd movements across various time frames. If any audience member is willing to share their check-in history, we can upload it to the platform and visualize their patterns.
III Mobility Patterns Exploration
To investigate the detected mobility patterns using the Foursquare dataset, we evaluated the effect of the Minimum Support Threshold on the patterns detected by the modified PrefixSpan [12]. Firstly, we examined the effect of changing on the number of sequences extracted per user. Secondly, we assessed the effect of changing on the average length of the sequences extracted per user.
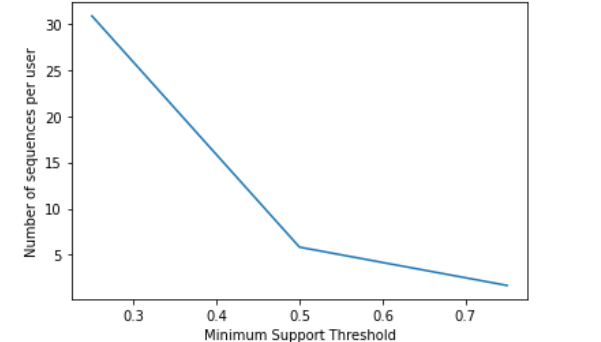
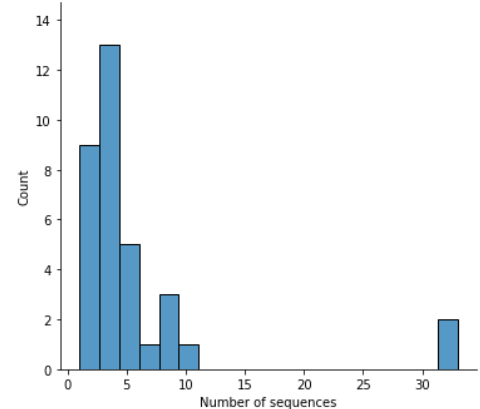
The first experiment examined the effects of changing on the number of sequences extracted per user. Figure 5 illustrates the correlation between the number of sequences per user and minimum support threshold. In general, the number of sequences per user decreased as the minimum support threshold increased. This trend occurs because a higher minimum support threshold value makes it more difficult for a pattern to be recognized as a sequential pattern. It is also notable that, as the minimum support threshold increases from 0.25 to 0.5, there is a significant decrease in the number of sequences per user. Conversely, when the minimum support threshold rises from 0.5 to 0.75, the decline in the number of sequences per user is less pronounced. To ascertain the previous evaluation, we present the distribution of the number of sequences with = 0.5 in figure 8.
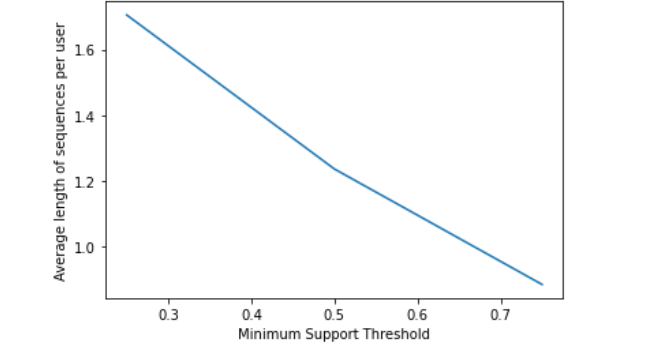
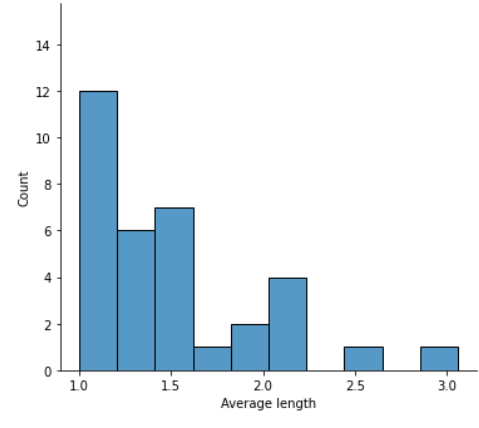
The second experiment examined the impact of modifying on the average length of the sequences extracted per user. Figure 7 illustrates the relationship between the average length of sequences per user and the minimum support threshold. Generally, the average length of sequences per user decreases as the support threshold rises. Moreover, when the minimum support threshold increased, the likelihood of a longer pattern being recognized as a sequential pattern was considerably lower than that of a shorter pattern. For instance, it is reasonable to expect that the pattern ’Eatery’ would appear more frequently than the pattern ’Eatery, Shops’ in a sequence database, leading to a higher probability of ’Eatery’ being certified as a sequential pattern compared to ’Eatery, Shops’. To ascertain the previous evaluation, we present the distribution of the average length across the levels with = 0.5 in figure 6.
IV Conclusion
This paper presents a web platform that visualizes human mobility patterns at both the individual and city-scale levels, making it more suitable for applications within a smart city scale.In addition to individual mobility patterns, the platform enables the visualization of multiple users’ mobility patterns, offering a city-scale perspective. In the future, we plan to allow users to scale the time frames for the crowd movement and automate the crowd movement animation.
Acknowledgment
This research was partly made possible by LE220100078 and DP220101823 grants from the Australian Research Council. The statements made herein are solely the responsibility of the authors.
References
- [1] M. C. Gonzalez, C. A. Hidalgo, and A.-L. Barabasi, “Understanding individual human mobility patterns,” nature, vol. 453, no. 7196, pp. 779–782, 2008.
- [2] J. Wang et al., “Urban human mobility: Data-driven modeling and prediction,” Acm Sigkdd Explorations Newsletter, vol. 21, no. 1, pp. 1–19, 2019.
- [3] F. Xia et al., “Exploring human mobility patterns in urban scenarios: A trajectory data perspective,” IEEE Communications Magazine, vol. 56, no. 3, pp. 142–149, 2018.
- [4] T. Higashino, H. Yamaguchi, A. Hiromori, A. Uchiyama, and T. Umedu, “Re-thinking: Design and development of mobility aware applications in smart and connected communities,” in 2018 IEEE 38th International Conference on Distributed Computing Systems (ICDCS). IEEE, 2018, pp. 1171–1179.
- [5] A. Abusafia et al., “Quality of experience optimization in iot energy services,” in IEE ICWS. IEEE, 2022.
- [6] P. Yang et al., “Monitoring efficiency of iot wireless charging,” in PerCom. IEEE, 2023.
- [7] A. Lakhdari et al., “A link strength based label propagation algorithm for community detection,” in 2016 IEEE International Conferences on Big Data and Cloud Computing (BDCloud), Social Computing and Networking (SocialCom), Sustainable Computing and Communications (SustainCom)(BDCloud-SocialCom-SustainCom). IEEE, 2016, pp. 362–369.
- [8] Y. Zhou et al., “Understanding urban human mobility through crowdsensed data,” vol. 56, no. 11, pp. 52–59, 2018.
- [9] G. Solmaz et al., “Toward understanding crowd mobility in smart cities through the internet of things,” IEEE Communications Magazine, vol. 57, no. 4, pp. 40–46, 2019.
- [10] Z. Haifeng, Y. Yajie, and Z. Ningbo, “Human mobility prediction based on dbscan and rnn,” in 2021 IEEE 4th International Conference on Computer and Communication Engineering Technology (CCET). IEEE, 2021, pp. 146–152.
- [11] M. Luca, G. Barlacchi, B. Lepri, and L. Pappalardo, “A survey on deep learning for human mobility,” ACM Computing Surveys (CSUR), vol. 55, no. 1, pp. 1–44, 2021.
- [12] Y. A. Zheng et al., “Imap: Individual human mobility patterns visualizing platform,” in MobiCom, 2022, pp. 797–799.
- [13] J. Pei et al., “Mining sequential patterns by pattern-growth: The prefixspan approach,” IEEE Transactions on knowledge and data engineering, vol. 16, no. 11, pp. 1424–1440, 2004.
- [14] A. Abusafia et al., “Maximizing consumer satisfaction of iot energy services,” in ICSOC. Springer, 2022, pp. 395–412.
- [15] Y. Zhou, B. P. L. Lau, Z. Koh, C. Yuen, and B. K. K. Ng, “Understanding crowd behaviors in a social event by passive wifi sensing and data mining,” IEEE Internet of Things Journal, vol. 7, no. 5, pp. 4442–4454, 2020.
- [16] P. Yang et al., “Towards peer-to-peer sharing of wireless energy services,” in ICSOC. Springer, 2022.
- [17] J. Yao and et al., “Wireless iot energy sharing platform,” in IEEE PerCom Workshops. IEEE, 2022, pp. 118–120.
- [18] A. Abusafia et al., “Service-based wireless energy crowdsourcing,” in ICSOC. Springer, 2022, pp. 653–668.