Ownership Chains in Multinational Enterprises
In this contribution, we investigate the role of ownership chains developed by multinational enterprises across different national borders. First, we document that parent companies control a majority (58%) of foreign subsidiaries through indirect control relationships involving at least two countries along an ownership chain. Therefore, we hypothesize that locations along ownership chains are driven by the existence of communication costs to transmit management decisions. In line with motivating evidence, we develop a theoretical model for competition on corporate control that considers the possibility that parent companies in the origin countries can delegate their monitoring activities in final subsidiaries to middlemen subsidiaries that are located in intermediate jurisdictions. Our model returns us a two-step empirical strategy with two gravity equations: i) a triangular gravity for establishing a middleman by the parent, conditional on final investments’ locations; ii) a classical gravity for the location of final investments. First estimates confirm the predictions that ease of communication at the country level shapes the heterogeneous locations of subsidiaries along global ownership chains.
Keywords: Multinational firms; Ownership structure; corporate control; gravity models
JEL Codes: F23, L23, G34
1 Introduction
A common feature in the organization of multinational enterprises is the development of ownership chains crossing multiple country borders. According to UNCTAD (2016), more than 40% foreign affiliates are controlled indirectly by parent companies through vertical chains, accounting for almost 50% of multinationals’ revenues. Yet, despite their economic relevance, the emergence of corporate hierarchical structures across national borders has been neglected by economic literature.
In this work, we hypothesise that the rationale behind global ownership chains relates to the organization of efficient communication of management decisions between affiliates and parent companies scattered across different countries. Communication barriers burden parent companies that eventually start to delegate the monitoring of production activities when the boundaries of multinational enterprises extend on a wide geographic scale.
More specifically, we derive two structural gravity equations based on a model of competition for corporate control along global ownership chains where monitoring activities can be delegated with a cost. For our purpose, we elaborate on the original intuition by Head and Ries (2008) on the emergence of a market for corporate control when parent companies and affiliates are located in different countries. We extend to include cases of three-tier corporate structures, where an additional intermediate layer of ownership exists between a parent and its final affiliates. From our perspective, three-tier corporate structures are simplified ownership chains where (at least) a middleman subsidiary located in a country communicates management decisions from the parent company, which is located in an origin country, to a final subsidiary in a destination country.
Eventually, we derive two estimable gravity equations to evaluate the role of communication frictions in the emergence of sophisticated ownership chains:
-
1.
a triangular gravity, which explains the extensive margin of establishing a middleman company that is controlled by the parent and monitors activities performed by final affiliates, conditional on final investments’ locations;
-
2.
a bilateral gravity for the extensive margin of locating multinational firms’ final investments.
Model predictions are confirmed after a pseudo-Poisson maximum likelihood estimator. According to our model, a middleman’s location is determined by the cost of monitoring final subsidiaries plus the cost of delegating the monitoring function by a parent company. Yet, the delegation cost is always lower than the monitoring cost; otherwise, establishing an ownership chain would not be convenient. The delegating cost decrease with the ease of communication between a parent and its middleman subsidiary, while the monitoring costs decrease with the ease of communication between the middleman and the final subsidiaries. Eventually, our model also predicts that the location of the final subsidiaries is driven by the expected multilateral cost of controlling a company in a given country.
Our theory is positively tested on information about ownership chains by 226,993 parent companies as developed in 190 countries in the year 2019. Adopting a network approach, our sample reconstructs global ownership chains from a matrix considering firm-level original lists of shareholders, as in Rungi et al. (2017). Any time a corporate shareholder is present in a list of shareholders, an ownership network may exist upstream, and a network majority rule allows us to detect chains of corporate relationships starting bottom up until reaching an ultimate parent company. Eventually, an overview of our sample shows that complex ownership chains emerge in about 50% multinational enterprises. An ownership chain can include up to 21 companies and cross up to 8 different countries.
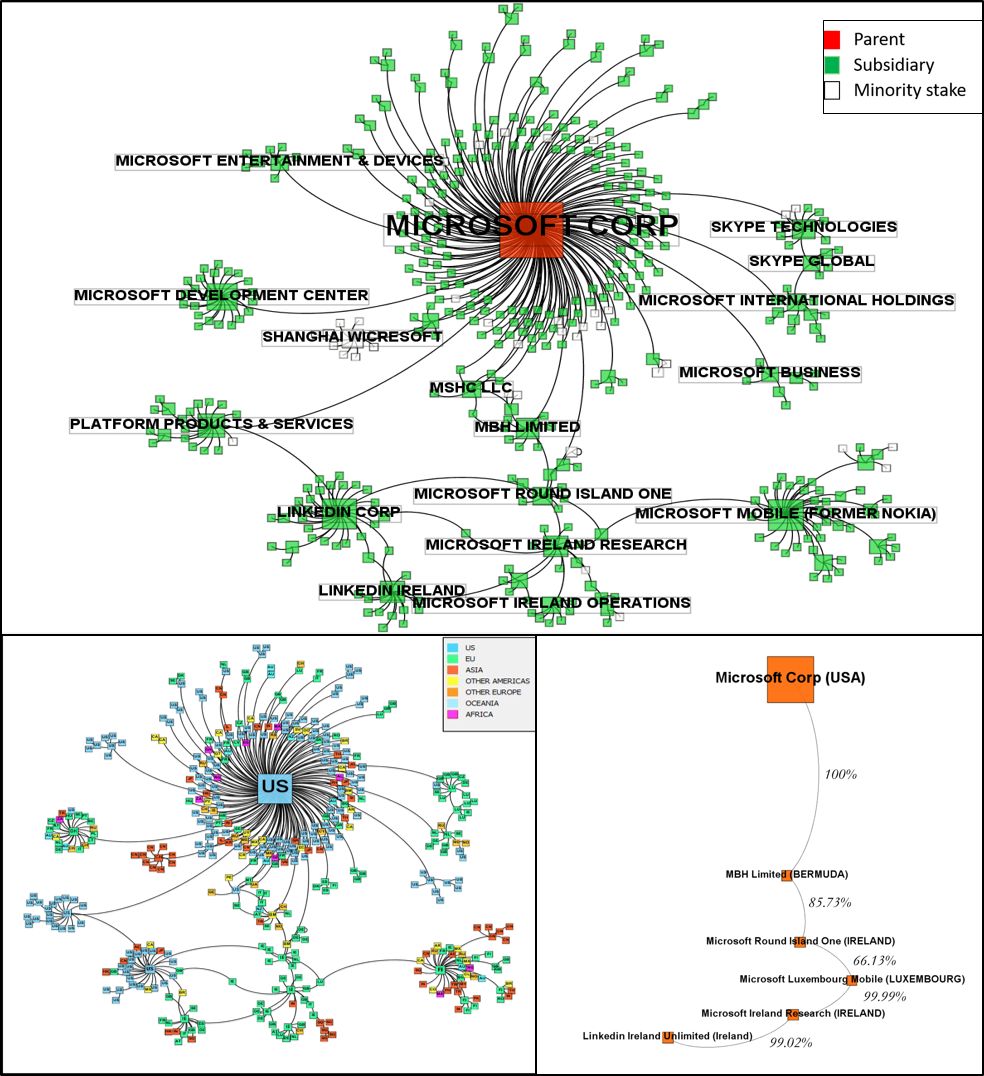
To provide a general idea of how global ownership chains look like, we visualize the case of Microsoft Corp in Figure 1. Microsoft Corp is a well-known leading tech company providing computer software and consumer electronics since 1975. According to our data, it coordinates 404 subsidiaries operating in 79 countries in 2019. Each node represents the parent or a subsidiary of Microsoft Corp, and each edge represents an equity stake directed from one company to another. In the first panel, the parent company is coloured in red, and the subsidiaries are coloured in green. At the same time, a few relevant minority stakes are also reported as white nodes linked to either the parent company or any of its subsidiaries.
-
•
Note: The first panel shows the corporate network structure of Microsoft Corp in 2019, as from our data. Each node is a company, and each edge is an equity stake. In the second panel, we show the geographical span of the multinational enterprise with ISO 2-digit codes written on nodes. The third panel extracts a peculiar case of a long ownership chain starting from Microsoft’s parent and crossing several national borders.
The structure of Microsoft Corp shows a big collection of subsidiaries on the first hierarchical layer around the parent company. More downstream, we find a constellation of sub-holdings that monitor the activities of indirectly controlled subsidiaries. Some of them are the result of previous acquisitions (e.g., Skype Technologies, Linkedin Corp, and Microsoft Mobile - former Nokia), whereas others are the result of an all-internal organization (e.g., Microsoft Platform Products and Services, Microsoft Development Center, Microsoft Entertainment Devices, Microsoft Business Divisions, Microsoft Island One, and Microsoft Ireland Research).
In general, we observe that Microsoft Corp has a multi-centre spider-like organization where some central subsidiaries establish cross-holdings and ownership loops among them. The second panel of Figure 1 indicates where each subsidiary is located. Each node is labelled with the hosting country’s ISO 2-digit code, whereas colours indicate the main continents. Interestingly, we find that most ownership loops and cross-holdings are established among subsidiaries that operate in the US, Ireland, Luxembourg, and Bermuda. Ownership chains are crossing several national borders before reaching a final subsidiary. This is the case of Linkedin Ireland Unlimited reported at the bottom of 1, whose pattern of control includes four middlemen, respectively located in Ireland (Microsoft Ireland Research, 99.02% stake), Luxembourg (Microsoft Luxembourg Mobile, 99.99%), back in Ireland (Microsoft Round Island One, 66.13%), crossing the Atlantic Ocean in the Bermuda Islands (MBH Limited, 85.13%) and finally reaching the US headquarters (Microsoft Corp, 100%). In some cases, minority albeit dominant stakes may represent FDI operations. This is the case of Wicresoft in Shanghai, a white node originating a spider in the top panel of Figure 1. Reportedly, Wicresoft was jointly established in 2002 by Microsoft Corp and a venture capital fund owned by the Shanghai municipality. Traditionally, China discourages majority stakes by foreign investors and promotes forms of corporate governance that favour local technological spillovers. Over time, Wicresoft has developed its global network of operations in the US and Europe while keeping its original connection with Microsoft Corp.
This paper contributes to the literature studying the determinants of business groups organization. In particular, our work is among the few using firm-level data to investigate possible motives behind the development of hierarchical structures. Some contributions draw from organizational economics the concept of companies as knowledge-based hierarchies, where hierarchical differentiation raises to optimize the creation and transfer of knowledge required for the production process (Garicano, 2000). Altomonte et al. (2021) propose and test a model where efficiency in problem solving contributes to determine the optimal hierarchical shape of a business group, with parent companies supervising subsidiaries and managing communication among them. Altomonte and Rungi (2013) look at the relation between hierarchical complexity and vertical integration and find consistencies with predictions from knowledge-based models. Other authors investigate the role of tax avoidance strategies. Lewellen and Robinson (2013) uncover several tax factors shaping foreign ownership structures of U.S. MNEs. Also Dyreng et al. (2015) look at ownership chains of U.S. MNEs and find that whether and where to locate an intermediate holding company depends on tax related country characteristics.
Our work is also related to the literature on the determinants of multinational enterprise investments. Starting from the early application of Eaton and Tamura (1994), a plethora of contributions have analyzed patterns of foreign direct investments within the framework of gravity models, where either the extensive or intensive margin of investments is affected by the size of source and destination countries, and on a set of bilateral frictions between country pairs. Gravity-type equations have been employed to estimate the impact of destination country taxation (Mutti and Grubert, 2004), institutions quality (Bénassy-Quéré et al., 2007), time zone proximity (Stein and Daude, 2007) and bilateral investment treaties (Egger and Pfaffermayr, 2004), just to mention a few. Differently from these works, we do not look at direct investments but we rather look at the ownership chains a direct investment could be part of. Few works have instead provided theoretical foundation to gravity equations for investments, and among them, the vast majority assume either vertical or horizontal integration between multinational companies and their subsidiaries (Kleinert and Toubal, 2010; Bergstrand and Egger, 2007, 2010; Anderson et al., 2019). Head and Ries (2008) take a different perspective and propose a model where direct investments consist in corporate acquisitions, and, as anticipated, our paper is closely related to their work. Their theoretical framework is particularly suitable to our case as, besides using a discrete choice approach (similar to the one seen in Eaton and Kortum (2002) work), remains quite flexible on the motivations for which investments occur.
More remotely, our work is related to the literature on multinational production that models interdependencies in firm-level decisions (Tintelnot, 2017; Arkolakis et al., 2018; Wang, 2021; Head and Mayer, 2019). Within this class of models, multinational companies organizing their global operations, make multiple nested decisions on locations and quantities. Importantly, the choice on where to locate production sites is analysed in relation to other connected activities, such as export or intermediate goods sourcing, that involve a third country, giving rise to triangular geographic patterns. Similarly, we model multinational investments location as dependent on the necessity to shift monitor activities to a third country, with the parent company simultaneously deciding where to invest and where to place the monitoring unit.
The reminder of the paper is organized as follows. In Section 2, we introduce data and motivating evidence on the relative important and the extent of ownership chains across national borders.
2 Data on ownership chains and motivating evidence
We source data from the Orbis Ownership database compiled by Bureau Van Dijk, which collects shareholding information on companies worldwide. To retrieve the topology of corporate networks developed by a multinational enterprise, we adopt the methodology by Rungi et al. (2017), where ownership chains are reconstructed following equity links established among legally autonomous firms, all leading upwards to an ultimate parent company thanks to the backward solution of majority rule () that allows management decisions to be enforced. The methodology allows us to consider cases of direct control, indirect control by transitivity of direct control, and cases when the parent company can consolidate indirect control through otherwise fragmented ownership chains that together combine to reach an absolute majority () in a subsidiary. Notably, an ownership chain allows a parent company to exert indirect control over final subsidiaries. For our purpose, we define a middleman subsidiary as one we can encounter along an ownership chain before reaching a final subsidiary in a destination country. As we are interested only in ownership chains that cross countries’ borders, we will focus only on corporate networks defined by multinational enterprises defined by a parent company with at least a subsidiary in a country different from the parent’s origin. Additional details about the methodology and the original dare are reported in Appendix A.
We end up with a sample of 226,993 parent companies controlling 1,785,493 subsidiaries that are located in 190 countries and territories around the world. In Table 1, we show the geographic distribution of multinational enterprises in our sample based on the location of both parents and subsidiaries. Among subsidiaries, we separate in the last columns of the table the geographic distribution of middlemen. The largest shares of parent companies (42%) and subsidiaries (33%) is detected in the European Union. If we look inside country aggregates, we observe a relative concentration of parent companies in Cyprus and the Caribbeans, which are known for having business-friendly tax systems. As for subsidiaries, they mostly locate in the USA, UK, China and Germany. Yet, their distribution slightly changes when we focus on middlemen, in the third column of Tab.1, where we observe comparatively fewer middlemen in the Asian countries, and we note a greater concentration of firms in both the United Kingdom and the Netherlands.
| Parent | % | Subsidiaries | % | of which | Middlemen | % | |||
| EU27 | 94,780 | 41.77% | 590,017 | 33.05% | 105,376 | 39.22% | |||
| of which | |||||||||
| Cyprus | 11,390 | 5.02% | 13,645 | 0.76% | 3,403 | 1.27% | |||
| Netherlands (the) | 11,060 | 4.87% | 64,656 | 3.62% | 17,215 | 6.41% | |||
| Germany | 10,608 | 4.67% | 107,659 | 6.03% | 16,856 | 6.27% | |||
| Italy | 7,729 | 3.41% | 41,617 | 2.33% | 7,192 | 2.68% | |||
| France | 6,980 | 3.08% | 51,774 | 2.90% | 9,163 | 3.41% | |||
| Luxembourg | 5,952 | 2.62% | 32,448 | 1.82% | 9,457 | 3.52% | |||
| Asia | 33,395 | 14.72% | 344,736 | 19.31% | 38,693 | 14.40% | |||
| of which | |||||||||
| China | 5,915 | 2.61% | 127,154 | 7.12% | 14,583 | 5.43% | |||
| Singapore | 1,498 | 0.66% | 35,547 | 1.99% | 6,416 | 2.39% | |||
| Rest of Europe | 30,495 | 13.44% | 204,749 | 11.47% | 40,188 | 14.96% | |||
| of which | |||||||||
| UK | 14,856 | 6.55% | 133,366 | 7.47% | 30,363 | 11.30% | |||
| Switzerland | 8,790 | 3.87% | 13,047 | 0.73% | 2,873 | 1.07% | |||
| USA | 24,507 | 10.80% | 389,691 | 21.83% | 51,520 | 19.18% | |||
| Latin America | 21,771 | 9.59% | 80,703 | 4.52% | 8,002 | 2.98% | |||
| of which | |||||||||
| Caribbean | 17,769 | 7.83% | 29,220 | 1.64% | 4,536 | 1.69% | |||
| Africa | 6,100 | 2.69% | 43,656 | 2.45% | 4,022 | 1.50% | |||
| Oceania | 6,034 | 2.66% | 57,071 | 3.20% | 11,589 | 4.31% | |||
| of which | |||||||||
| Australia | 4,336 | 1.91% | 41,371 | 2.32% | 9,418 | 3.51% | |||
| Canada | 4,587 | 2.02% | 33,725 | 1.89% | 4,272 | 1.59% | |||
| Russia | 3,178 | 1.40% | 37,313 | 2.09% | 4,170 | 1.55% | |||
| Rest of the World | 2,084 | 0.92% | 3,832 | 0.21% | 817 | 0.30% | |||
| Total | 226,931 | 100.00% | 1,785,493 | 100.00% | 268,649 | 100.00% | |||
-
•
Note: The table details the geographic coverage of parent companies and subsidiaries of multinational enterprises as classified by hosting economies. The third column specifies how many subsidiaries are middlemen in a given location. We show values for the relatively more populated countries inside an aggregate.
We now look at the full extension of ownership chains, from their origin, the parent company, to the last subsidiary in which they terminate. In table 2, we report the number of subsidiaries comprised by an ownership path, from beginning to end, and the number of foreign countries visited. In our MNEs sample, we find 1,517,138 paths connecting parent companies to final subsidiaries, which, in the simplest case, consist of a single direct control link. MNEs may either have a simple structure, where no middlemen are employed, and control occurs only directly from the parent to its subsidiaries, or a complex structure featuring at least one case of indirect control through middlemen. Notably, 82% of ownership chains derive from complex MNEs. In particular, for a 55% of ownership chains, one or more companies are interposed between parent and final subsidiary, up to a maximum of 20 middlemen. The grey area highlights how many of them cross national borders (33 % of the total) even more than once, up to a maximum of 7 countries visited by a single ownership chain. Complex and global ownership chains definitely represent a relevant feature in MNEs’ organization. For this reason, we wonder if ignoring the hierarchical aspect of MNE organization when analyzing the geography of foreign investments risks providing incomplete results. More concretely, this amounts to neglecting the interdependence between companies that compose ownership chains described in the grey area of table 2. This interdependence has an economic significance that could affect the geographical distribution of subsidiaries and deserve to be considered.
| N. of country borders crossed | ||||||||||||
| N. of subsidiaries | Domestic | 1 | 2 | 3 | 4 | 5 | 6 | 7 | Total | |||
|
1 | 51,680 | 222,186 | 273,866 | ||||||||
| (3.406%) | (14.645%) | (18.051%) | ||||||||||
| 1 | 223,995 | 191,138 | 415,133 | |||||||||
| (14.764%) | (12.599%) | (27.363%) | ||||||||||
| 2 | 181,428 | \cellcolor[HTML]EFEFEF174,195 | \cellcolor[HTML]EFEFEF41,266 | 396,889 | ||||||||
| (11.959%) | \cellcolor[HTML]EFEFEF (11.482%) | \cellcolor[HTML]EFEFEF (2.720%) | (26.160%) | |||||||||
| 3 | 94,778 | \cellcolor[HTML]EFEFEF80,172 | \cellcolor[HTML]EFEFEF30,602 | \cellcolor[HTML]EFEFEF5,522 | 211,074 | |||||||
| Complex | (6.247%) | \cellcolor[HTML]EFEFEF (5.284%) | \cellcolor[HTML]EFEFEF (2.017%) | \cellcolor[HTML]EFEFEF (0.364%) | (13.913%) | |||||||
| MNEs | 4 | 42,333 | \cellcolor[HTML]EFEFEF37,480 | \cellcolor[HTML]EFEFEF19,856 | \cellcolor[HTML]EFEFEF6,037 | \cellcolor[HTML]EFEFEF1,081 | 106,787 | |||||
| (2.790%) | \cellcolor[HTML]EFEFEF (2.470%) | \cellcolor[HTML]EFEFEF (1.309%) | \cellcolor[HTML]EFEFEF (0.398%) | \cellcolor[HTML]EFEFEF (0.071%) | (7.039%) | |||||||
| 5 | 17,663 | \cellcolor[HTML]EFEFEF18,363 | \cellcolor[HTML]EFEFEF11,407 | \cellcolor[HTML]EFEFEF5,189 | \cellcolor[HTML]EFEFEF961 | \cellcolor[HTML]EFEFEF205 | 53,788 | |||||
| (1.164%) | \cellcolor[HTML]EFEFEF (1.210%) | \cellcolor[HTML]EFEFEF (0.752%) | \cellcolor[HTML]EFEFEF (0.342%) | \cellcolor[HTML]EFEFEF (0.063%) | \cellcolor[HTML]EFEFEF (0.014%) | (3.545%) | ||||||
| 6 | 7,177 | \cellcolor[HTML]EFEFEF8,010 | \cellcolor[HTML]EFEFEF6,558 | \cellcolor[HTML]EFEFEF3,865 | \cellcolor[HTML]EFEFEF1,014 | \cellcolor[HTML]EFEFEF203 | \cellcolor[HTML]EFEFEF7 | 26,834 | ||||
| (0.473%) | \cellcolor[HTML]EFEFEF (0.528%) | \cellcolor[HTML]EFEFEF (0.432%) | \cellcolor[HTML]EFEFEF (0.255%) | \cellcolor[HTML]EFEFEF (0.067%) | \cellcolor[HTML]EFEFEF (0.013%) | \cellcolor[HTML]EFEFEF (0.000%) | (1.769%) | |||||
| >=7 | 5,595 | \cellcolor[HTML]EFEFEF8,375 | \cellcolor[HTML]EFEFEF8,622 | \cellcolor[HTML]EFEFEF6,273 | \cellcolor[HTML]EFEFEF2,869 | \cellcolor[HTML]EFEFEF810 | \cellcolor[HTML]EFEFEF196 | \cellcolor[HTML]EFEFEF27 | 32,767 | |||
| (0.369%) | \cellcolor[HTML]EFEFEF (0.552%) | \cellcolor[HTML]EFEFEF (0.568%) | \cellcolor[HTML]EFEFEF (0.413%) | \cellcolor[HTML]EFEFEF (0.189%) | \cellcolor[HTML]EFEFEF (0.053%) | \cellcolor[HTML]EFEFEF (0.013%) | \cellcolor[HTML]EFEFEF (0.002%) | (2.160%) | ||||
| Total | 624,649 | 739,919 | 118,311 | 26,886 | 5,925 | 1,218 | 203 | 27 | 1,517,138 | |||
| (41.173%) | (48.771%) | (7.798%) | (1.772%) | (0.391%) | (0.080%) | (0.013%) | (0.002%) | (100.000%) | ||||
-
•
Notes: This table is based on the observation of ownership chains in their full extension, from parent company to final subsidiary. For a total of 1,517,138 distinct ownership chains, we indicate by row how many subsidiaries they are composed of, and by column how many foreign countries they cross. In the first row, we report direct control links extracted from simple MNEs, i.e. MNEs that never show cases of indirect control in their corporate structure. In the grey area, we highlight values related to ownership chains crossing national borders and involving one or more middlemen.
2.1 Motivating evidence
We start by investigating the geographic distribution of subsidiaries of complex MNEs. In particular, we want to verify whether ownership chains fit into a gravity-type framework, assuming cross-country corporate relationships can be subject to bilateral country frictions.
The empirical literature that applies gravity equations, especially to trade data, generally uses the geographical distance between countries to control for transportation costs, as well as variables capturing cultural ties. However, in the case of FDI, some contributions have stressed the importance of other cost components related to the need to transfer information between companies in real-time (Stein and Daude, 2007). This is because the economic relationship between a company and its affiliates involves activities, such as management, monitoring, and coordination, that require frequent real-time interactions. It becomes thus relevant to capture those barriers that inhibit the ability to engage in real-time exchanges. While the traditional concept of physical distance fails to capture barriers to communication, the time-zone difference between a company pair is proposed as the best solution.
With this in mind, we start by specifying a corporate control gravity, where instances related to coordinating production are expected to play a role in the location of subsidiaries. In this perspective, control relationships might benefit from the ease of communication. To account for the latter, we follow Bahar (2020) and introduce in the gravity the daily number of overlapping working hours between companies111Bahar (2020) assume a working day to last ten hours and count the hours during which the parent company and its subsidiary offices are simultaneously open.. When two companies are located in different time zones, the more their working schedules match, the more likely it is that when communicating a decision, the counterparty will instantly receive it. We add other standard bilateral controls that might affect the cost of multinational production organization222Beyond intra-group coordination activities, there might be horizontal and vertical integration choices (see theoretical foundations for FDI gravity, such as Kleinert and Toubal (2010) and Bergstrand and Egger (2007)), which depend on the cost of transporting goods and affect the location of investments., also to prevent their effect, especially that of geographic distance, to be absorbed by the number of overlapping working hours. After aggregating control links into a count variable summing over country pairs, our chosen specification is:
| (1) |
where i and j stand for origin and destination country and counts the number of companies in country j controlled by companies located in country i. measures overlapping working hours between i and j, while is a vector of gravity controls we source from the CEPII Gravity dataset (namely, the logarithm of distance measured in km, and indicator variables for the presence of, respectively, contiguous borders, common language, common legal origins, colonial ties and regional trade agreements between countries). and capture origin and destination country fixed effects.
-
•
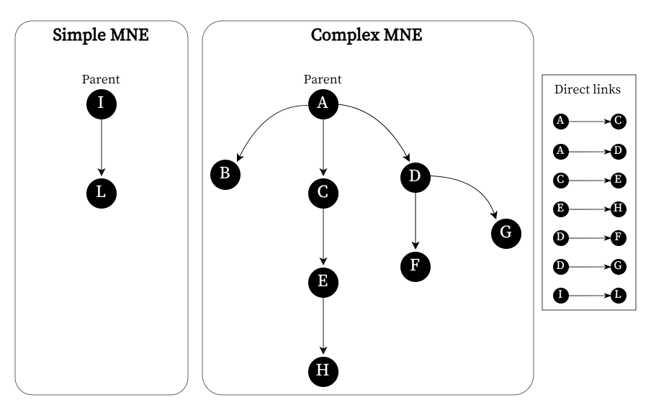
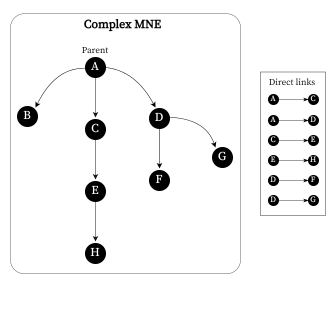
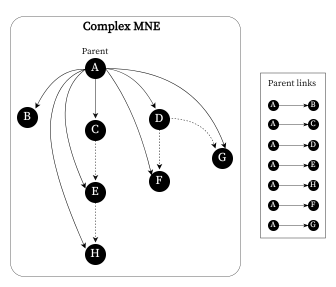
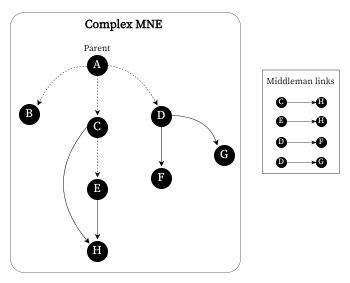
Notes: This figure shows how different measurements of the number of control relationships by country-pair are obtained starting from corporate control networks. Each panel reports an example of a corporate control network on the left and the list of correspondent bilateral control links on the right. Panel a) and b) refer, respectively, to the dependent variables in columns (1) and (2) of table 3. In both cases, the organizational structure is left aside to simply aggregate direct ownership links between companies. Yet, in column (1), we include simple MNEs in the analysis. Panels c) and d) refer, respectively, to the dependent variables in columns (3) and (4) of table 3 and display what happens when the corporate structure is accounted for. In column (3), we count all direct and indirect links between a parent company and its subsidiaries; in column (4), all direct and indirect control relationships between middlemen and final.
Recalling the previous paragraph, in table 2, we shed light on how relevant the interdependence between subsidiaries along complex ownership chains is. Our purpose is to incorporate this aspect into the analysis. To do this, we test different definitions of the extensive margin of MNEs investments, which we exemplify in figure 2, and compare results obtained from the different dependent variables obtained. In Figure 2, each panel corresponds to a distinct dependent variable depending on whether or not we ignore the hierarchical structure of complex MNEs. Indeed, ignoring the hierarchical structure of ownership chains generates a set of control links that might differ from the one obtained when the control network is accounted for. If the corporate structure were unknown, each subsidiary would be deemed to be controlled by the immediately preceding node, in which case the dependent variable would be a count of direct and independent control links. These are the cases displayed in panels (a) and (b) of figure 2. When the corporate structure is observable, control power can be attributed to parent companies proceeding up each subsidiary’s ownership chain. In this case, we sum up all direct and indirect control links connecting a parent company to each of its subsidiaries at any level of the hierarchy, as shown in panel (c) of fig. 2. Moreover, our data structure allows to isolate the control relationship between intermediate and final subsidiaries. Panel (d) illustrates the latter case, where the dependent variable counts the direct and indirect links that connect a middleman to the final subsidiary in an ownership chain.
| Dep. Var. | = # of companies country i controls in country j | ||||||||
| All MNEs | Complex MNEs | ||||||||
| Sample | Direct links | Direct links |
|
|
|||||
| (1) | (2) | (3) | (4) | ||||||
| N. of overlapping | 0.058** | 0.046* | 0.006 | 0.068** | |||||
| working hours | (0.023) | (0.025) | (0.023) | (0.027) | |||||
| RTA | 0.292* | 0.275* | 0.136 | 0.291* | |||||
| (0.154) | (0.165) | (0.195) | (0.168) | ||||||
| Log distance (km) | -0.252*** | -0.263*** | -0.336*** | -0.227*** | |||||
| (0.088) | (0.084) | (0.072) | (0.088) | ||||||
| Home | 3.355*** | 3.693*** | 2.516*** | 3.472*** | |||||
| (0.251) | (0.265) | (0.315) | (0.250) | ||||||
| Language | 0.780*** | 0.828*** | 0.747*** | 0.641*** | |||||
| (0.102) | (0.098) | (0.089) | (0.108) | ||||||
| Colony dependence | 0.304** | 0.300** | 0.312** | 0.385*** | |||||
| (0.130) | (0.133) | (0.129) | (0.124) | ||||||
| Legal origins | 0.377*** | 0.324*** | 0.238*** | 0.268*** | |||||
| (0.084) | (0.079) | (0.087) | (0.101) | ||||||
| Observations | 39,786 | 36,771 | 32,952 | 35,012 | |||||
| Fixed Effects | i,j | i,j | i,j | i,j | |||||
-
•
Note 1: Standard errors clustered by origin country in parentheses (*** p0.01, ** p0.05, * p0.1).
-
•
Note 2: counts the number of companies in country j controlled by companies in country i; what changes by column, is the set of control links the dependent variable is summing up by country-pair. Results reported in column (1) refer to all direct links composing the corporate structure of both simple and complex MNEs (see panel a) of Fig.2). Subsequent columns focus on complex MNEs only. Column (2) shows results for the sample of direct control links of complex MNEs (see panel b) of Fig.2). In the last two columns, the hierarchical structure of complex MNEs is controlled for and the dependent variable is counting respectively, all the direct and indirect control links held by parent companies at all levels (3) (see panel c) of Fig.2); all the direct and indirect control links held by middlemen (4) (see panel d) of Fig.2).
At this point, equation 1 is estimated using each of the four alternative s. Column (1) of table 1 reports coefficients estimated running eq.1 on direct investments. As expected, the number of overlapping working hours between countries is significant, implying that the ease of communication encourages direct control relationships. We find the same for complex MNEs in column (2), though the effect is less significant. In the following column, we apply gravity to parent-subsidiary control relations and notice that the ease of communication no longer matters. Thus, the location of subsidiaries does not seem to be driven by the need to communicate in real time with the parent. Interestingly, the coefficient returns to significantly positive in column (3). It follows that the possibility to interact in real-time with a middleman up in the ownership chain affects the location of a final subsidiary. Altogether these results suggest that if we zoom out from the single direct control link to get a full view of the corporate control network, we find that the ease of communication matters only in a limited area, that is, in the relationships between middlemen and final subsidiaries. As a side note, all versions of bilateral gravity we tested and reported in tab.3 obey the standard gravity model. Coefficients for distance are negative, while contiguity and cultural and historical similarities have a positive sign.
Building on recent influential contributions (Head and Mayer, 2019; Wang, 2021), we check whether a triangular gravity framework can explain the contemporary presence of three sets of frictions along ownership chains: (i) the relation between a parent and its middlemen; (ii) the relation between the middleman and the final subsidiary; (iii) the relation between the parent and its final subsidiary. The main intuition is that this is the best framework to check how communication costs operate differently along ownership chains. As seen in table 2, almost a 50% of indirect ownership chains employ only one middleman and naturally show a trilateral framework. Longer ownership paths need instead to be simplified to three-tier corporate structures. Our dependent variable is the number of final subsidiaries in county j indirectly controlled by a parent company in county i through a middleman located in county k (, where the superscript specifies we do not consider paths consisting in a direct control link between the parent and the final subsidiary.). The following equation is empirically tested:
| (2) |
where is the number of overlapping working hours between country pairs and subscripts specify whether location refers to the parent (i), to the middleman (k) and to the final subsidiary (j). , and are country-level fixed effects. For each side of the triangle, we include the vector of standard bilateral explanatory variables .
| Dep. Var. | |
| N. of overlapping | 0.059*** |
| working hoursik | (0.017) |
| N. of overlapping | 0.088*** |
| working hourskj | (0.019) |
| N. of overlapping | -0.065*** |
| working hoursij | (0.023) |
| Log distanceik | -0.027 |
| (0.039) | |
| Log distancekj | -0.146*** |
| (0.044) | |
| Log distanceij | -0.309*** |
| (0.049) | |
| Homeik | 3.120*** |
| (0.139) | |
| Homekj | 3.568*** |
| (0.119) | |
| Homeij | -0.358* |
| (0.184) | |
| Observations | 1,281,743 |
| Fixed effects | i, k, j |
| Standard gravity controls | ik, kj, ij |
| Note: Standard errors clustered by i j in | |
| parentheses (*** p0.01, ** p0.05, * p0.1). | |
Table 4 shows results for our variable of interest, the ease of communication. Indirect investments increase with the ease of communication between parent and middleman (5.9%), and the same is observed in the relationship between middleman and final, with a slightly larger magnitude of the effect (8.8%). On the contrary, the ease of communication between a parent and its final subsidiaries seems to discourage indirect investments. This might suggest that an indirect path is more convenient when the parent is less able to communicate in real-time with the final. Also, it is noteworthy that opposite signs are observed for the effect of overlapping working hours. To further investigate this, we look at the interaction between the effects of the ease of communication on the different sides of the triangle. We stick to the specification in Eq.2 and simply add an interaction term between and
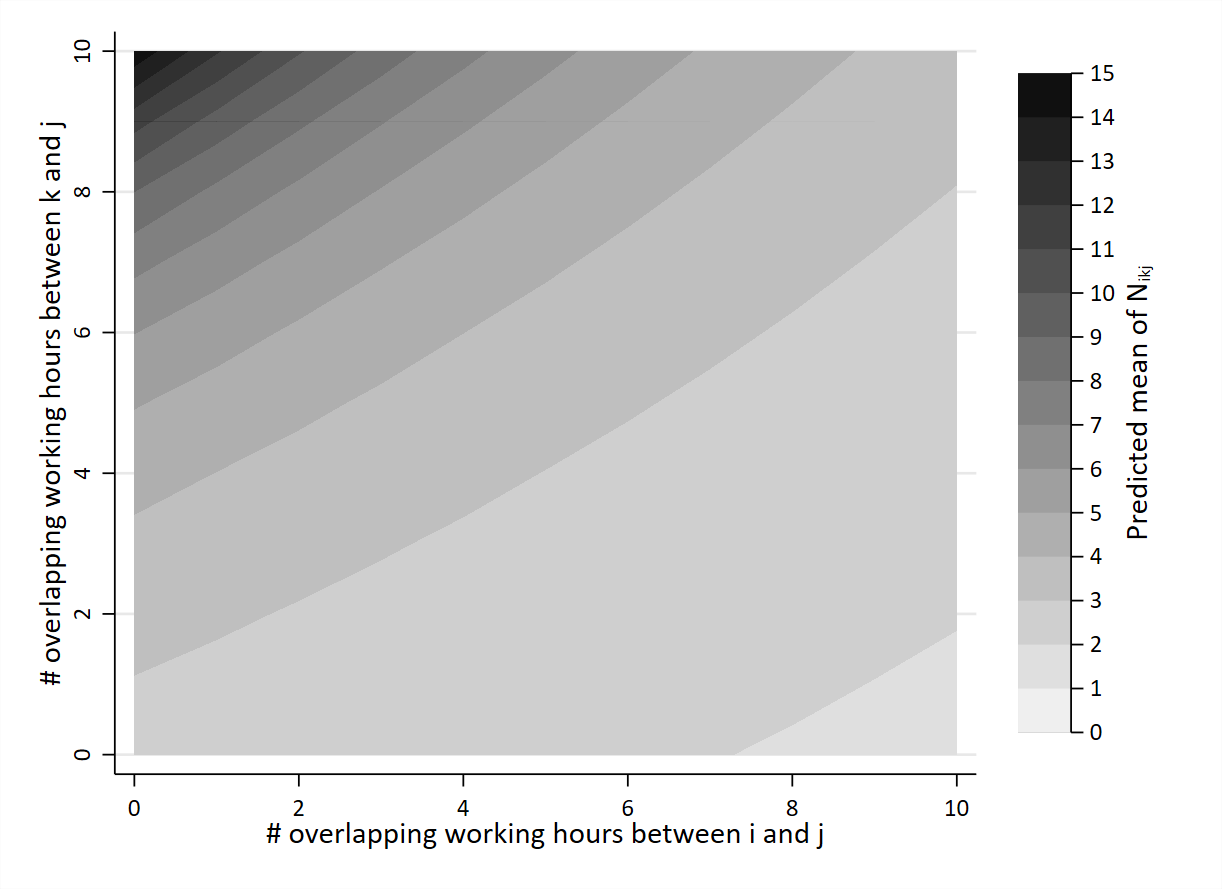
To better understand the interplay between the two effects, we represent predictions from our model in Figure 3. The latter reports on the axes the number of overlapping working hours separating a final subsidiary from the parent (x-axis) and the middleman (y-axis). The legend details the predicted value for indirect investments at all the possible combinations of and levels. The curvature of the lines in the graph captures the interaction term and shows how the coefficient of varies across the different levels of and vice versa. As already read in table 4, a difficult communication between the parent and the final, and, on the other side, an improved communication between the middleman and the final subsidiary correlates with a higher number of indirect control paths. A further element we deduce from the graph is that, since curves are increasing and convex, the positive effect of intensifies as the number of working hours a parent shares with its final subsidiary decreases.
-
•
Note: This graph shows how the predicted mean of varies according to different values of both and . The curvature of the lines in the graph captures the interaction term and shows how the coefficient of varies across the different levels of and vice versa. For high values of , an increase in has a positive but nuanced effect on the predicted mean of . For low values of , the positive effect of on the predicted mean of is much stronger.
3 Theoretical model
Motivated by previous preliminary evidence, we present a variation on the model by Head and Ries (2008) to introduce ownership chains in multinational enterprises. In this framework, investments are determined by competition to control foreign assets, where the headquarters might choose to monitor activities carried out by remote subsidiaries incurring a cost. Our extension introduces an intermediate level of investment between the competing company and the final target to allow for the presence of middlemen subsidiaries. We assume that, differently from the original model, monitoring tasks can be delegated to intermediate subjects. Therefore, we configure a delegation of monitoring framework, where the decision process faced by a parent company can be divided into two steps. The parent participates in an auction for a final target and, conditional on the final target location, chooses where to locate the monitoring unit to minimize monitoring costs.
| Subsidiary | ||||
| Parent | q | |||
| (1-q) | ||||
In the original Head and Ries (2008)’s set-up, costs and benefits of controlling a subsidiary are defined through an inspection game between a parent company and a subsidiary. Strategies and payoffs for the two players are reported in normal form in Table 5. Control gains are given by the value produced by the controlled subsidiary (b), which is conditional on the effort exerted by the subsidiary’s manager (e). Managers may choose to shirk, in which case . However, the parent can sustain a cost (c) to verify the manager’s activity and avoid paying the salary (w) every time a manager does not work. The authors assume , which implies no Nash equilibrium in pure strategies. Hence, the parent company will not always choose one strategy over the other, and, in a mixed strategy equilibrium, will maximize its expected payoff to obtain the value function:
| (3) |
where a is the value added that the parent company produces regardless of the game’s development. Eq.3 represents a parent’s evaluation of the final subsidiary. All parent companies on the market, respectively, play the inspection game with each of the subsidiaries on the market and evaluate each of them according to Eq.3. For each subsidiary, a competition is set among all parent companies to obtain control stakes. The parent company offering the highest evaluation wins the competition.
Up to this point, we accept Head and Ries (2008)’s model assumptions. A substantial change from the original model comes with the definition of c. Originally, monitoring costs were an increasing function of the bilateral distance between the parent’s and subsidiary’s country. In our extension, parent companies are not able to directly supervise subsidiaries as they lack time or technology333As in the first axiom from Tirole (1986): ”The principal, who is the owner of the vertical structure or the buyer of the goods produced by the agent, or, more generally, the person who is affected by the agent’s activity, lacks either the time or the knowledge required to supervise the agent”.. Thus, a parent cannot verify a subsidiary’s effort without delegating to a third managerial unit, the middleman. Note that, with respect to the literature modelling delegation of monitoring within hierarchical corporate structures (Holmstrom and Tirole, 1989), we are implicitly making a series of assumptions. Firstly, we assume no information asimmetry between parent company and middlemen, as the parent perfectly observes middleman’s effort. Secondly, we rule out any possibility of side contracting, which excludes collusion between the middleman and the subsidiary. To conclude, we assume middleman’s effort to be exogenous. In the upcoming section, we show how these assumptions modify the decision process of the parent company and, accordingly, monitoring costs in Eq.3.
A parent company willing to monitor a subsidiary will now need to shift control to a third corporate entity, i.e. a middleman. Both shifting control and supervising entail a cost. Hence, a parent located in country i, willing to monitor a subsidiary in country j, has to minimize the following cost function:
where is the cost for a middleman in country k to monitor a subsidiary in country j. is the cost for a parent in country i to delegate monitoring functions to a middleman in country k. Importantly, we assume . Note that the degree of delegation can vary from firm to firm, with the extreme case of full delegation where the is zero. We assume s to be independently and identically distributed according to a Type I extreme value distribution. The probability that a parent located in country i picks country k as a monitoring location, conditional on investing in country i, is equal to the probability that is the smallest possible. This yields
| (4) |
where if a parent company in country i willing to invest in country j locates her monitoring unit in country k. F[•] is the joint cumulative distribution function, which is conditional on the value of . Integrating F(.) using the marginal probability we obtain the unconditional probability (the probability of choosing k as monitoring location for any given realization of ).
Since are iid, the conditional probability is the product of univariate cumulative density functions:
| (5) | ||||
Using the change of variable and integrating by substitution:
Therefore, the probability that a parent located in country i chooses country k as a location to monitor a subsidiary located in j is given by:
| (6) |
where the denominator represents the expected cost of monitoring a subsidiary in country j for a parent located in country i:
The inspection game described before is modified as follows. We replace the bilateral monitoring cost with the multilateral monitoring cost index . Value function in Eq.3 becomes
| (7) |
3.1 Competition for corporate control
After defining the multilateral cost index , we go back to Head and Ries (2008) derivation. Parent companies compete to obtain control over final subsidiaries. The competition takes the form of an auction (one auction for each final subsidiary). Each parent company participates in each auction, making a valuation of the final subsidiary given by Eq.7, and the highest valuation wins the auction. The marginal probability for a parent in country i to win an auction and obtain control over a subsidiary in country j is equal to the probability that the highest valuation for a given subsidiary in j is done by a parent company located in i (i.e., the maximum valuation in i is the highest among all the other countries’ maxima).
where if a parent located in i controls a final subsidiary located in j. We denote by the number of parent companies in country i. is distributed as a Gumbel with parameters and and the maximum of Gumbel draws is distributed as a Gumbel with same and right-shifted by a quantity . After reproducing the same passages shown in Eq.4 and Eq. 5, and integrating by substitution, we obtain the probability that a parent located in country i wins the auction for a subsidiary located in j:
| (8) |
4 The structural model
In this section, we illustrate the empirical strategy we adopt to identify the structural parameters of the delegation of monitoring model. We first need to deliver an estimable version of Eq.6, which defines the parent’s behaviour when picking the location of monitoring units. We assume to be the same for all parent companies and sum location choices into a variable counting the number of parent companies in country i that delegates to middlemen in country k the monitoring of final subsidiaries in country j. The superscript I specifies we refer to indirect control paths only. The expected value of is then given by:
| (9) | ||||
where counts the total number of indirect control paths connecting a parent in country i to a final subsidiary in country j. In our framework, we conceive both the delegation and monitoring cost as governed by frictions to real-time communication. Yet, to estimate Eq.9, we interpret and as the inverse of a cost, and establish their empirical content to be given by the number of overlapping working hours. Thus, we denote by and the number of shared working hours between parent and middleman, and between middleman and final, respectively, and assume them to enter with a positive sign in the following structural gravity specification.
| (10) |
Equation 10 expresses a triangular gravity for the share of indirect control paths that pass through country k. Thus, the bilateral fixed effect allows to recover the multilateral cost of monitoring , which we will use later in a second step of the estimation process. We also add two vectors of standard bilateral controls, and . includes geographic distance, and a set of indicator variables for geographic contiguity, common language, common legal origins, colony dependence and regional trade agreements. We now turn to the final investment decision described in Eq.8. As already done before, we let the probability of choosing destination j be constant among parent companies in a given country i. Investment choices are then aggregated into the variable , where the superscript A indicates we are summing up all the final subsidiaries in j held by parent companies located in i through both direct and indirect control paths. The expression for the expected value of is
| (11) |
where and stands for the total number of subsidiaries operating in j. The term sums up the average productivity level of competitors from other countries, weighed by the cost they face when monitoring activities in j. Thus, we consider as a measure of the degree of competition for corporate control in market j. To estimate Eq.8, we let the share of the world’s parent companies headquartered in j and their average productivity to be enclosed into a parent’s country fixed effect, implying . Fixed effects on j are instead introduced to capture the size and competitiveness of the destination market, . With , the structural gravity for final investments is given by:
| (12) |
5 Results
We proceed estimating structural equations 10 and 12 using our sample of complex MNEs. The empirical version of Eq.10 is obtained computing the actual share of indirect ownership chains visiting country k and adding two vectors of standard bilateral controls, and . includes geographic distance, and a set of indicator variables for geographic contiguity, common language, common legal origins, colony dependence and regional trade agreements. We thus get to
| (13) |
where stands for bilateral fixed effects between the parent and the final subsidiary locations. Coefficients of bilateral fixed effects yield the vector of multilateral monitoring costs, thus, once estimates for are retrieved from Eq.13, we sum up the observed number of both direct and indirect investments into and obtain the empirical equivalent of Eq. 12
| (14) |
where and respectively stand for origin and destination fixed effects. Following Silva and Tenreyro (2006), we use the Poisson Pseudo Maximum Likelihood estimator and report in Table 6 coefficients for each of the two gravity equations. First column shows results for the trilateral gravity equation specified in Eq.10, which defines the geographical distribution of middlemen.
We find the ease of monitoring to be relevant for middlemen’s location. Increasing by 1 the number of overlapping working hours between middlemen and final locations raises the expected share of indirect control paths passing though k by 10% ()444 Coefficients in a Poisson regression are interpreted as semi-elasticity.. Also, the number of overlapping hours between parents and middlemen is significantly positive, implying that a lower cost of delegation encourages the deployment of monitoring units in a given country. Hence, our variables of interest enter the gravity with the expected sign. As assumed in our model, results confirm the cost of delegation to be less binding than the cost of monitoring. The effect of a decrease in the latter (0.1) is twice the effect of a decline in the former (0.05). All the other bilateral variables are out-of-model standard controls that do not interfere with the control activity of the parent. These are the traditional predictors commonly found in empirical gravity applications to FDI. We introduce them to capture frictions hindering all the other economic interactions possibly generated by an investment decision. To mention a relevant example, beyond intra-group coordination activities, there might be horizontal and vertical integration choices (see theoretical foundations for FDI gravity, such as Kleinert and Toubal (2010) and Bergstrand and Egger (2007)), which heavily depend on the cost of transporting goods and affect the location of investments. Physical distance and proxies for cultural proximity between countries obey the gravity model. Distance has a negative impact which is way stronger in the relationship between middlemen and final subsidiaries, where we find a -17.3 elasticity of the indirect control paths share, against -4.8 observed between parent companies and middlemen. The opposite is observed for the dummy indicating the existence of a regional trade agreement: coefficients are always positive and around 1. The historical and cultural ties a given location has with both the parent and the final subsidiary country foster intermediate investments. The second column of Tab.6 reports estimates of the bilateral gravity for final investments. Estimates of the vector of multilateral cost indexes s are derived from bilateral fixed effects in Eq.10. As already mentioned, represent the expected cost of monitoring subsidiaries in country j for a parent in country i, and, as largely expected, it affects negatively MNEs investments.
| Location: | Middlemen | Final subsidiaries | |
| Dep. var. | |||
| N. of overlapping | 0.051*** | ||
| working hoursik | (0.005) | ||
| N. of overlapping | 0.098*** | ||
| working hourskj | (0.006) | ||
| (km) | -0.049*** | ||
| (0.011) | |||
| (km) | -0.190*** | ||
| (0.013) | |||
| 1.169*** | |||
| (0.026) | |||
| 0.907*** | |||
| (0.025) | |||
| 0.733*** | |||
| (0.030) | |||
| 0.391*** | |||
| (0.032) | |||
| 1.382*** | |||
| (0.048) | |||
| 1.585*** | |||
| (0.047) | |||
| 0.280*** | |||
| (0.027) | |||
| 0.214*** | |||
| (0.025) | |||
| 5.317*** | |||
| (0.049) | |||
| 3.735*** | |||
| (0.054) | |||
| -1.004*** | |||
| (0.090) | |||
| Observations | 1,288,546 | 7,309 | |
| Fixed effects | i,j |
-
•
Standard errors clustered by origin-destination dyads in parentheses (*** p0.01, ** p0.05, * p0.1).
6 Robustness checks
We subject our gravity estimates to a set of robustness checks to address two main concerns. First, as we claim that communication motives determine the location of subsidiaries, we need to ensure that coefficients of interest stay significant when controlling for other possible explanations. Fiscal optimization reasons most certainly play a role, as well as factor costs minimization. In Table 7 we report some alternative specifications of the baseline gravity. As we can see in column (1), gravity results remain almost unaltered when we add differentials in corporate taxation555Differentials are expressed as the ratio between destination and origin profit tax, where the latter is sourced by the World Bank’s Doing Business database for the year 2019 and measures the total amount of taxes paid by the business as a percentage of commercial profits. (CT) between origin and destination country (coefficients for the ease of communication both scale up by the same amount). Note that the share of indirect investments passing through country k increases when the tax environment of k is more favourable with respect to both the parent and final investment location. In column (2), we augment the gravity with differentials in the cost of labour666Differentials are expressed as the ratio between destination and origin compensation of employees, where the latter is sourced by the World Bank’s Doing Business database for the year 2019. (LC) and, again, we do not find any relevant change with respect to estimates in column (1) of Tab. 6. Finally, in column (3), we include an additional proxy for the ease of communication between countries, i.e. the common language index (CLI) by Gurevich et al. (2021). This is an aggregate index of linguistic similarity between populations that accounts for several dimensions related to language, such as translation and interpretation, and, despite having a strong positive impact on investments, does not affect the coefficients of overlapping working hours.
Second, we need to check whether results are confirmed in subsamples of multinational ownership chains defined according to the primary operating industry. Table 8 reports new estimates from the triangular gravity in Eq.13 run over ownership chains of parent companies active in manufacturing, in column (1), and in service (finance and real estate excluded), in column (2). Column (3) reproduces estimates on cases where parent, middleman and final subsidiary all work in the finance sector777A company’s sector is identified according to NAICS 2017 classification at the 2-digit aggregation level. We define of finance sector merging “Finance and Insurance” (code 52) and “Real Estate and Rental and Leasing” (code 53). The service sector encompasses all the other entries related to service.. In manufacturing, we observe a widening in the gap between the ease of communication coefficients with respect to the baseline results, whereas we observe the opposite for financial companies, where a rise in the effect of sharing office hours between parent and middleman completely closes the gap. In service, coefficients remain stable. It follows that our assumption that delegation cost is lower than the monitoring one is confirmed in the service sample and even strengthened in the manufacturing. At the same time, in financial conglomerates, the ease of communication is equally important amid all companies involved in the ownership chain and, interestingly, distance in kilometers becomes irrelevant.
| Dep Var. | |||
| Control for | Tax differentials | Wage differentials | Common language |
| N. of overlapping | 0.078*** | 0.063*** | 0.048*** |
| working hoursik | (0.007) | (0.008) | (0.006) |
| N. of overlapping | 0.126*** | 0.115*** | 0.097*** |
| working hourskj | (0.007) | (0.008) | (0.006) |
| -0.006*** | |||
| (0.002) | |||
| 0.008*** | |||
| (0.000) | |||
| -0.844*** | |||
| (0.033) | |||
| -0.028 | |||
| (0.023) | |||
| CLIik | 1.792*** | ||
| (0.057) | |||
| CLIkj | 1.206*** | ||
| (0.055) | |||
| Log distanceik | -0.161*** | -0.221*** | -0.014 |
| (0.013) | (0.015) | (0.011) | |
| Log distancekj | -0.228*** | -0.265*** | -0.156*** |
| (0.016) | (0.018) | (0.013) | |
| 1.136*** | 0.920*** | 1.093*** | |
| (0.031) | (0.040) | (0.027) | |
| 0.881*** | 0.728*** | 0.835*** | |
| (0.030) | (0.037) | (0.026) | |
| 5.061*** | 4.203*** | 4.228*** | |
| (0.055) | (0.064) | (0.054) | |
| 3.716*** | 3.409*** | 3.056*** | |
| (0.064) | (0.068) | (0.056) | |
| Languageik | 0.717*** | 0.818*** | |
| (0.035) | (0.039) | ||
| Languagekj | 0.347*** | 0.547*** | |
| (0.037) | (0.042) | ||
| Colony dependenceik | 1.530*** | 1.383*** | 1.321*** |
| (0.051) | (0.053) | (0.048) | |
| Colony dependencekj | 1.684*** | 1.347*** | 1.478*** |
| (0.050) | (0.054) | (0.047) | |
| Legal originsik | 0.199*** | 0.311*** | 0.132*** |
| (0.030) | (0.034) | (0.028) | |
| Legal originskj | 0.171*** | 0.288*** | 0.122*** |
| (0.028) | (0.032) | (0.026) | |
| Observations | 912,444 | 501,500 | 1,288,546 |
| Fixed effects | |||
-
•
Note1: Standard errors clustered by origin-destination dyads in parentheses (*** p0.01, ** p0.05, * p0.1).
-
•
Note2: i, k and j stand for parent, middleman and final subsidiary location country, respectively. is the ratio between corporate tax rate in country k and corporate tax rate in country i; the same holds for . is the ratio between cost of labour in country k and cost of labour in country i. The same holds for .
| Dep. var. | |||
| Sample | Manufacturing | Service | Finance |
| N. of overlapping | 0.021*** | 0.041*** | 0.142*** |
| working hoursik | (0.0075) | (0.007) | (0.022) |
| N. of overlapping | 0.105*** | 0.096*** | 0.134*** |
| working hourskj | (0.008) | (0.008) | (0.023) |
| Log distanceik | -0.237*** | -0.117*** | -0.028 |
| (0.019) | (0.014) | (0.032) | |
| Log distancekj | -0.197*** | -0.201*** | -0.030 |
| (0.020) | (0.016) | (0.034) | |
| 0.818*** | 1.064*** | 0.637*** | |
| (0.040) | (0.036) | (0.090) | |
| 0.849*** | 0.867*** | 0.668*** | |
| (0.038) | (0.034) | (0.092) | |
| 4.099*** | 5.360*** | 4.892*** | |
| (0.077) | (0.062) | (0.151) | |
| 3.281*** | 3.605*** | 4.984*** | |
| (0.080) | (0.071) | (0.160) | |
| Languageik | 0.605*** | 1.023*** | 0.613*** |
| (0.046) | (0.041) | (0.096) | |
| Languagekj | 0.316*** | 0.449*** | 0.670*** |
| (0.047) | (0.044) | (0.111) | |
| Colony dependenceik | 0.863*** | 1.226*** | 0.940*** |
| (0.078) | (0.064) | (0.151) | |
| Colony dependencekj | 1.236*** | 1.658*** | 1.168*** |
| (0.074) | (0.060) | (0.156) | |
| Legal originsik | 0.244*** | 0.206*** | 0.473*** |
| (0.038) | (0.036) | (0.094) | |
| Legal originskj | 0.303*** | 0.184*** | 0.234** |
| (0.037) | (0.033) | (0.097) | |
| Observations | 464,032 | 712,212 | 127,599 |
| Fixed effects | |||
-
•
Note 1: Standard errors clustered by origin-destination dyads in parentheses (*** p0.01, ** p0.05, * p0.1).
-
•
Note 2: Column (1) and (2) report gravity results for the subsample of indirect ownership chains held by parent companies operating in the manufacturing and service (finance excluded) sectors, respectively. Coefficients in column (3) refer to parent-middleman-final combinations where all subjects belong to the finance sector. Sectors are defined according to the NAICS 2017 classification at the 2-digit level.
7 Conclusions
We analyse the importance of coordination of production in shaping the geography of corporate control networks, identifying the ability of communicating in real time as a driver for the location of subsidiaries along ownership chains. Thanks to a more sophisticated approach to MNE’s investments data, we manage to account for the position of subsidiaries along ownership chains and collect new insights on location determinants. We find that the ease of communication is an important driver that shapes trajectories of ownership in a multinational enterprise, although its impact is heterogeneous along ownership chains. At a preliminary level, we observe that the location of an MNE’s investments is not affected by the ease of communication with the parent company, but rather by the need to exchange information in real-time with intermediate subsidiaries inside the corporate boundaries. On top of that, the promoting effect of an easier communication between intermediate and final subsidiaries is actually intensified the more difficult it is for a parent to communicate with a final subsidiary. Moreover, we observe that intermediate investments show an unexplained divergence in the country-level determinants of location with respect to other subsidiaries. Motivated by these findings, we adapt the Head and Ries (2008) model of corporate control competition to allow for indirect control paths and provide theoretical underpinnings to a system of gravity equations explaining the geographic distributions of both intermediate and final subsidiaries. We propose a delegation of monitoring framework, where parent companies willing to supervise their subsidiaries must shift control to third companies sustaining a cost. We deploy data on worldwide MNEs’ corporate control networks to estimate structural parameters. We confirm our model predictions that a decrease in delegation and monitoring costs discourage middlemen location. Increasing the ease of communication between middlemen and final subsidiaries lower the expected share of indirect control paths passing through a given country by 10%. This value is twice the effect we find between parents and middlemen. This supports our model assumption claiming the cost of delegation to be less binding than the cost of monitoring for a parent company. We derive and estimate a multilateral cost of control, i.e. a bilateral index capturing the expected cost for a parent company to monitor a remote target in a given location. As predicted by our model, we find the expected cost of monitoring to negatively affect MNEs investments.
Appendix A: Ownership chains and corporate control networks
In this Appendix, we provide a better understanding of how raw ownership data are used to extract corporate control networks with Rungi et al. (2017)’ identification process, along with some statistics on the set of corporate control networks for year 2019.
A corporate control network is a hierarchy of legally autonomous firms headed by a parent company that exerts control over the others by means of shareholding links. In order to identify them, Rungi et al. (2017) propose a network oriented methodology based on the observation of the full matrix of ownership links (excluding non-corporate ultimate owners). Ownership structures can get extremely intricate. They can be characterized by complex patterns such as cross-holdings and ownership cycles, and companies can be indirectly connected through multiple sequences of ownership links. Rungi et al. (2017) manage to address this complexity and detect corporate control relationships developed through these ownership webs. A control relationship is set when a shareholder obtains the majority of voting rights in a company, i.e. more than 50% of capital shares888This is the definition of control accepted by international accounting standards, see for example the OECD Guidelines for multinational enterprises (OECD, 2005), the UNCTAD Training Manual on Statistics for FDI and the Operations of TNCs (UNCTAD, 2009) and the Eurostat Reccomendations Manual on the Production of Foreign Affiliates Statistics (Eurostat, 2007). and entails the ability to influence and contribute to the decision-making of another company. However, when a controller company is in turn controlled by a third entity, its decisions have to rely on decisions taken upstream, and this is when knowing the entire ownership structure becomes critically important. Besides the most elementary case where a parent directly hold the absolute majority (more than 50% of voting rights) in a subsidiary, Rungi et al. (2017) assume two ways for a parent to extend control on other companies: (i) by transitivity of control along vertical chains of subsidiaries, where each subsidiary has direct control on the subsequent one; (ii) by consolidation of shares, when a parent gains the majority of voting rights in an assembly by summing up capital shares owned by her subsidiaries999Rungi et al. (2017) also capture cases of dominant stakes, when a parent is able to control a subsidiary without holding an absolute majority. This occurs every time the ownership is extremely fragmented, to the point that other minority shareholders have no possibility to form a coalition and affect management decisions.. Thanks to an algorithm that repeatedly filters the original matrix of ownership links according to control rules defined above, this methodology allows to identify the ultimate controller, i.e. the parent company101010A parent company is defined as a company that controls one or more subsidiaries and is not controlled by any corporate shareholder., and its hierarchy of subsidiaries. For a detailed description of the methodology see Rungi et al. (2017)’s work.
-
•
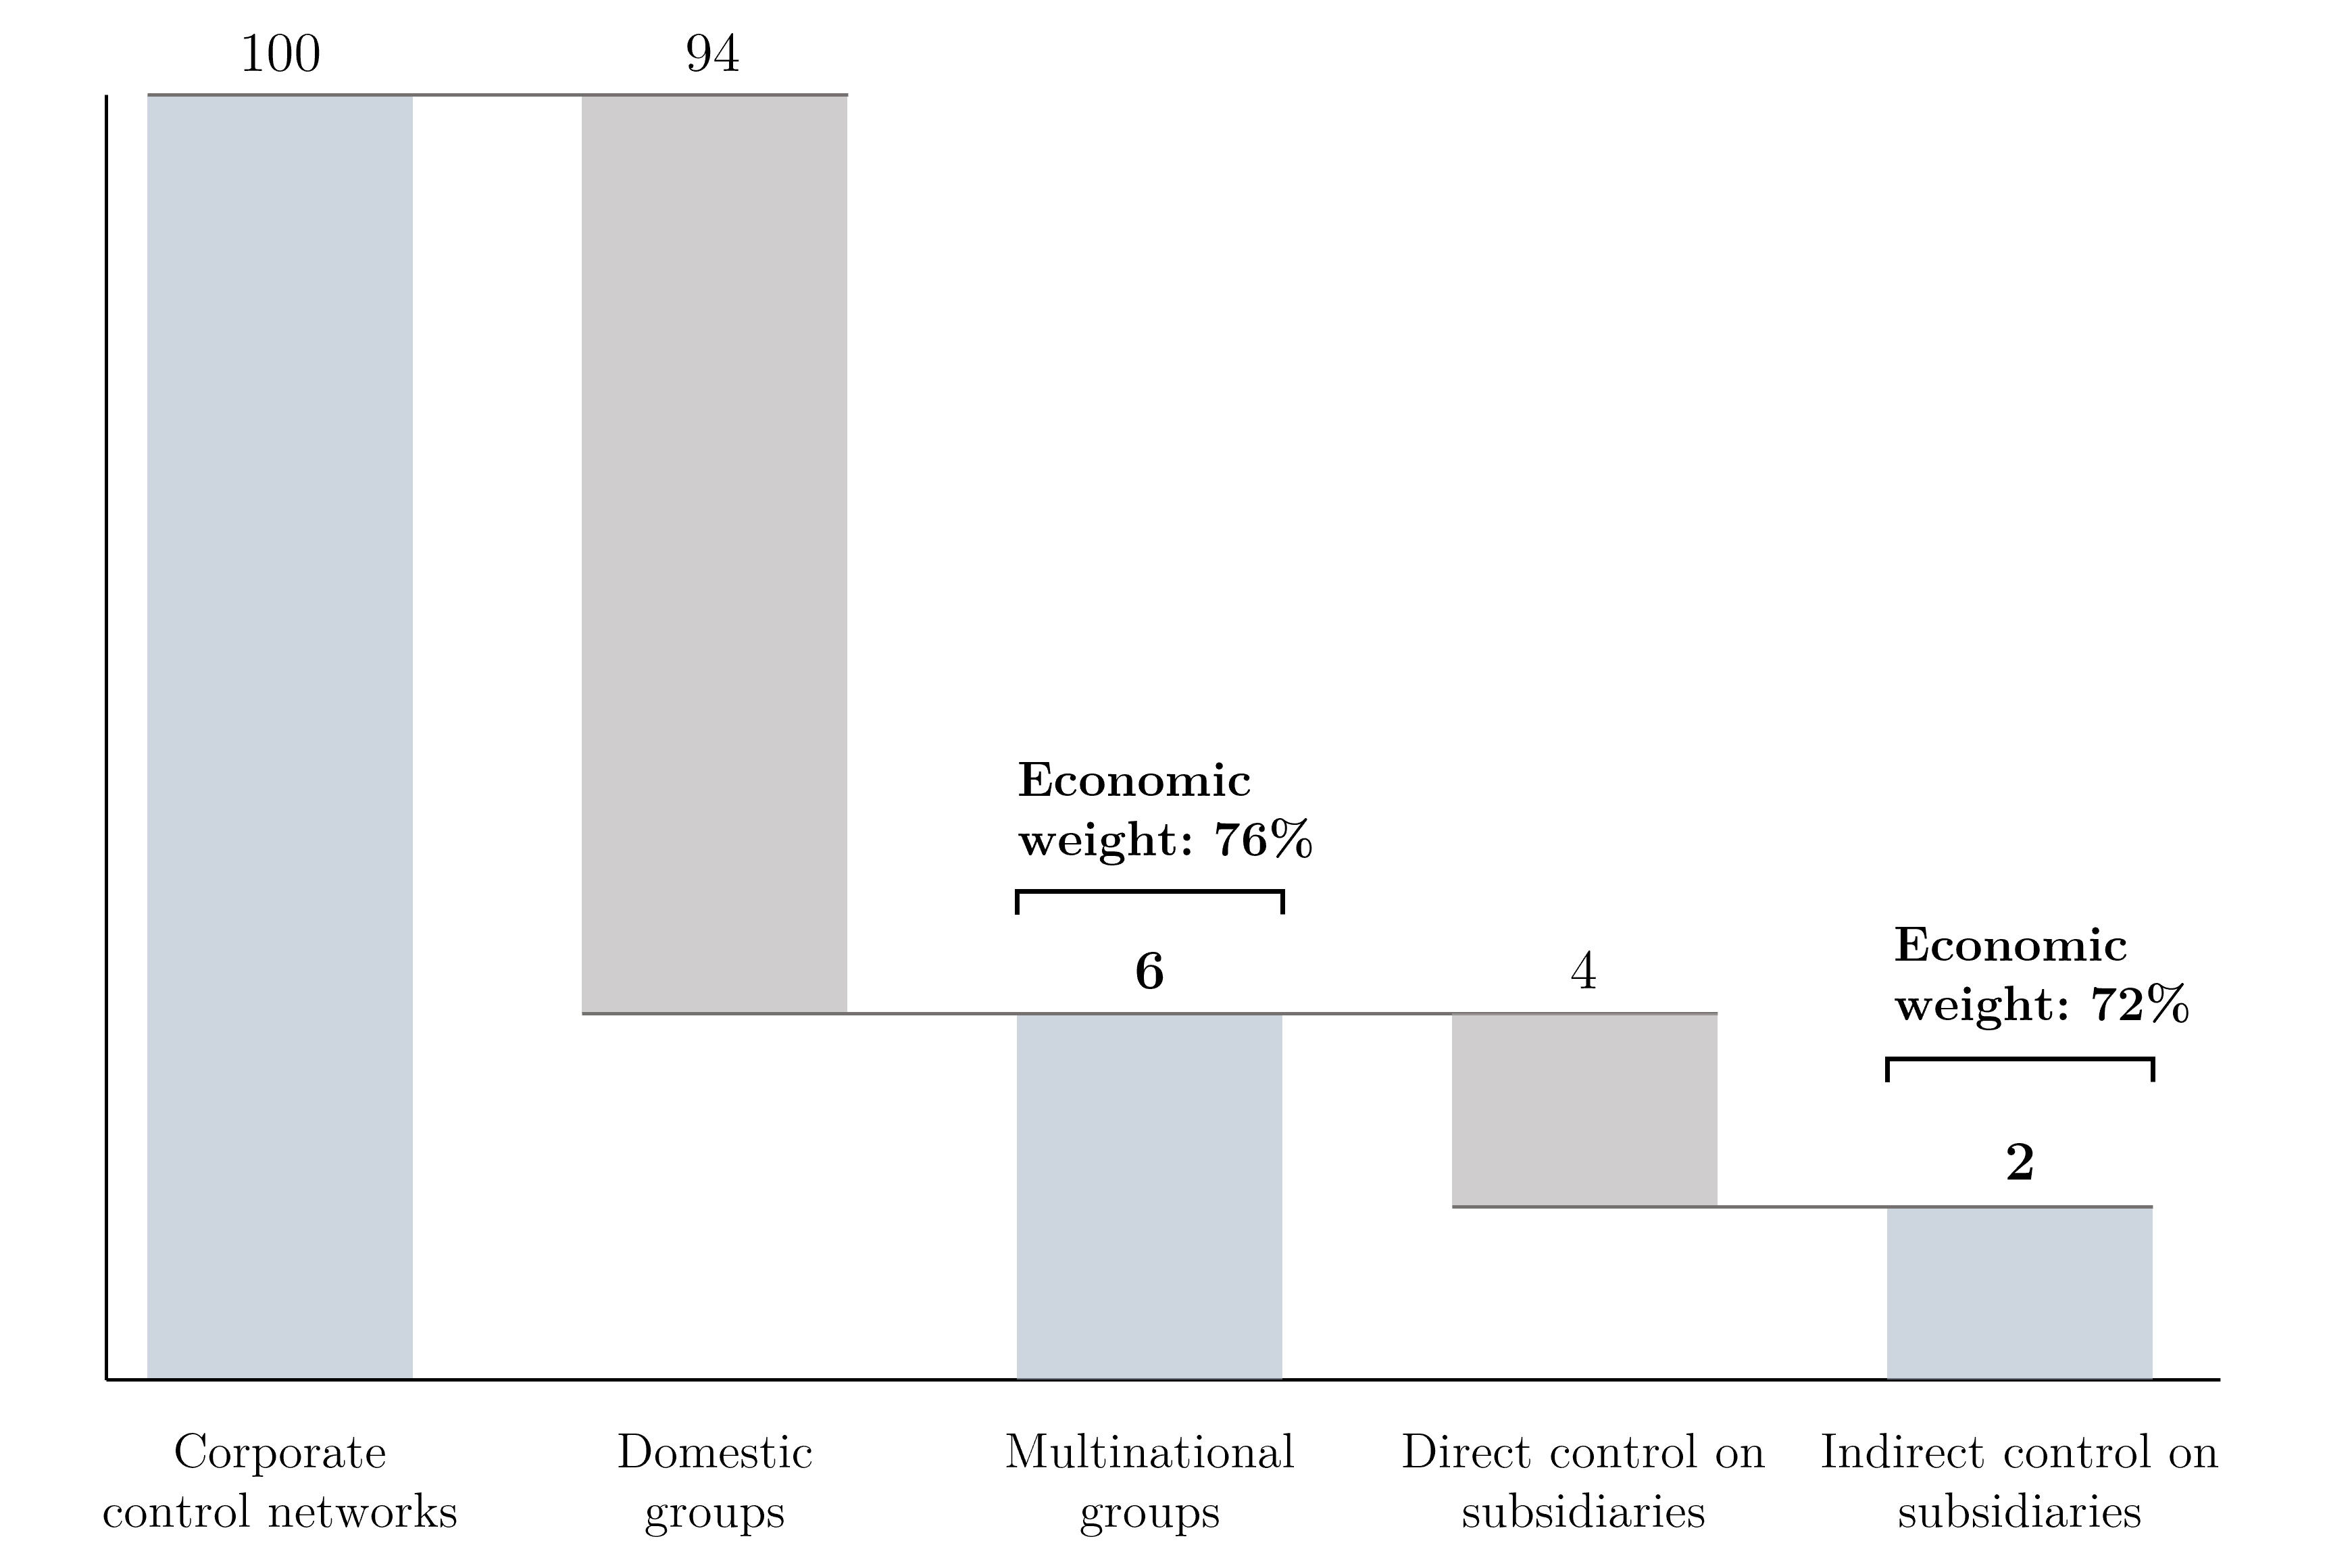
Note 1: The total sample of corporate control networks is broken down into domestic groups (when a parent company and all her subsidiaries are located in the same country) and multinational groups (when the parent company holds at least one foreign subsidiary in her corporate network). A further distinction is made between multinationals that control firms only through direct ownership links, and multinationals that indirectly control at least one subsidiary.
-
•
Note 2: Economic weight is estimated as the sum of operating revenues generated by the firms within the corporate control boundaries, parent company included. Data on operating turnover for 2019 are sourced from Orbis.
-
•
Note 3: Starting from a sample of 4,095,482 corporate control networks, the 94% are domestic groups. Albeit multinational groups represent the 6%, they account for the 76% of total revenues produced by our sample of companies in 2019. Multinational enterprises developing indirect control links are 2% of the sample, yet their network of firms contribute to 72% of total revenues.
We identify 4,095,482 corporate control networks, each headed by a parent company. Figure A1 illustrates the sample composition. Multinationals, which we identify as business groups crossing country borders at least once, amount to a total of 226,993 observations. Although multinational groups represent a residual share of the sample, their economic weight is relevant. As a matter of fact, firms belonging to multinational groups produce the 76% of the total operating revenues observed in our sample. The sample narrows further as we consider multinational groups featuring indirect control relationships. Only 2% of identified networks include cases where the parent controls at least one subsidiary through a chain made of one or more middlemen and spanning more than one country. Yet, turnover generated within such complex structures accounts for 72% of the total.
| All (N=4,095,482) | Multinational (N=226,993) | Domestic (N=3,868,489) | ||||||||||||||
| Mean | SD | Min. | Max. | Mean | SD | Min. | Max. | Mean | SD | Min. | Max. | |||||
|
1.93 | 12.40 | 1 | 5,075 | 7.93 | 50.09 | 1 | 5,075 | 1.58 | 3.65 | 1 | 1,989 | ||||
| # of middlemen | 0.12 | 1.89 | 0 | 688 | 1.18 | 7.72 | 0 | 688 | 0.06 | 0.45 | 0 | 95 | ||||
|
1.81 | 10.70 | 1 | 4,305 | 6.68 | 42.92 | 1 | 4,305 | 1.52 | 3.41 | 1 | 1,988 | ||||
|
1.10 | 1.01 | 1 | 147 | 2.81 | 3.92 | 2 | 147 | 1 | 1 | 1 | 1 | ||||
-
•
Note: We report some statistics on the main features related to the structure of corporate control networks, such as dimension, shape and geographic spread. We distinguish between multinational and domestic groups.
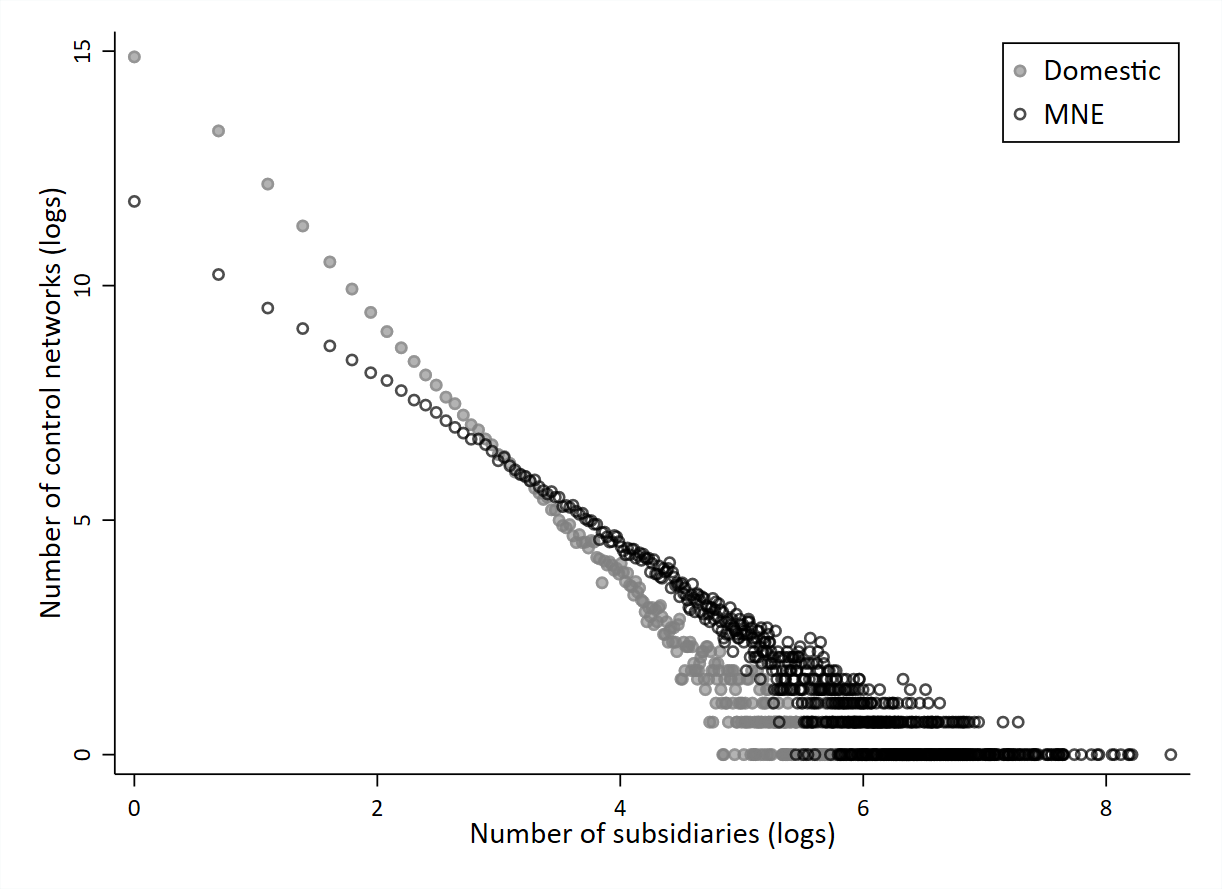
In Tab.A1, we provide some statistics on the main features related to the structure of corporate control networks, such as dimension, shape and geographic spread. At first glance, multinational groups tend to be bigger in terms of number of controlled firms, with an average of 7 subsidiaries against less than 2 reported for domestic groups. Yet, the former value does not adequately reflect the high incidence of simple organisational structures among multinationals, due to overdispersion in the right tail of their size distribution. This is made evident when looking at Fig.A2, where we compare the distribution by size of domestic and multinational corporate networks. Both plots show high concentration on the lowest values of the number of subsidiaries, while cases of large corporate groups are few. 58.5% (74.7%) of multinational (domestic) networks de facto are composed by two companies, a subsidiary and a parent that directly owns it.
-
•
Note: Size of control networks is measured as the logarithm of the number of subsidiaries on the x-axis. On the y-axis, we report the number of control networks by size in logarithmic scale.
References
- Altomonte et al. (2021) Altomonte, C., Ottaviano, G. I., Rungi, A., Sonno, T., 2021. Business groups as knowledge-based hierarchies of firms, online available.
- Altomonte and Rungi (2013) Altomonte, C., Rungi, A., 2013. Business groups as hierarchies of firms: determinants of vertical integration and performance, online available.
- Anderson et al. (2019) Anderson, J. E., Larch, M., Yotov, Y. V., 2019. Trade and investment in the global economy: A multi-country dynamic analysis. European Economic Review 120, 103311.
- Arkolakis et al. (2018) Arkolakis, C., Ramondo, N., Rodríguez-Clare, A., Yeaple, S., 2018. Innovation and production in the global economy. American Economic Review 108 (8), 2128–73.
- Bahar (2020) Bahar, D., 2020. The hardships of long distance relationships: time zone proximity and the location of mnc’s knowledge-intensive activities. Journal of International Economics 125, 103311.
- Bénassy-Quéré et al. (2007) Bénassy-Quéré, A., Coupet, M., Mayer, T., 2007. Institutional determinants of foreign direct investment. World economy 30 (5), 764–782.
- Bergstrand and Egger (2010) Bergstrand, J., Egger, P., 2010. A general equilibrium theory for estimating gravity equations of bilateral fdi, final goods trade and intermediate goods trade. The Gravity Model in International Trade: Advances and Applications, Cambridge University Press, New York, 29–70.
- Bergstrand and Egger (2007) Bergstrand, J. H., Egger, P., 2007. A knowledge-and-physical-capital model of international trade flows, foreign direct investment, and multinational enterprises. Journal of International Economics 73 (2), 278–308.
- Dyreng et al. (2015) Dyreng, S. D., Lindsey, B. P., Markle, K. S., Shackelford, D. A., 2015. The effect of tax and nontax country characteristics on the global equity supply chains of us multinationals. Journal of Accounting and Economics 59 (2-3), 182–202.
- Eaton and Kortum (2002) Eaton, J., Kortum, S., 2002. Technology, geography, and trade. Econometrica 70 (5), 1741–1779.
- Eaton and Tamura (1994) Eaton, J., Tamura, A., 1994. Bilateralism and regionalism in japanese and us trade and direct foreign investment patterns. Journal of the Japanese and international economies 8 (4), 478–510.
- Egger and Pfaffermayr (2004) Egger, P., Pfaffermayr, M., 2004. The impact of bilateral investment treaties on foreign direct investment. Journal of comparative economics 32 (4), 788–804.
- Eurostat (2007) Eurostat, 2007. Reccomendations Manual on the Production of Foreign Affiliates Statistics. Eurostat Methodologies and working papers.
- Garicano (2000) Garicano, L., 2000. Hierarchies and the organization of knowledge in production. Journal of political economy 108 (5), 874–904.
- Gurevich et al. (2021) Gurevich, T., Herman, P., Toubal, F., Yotov, Y. V., 2021. One nation, one language? domestic language diversity, trade and welfare, online available.
- Head and Mayer (2019) Head, K., Mayer, T., 2019. Brands in motion: How frictions shape multinational production. American Economic Review 109 (9), 3073–3124.
- Head and Ries (2008) Head, K., Ries, J., 2008. Fdi as an outcome of the market for corporate control: Theory and evidence. Journal of International Economics 74 (1), 2–20.
- Holmstrom and Tirole (1989) Holmstrom, B. R., Tirole, J., 1989. The theory of the firm. Handbook of industrial organization 1, 61–133.
- Kleinert and Toubal (2010) Kleinert, J., Toubal, F., 2010. Gravity for fdi. Review of International Economics 18 (1), 1–13.
- Lewellen and Robinson (2013) Lewellen, K., Robinson, L. A., 2013. Internal ownership structures of us multinational firms. Available at SSRN 2273553.
- Mutti and Grubert (2004) Mutti, J., Grubert, H., 2004. Empirical asymmetries in foreign direct investment and taxation. Journal of International Economics 62 (2), 337–358.
- OECD (2005) OECD, 2005. Guidelines for Multinational Enterprises. OECD Publishing.
- Rungi et al. (2017) Rungi, A., Morrison, G., Pammolli, F., 2017. Global ownership and corporate control networks. IMT Lucca EIC WP Series 7.
- Silva and Tenreyro (2006) Silva, J. S., Tenreyro, S., 2006. The log of gravity. The Review of Economics and statistics 88 (4), 641–658.
- Stein and Daude (2007) Stein, E., Daude, C., 2007. Longitude matters: Time zones and the location of foreign direct investment. Journal of International Economics 71 (1), 96–112.
- Tintelnot (2017) Tintelnot, F., 2017. Global production with export platforms. The Quarterly Journal of Economics 132 (1), 157–209.
- Tirole (1986) Tirole, J., 1986. Hierarchies and bureaucracies: On the role of collusion in organizations. JL Econ. & Org. 2, 181.
- UNCTAD (2009) UNCTAD, 2009. Training manual on statistics for FDI and the operations of TNCs. United Nations.
- UNCTAD (2016) UNCTAD, 2016. World investment report 2016. Investor nationality: Policy challenges. United Nations.
- Wang (2021) Wang, Z., 2021. Headquarters gravity: How multinationals shape international trade. Journal of International Economics 131, 103477.