Negligible Effects of Baryons on the Angular Momentum Scaling Relations of Galactic Dark Matter Halos
Abstract
In cosmological simulations without baryons, the relation between the specific angular momentum and mass of galactic dark matter halos has the well-established form . This is invariably adopted as the starting point in efforts to understand the analogous relation between the specific angular momentum and mass of the stellar parts of galaxies, which are often re-expressed relative to the corresponding halo properties through the retention fractions and . An important caveat here is that the adopted relation could, in principle, be modified by the gravitational back-reaction of baryons on dark matter (DM). We have tested for this possibility by comparing the – relations in the IllustrisTNG100 and TNG50 simulations that include baryons (full-physics runs) with their counterparts that do not (DM-only runs). In all cases, we find scaling relations of the form , with over the ranges of mass and redshift studied here: and . The values of are virtually identical in the full-physics and DM-only runs at the same redshift. The only detectable effect of baryons on the – relation is a slightly higher normalization, by 12%–15% at and by 5% at . This implies that existing estimates of based on DM-only simulations should be adjusted downward by similar amounts. Finally, we discuss briefly some implications of this work for studies of galaxy formation.
1 Introduction
Two of the most basic properties of cosmic structures are their mass and angular momentum or, equivalently, and specific angular momentum . The relation between and for a population of objects reflects the physical processes by which they form and evolve. In cold dark matter-type cosmologies, bound structures in virial equilibrium develop from small perturbations in the early universe by gravitational instability. Throughout this development, but especially in the translinear phase of growth, they acquire angular momentum from the tidal torques exerted by neighboring perturbations (Peebles, 1969; Doroshkevich, 1970; White, 1984).
These processes are now well understood in cosmologies that include only gravitationally interacting dark matter (DM), usually thought to provide a good description of galactic halos. The results of cosmological -body simulations are often expressed in terms of the spin parameter , where is the total energy (potential plus kinetic) of a halo, and is the gravitational constant. The median spin value, derived from many DM-only (DMO) simulations, is , irrespective of cosmological parameters and the mass and density contrast of the halos (Bullock et al., 2001; van den Bosch et al., 2002; Avila‐Reese et al., 2005; Bett et al., 2007; Macciò et al., 2007, 2008; Zjupa & Springel, 2017). This implies a relation between the specific angular momentum , mass , and mean internal density of halos of the form (given the scalings and with mass and radius ). For a fixed density contrast, constant, this becomes . The same simulations show that the dispersions of and about their median values at each are substantial: –.
The optically visible stellar components of galaxies obey a remarkably similar scaling relation: , with an exponent and an amplitude that correlates with disk fraction and morphological type (Fall, 1983; Romanowsky & Fall, 2012; Fall & Romanowsky, 2013; Obreschkow & Glazebrook, 2014; Fall & Romanowsky, 2018; Posti et al., 2018; Di Teodoro et al., 2021; Mancera Piña et al., 2021a, b; Hardwick et al., 2022; Di Teodoro et al., 2023; Pulsoni et al., 2023). This apparently simple stellar – relation is less straightforward to interpret than the corresponding halo relation because it must reflect the complicated combined effects of cooling, collapse, star formation, black hole growth, and feedback in the baryonic components of galaxies. With this in mind, it is often useful to re-express the stellar – relation relative to the better-understood halo relation in terms of the “retention fractions” for mass, , and specific angular momentum, , the subscripts and h now specifying stellar and halo quantities explicitly. The mass retention fraction is also known as the stellar-to-halo mass relation (SHMR).
In calculations of the retention fraction for specific angular momentum , the reference – relation is invariably taken to be the one derived from DMO simulations, . This is equivalent to assuming, at least implicitly, that the baryonic processes involved in the formation of the luminous bodies of galaxies have a negligible effect on the halo – relation. While plausible, this is not guaranteed to be true. Indeed, Du et al. (2022) have suggested that the gravitational back-reaction of baryons on the halo – relation is significant and necessary to explain the observed stellar – relation and the associated retention fraction . We tested for this possibility during our recent comprehensive study of galactic angular momentum in the IllustrisTNG simulations (Rodriguez-Gomez et al., 2022) and reached a different conclusion. The purpose of this Letter is to present the results of these tests.
2 Simulations and Analysis
We examine the – and – relations of halos in four simulations of the IllustrisTNG suite: the TNG100 and TNG50 runs, which include both baryons and DM, and their DMO counterparts, TNG100-Dark and TNG50-Dark. Our analysis is based on quantities we have computed from the positions and velocities of particles at different snapshots in the publicly accessible IllustrisTNG data files (Nelson et al., 2019a). For complete descriptions of the simulations, we refer interested readers to the original papers (Marinacci et al., 2018; Naiman et al., 2018; Nelson et al., 2018; Pillepich et al., 2018; Springel et al., 2018; Nelson et al., 2019b; Pillepich et al., 2019). Here, we provide only a brief summary, sufficient to interpret the results presented in Section 3.
The TNG100 and TNG50 runs include plausible subgrid prescriptions for star formation and black hole growth, as well as feedback from supernovae and active galactic nuclei (AGNs). We refer to them as “full-physics” (FP) runs. These simulations produce populations of galaxies that resemble real ones in many respects, including galactic masses and specific angular momenta (Du et al., 2022; Rodriguez-Gomez et al., 2022). The main differences between the TNG100 and TNG50 runs are their volumes (cubes with comoving 100 Mpc and 50 Mpc sides) and numerical resolutions ( for DM and for baryons in TNG100, and 16 times better for both in TNG50). Thus, TNG100 is preferred for studies of massive galaxy populations and TNG50 for low-mass populations. The DMO runs have the same volumes and initial conditions as the corresponding FP runs. To make precise comparisons between the simulations with and without baryons, we have matched the halos in the DMO runs individually with their counterparts in the FP runs using the procedure described by Rodriguez-Gomez et al. (2017).
Halos in the simulations are identified by the friends-of-friends (FoF) algorithm (Davis et al., 1985) and gravitationally bound subhalos within them by the subfind algorithm (Springel et al., 2001; Dolag et al., 2009). Following standard practice, we measure positions within each halo relative to the most tightly bound particle and velocities relative to the center-of-mass motion111The specific angular momentum computed in this reference frame is exactly the same as that in a frame defined by both the center-of-mass position and velocity, as one can show by simple algebra. (Genel et al., 2015; Zjupa & Springel, 2017). We compute all halo quantities, denoted by the subscript h, by including both DM and baryons within , the radius enclosing the mean density (aka the “virial radius”); hence, , , and .222Note that, by definition, halo quantities such as and include all material within in both the central and satellite subhalos as well as any unbound particles (aka “fuzz”). As an approximation to the spin parameter , we compute the analogous quantity , where is the circular velocity at the virial radius (Bullock et al., 2001). For a singular isothermal halo, is exactly the same as (in the limit ).
Galaxies in the simulations consist of all the star particles and gas elements within the subhalos identified by subfind. For each FoF halo, this algorithm assigns a smooth central or “background” subhalo by removing all its satellite subhalos while checking that it remains gravitationally bound (Springel et al., 2001, Figure 3). Thus, central galaxies—which we consider exclusively throughout this work—consist of all the baryonic material associated with these central subhalos. We specify galactic morphology in terms of the parameter , defined as the fraction of the stellar kinetic energy invested in rotation (Sales et al., 2010; Rodriguez-Gomez et al., 2017). In particular, we classify galaxies with as spheroid dominated and those with as disk dominated. We compute the stellar properties of galaxies, such as and , by summing over all the stars bound to their subhalos.
3 Results
The main results of this Letter—comparisons between the halo – and – relations in the FP and DMO IllustrisTNG simulations—are displayed in Figures 1–3 and Table 1. For these comparisons, we have performed linear regressions of the form
| (1) |
| (2) |
to determine the best-fit slopes and and normalizations and . We then compute the standard (i.e., ) errors of these quantities by bootstrap resampling. The figures and table present results for two redshifts, and , and several different selection criteria specified by lower limits on halo mass , stellar mass , and morphology parameter .
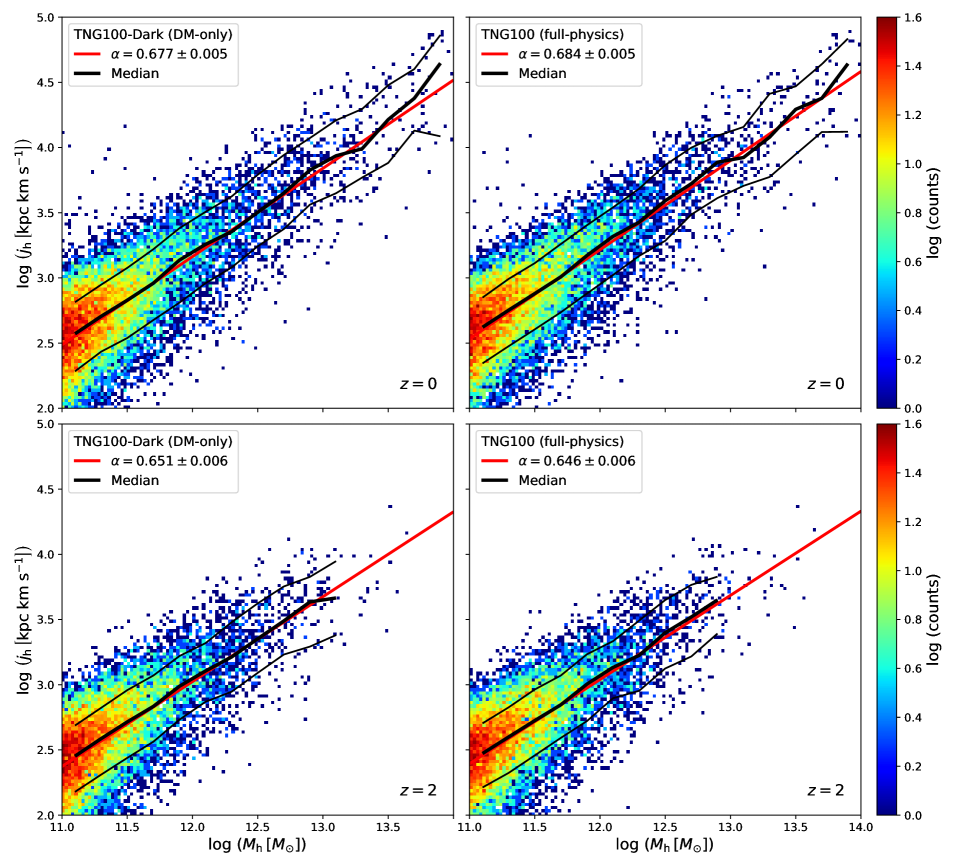
We have adopted these redshifts and selection criteria with the following thoughts in mind. Because the masses of individual halos grow with time, so also does the upper extent of their – relation (compare the upper and lower panels of Figure 1). As a result, the available range of masses shrinks with increasing redshift, and above , it becomes too narrow to determine the slopes and reliably. The restrictions on halo masses, for TNG100 and for TNG50, were chosen to compensate approximately for the different resolutions and volumes of these simulations. These limits are also intended to exclude the low-mass galaxies that might suffer from the spurious heating of stellar motions by DM particles and the resulting transfer of angular momentum to their halos (Ludlow et al., 2021; Wilkinson et al., 2023). We have also checked what happens to the fitted slopes and when we impose the same selection criteria as Du et al. (2022) on the stellar properties of galaxies, namely and .
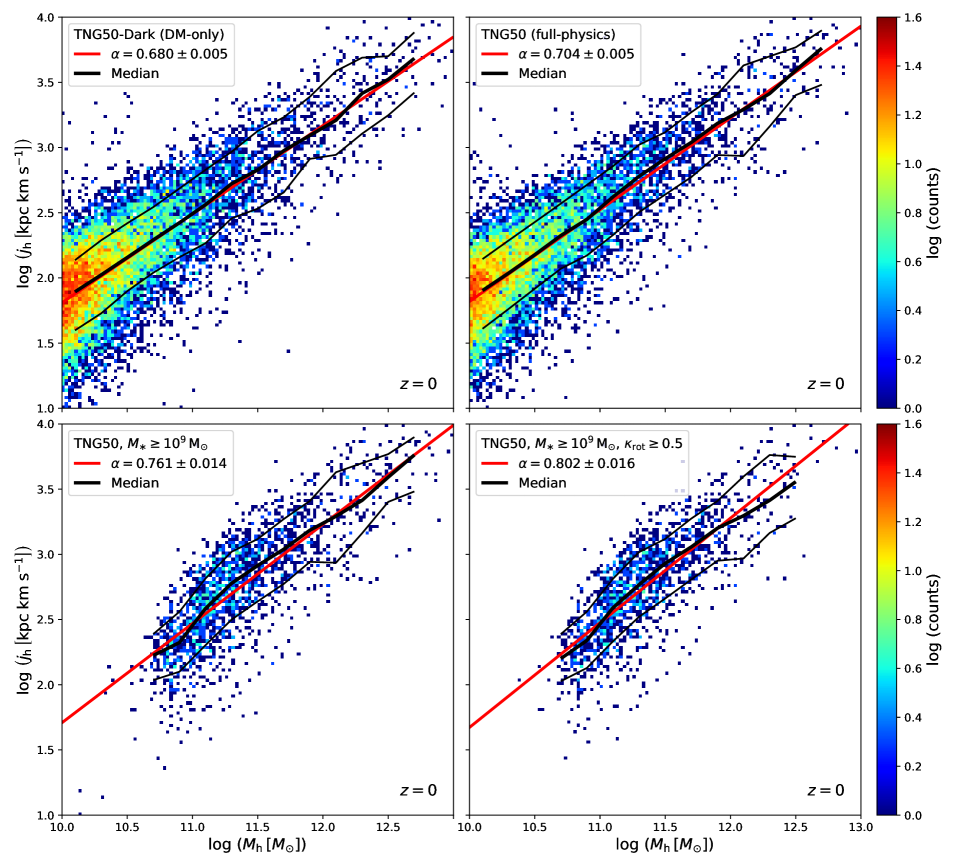
We first compare the halo – and – relations in the FP and DMO runs in samples defined by halo properties alone, specifically for TNG100 and for TNG50. The upper and lower panels of Figure 1 show the halo – relation in the TNG100 FP and DMO runs at and , while the upper panels of Figure 2 show the same results for TNG50 at . Table 1 lists the slopes and of the halo – and – relations in all the simulations at and . In all cases, these are close to the expected values and . Furthermore, the slopes in the FP runs are nearly the same as those in the corresponding DMO runs, with for TNG100 and for TNG50. However, for both TNG100 and TNG50, the normalizations of the halo – and – relations are slightly higher in the FP runs than in the DMO runs, by – (12%–15%) at and (5%) at . We also find that these relations are slightly flatter at than at , by – for both TNG100 and TNG50.
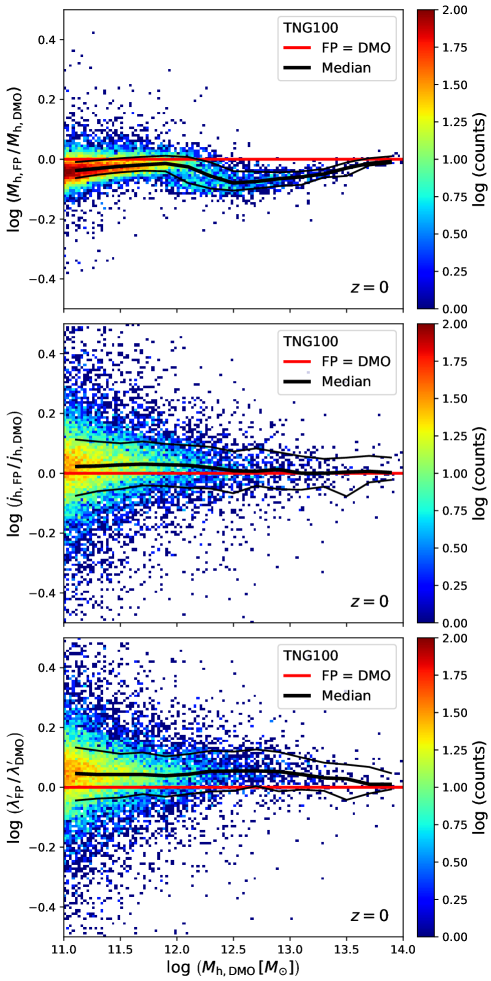
We can elucidate these results by comparing the masses , specific angular momenta , and spin parameters of halos in the FP runs with those of their individually matched counterparts in the DMO runs. These comparisons are shown in Figure 3, where we plot the ratios , , and against for the TNG100 simulation at . Evidently, baryons have a rather complex effect on the median offset between and , likely caused by the varying strengths of supernova and AGN feedback, but they introduce relatively little scatter about this trend (top panel). In contrast, the median offsets between and and between and are small and nearly constant, while the scatter about these trends is large (middle and bottom panels). Since the spin parameter can be re-expressed as (at fixed ), the nearly constant median offset of with ensures that the relation with is preserved, but with a 12%–15% higher amplitude, consistent with the results listed in Table 1.
Why does the inclusion of baryons in the simulations make so little difference to the halo – relation? There are three contributing factors, corresponding to the quantities , , and that appear in the formula for (and hence ). First, the fraction of mass in baryons is small compared with that in DM (16% vs 84%). Second, while the baryons within individual halos can gain or lose large amounts of specific angular momentum, there is little net transfer within the population of halos as a whole. Third, the ratios of the specific binding energies of circumgalactic baryons and DM particles within the same halos, as measured by their kinetic temperatures, are of order unity and increase only gradually with mass. These factors help to explain the results shown in Figure 3, particularly the near constancy of with and thus .
The preceding results indicate that baryons have negligible physical effects on the slope of the halo – relation in the IllustrisTNG simulations. This does not mean, however, that this slope will always be the same for samples of galaxies selected by different baryonic properties, such as stellar mass and morphology parameter . In these cases, there can be non-negligible apparent effects on . This is illustrated for TNG50 at in the lower panels of Figure 2—on the left for the restriction alone and on the right when combined with the restriction . The latter mimics a luminosity-limited sample of disk-dominated galaxies. In this case, we find , similar to the slope Du et al. (2022) found. The reason for this apparent increase in can be traced to the fact that a vertical cut in the – plane maps into a diagonal cut in the – plane, as shown in the lower panels of Figure 2 here and in Figure 5 of Du et al. (2022). Consequently, the fitted slope of the halo – relation for this particular sample is slightly steeper than that for the underlying population.
4 Discussion
| Simulation | Redshift | Selection criteria | ||||
|---|---|---|---|---|---|---|
| (1) | (2) | (3) | (4) | (5) | (6) | (7) |
| TNG100 | ||||||
| DM-only | ||||||
| Full-physics | ||||||
| Full-physics | ||||||
| Full-physics | , | |||||
| TNG50 | ||||||
| DM-only | ||||||
| Full-physics | ||||||
| Full-physics | ||||||
| Full-physics | , | |||||
| TNG100 | ||||||
| DM-only | ||||||
| Full-physics | ||||||
| Full-physics | ||||||
| Full-physics | , | |||||
| TNG50 | ||||||
| DM-only | ||||||
| Full-physics | ||||||
| Full-physics | ||||||
| Full-physics | , |
Our main conclusion is that the halo – and – relations in the IllustrisTNG simulations are very close to the expected forms, and , at least over the ranges of mass and redshift examined here: and . This is true for both TNG100 and TNG50 and for both FP and DMO runs. We find some deviations from the canonical slopes and that are statistically significant given the exceedingly small formal errors listed in Table 1. However, these small deviations are comparable to the differences in and between the TNG100 and TNG50 simulations and are likely negligible for all practical purposes. In particular, the assumed halo – relation with is sufficiently accurate to estimate the retention fractions of specific angular momentum, , from the observed stellar – relations for low-redshift galaxies. Beyond , the reference value of may be slightly lower than .
The halo – relation—in the form confirmed here—when combined with the observed stellar – relation, provides an important link between the retention fractions and , and with it some valuable insights into galaxy formation, as we now summarize briefly. For the power-law models, and , we have
| (3) |
Given the small difference between the exponents of the stellar and halo – relations ( vs ), Equation (3) indicates that and will have similar shapes although the former will be subdued relative to the latter. This is interesting because recent dynamical studies have revealed that the high-mass shape of the SHMR depends strongly on galactic morphology (Posti et al., 2019a, b; Posti & Fall, 2021; Di Teodoro et al., 2023). For disk-dominated galaxies, rises monotonically with mass, with no prominent features, while for spheroid-dominated galaxies, has the more familiar, inverted-U shape, with a peak near the mass of the Milky Way. Another simple consequence of Equation (3) is that the value of for each type of galaxy scales directly with the stellar amplitude and inversely with the halo amplitude .
Empirical determinations of the stellar – relation require both photometric and kinematic data, ideally covering each galaxy in a large sample in two dimensions to large radii. For spiral galaxies, the stellar – relation is quite secure; all determinations, including the original one 40 yr ago, are in remarkably close agreement. This is a consequence of the known inclination of each galactic disk and the fact that the angular momentum of disks with exponential surface-density profiles and flat rotation curves converges rapidly beyond about two effective radii. Recent studies of the stellar – relation of low-redshift spiral galaxies all find very similar angular momentum retention fractions, , based on values from DMO simulations, with little or no dependence on mass (Fall & Romanowsky, 2013, 2018; Posti et al., 2018, 2019b; Di Teodoro et al., 2021, 2023). Adjusting this for the higher values in simulations with baryons gives . A corollary of this result is that, on average, the exponential scale radii of galactic disks are related to the virial radii of their halos by (Fall & Efstathiou 1980; Fall 1983; Mo et al. 1998; note the changes in notation, and , between the early and later papers and the fact that the product is independent of the adjustment).
Determinations of the stellar – relations of lenticular and elliptical galaxies are much harder because the inclinations of the galaxies are uncertain, the shapes of the rotation curves vary, the angular momenta converge slowly, and kinematic data are sparse at large radii. The resulting estimates of the angular momentum retention fractions of spheroid-dominated galaxies are , with an uncertain mass dependence (Romanowsky & Fall, 2012; Fall & Romanowsky, 2013, 2018; Pulsoni et al., 2023). The observed order-of-magnitude difference between the values of for disk- and spheroid-dominated galaxies are also found in simulations of galaxy formation (Genel et al., 2015; Pedrosa & Tissera, 2015; Teklu et al., 2015; Zavala et al., 2016; Sokołowska et al., 2017; El-Badry et al., 2018; Rodriguez-Gomez et al., 2022). One of the key challenges in theoretical studies of galaxy formation is to provide a compelling physical explanation for this large difference in angular momentum retention. In effect, this would also serve as an explanation for the main morphological characteristics of galaxies embodied in the Hubble classification scheme.
References
- Avila‐Reese et al. (2005) Avila‐Reese, V., Colin, P., Gottlober, S., Firmani, C., & Maulbetsch, C. 2005, ApJ, 634, 51, doi: 10.1086/491726
- Bett et al. (2007) Bett, P., Eke, V., Frenk, C. S., et al. 2007, MNRAS, 376, 215, doi: 10.1111/j.1365-2966.2007.11432.x
- Bullock et al. (2001) Bullock, J. S., Dekel, A., Kolatt, T. S., et al. 2001, ApJ, 555, 240, doi: 10.1086/321477
- Davis et al. (1985) Davis, M., Efstathiou, G., Frenk, C. S., & White, S. D. M. 1985, ApJ, 292, 371, doi: 10.1086/163168
- Di Teodoro et al. (2021) Di Teodoro, E. M., Posti, L., Ogle, P. M., Fall, S. M., & Jarrett, T. 2021, MNRAS, 507, 5820, doi: 10.1093/mnras/stab2549
- Di Teodoro et al. (2023) Di Teodoro, E. M., Posti, L., Fall, S. M., et al. 2023, MNRAS, 518, 6340, doi: 10.1093/mnras/stac3424
- Dolag et al. (2009) Dolag, K., Borgani, S., Murante, G., & Springel, V. 2009, MNRAS, 399, 497, doi: 10.1111/j.1365-2966.2009.15034.x
- Doroshkevich (1970) Doroshkevich, A. G. 1970, Astrofizika, 6, 581, doi: 10.1007/BF01001625
- Du et al. (2022) Du, M., Ho, L. C., Yu, H.-R., & Debattista, V. P. 2022, ApJ, 937, L18, doi: 10.3847/2041-8213/ac911e
- El-Badry et al. (2018) El-Badry, K., Quataert, E., Wetzel, A., et al. 2018, MNRAS, 473, 1930, doi: 10.1093/mnras/stx2482
- Fall (1983) Fall, S. M. 1983, in IAU Symp. 100, Internal Kinematics and Dynamics of Galaxies, ed. E. Athanassoula (Cambridge: Cambridge Univ. Press), 391
- Fall & Efstathiou (1980) Fall, S. M., & Efstathiou, G. 1980, MNRAS, 193, 189, doi: 10.1093/mnras/193.2.189
- Fall & Romanowsky (2013) Fall, S. M., & Romanowsky, A. J. 2013, ApJ, 769, L26, doi: 10.1088/2041-8205/769/2/L26
- Fall & Romanowsky (2018) —. 2018, ApJ, 868, 133, doi: 10.3847/1538-4357/aaeb27
- Genel et al. (2015) Genel, S., Fall, S. M., Hernquist, L., et al. 2015, ApJ, 804, L40, doi: 10.1088/2041-8205/804/2/L40
- Hardwick et al. (2022) Hardwick, J. A., Cortese, L., Obreschkow, D., Catinella, B., & Cook, R. H. W. 2022, MNRAS, 509, 3751, doi: 10.1093/mnras/stab3261
- Ludlow et al. (2021) Ludlow, A. D., Fall, S. M., Schaye, J., & Obreschkow, D. 2021, MNRAS, 508, 5114, doi: 10.1093/mnras/stab2770
- Macciò et al. (2008) Macciò, A. V., Dutton, A. A., & van den Bosch, F. C. 2008, MNRAS, 391, 1940, doi: 10.1111/j.1365-2966.2008.14029.x
- Macciò et al. (2007) Macciò, A. V., Dutton, A. A., Van Den Bosch, F. C., et al. 2007, MNRAS, 378, 55, doi: 10.1111/j.1365-2966.2007.11720.x
- Mancera Piña et al. (2021a) Mancera Piña, P. E., Posti, L., Fraternali, F., Adams, E. A. K., & Oosterloo, T. 2021a, A&A, 647, A76, doi: 10.1051/0004-6361/202039340
- Mancera Piña et al. (2021b) Mancera Piña, P. E., Posti, L., Pezzulli, G., et al. 2021b, A&A, 651, L15, doi: 10.1051/0004-6361/202141574
- Marinacci et al. (2018) Marinacci, F., Vogelsberger, M., Pakmor, R., et al. 2018, MNRAS, 5139, 5113, doi: 10.1093/mnras/sty2206
- Mo et al. (1998) Mo, H. J., Mao, S., & White, S. D. M. 1998, MNRAS, 295, 319, doi: 10.1046/j.1365-8711.1998.01227.x
- Naiman et al. (2018) Naiman, J. P., Pillepich, A., Springel, V., et al. 2018, MNRAS, 477, 1206, doi: 10.1093/mnras/sty618
- Nelson et al. (2018) Nelson, D., Pillepich, A., Springel, V., et al. 2018, MNRAS, 475, 624, doi: 10.1093/mnras/stx3040
- Nelson et al. (2019a) Nelson, D., Springel, V., Pillepich, A., et al. 2019a, Comput. Astrophys. Cosmol., 6, 2, doi: 10.1186/s40668-019-0028-x
- Nelson et al. (2019b) Nelson, D., Pillepich, A., Springel, V., et al. 2019b, MNRAS, 490, 3234, doi: 10.1093/mnras/stz2306
- Obreschkow & Glazebrook (2014) Obreschkow, D., & Glazebrook, K. 2014, ApJ, 784, 26, doi: 10.1088/0004-637X/784/1/26
- Pedrosa & Tissera (2015) Pedrosa, S. E., & Tissera, P. B. 2015, A&A, 584, A43, doi: 10.1051/0004-6361/201526440
- Peebles (1969) Peebles, P. J. E. 1969, ApJ, 155, 393, doi: 10.1086/149876
- Pillepich et al. (2018) Pillepich, A., Nelson, D., Hernquist, L., et al. 2018, MNRAS, 475, 648, doi: 10.1093/mnras/stx3112
- Pillepich et al. (2019) Pillepich, A., Nelson, D., Springel, V., et al. 2019, MNRAS, 490, 3196, doi: 10.1093/mnras/stz2338
- Posti & Fall (2021) Posti, L., & Fall, S. M. 2021, A&A, 649, A119, doi: 10.1051/0004-6361/202040256
- Posti et al. (2018) Posti, L., Fraternali, F., Di Teodoro, E. M., & Pezzulli, G. 2018, A&A, 612, L6, doi: 10.1051/0004-6361/201833091
- Posti et al. (2019a) Posti, L., Fraternali, F., & Marasco, A. 2019a, A&A, 626, A56, doi: 10.1051/0004-6361/201935553
- Posti et al. (2019b) Posti, L., Marasco, A., Fraternali, F., & Famaey, B. 2019b, A&A, 629, A59, doi: 10.1051/0004-6361/201935982
- Pulsoni et al. (2023) Pulsoni, C., Gerhard, O., Fall, S. M., et al. 2023, A&A, in press (arXiv:2303.06132). http://arxiv.org/abs/2303.06132
- Rodriguez-Gomez et al. (2017) Rodriguez-Gomez, V., Sales, L. V., Genel, S., et al. 2017, MNRAS, 467, 3083, doi: 10.1093/mnras/stx305
- Rodriguez-Gomez et al. (2022) Rodriguez-Gomez, V., Genel, S., Fall, S. M., et al. 2022, MNRAS, 512, 5978, doi: 10.1093/mnras/stac806
- Romanowsky & Fall (2012) Romanowsky, A. J., & Fall, S. M. 2012, ApJS, 203, 17, doi: 10.1088/0067-0049/203/2/17
- Sales et al. (2010) Sales, L. V., Navarro, J. F., Schaye, J., et al. 2010, MNRAS, 409, 1541, doi: 10.1111/j.1365-2966.2010.17391.x
- Sokołowska et al. (2017) Sokołowska, A., Capelo, P. R., Fall, S. M., et al. 2017, ApJ, 835, 289, doi: 10.3847/1538-4357/835/2/289
- Springel et al. (2001) Springel, V., White, S. D. M., Tormen, G., & Kauffmann, G. 2001, MNRAS, 328, 726, doi: 10.1046/j.1365-8711.2001.04912.x
- Springel et al. (2018) Springel, V., Pakmor, R., Pillepich, A., et al. 2018, MNRAS, 475, 676, doi: 10.1093/mnras/stx3304
- Teklu et al. (2015) Teklu, A. F., Remus, R.-S., Dolag, K., et al. 2015, ApJ, 812, 29, doi: 10.1088/0004-637X/812/1/29
- van den Bosch et al. (2002) van den Bosch, F. C., Abel, T., Croft, R. A. C., Hernquist, L., & White, S. D. M. 2002, ApJ, 576, 21, doi: 10.1086/341619
- White (1984) White, S. D. M. 1984, ApJ, 286, 38, doi: 10.1086/162573
- Wilkinson et al. (2023) Wilkinson, M. J., Ludlow, A. D., Lagos, C. d. P., et al. 2023, MNRAS, 519, 5942, doi: 10.1093/mnras/stad055
- Zavala et al. (2016) Zavala, J., Frenk, C. S., Bower, R., et al. 2016, MNRAS, 460, 4466, doi: 10.1093/mnras/stw1286
- Zjupa & Springel (2017) Zjupa, J., & Springel, V. 2017, MNRAS, 466, 1625, doi: 10.1093/mnras/stw2945