Equal Contributor to This Work \alsoaffiliationEqual Contributor to This Work \alsoaffiliationCorresponding Author \alsoaffiliationCorresponding Author \alsoaffiliationCorresponding Author
Two Biexciton Types Coexisting in Coupled Quantum Dot Molecules
Abstract
Coupled colloidal quantum dot molecules are an emerging class of nanomaterials, introducing new degrees of freedom for designing quantum dot-based technologies. The properties of multiply excited states in these materials are crucial to their performance as quantum light emitters but cannot be fully resolved by existing spectroscopic techniques. Here we study the characteristics of biexcitonic species, which represent a rich landscape of different configurations, such as segregated and localized biexciton states. To this end, we introduce an extension of Heralded Spectroscopy to resolve different biexciton species in the prototypical CdSe/CdS coupled quantum dot dimer system. We uncover the coexistence and interplay of two distinct biexciton species: A fast-decaying, strongly-interacting biexciton species, analogous to biexcitons in single quantum dots, and a long-lived, weakly-interacting species corresponding to two nearly-independent excitons separated to the two sides of the coupled quantum dot pair. The two biexciton types are consistent with numerical simulations, assigning the strongly-interacting species to two excitons localized at one side of the quantum dot molecule and the weakly-interacting species to excitons segregated to the two quantum dot molecule sides. This deeper understanding of multiply excited states in coupled quantum dot molecules can support the rational design of tunable single- or multiple-photon quantum emitters.
Keywords: Quantum dots, Hybridization, Biexcitons, Binding Energy, Single-particle Spectroscopy, SPAD arrays
Since the introduction of colloidal quantum dots (QDs) a few decades ago, their research is constantly developing, due to the intriguing quantum confinement effect that influences the electronic and optical properties as a function of the QD’s size and shape.1, 2 QDs are impressively already widely implemented in commercial displays3 and are of further relevance in additional applications including lasers,4 light emitting diodes (LEDs),5, 6 single photon sources,7 and photovoltaics.8, 9 The extensive study in this field established synthetic means to allow for better control over the size, morphology, and surface chemistry of QDs of various semiconductor materials, enabling improved quantum yields (QY) and tunable emission and absorption spectra.10, 11, 12 In recent years, further research has been carried out to synthesize more complex nano-structures with two or more coupled emission centers, thus launching a new field of “nano-chemistry”.13, 14, 15, 16, 17 In particular, it was demonstrated that two QDs can be fused together via a process of constrained oriented attachment, forming a coupled QD molecule (CQDM).18, 19, 20, 21
As QDs are often described as “artificial atoms” due to their discrete electronic states,22 CQDMs are in many senses analogous to artificial molecules,23 manifesting hybridization of the charge carrier wave functions. For the particular case of CdSe/CdS CQDMs, electron wave functions hybridize, whereas the hole wave function is localized to the cores due to the quasi-type II band alignment, the relatively large valence band offset between CdSe and CdS, and the heavier effective mass of the hole.24 CQDMs exhibit optical and electronic properties which differ from their single QD building blocks as a result of the coupling.18 Notably, CQDMs’ spectrum is red-shifted and broader,20, 25, 26 the absorption cross-section is modified to be doubled at high energy and smeared out near the band gap,24 their fluorescence decay lifetime is shorter, and their brightness is higher than their single QD constituents.25 The optical properties of the CQDMs depend on the width of the interfacial area between the two fused QDs, or “neck”, serving as a potential barrier. The neck can be tuned chemically during the fusion process and was found to control the extent of the coupling and thus the electronic and optical properties.20, 25 Moreover, the joining of two light emitting centers and the increase in the volume can stabilize both charged- and multi- electron–hole pairs (i.e., excitons), relative to such states in the respective single QDs, which are generally dimmed. The unique structure of the CQDMs can accommodate new types of multi-excitonic states and different relaxation pathways.25 In the simplest case of a biexciton (BX; two excitons occupying the same CQDM), the excitons can arrange in multiple spatial configurations within these nano-structures, whereas single QDs can only accommodate a single BX spatial configuration.25
Due to exciton–exciton interactions, the BX emission in many cases is spectrally shifted from the single exciton (1X) emission.27 In addition, multiple recombination pathways and non-radiative processes for BXs, such as the efficient Auger recombination, reduce the fluorescence decay lifetime of the BX, relative to that of the 1X.28 Therefore, a better understanding of BXs in nanocrystals is crucial for their incorporation in various applications, such as in lasing media, LEDs, and photovoltaics. In CQDMs, this could help reveal some of their coupling properties towards more extensive control over their multi-excitonic characteristics. However, characterization of BX emission is challenging, as they generally cannot be spectrally separated at room temperature from the neutral and charged excitonic events, due to spectral diffusion and thermal broadening.27 Most of the previous work in this field utilized indirect methods to characterize the BX emission. The prevalent methods were power-dependent photoluminescence and transient absorption measurements, which exhibited a large variance in results.29, 30, 31, 32, 33, 34, 35, 36 Recently, direct approaches to probe BX emission events at the single particle level were introduced, such as cascade or heralded spectroscopy.27, 37 These newly developed methods enable the energetic and temporal detection of sequential photons, thus eliminating the ambiguity associated with indirect methods. The heralded spectroscopy technique utilizes a spectroSPAD system, which includes a single photon avalanche diode (SPAD) array at the output of a grating spectrometer.27 This system enables the post-selection of cascaded BX–1X events in a time-resolved-spectrally-resolved manner at room temperature. Therefore, it serves as an excellent tool for BX characterization in complex nano-structures such as CQDMs. Previous studies that utilized heralded spectroscopy, used temporal photon correlation between BX and 1X emissions to measure the BX shift (; the difference between the spectrum peaks of the 1X and of the BX emissions) at room temperature in single CdSe/CdS/ZnS quantum dots,27 and in CsPbBr3 and CsPbI3 perovskite nanocrystals (NCs).38
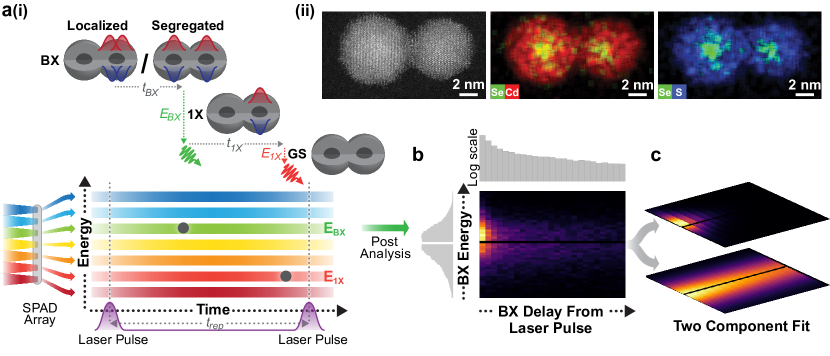
Herein, we explore the BX events in CQDMs and compare their properties to those of their constituent QDs, presenting an expansion of the powerful heralded spectroscopy methodology. Studying the prototypical system of CdSe/CdS core/shell CQDMs, we establish the coexistence of two BX species characterized by different lifetimes and 1X–1X interactions. Combining the experimental results with theoretical analysis, we attribute these to two BX spatial configurations. One where two holes are localized in the same QD (localized biexciton; LBX) and one where the two holes are segregated to the two constituent QDs (segregated biexciton; SBX), as illustrated at the top of Figure 1a(i).
RESULTS AND DISCUSSION
The model system under study constitutes of CdSe/CdS CQDMs formed via the template approach introduced previously.18, 20 Briefly, CdSe/CdS core/shell QDs (radius of ; electron microscopy characterization in Figure 1a(ii) and LABEL:SIfig:TEM), were bound to surface-functionalized silica spheres of in diameter, followed by controlled coverage by an additional layer of silica, which blocks the unreacted silica binding sites and partially covers the QDs’ surface, reducing the possibility to generate oligomers. Then, a molecular linker was added followed by the addition of a second batch of the same QDs, thereby attaching to the bound QDs, forming dimers on the template. Dimers are released via selective etching of the silica spheres by hydrofluoric acid and then undergo a fusion process at a moderate temperature. Size-selective separation is performed using the controlled addition of an anti-solvent, yielding a sample of the CQDMs.
In previous works that utilized heralded spectroscopy, extracting the BX emission spectrum was sufficient for a comprehensive BX characterization.27, 38 In the current case, the analysis is extended to resolve the BX population both spectrally and temporally, in order to account for the multiple BX species assumed to coexist in CQDMs. To explore BX states in CQDMs, cascaded emission events are directly probed at room temperature, extracting both temporal and spectral information simultaneously. The setup relies on exciting a single particle with a pulsed laser excitation, dispersing the emitted fluorescence by a grating spectrometer, and detecting the photons (temporally- and spectrally-resolved) with a SPAD array detector. Occurrences of photon-pair emission detected following the same excitation pulse are post-selected and treated as heralded events. Each photon within the post-selected photon pairs is time- and energy-tagged according to its time and pixel of detection. The high spectral and temporal resolutions (see Methods section) enable an unambiguous temporal separation between the two detections, attributing the first arriving photon to emission from the BX state and the second photon to emission from the 1X state (Figure 1a(i) bottom).
Then, the BX population, in the form of a 2D spectrum-lifetime histogram (Figure 1b), is fitted to the sum of two independent exponentially decaying components, using a least-squares solver (Figure 1c):
| (1) |
Where is a Voigt profile distribution in energy, i.e., over the detector’s pixels, is the component’s mono-exponential decay lifetime, and is a prefactor.
The results shown herein compare single NCs from two samples. One is of fused CQDMs, or “fused dimers”, and one is of “non-fused dimers”, where two QDs were linked together by the same template-based procedure described above, but not fused under moderate temperatures. Non-fused dimers remain connected by the molecular linker, but do not feature the continuous CdS lattice, i.e., the neck, between the QDs seen in Figure 1a(ii). The dimer samples also contained single QDs, or “monomers”, that failed to attach to another QD (see Methods section and LABEL:SIfig:TEM for further details). The monomers within the fused dimers sample were used as a reference for single QDs that underwent the same process. The photoluminescence signal from single particle measurements was used in several further analyses, allowing nanoparticle-type classification (LABEL:SIfig:blinking&FLID), and collected under a single excitation power for all particle types (LABEL:SIfig:saturation). The additional analyses included fluorescence intensity, intensity fluctuations, decay lifetimes, and the zero-delay normalized second-order correlation of photon arrival times ().27, 38 The first two supported nanoparticle-type classification for distinguishing monomers from dimers (following ref. 25), while the value was integral in revealing the nature of the NCs as quantum emitters, positioning them on the continuum between a single- and a multi-photon emitter.
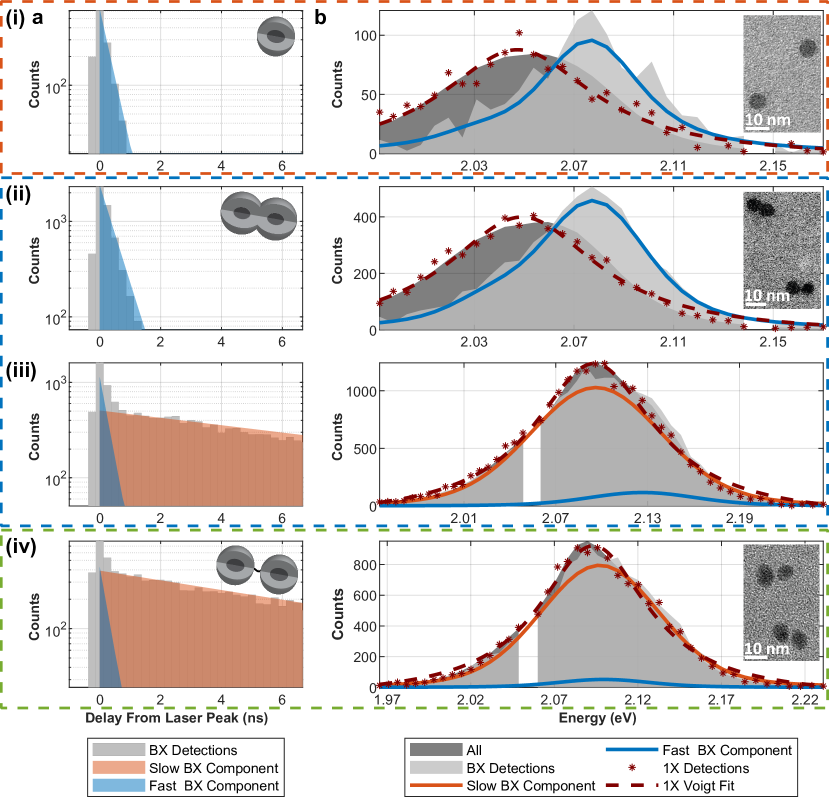
Figure 2 presents representative results of the 2D heralded analysis from 5-min measurements of (i) a monomer, (ii) a fused dimer with high contrast, (iii) a fused dimer with low contrast and (iv) a non-fused dimer. The left column (panels (a)) depicts the BX decay kinetics and the right column (panels (b)) shows the BX emission spectrum, both as bright gray areas. (i) and (ii) exhibited a single exponential BX decay, whereas (iii) and (iv) exhibited a bi-exponential BX decay. To graphically emphasize the difference between the NCs with a single exponential decay and the ones with a bi-exponential feature, the fitted components were labeled as “fast” and “slow”, which refers to short and long BX decay lifetimes, respectively (blue and orange areas in panel (a), respectively). To distinguish between slow and fast decay patterns, a lifetime threshold of was selected after preliminary results showed that monomers displayed only a sub-ns BX decay component (LABEL:SIfig:monomersBXLT). The appearance of a BX lifetime in dimers (LABEL:SIfig:BXtwoTaus) is therefore assumed to emanate from a BX species unavailable in monomers. Cases where the 2D fit exhibited two sub-ns components might be attributed to neutral and charged BXs,39 or simply to the additional degree of freedom in the fit. Consequently, in such cases, as in Figure 2(i) and (ii), the two fast components are summed together and displayed as a single fast component, which represents well the observed decay.
Figure 2(i) presents a typical heralded spectroscopy characterization of a single monomer (, see LABEL:SIfig:g2). Panel (a) showcases a single sub-ns exponentially decaying fitted component (blue area; lifetime of ), and panel (b) presents its spectrum (solid blue line). The BX shift of this component, i.e., the difference between the 1X peak (red dashed line) and the BX component’s peak, is (all the error intervals in this work are given at 68 confidence levels). The negative BX shift (that is, a blue shift due to the 1X–1X repulsion) agrees well with a quasi-type II band-alignment regime, in which spilling out of the electrons wave functions to the shell reduces the overlap with the holes localized in the core, and hence the like-charges repulsion energies dominate over correlative attractions.33 The normalized spectrum of all the detections from the 5-min measurement (including single photon events) is shown in dark gray and highly matches the 1X spectrum, indicating that the overall emission is dominated by 1X emission.
Figure 2(iv) presents a typical single non-fused dimer, which in contrast to the monomer in (i), displays two different components, with lifetimes of and and different spectra (panels (a) and (b), respectively). The slow component (solid orange area) dominates the BX emission, with a relative contribution () of . The fast component (solid blue line in panel (b)) features . The emergence of a long-lived fitted BX component with a negligible shift (), is naturally associated with the multiple emission centers in this single non-fused dimer.
In monomers, where the only possible BX spatial configuration is of two holes confined to one core (LBX), only a sub-ns strongly-interacting BX component is observed. Therefore, it is reasonable to attribute the reappearance of a similar fast-decaying BX component in the non-fused dimer, to LBX emission events. According to this reasoning, we assign the order-of-magnitude slower BX component to segregated BX (SBX) emission events. These assignments are validated by numerical simulations later in this section. Non-fused dimers consist of two nearly independent QDs, thus the SBX can be treated as two weakly-interacting 1Xs, as the two holes are separated into two different cores. Hence, the BX emission from such a state is expected to resemble the 1X emission in energy but with a shorter lifetime ( in non-fused dimers), due to multiple recombination pathways and possible non-radiative competing processes, such as energy transfer or inter-core tunneling mechanisms.18 Moreover, in non-fused dimers, the long-lived BX is more dominant than the short-lived BX. This also supports their attribution to SBX and LBX states, respectively, as the non-radiative Auger decay dominates the LBX decay and reduces its QY. The near-zero values are in agreement with the expected weak 1X–1X interaction. The small observed negative BX shift may be attributed to different quantum confinements of the constituent QDs. Bluer-emitting QDs feature shorter decay lifetimes (LABEL:SIfig:specVsLTa), and hence the bluer-emitting QD of the non-fused dimer will more often emit first.
Fused dimers featured two distinct populations. Typical examples of each are seen in Figure 2(ii) and (iii). Case (ii) resembles the monomer in (i) with its single sub-ns lifetime, , and strong photon antibunching (). Case (iii) has an emerging slow component ( lifetime), with a spectral offset () resembling that of the non-fused dimer in (iv). This is accompanied by a weaker antibunching () compared to (i) and (ii). Case (iii) also shows a fast BX component that resembles the BX properties in (i) and (ii), featuring a lifetime of and .
![[Uncaptioned image]](/html/2305.11027/assets/x3.png)
figureBX Shifts According to Particle Type. BX shifts () of (a) the fast and (b) the slow fitted BX components of all the single particles, according to type. Monomers and of the fused dimers did not exhibit a component with a lifetime of or higher and therefore do not appear in panel (b). Black dashed lines represent zero BX shift (equal energy of BX and 1X emissions).
Moving to a statistical representation measured over numerous single particles, RESULTS AND DISCUSSION displays the BX shifts of the fast and the slow components (panels (a) and (b), respectively) for all particles according to type. Monomers and of the fused dimers presented only sub-ns BX components and therefore do not appear in panel (b). As shown in RESULTS AND DISCUSSIONa, monomers and fused dimers feature a similar ( and , respectively). In non-fused dimers the fast BX shift is weaker (), due to stronger confinement effect. Unlike non-fused dimers, the monomers and fused dimers underwent ripening during the fusion process, which slightly thickened their shell, as apparent in their red-shifted emission (LABEL:SIfig:specVsLTb). The lower volume of non-fused dimers increases the localization of electrons, which screens the Coulombic repulsion between the holes, reducing their fast BX shift, attributed to the LBX.36 Indeed, the different distributions of for fused and non-fused dimers are in agreement with monomers that underwent the fusion process and monomers that did not, respectively (LABEL:SIfig:BXshiftsMonomers).
RESULTS AND DISCUSSIONb shows a slightly negative BX shift of for non-fused dimers, consistent with the previously mentioned expectation of an averaged faster emission by the bluer-emitting QD within a dimer. Notably, 32 of the fused dimers also exhibited a slow component and showed .
Figure 3 shows the 2D heralded analysis of all particles as a function of the contrast, indicating a single- or a multiple-photon emitter.40 This, with the exception of particles from the non-fused dimers sample that exhibited , which were omitted from this work. This was to avoid the possible inclusion of oligomers or charged particles (see LABEL:SIsec:supporting_analyses and LABEL:SIfig:nonfusedG2). The lifetimes of the two fitted BX components and their BX shifts (i.e., the difference between the spectrum peak of the 1X and the relevant BX component) are weighted according to the component’s relative contribution (). Figure 3a shows that monomers display only a fast sub-ns BX dynamics, which agrees well with the LBX being the only available BX spatial configuration in monomers. The Auger recombination in such particles is highly efficient, leading to a high contrast of , classifying them as single photon emitters.
The majority of the fused dimers exhibit high contrasts () and a sub-ns BX lifetime, which we attribute to the LBX in those systems. Their BX shift distribution overlaps that of the monomers, as apparent in Figure 3b. Consequently, these ‘monomer-like’ fused dimers can also be considered as single-photon emitters, yet with a larger absorption cross-section (see estimation in Methods section) that increases the probability of multi-excitations.24 Additionally, the larger volume at the neck region allows further electron delocalization in the LBX state, which reduces the efficiency of Auger recombination and slightly increases their emission intensity and BX yield (LABEL:SIfig:BXNum).
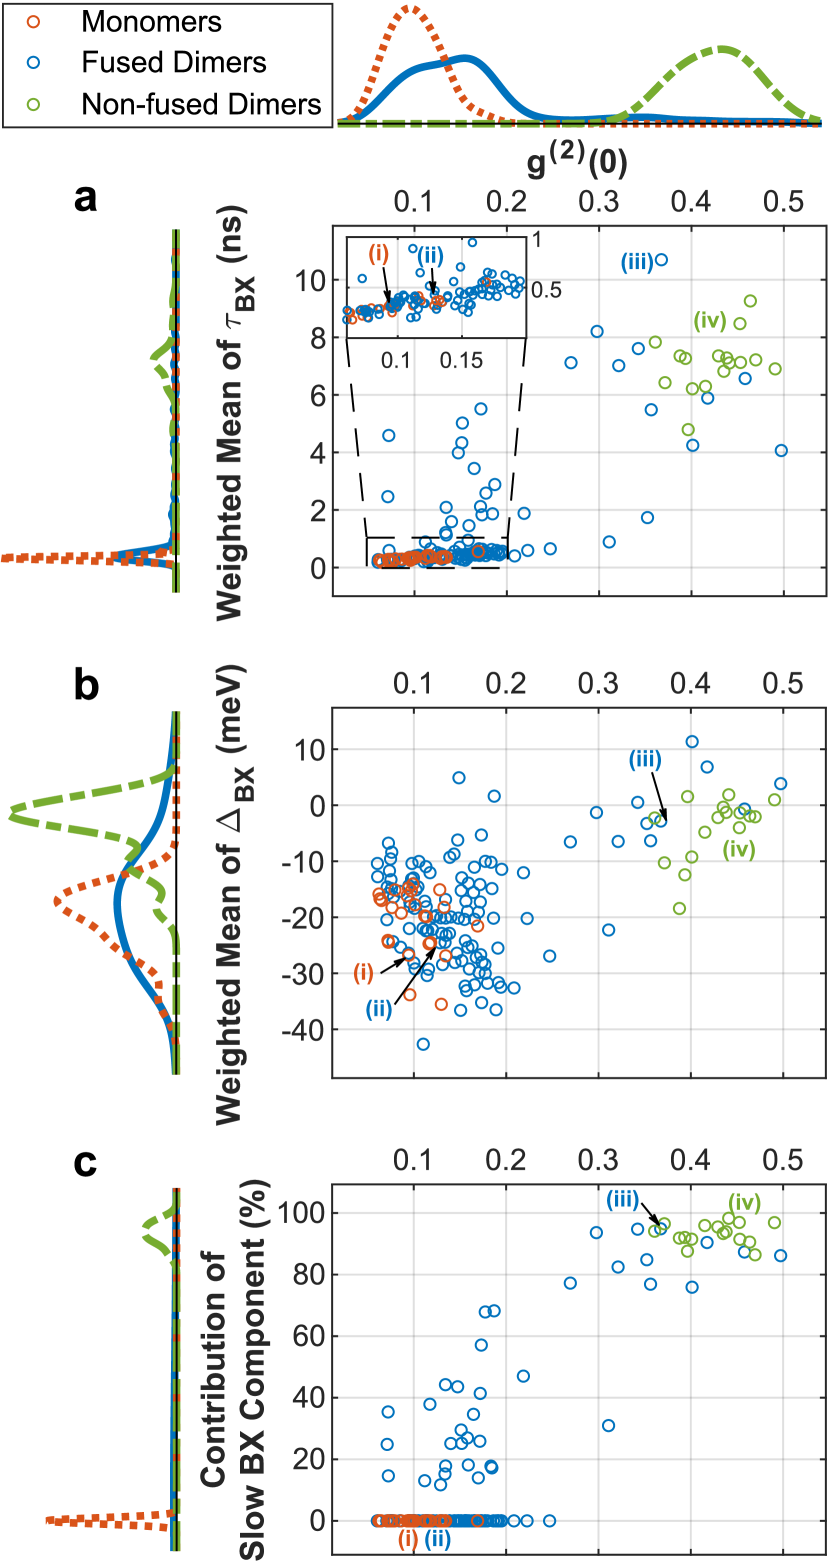
Together with increasing values of , the slow BX component emerges and eventually becomes the dominant one, as apparent in Figure 3c and in the increase in the weighted mean of BX lifetimes and shifts (Figure 3a,b). Notably, the BX shifts of each of the two BX states do not exhibit such correlation with (LABEL:SIfig:BXshifts). Accordingly, we assume that the observed trends in Figure 3 result from the varying ratio between the contribution of the segregated and localized BX states.
Previous works showed that the neck thickness, which acts as a potential barrier, can control the extent of the electronic coupling, thus tuning the optical properties.20, 25 Generally, joining two emitting centers reduces photon antibunching due to the lower rate of the non-radiative Auger recombination of multiply excited states. However, by increasing the neck width, electron wave function delocalization partially retrieves the single photon source characteristics, increasing the contrast.25 Therefore, we suggest that the trend of a decrease in photon antibunching is correlated with a decrease in the neck size. The position of the non-fused dimers at the edge of this trend (top right corner in Figure 3a,b,c), with a negligible and a long BX lifetime, further validates the realization of the decrease in photon antibunching as a consequence of the decrease in the neck thickness. Non-fused dimers are separated by a linker, as mentioned earlier, and exhibit ; therefore, they can be considered as two nearly-independent monomers. This sets the monomers and non-fused dimers as the extremes on the scale, with the fused dimers distributed along it according to the extent of their neck filling.25 This trend demonstrates a unique property of CQDMs; by controlling their neck thickness, which acts as a synthetic tunable potential barrier, it is possible to continuously alter their behavior from a single-photon emitter to a two-photon emitter.
Quantum mechanical Simulations. In order to establish a connection between the optical properties reported above and the morphological features of the CQDMs, we next carry out quantum mechanical simulations of the 1X and BX electronic structures in such systems. Our model is based on effective mass theory, which has successfully provided insight into the single exciton physics of CQDMs.18, 20, 24, 25 Unlike in previous studies, however, we account for Coulomb interactions via a Configuration Interaction (CI) procedure. Compared to the self-consistent method used in earlier works,18, 24 the CI method has the advantage of describing not only the ground state but also excited states. We shall see below that these can be relevant to understand the optical properties at room temperature.
To gain an understanding of the CQDMs’ optical properties, we proceed in steps of increasing complexity. In the first step, we describe the BX shift in monomers through the “BX binding energy” (i.e., the difference between twice the 1X ground state energy and the BX ground state energy). In the second step, we extend the analysis to BX and 1X excited states in CQDMs that are occupied at room temperature under thermal equilibrium. At this point, the comparison of the simulated spectrum with that observed in the experiments will allow us to infer information regarding the BX relaxation dynamics, and the existence of meta-stable excited states to explain the multi-exponential BX decay observed above.
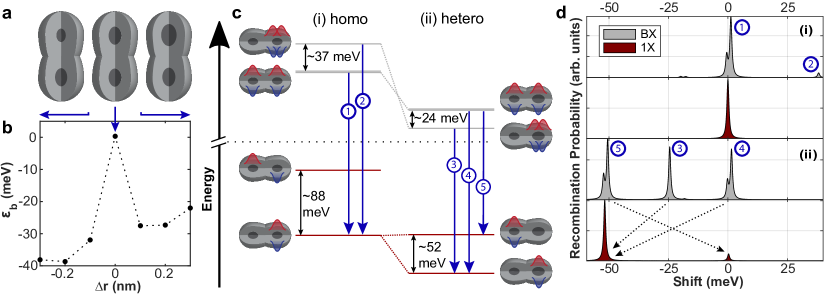
Here, the BX binding energy is calculated as , where and are the ground state energies of single 1Xs and of BXs, respectively. Prior to the analysis of the complex dimer system, the monomer case was simulated. The monomers are approximated as spherical core/shell particles with a total (core+shell) diameter of . Negative binding energies, indicating repulsive 1X–1X interactions, in the same range as RESULTS AND DISCUSSIONa, are obtained for core radii between 1.25 and (LABEL:SIfig:monomerEbSimulation). In what follows, we consider QDs with a core radius of that exhibit , which is a slightly stronger interaction than the mean BX shift for monomers in the experimental results. Next, we study the case of CQDMs (illustration in Figure 4a). The CdSe cores are spherical, with radii and for the bottom and top cores, respectively. Each core has an ellipsoidal shell, with semi-axes and except in the coupling direction, where the semi-axes and define the neck filling.24 The central CQDM in Figure 4a illustrates a fused homodimer with , (according to the size of the studied constituent QDs; see LABEL:SIfig:TEM), and , which corresponds to a CQDM with a ‘rod-like’ geometry (notice that a case of would imply no fusion at all).
Because variations in the size of the QDs that constitute the CQDMs are likely to occur, we fix and vary . Thus, the left and right CQDMs in Figure 4a schematically present small fluctuations in the size of the top core. Figure 4b presents the BX binding energy of the lowest-energy BX state as a function of . It follows from the figure that a precise homodimer () presents a weak binding energy (), but as soon as heterogeneity in the core sizes comes into play, the BX binding energy switches to large negative values. Thus, for cores differing only in , the CQDM already exhibits a BX binding energy of . It is then clear that core size fluctuations have a major influence on the BX energetics, whereas the neck size dispersion has a much weaker influence on it (LABEL:SIfig:simulatedNeckEffect. Note that neck size can be expected to affect the BX dynamics as discussed above).
To understand the origin of this seemingly bimodal distribution of BX binding energies, in Figure 4c we compare the electronic structure of a homodimer (), and a heterodimer (). In the precise homodimer case (Figure 4c(i)), the BX ground state is the SBX, with the LBX state blue shifted by . The different stability stems from the nature of the 1X–1X interactions in each state. In the LBX state, these are repulsive intra-dot interactions, much like in the monomer, whereas in the SBX they are inter-dot interactions. Because 1X–1X interactions are dipole–dipole-like, they decay rapidly with distance. Inter-dot interactions are thus a minor effect, resulting in the SBX having about twice the energy of the 1X (i.e., ). The situation is, however, reversed in the heterodimer (Figure 4c(ii)). When one of the cores is larger than the other, the LBX with both excitons in the large QD rapidly becomes the ground state. This is because the cores are in a strong quantum confinement regime, so relaxing the confinement easily overcomes the Coulomb repulsion between excitons. For this LBX state, .
For a more direct comparison with the experiments, we next study how the electronic structures of homodimers and heterodimers translate into different optical spectra. Figure 4d presents the calculated emission spectrum (assuming thermal equilibrium) of the 1X (red) and of the BX (bright gray) at room temperature for each type of CQDM, with the 1X emission in the homodimer acting as a reference point (shift). For the homodimer case (i), the 1X and BX spectra present a dominant peak at a similar energy. This is because at , most BXs are in the SBX state, which has and relaxes to the direct exciton ground state (see arrow labeled as transition 1 in Figure 4c). A small peak shows up at higher energies (transition 2), which corresponds to recombination from the LBX state, but its contribution is small as it originates from an excited state beyond thermal energy.
In the heterodimer case (Figure 4d(ii)), the 1X presents two peaks: a low-energy peak corresponding to recombination in the larger QD, and a small peak at high-energy corresponding to recombination in the smaller QD. The latter is small because of the scarce thermal occupation of the excited 1X state ( above the ground state in Figure 4c). The spectrum of the BX presents three relevant transitions. Transition 3 originates from the BX ground state, here the LBX. Its BX peak is blue-shifted from the main 1X transition by . Transitions 4 and 5 correspond to recombination of an exciton in the smaller or in the larger QD, respectively. They arise from the SBX state, which can have some thermal occupation at room temperature if the core asymmetry is not large. Both transition 4 and 5 present a double peak fine structure (splitting of ). This feature is a consequence of the hybridization of the electron orbitals, forming bonding and anti-bonding molecular states, but it is not resolved in the experiments. It is also worth noting that both transition 4 and 5 present a similar intensity to 3, despite the SBX being a few tens of meVs higher in energy than the LBX. This is because the SBX state is highly degenerate (there are multiple ways to sort the two electrons and two holes in two QDs). This property increases the chances of room temperature occupation for SBX up to a few tens of meV above the LBX ground state, such that an SBX contribution can be expected except in CQDMs with severe core asymmetries. According to these calculations, the spectral width of the SBX emission (transitions 4 and 5) is expected to be greater than the one of the LBX emission (transition 3), which is supported by experimental results (LABEL:SIfig:BXFwhm).
We conclude from Figure 4d that the BX optical emission of the homodimers is governed by the SBX, which has weak 1X–1X interactions, and hence emits at similar energies to the 1X. However, the BX emission energetics of heterodimers is richer, for it is governed by the LBX ground state with possible additional contributions from the SBX state. This occurs even in thermal equilibrium at room temperature and seems to account well for the observed energetic shifts of BXs for the case of heterodimers. Indeed, the heterodimer case is to be considered when interpreting the experiments, since it is unlikely that the two cores forming a CQDM would be identical at the ångström level, which suffices to depart from the homodimer limit according to our calculations.
The simulations shed light on the experimental results. They show that core heterogeneity must be assumed, resulting in LBX as the BX ground state, at least for the majority of fused dimers. This explains the fact that most of the fused dimers exhibited a dominant LBX emission, despite its strong quenching due to Auger recombination. The calculated LBX binding energy of also agrees with the values observed for the fast BX component shift in fused dimers, shown in RESULTS AND DISCUSSIONa. Nevertheless, considering the heterodimer limit, the observation of the BX shift in some fused dimers and in the majority of the non-fused dimers (Figure 3b) is not fully explained by the calculations. Additionally, the simulations assume thermal equilibrium between the different BX states. This would result in a single BX lifetime averaged according to the Boltzmann distribution, contrasting the observed bi-exponential temporal decay in this aforementioned fraction of the fused and non-fused dimers. Therefore, to explain multiple BX radiative lifetimes, we must assume meta-stability for the different BX states. Moreover, since the neck size is shown to have a negligible effect on the calculated energetics, we posit that it does, however, have a significant impact on the BX relaxation dynamics, which is not captured by the static simulations.
We suggest that the BX emission greatly depends on the dynamics of BX relaxation to the lower-energy BX state, which can become much faster than the radiative BX recombination when the potential barrier is low (LABEL:SIfig:slowBXAmp). Thus, assuming the case of heterodimers as mentioned earlier, the ‘hot’ generated SBX will relax with a high probability to form the lower-energy LBX in the larger QD of the pair. As the neck thickness decreases (corresponding to higher in Figure 3), relaxation from an SBX to an LBX becomes slower and thus less probable, as it competes with radiative processes. Because of a higher Auger rate in the LBX state, the SBX will become the dominant emitting BX in such a case, resulting in dimers with a multi-component BX emission characteristic. Indeed, the significant variable that changes along the decrease in photon antibunching and that agrees with its correlation with the mean BX shift in Figure 3b , is the increasing ratio of SBX to LBX events (Figure 3c). Consequently, the observed behavior of BXs in CQDMs is a result of the interplay between energetics, governed by size heterogeneity, and kinetics, governed by the potential barrier.
CONCLUSIONS
We resolve multiple biexciton species in the emission from coupled quantum dot molecules, introducing an extension to the powerful approach of heralded spectroscopy. Applying the technique to the prototypical CdSe/CdS coupled quantum dot dimers, single quantum dots, and non-fused dimers, revealed the coexistence and interplay of two biexciton species. Numerical simulations and experimental results attribute the fast-decaying, strongly-interacting biexciton species to localized biexcitons, where both holes are confined to the same CdSe core. The long-lived, weakly-interacting biexciton species is attributed to segregated biexcitons, where the two holes reside in the two CdSe cores. The relative contribution of each species correlates with the level of antibunching, ranging from single-photon emitters to two-photon emitters, and can be tuned continuously by controlling the width of the neck barrier between the constituent quantum dots. Finally, the numerical simulations also unveil the strong dependence of the energetics of the dimers’ biexciton states on minute differences in the quantum dot core sizes, explaining the large percentage of dimers featuring a single quantum dot-like behavior.
The unveiling of multiple biexciton species in coupled quantum dot molecules further demonstrates the potential of these materials as tunable and versatile quantum light emitters. Moreover, the extended heralded spectroscopy method applied here exemplifies the power and potential of this emerging spectroscopy technique to promote the understanding of nanocrystal photophysics and multiple-photon quantum emitters.
METHODS
Synthesis of CQDMs and Sample Preparation. The CdSe/CdS CQDMs were synthesized according to the protocol reported by Cui et al.,20 using silica nanoparticles as a template. The template was used to link CdSe/CdS monomers through a thiol group. Additional SiO2 was added to mask the exposed silica and immobilize the bound monomers. Introducing a second group of monomers after treating the first with a tetrathiol linker, formed dimer structures, attached by the linker. Then the silica nanoparticles were etched away via hydrofluoric acid treatment. Later, a “strong” fusion process,20 which includes prolonged heating, removed the linker and formed a uniform crystalline dimer. Size-selective separation excluded a large portion of monomers, resulting in a high dimer population. A dilute solution of NCs in 2.5 polymethyl methacrylate in toluene was spin-cast on a glass coverslip for the single-particle measurements.
Three batches were used in this work (electron microscopy characterization in LABEL:SIfig:TEM). The first is of monomers (referred to as “pristine monomers”) that did not undergo any further synthetic process and are used mainly for reference. The second is of fused dimers that underwent the fusion process with “strong” fusion conditions (; 20 h; 5 ligands).20 Since this procedure yields not just dimers but also some monomers (and some oligomers), the NCs from the fused dimers sample were classified according to their optical properties,25 to isolate the monomers in this sample (referred to as “monomers”. See inset in Figure 2(i)b) from the dimers (see LABEL:SIsec:studiedQDs for classification details). The last batch is of non-fused dimers, meaning pristine monomers that were linked and instead of undergoing the fusion process, were only heated for 1 h at (see inset in Figure 2(iv)b). This study displays results for single-particle measurements in which 400 BXs or more were detected, which amounted to 14 pristine monomers, 24 monomers out of the fused dimers sample, 116 fused dimers, and 16 non-fused dimers.
Optical Setup. The SPAD array spectrometer is built around a commercial inverted microscope (Eclipse Ti-U, Nikon). An oil immersion objective (×100, 1.3 NA, Nikon) focuses light from a pulsed laser source (470 nm, 5 MHz, LDH-P-C-470B, PicoQuant) on a single particle (QD or CQDM) and collects the emitted photoluminescence. The emitted light is then filtered through a dichroic mirror (FF484-FDi02-t3, Semrock) and a long-pass filter (BLP01-473R, Semrock). The magnified image plane (×150) serves as the input for a Czerny-Turner spectrometer that consists of a 4-f system (AC254-300-A-ML and AC254-100-A-ML, Thorlabs) with a blazed grating (53-*-426R, Richardson) at the Fourier plane. At the output image plane of the spectrometer, a 512-pixel on-chip linear SPAD array is placed. Only fixed quarters of 64 pixels can participate simultaneously in the time-tagging measurement, which is done by an array of 64 time-to-digital converters (TDCs) implemented on a field programmable gate array (FPGA). The physical pixel pitch is , which corresponds to a difference between neighboring pixels of in photon wavelength, or in energy. Of the single 64-pixel segment used in this work, the 34th pixel is a ‘hot’ pixel and therefore omitted from all analyses. The instrument response function (IRF) of the system featured a full width at half maximum (FWHM). This response is a convolution of the excitation pulse temporal width and the timing jitter of the pixels. The pixels’ dead time is and the average dark counts are counts per second (CPS) per pixel. For further details on the experimental setup and analysis parameters see LABEL:SIsec:System_and_Analyses_Parameters and ref. 27.
The laser illumination intensity was set to yield an average number of absorbed photons per particle per pulse () of for pristine monomers, calculated by saturation curves of the ‘on’ state. Using the same analysis for fused dimers yielded (see LABEL:SIsec:System_and_Analyses_Parameters for further details).
Quantum Mechanical Simulations. Calculations are carried within theory framework. Non-interacting (single-particle) electron and hole states are calculated with the single-band Hamiltonians and material parameters of ref. 24, except for the relative dielectric constant inside the nano-structure which is here rounded to 10. In particular, we note that the conduction band offset is , which was found to provide good agreement with the experiments in earlier simulations of CQDMs.24 Strain and self-energy corrections are disregarded for simplicity. Many-body eigenstates and eigenenergies are calculated within a full CI method, using CItool codes.41 Coulomb integrals for the CI matrix elements, including the enhancement coming from dielectric confinement, are calculated by solving the Poisson equation with Comsol Multiphysics 4.2. The CI basis set is formed by all possible combinations of the first 20 independent-electron and 20 independent-hole spin-orbitals. Charged exciton and biexciton configurations are then defined by all possible Hartree products between the few-electron and few-hole Slater determinants, consistent with spin and symmetry requirements. Optical spectra are calculated within the dipole approximation,42 assuming Lorentzian bands with a line-width of . Overall, the CI model is similar to that we have used to analyze other colloidal nano-structures, where the balance between carrier–carrier interactions is a key magnitude.43, 44
ASSOCIATED CONTENT
Supporting Information.
The supporting information (PDF) containing characterization of the studied quantum dots, description of the analyses parameters, and supporting experimental and theoretical analyses, is available free of charge.
Authors Information.
Corresponding Authors
Juan I. Climente - Department de Quimica Fisica i Analitica, Universitat Jaume I, E-12080, Castello de la Plana, Spain; Email: climente@qfa.uji.es
Uri Banin - Institute of Chemistry and the Center for Nanoscience and Nanotechnology, The Hebrew University of Jerusalem, Jerusalem 91904, Israel; Email: Uri.Banin@mail.huji.ac.il
Dan Oron - Department of Molecular Chemistry and Materials Science, Weizmann Institute of Science, Rehovot 76100, Israel; Email: dan.oron@weizmann.ac.il
Authors
Nadav Frenkel - Department of Physics of Complex Systems, Weizmann Institute of Science, Rehovot 7610001, Israel
Einav Scharf - Institute of Chemistry and the Center for Nanoscience and Nanotechnology, The Hebrew University of Jerusalem, Jerusalem 91904, Israel
Gur Lubin - Department of Physics of Complex Systems, Weizmann Institute of Science, Rehovot 7610001, Israel
Adar Levi - Institute of Chemistry and the Center for Nanoscience and Nanotechnology, The Hebrew University of Jerusalem, Jerusalem 91904, Israel
Yossef E. Panfil# - Institute of Chemistry and the Center for Nanoscience and Nanotechnology, The Hebrew University of Jerusalem, Jerusalem 91904, Israel
Yonatan Ossia - Institute of Chemistry and the Center for Nanoscience and Nanotechnology, The Hebrew University of Jerusalem, Jerusalem 91904, Israel
Josep Planelles - Department de Quimica Fisica i Analitica, Universitat Jaume I, E-12080, Castello de la Plana, Spain
#Present Address: 200 S. 33rd St. 201 Moore Building, Philadelphia, PA 19104, USA
Author Contributions: N.F. and E.S. contributed equally to this work.
Notes.
The Authors declare no competing financial interest.
ACKNOWLEDGEMENTS
U.B. and D.O. acknowledge the support of the Israel Science Foundation (ISF), and the Directorate for Defense Research and Development (DDR&D), grant No. 3415/21. J.I.C. and J.P. acknowledge support from UJI project B-2021-06. E.S., A.L., Y.E.P., and Y.O. acknowledge support from the Hebrew University Center for Nanoscience and Nanotechnology.
References
- García de Arquer et al. 2021 García de Arquer, F. P.; Talapin, D. V.; Klimov, V. I.; Arakawa, Y.; Bayer, M.; Sargent, E. H. Semiconductor quantum dots: Technological progress and future challenges. Science 2021, 373
- Talapin et al. 2010 Talapin, D. V.; Lee, J. S.; Kovalenko, M. V.; Shevchenko, E. V. Prospects of colloidal nanocrystals for electronic and optoelectronic applications. Chemical Reviews 2010, 110, 389–458
- Panfil et al. 2018 Panfil, Y. E.; Oded, M.; Banin, U. Colloidal Quantum Nanostructures: Emerging Materials for Display Applications. Angewandte Chemie - International Edition 2018, 57, 4274–4295
- Park et al. 2021 Park, Y. S.; Roh, J.; Diroll, B. T.; Schaller, R. D.; Klimov, V. I. Colloidal quantum dot lasers. Nature Reviews Materials 2021, 6, 382–401
- Won et al. 2019 Won, Y. H.; Cho, O.; Kim, T.; Chung, D. Y.; Kim, T.; Chung, H.; Jang, H.; Lee, J.; Kim, D.; Jang, E. Highly efficient and stable InP/ZnSe/ZnS quantum dot light-emitting diodes. Nature 2019, 575, 634–638
- Kim et al. 2020 Kim, T.; Kim, K. H.; Kim, S.; Choi, S. M.; Jang, H.; Seo, H. K.; Lee, H.; Chung, D. Y.; Jang, E. Efficient and stable blue quantum dot light-emitting diode. Nature 2020, 586, 385–389
- Senellart et al. 2017 Senellart, P.; Solomon, G.; White, A. High-performance semiconductor quantum-dot single-photon sources. Nature Nanotechnology 2017, 12, 1026–1039
- Kramer and Sargent 2011 Kramer, I. J.; Sargent, E. H. Colloidal quantum dot photovoltaics: A path forward. ACS Nano 2011, 5, 8506–8514
- Kagan et al. 2016 Kagan, C. R.; Lifshitz, E.; Sargent, E. H.; Talapin, D. V. Building devices from colloidal quantum dots. Science 2016, 353
- Owen and Brus 2017 Owen, J.; Brus, L. Chemical Synthesis and Luminescence Applications of Colloidal Semiconductor Quantum Dots. Journal of the American Chemical Society 2017, 139, 10939–10943
- Smith and Nie 2010 Smith, A. M.; Nie, S. Semiconductor nanocrystals: Structure, properties, and band gap engineering. Accounts of Chemical Research 2010, 43, 190–200
- Boles et al. 2016 Boles, M. A.; Ling, D.; Hyeon, T.; Talapin, D. V. The surface science of nanocrystals. Nature Materials 2016, 15, 141–153
- Bayer et al. 2001 Bayer, M.; Hawrylak, P.; Hinzer, K.; Fafard, S.; Korkusinski, M.; Wasilewski, Z. R.; Stern, O.; Forchel, A. Coupling and entangling of quantum states in quantum dot molecules. Science 2001, 291, 451–453
- Stinaff et al. 2006 Stinaff, E. A.; Scheibner, M.; Bracker, A. S.; Ponomarev, I. V.; Korenev, V. L.; Ware, M. E.; Doty, M. F.; Reinecke, T. L.; Gammon, D. Optical signatures of coupled quantum dots. Science 2006, 311, 636–639
- Alivisatos et al. 1996 Alivisatos, A. P.; Johnsson, K. P.; Peng, X.; Wilson, T. E.; Loweth, C. J.; Bruchez, M. P.; Schultz, P. G. Organization of ‘nanocrystal molecules’ using DNA. Nature 1996, 382, 609–611
- Battaglia et al. 2005 Battaglia, D.; Blackman, B.; Peng, X. Coupled and decoupled dual quantum systems in one semiconductor nanocrystal. Journal of the American Chemical Society 2005, 127, 10889–10897
- Deutsch et al. 2013 Deutsch, Z.; Neeman, L.; Oron, D. Luminescence upconversion in colloidal double quantum dots. Nature Nanotechnology 2013, 8, 649–653
- Cui et al. 2019 Cui, J.; Panfil, Y. E.; Koley, S.; Shamalia, D.; Waiskopf, N.; Remennik, S.; Popov, I.; Oded, M.; Banin, U. Colloidal quantum dot molecules manifesting quantum coupling at room temperature. Nature Communications 2019, 10
- Cui et al. 2021 Cui, J.; Koley, S.; Panfil, Y. E.; Levi, A.; Waiskopf, N.; Remennik, S.; Oded, M.; Banin, U. Semiconductor Bow-Tie Nanoantenna from Coupled Colloidal Quantum Dot Molecules. Angewandte Chemie - International Edition 2021, 60, 14467–14472
- Cui et al. 2021 Cui, J.; Koley, S.; Panfil, Y. E.; Levi, A.; Ossia, Y.; Waiskopf, N.; Remennik, S.; Oded, M.; Banin, U. Neck Barrier Engineering in Quantum Dot Dimer Molecules via Intraparticle Ripening. Journal of the American Chemical Society 2021, 143, 19816–19823
- Koley et al. 2021 Koley, S.; Cui, J.; Panfil, Y. E.; Banin, U. Coupled Colloidal Quantum Dot Molecules. Accounts of Chemical Research 2021, 54
- Banin et al. 1999 Banin, U.; Cao, Y. W.; Katz, D.; Millo, O. Identification of atomic-like electronic states in indium arsenide nanocrystal quantum dots. Nature 1999, 400, 542–544
- Alivisatos 1996 Alivisatos, A. P. Semiconductor clusters, nanocrystals, and quantum dots. Science 1996, 271, 933–937
- Panfil et al. 2019 Panfil, Y. E.; Shamalia, D.; Cui, J.; Koley, S.; Banin, U. Electronic coupling in colloidal quantum dot molecules; the case of CdSe/CdS core/shell homodimers. Journal of Chemical Physics 2019, 151
- Koley et al. 2022 Koley, S.; Cui, J.; Panfil, Y. E.; Ossia, Y.; Levi, A.; Scharf, E.; Verbitsky, L.; Banin, U. Photon correlations in colloidal quantum dot molecules controlled by the neck barrier. Matter 2022, 5, 3997–4014
- Verbitsky et al. 2022 Verbitsky, L.; Jasrasaria, D.; Banin, U.; Rabani, E. Hybridization and deconfinement in colloidal quantum dot molecules. Journal of Chemical Physics 2022, 157
- Lubin et al. 2021 Lubin, G.; Tenne, R.; Ulku, A. C.; Antolovic, I. M.; Burri, S.; Karg, S.; Yallapragada, V. J.; Bruschini, C.; Charbon, E.; Oron, D. Heralded Spectroscopy Reveals Exciton-Exciton Correlations in Single Colloidal Quantum Dots. Nano Letters 2021, 21, 6756–6763
- Park et al. 2014 Park, Y. S.; Bae, W. K.; Pietryga, J. M.; Klimov, V. I. Auger recombination of biexcitons and negative and positive trions in individual quantum dots. ACS Nano 2014, 8, 7288–7296
- Ashner et al. 2019 Ashner, M. N.; Shulenberger, K. E.; Krieg, F.; Powers, E. R.; Kovalenko, M. V.; Bawendi, M. G.; Tisdale, W. A. Size-dependent biexciton spectrum in cspbbr3 perovskite nanocrystals. ACS Energy Letters 2019, 4, 2639–2645
- Oron et al. 2006 Oron, D.; Kazes, M.; Shweky, I.; Banin, U. Multiexciton spectroscopy of semiconductor nanocrystals under quasi-continuous-wave optical pumping. Physical Review B - Condensed Matter and Materials Physics 2006, 74
- Shulenberger et al. 2019 Shulenberger, K. E.; Ashner, M. N.; Ha, S. K.; Krieg, F.; Kovalenko, M. V.; Tisdale, W. A.; Bawendi, M. G. Setting an Upper Bound to the Biexciton Binding Energy in CsPbBr3 Perovskite Nanocrystals. Journal of Physical Chemistry Letters 2019, 10, 5680–5686
- You et al. 2015 You, Y.; Zhang, X. X.; Berkelbach, T. C.; Hybertsen, M. S.; Reichman, D. R.; Heinz, T. F. Observation of biexcitons in monolayer WSe 2. Nature Physics 2015, 11, 477–481
- Sitt et al. 2009 Sitt, A.; Della Sala, F.; Menagen, G.; Banin, U. Multiexciton engineering in seeded core/shell nanorods: Transfer from type-I to quasi-type-ll regimes. Nano Letters 2009, 9, 3470–3476
- Castañeda et al. 2016 Castañeda, J. A.; Nagamine, G.; Yassitepe, E.; Bonato, L. G.; Voznyy, O.; Hoogland, S.; Nogueira, A. F.; Sargent, E. H.; Cruz, C. H.; Padilha, L. A. Efficient Biexciton Interaction in Perovskite Quantum Dots under Weak and Strong Confinement. ACS Nano 2016, 10, 8603–8609
- Steinhoff et al. 2018 Steinhoff, A.; Florian, M.; Singh, A.; Tran, K.; Kolarczik, M.; Helmrich, S.; Achtstein, A. W.; Woggon, U.; Owschimikow, N.; Jahnke, F.; Li, X. Biexciton fine structure in monolayer transition metal dichalcogenides. Nature Physics 2018, 14, 1199–1204
- Oron et al. 2007 Oron, D.; Kazes, M.; Banin, U. Multiexcitons in type-II colloidal semiconductor quantum dots. Physical Review B - Condensed Matter and Materials Physics 2007, 75
- Vonk et al. 2021 Vonk, S. J.; Heemskerk, B. A.; Keitel, R. C.; Hinterding, S. O.; Geuchies, J. J.; Houtepen, A. J.; Rabouw, F. T. Biexciton Binding Energy and Line width of Single Quantum Dots at Room Temperature. Nano Letters 2021, 21, 5760–5766
- Lubin et al. 2021 Lubin, G.; Yaniv, G.; Kazes, M.; Ulku, A. C.; Antolovic, I. M.; Burri, S.; Bruschini, C.; Charbon, E.; Yallapragada, V. J.; Oron, D. Resolving the Controversy in Biexciton Binding Energy of Cesium Lead Halide Perovskite Nanocrystals through Heralded Single-Particle Spectroscopy. ACS Nano 2021, 15, 19581–19587
- Xu et al. 2017 Xu, W.; Hou, X.; Meng, Y.; Meng, R.; Wang, Z.; Qin, H.; Peng, X.; Chen, X. W. Deciphering Charging Status, Absolute Quantum Efficiency, and Absorption Cross Section of Multicarrier States in Single Colloidal Quantum Dots. Nano Letters 2017, 17, 7487–7493
- Nair et al. 2011 Nair, G.; Zhao, J.; Bawendi, M. G. Biexciton quantum yield of single semiconductor nanocrystals from photon statistics. Nano Letters 2011, 11, 1136–1140
- 41 Bertoni, A. CItool, 2011. https://github.com/andreabertoni/citool.
- Jacak et al. 2013 Jacak, L.; Hawrylak, P.; Wojs, A. Quantum dots; Springer Science & Business Media, 2013
- Llusar and Climente 2022 Llusar, J.; Climente, J. I. Highly Charged Excitons and Biexcitons in Type-II Core/Crown Colloidal Nanoplatelets. The Journal of Physical Chemistry C 2022, 126, 7152–7157
- Llusar and Climente 2022 Llusar, J.; Climente, J. I. Shell Filling and Paramagnetism in Few-Electron Colloidal Nanoplatelets. Phys. Rev. Lett. 2022, 129, 066404