The beaming effect for Fermi-LAT-detected FR-I radio galaxies
Abstract
Our knowledge of Giga-electron volt (GeV) radio galaxies has been revolutionized by the Fermi-LAT Telescope, which provides an excellent opportunity to study the physical properties of GeV radio galaxies. According to the radio power and morphology, radio galaxies can be separated into Fanaroff-Riley Type I radio galaxies (FR-Is) and Type II radio galaxies (FR-IIs). In this paper, we consider the unification of FR-Is and BL Lacertae objects (BL Lacs), and assume FR-Is to be a standard candle to discuss the beaming effect for Fermi-LAT-detected FR-Is. Our main conclusions are as follows: (1) The estimated Doppler factors for 30 Fermi-LAT-detected FR-Is are in a range of . The average Doppler factor () of the 30 FR-Is is smaller than that () of the 126 Fermi-LAT-detected BL Lacs, supporting the unification model that FR-Is are regarded as the misaligned BL Lacs with smaller Doppler factors; (2) We propose that different regions of FR-Is in the plot of the -ray luminosity against the photon spectral index may indicate the different beaming effects; (3) The average Doppler factor of the 6 TeV FR-Is is similar to that of the 24 non-TeV FR-Is, which implies that the difference between the TeV and GeV emissions is not driven by the beaming effect in the Fermi-LAT-detected FR-I samples.
1 Introduction
Active galactic nuclei (AGNs) are the most energetic objects with relativistic jets in the Universe. Their physical structure, supermassive black hole (SMBH) + accretion disk + relativistic jet, is widely accepted for decades (Urry & Padovani, 1995). Blazars are an extreme subclass of AGNs with the jet being aligned with our line of sight, which can be separated into BL Lacertae objects (BL Lacs) with weak or no emission lines (equivalent width, EW), or flat spectrum radio quasars (FSRQs) with broad emission lines (EW) (Stickel et al., 1991; Urry & Padovani, 1995). Their electromagnetic emission is strongly boosted due to the relativistic jet pointing toward the observer, resulting that the observed flux density () is enhanced by the Doppler factor (), namely , where denotes the intrinsic flux density, for a continuous jet and for the case of a moving sphere (Lind & Blandford, 1985; Ghisellini et al., 1993), is a spectral index (). The Doppler factor can be expressed by , where is an viewing angle, and is a Lorentz factor determined by bulk velocity (), .
Radio galaxies are also a subclass of AGNs. Based on the morphology and radio power, Fanaroff & Riley (1974) classified the radio galaxies into Fanaroff-Riley Type I radio galaxies (FR-Is) and Type II radio galaxies (FR-IIs). FR-Is are lower radio power sources ( erg s-1 Hz-1) with lobe dimmed morphology, while FR-IIs are all high radio power sources ( erg s-1 Hz-1) with one sided kpc-scale jet and bright lobe (Fanaroff & Riley, 1974). According to the unified schemes (Urry & Padovani, 1995), radio galaxies are regarded as edge-on blazars with smaller Doppler factors and larger viewing angles. Thus radio galaxies are expected to be the homologous population of blazars, namely, FR-Is and FR-IIs are unified with BL Lacs and FSRQs, respectively.
Since the launch of the Large Area Telescope on board the Fermi Gamma-ray Telescope (hereafter, Fermi-LAT) in 2008, blazars are the majority of Fermi-LAT-detected sources (Abdollahi et al., 2020). Fermi-LAT-detected blazars show stronger beaming effects than non-Fermi-LAT-detected blazars (Pushkarev et al., 2009; Wu et al., 2014; Chen et al., 2015b; Fan et al., 2015; Xiao et al., 2019; Pei et al., 2020a). Of the 3511 AGNs detected by the Fermi-LAT incremental Data Release (4FGL-DR2), only 44 sources are identified as radio galaxies (Abdollahi et al., 2020). Based on the unification of blazars and radio galaxies, it is reasonable to consider that Fermi-LAT-detected radio galaxies may be the transition sources that exhibit intermediate Doppler beaming effects or special properties, due to these objects residing on the boundary between blazars and radio galaxies.
Bassi et al. (2018) analyzed the multiband properties of a Fermi-LAT-detected FR-I named IC 1531 (4FGL J0009.7-3217), and concluded that IC 1531 is a jet-dominated source showing a moderate Doppler boosted flux amplification. This source is potentially a good observational target residing on the boundary between blazars and radio galaxies (Bassi et al., 2018).
Another Fermi-LAT-detected FR-I, NGC 1275 (4FGL J0319.8+4130), also shows particular observational properties that are similar to those of blazars: rapid variability, strong polarization, and high -ray luminosity (Martin et al., 1976; Abdo et al., 2010a; Sahakyan et al., 2018), which may be caused by the strong beaming effect. 3C 120 (4FGL J0433.0+0522) is a broad-line radio galaxy (BLRG) with a blazar-like jet, which has been discussed by many authors due to its rapid variability in the Giga-electron volt (GeV) band. The rapid variability suggests that the -ray emission of 3C 120 originates from a very compact region (Casadio et al., 2015; Rulten et al., 2020). Casadio et al. (2015) analyzed the jet properties of 3C 120 based on radio and -ray data from 2012 to 2014, and found that the apparent superluminal motion is as high as 6.2. When the viewing angle is very small, according to the relationship , a viewing angle of is obtained, which corresponds to a Doppler factor of 6.2. Jones et al. (2001) comprehensively studied the jets and lobes of Cen B (4FGL J1346.3-6026) using data from the Australia Telescope Compact Array and Molonglo Observatory Synthesis Telescope. Both jet-counterjet ratio brightness and polarization asymmetries imply the relativistic Doppler factor involved (Jones et al., 2001; Katsuta et al., 2013). The Tera-electron volt (TeV) emission of IC 310 (4FGL J0316.8+4120) was first detected by MAGIC (Major Atmospheric Gamma Imaging Cherenkov Telescope) observations in 2009-2010 (Aleksić et al., 2010). The variability timescale of IC 310 is as short as 5 mins, which is the fastest variability up to now (Aleksić et al., 2014). Based on Very Long Baseline Interferometry (VLBI) data, Kadler et al. (2012) found that IC 310 has a one-sided blazar-like jet. The jet-to-counterjet ratio constrains the jet viewing angle to be , implying a moderate beaming.
Xue et al. (2017) adopted the one-zone leptonic model to fit the spectral energy distributions (SEDs) of 12 GeV radio galaxies, and ascertained that the SED-derived Doppler factors are in a range of , suggesting that some GeV radio galaxies with larger Doppler factors may have smaller viewing angles of jets like blazars.
Radio galaxies are regarded as the parent population of blazars, whose jet direction is pointing away from the observer (Ghisellini et al., 1993; Urry & Padovani, 1995). We consider that some radio galaxies keep small viewing angles and moderate beaming effects, particularly for Fermi-LAT-detected radio galaxies. Our aim in the present work is to estimate the Doppler factors and discuss the beaming effect for these AGNs. This paper is arranged as follows: In Section 2, we collected -ray properties and estimated the Doppler factors for Fermi-LAT-detected FR-Is, and we discussed the beaming effect for Fermi-LAT-detected FR-Is in Section 3. Finally, we draw our conclusions in Section 4. For this work we assumed a -CMD cosmology where , and = 73 km s-1 Mpc-1 (Planck Collaboration et al., 2016).
2 Samples and results
2.1 FR-I samples
Based on the catalog of 4FGL-DR2, 44 radio galaxies are detected by Fermi-LAT (Abdollahi et al., 2020). We adopted the classifications of Angioni et al. (2020), Harvey et al. (2020), and Rulten et al. (2020) to classify 44 radio galaxies into FR Type I or Type II radio galaxies. If these references render discrepant classifications for the same sources, we searched other references to classify them. Finally, 44 sources are separated into 30 FR-Is, 10 FR-IIs, and 3 uncertain type radio galaxies (4FGL J0958.3-2656, 4FGL J1236.9-7232, 4FGL J1724.2-6501). Subject to the FR-II samples, we only focused on the 30 Fermi-LAT-detected FR-Is and collected their redshifts from the NASA/IPAC Extragalactic Database (NED) to estimate the Doppler factors and discuss their beaming effect in the -ray band. The corresponding properties and derived results of the 30 FR-Is are listed in Table 1. All the FR-Is are nearby radio galaxies with redshift 0.12. The -ray flux densities are calculated from the integral photon fluxes and the -ray luminosities are obtained from, , where is the luminosity distance determined by the redshift:
| (1) |
The -ray flux densities and corresponding -ray luminosities for our sample are listed in Col. (5) and (6) of Table. 1.
| 4FGL Name | Other Name | |||||||
|---|---|---|---|---|---|---|---|---|
| ( erg/cm2/s) | (erg/s) | |||||||
| (1) | (2) | (3) | (4) | (5) | (6) | (7) | (8) | (9) |
| J0009.7-3217 | IC 1531 | 0.026 | 2.15 | -12.01 | 42.10 | 1.63 | 2.20 | 1.21 |
| J0057.7+3023 | NGC 315 | 0.016 | 2.37 | -11.87 | 41.82 | 1.31 | 1.73 | 0.99 |
| J0153.4+7114 | TXS 0149+710 | 0.022 | 1.89 | -11.60 | 42.42 | 2.21 | 3.06 | 1.59 |
| J0237.7+0206 | PKS 0235+017 | 0.022 | 2.15 | -12.08 | 41.88 | 1.39 | 1.88 | 1.03 |
| J0308.4+0407 | NGC 1218 | 0.029 | 1.97 | -11.22 | 42.99 | 3.36 | 4.61 | 2.44 |
| J0316.8+4120 | IC 0310 | 0.019 | 1.85 | -11.61 | 42.23 | 1.91 | 2.66 | 1.37 |
| J0319.8+4130 | NGC 1275 | 0.018 | 2.11 | -9.64 | 44.14 | 7.49 | 10.15 | 5.53 |
| J0322.6-3712e | Fornax A | 0.006 | 2.07 | -11.42 | 41.39 | 0.97 | 1.33 | 0.72 |
| J0334.3+3920 | 4C +39.12 | 0.021 | 1.81 | -11.71 | 42.20 | 1.88 | 2.63 | 1.34 |
| J0433.0+0522 | 3C 120 | 0.033 | 2.74 | -11.56 | 42.80 | 2.32 | 2.98 | 1.80 |
| J0627.0-3529 | PKS 0625-35 | 0.055 | 1.92 | -10.96 | 43.86 | 6.85 | 9.47 | 4.95 |
| J0708.9+4839 | NGC 2329 | 0.019 | 1.77 | -11.94 | 41.97 | 1.56 | 2.20 | 1.11 |
| J0758.7+3746 | NGC 2484 | 0.043 | 2.20 | -12.09 | 42.47 | 2.12 | 2.85 | 1.58 |
| J0931.9+6737 | NGC 2892 | 0.023 | 2.28 | -11.62 | 42.41 | 2.00 | 2.67 | 1.50 |
| J1116.6+2915 | B2 1113+29 | 0.049 | 1.39 | -12.32 | 42.41 | 2.58 | 3.83 | 1.74 |
| J1144.9+1937 | 3C 264 | 0.022 | 2.00 | -12.00 | 42.04 | 1.59 | 2.18 | 1.16 |
| J1149.0+5924 | NGC 3894 | 0.011 | 2.18 | -11.89 | 41.53 | 1.07 | 1.44 | 0.80 |
| J1219.6+0550 | NGC 4261 | 0.007 | 2.08 | -11.91 | 41.25 | 0.88 | 1.19 | 0.65 |
| J1230.8+1223 | M 87 | 0.004 | 2.06 | -10.96 | 41.81 | 1.33 | 1.82 | 0.98 |
| J1306.3+1113 | TXS 1303+114 | 0.086 | 1.98 | -11.98 | 43.26 | 4.11 | 5.63 | 2.99 |
| J1325.5-4300 | Cen A | 0.002 | 2.64 | -10.86 | 41.30 | 0.92 | 1.20 | 0.71 |
| J1346.3-6026 | Cen B | 0.013 | 2.40 | -10.92 | 42.66 | 2.30 | 3.04 | 1.74 |
| J1449.5+2746 | B2.2 1447+27 | 0.031 | 1.54 | -12.12 | 42.19 | 1.99 | 2.88 | 1.37 |
| J1518.6+0614 | TXS 1516+064 | 0.102 | 1.75 | -11.95 | 43.44 | 5.41 | 7.63 | 3.84 |
| J1521.1+0421 | PKS B1518+045 | 0.052 | 2.04 | -12.02 | 42.76 | 2.75 | 3.75 | 2.01 |
| J1630.6+8234 | NGC 6251 | 0.025 | 2.37 | -11.22 | 42.88 | 2.70 | 3.57 | 2.04 |
| J1843.4-4835 | PKS 1839-48 | 0.111 | 2.03 | -11.98 | 43.49 | 4.77 | 6.52 | 3.50 |
| J2227.9-3031 | ABELL 3880 | 0.058 | 1.98 | -12.08 | 42.78 | 2.85 | 3.91 | 2.07 |
| J2329.7-2118 | PKS 2327-215 | 0.031 | 2.45 | -11.81 | 42.46 | 2.00 | 2.62 | 1.52 |
| J2341.8-2917 | PKS 2338-295 | 0.052 | 2.24 | -12.02 | 42.73 | 2.53 | 3.39 | 1.89 |
2.2 Standard candles
From the radio-loud AGNs unification, the parent population of BL Lacs consists of FR-Is (Ghisellini et al., 1993; Urry & Padovani, 1995; Bai & Lee, 2001; Xu et al., 2009; Chen et al., 2015a). Urry & Padovani (1995) proposed that the mean host galaxy magnitude for nearby BL Lacs ( 0.2) is , which is similar to the mean magnitude for nearby FR-Is, .
Urry et al. (2000) reported Hubble Space Telescope (HST) images of 85 BL Lac host galaxies and obtained their median K-corrected absolute magnitude with a small dispersion of 0.6 mag. As mentioned in Falomo et al. (2014), the host galaxies of BL Lacs can be regarded as the standard candles, since the host galaxies of BL Lacs exhibited a relatively narrow range of absolute magnitudes in the optical band.
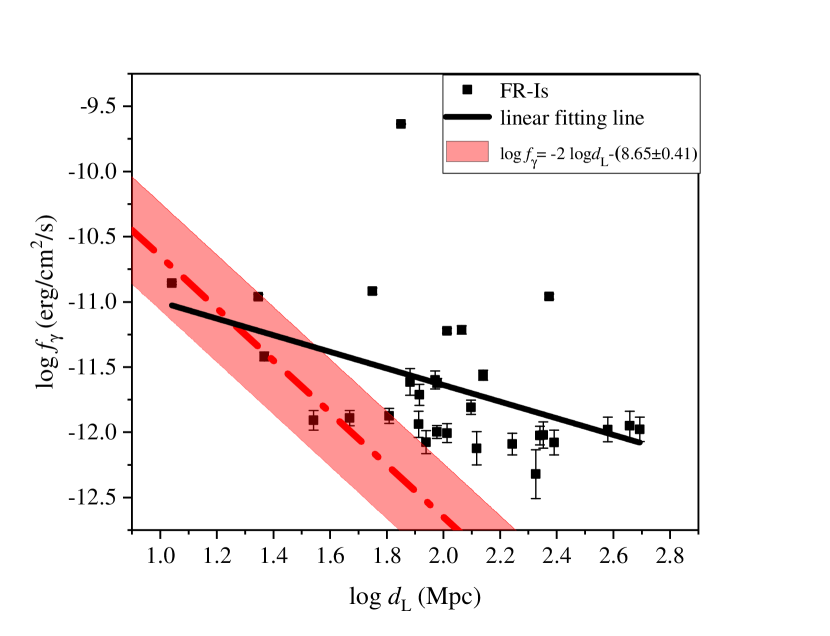
The ranges of absolute magnitudes for radio galaxies are also narrow with a small dispersion (Sandage, 1972; Hine & Longair, 1979; Magliocchetti et al., 2002a, b). A study of the optical properties for 350 nearby FR-Is, shows their absolute magnitudes () are distributed within a narrow interval around -21.3, suggesting that FR-Is are reliable standard candles (Magliocchetti et al., 2002b). Based on the optical properties of FR-Is, we consider FR-Is as a standard candle and assume that the luminosity for FR-Is is a constant; therefore, the logarithm of the flux density () will be expected to have a linear correlation with their logarithm of the luminosity distance (), const (Fan & Xie, 1996; Ye et al., 2021). The correlation between the logarithm of the -ray flux densities () and the logarithm of the luminosity distances () for the 30 Fermi-LAT-detected FR-Is are plotted in Fig. 1. The best-fitting ( black solid line) is shown in Fig. 1 [ with , ]. Although the flux densities are correlated with their luminosity distances in the -ray band, the slope is not the same as the expected value of . We proposed that this difference may be due to a moderate beaming effect in Fermi-LAT-detected FR-Is.
2.3 BL Lac samples
BL Lacs show extreme observational properties, which are due to the beaming effect. The observed flux density () of BL Lacs is amplified by the Doppler factor (), , and the corresponding observed luminosity (, in units of erg/s) is also enhanced: , where is the intrinsic luminosity in units of erg/s, for (a continuous jet) or (the case of a moving sphere) (Ghisellini et al., 1993; Dondi & Ghisellini, 1995; Fan et al., 2013a). If the Doppler factor is assumed to be =10 (average Doppler factor of BL Lacs in this work) in the case of a continuous jet (Fan et al., 1997; Mondal & Mukhopadhyay, 2019; Pei et al., 2020b) and a -ray spectral index of 1, the difference between the observed luminosity and the intrinsic luminosity will be up to 4 orders of magnitude. Therefore, the observed -ray luminosity of Fermi-LAT-detected BL Lacs is strongly boosted on account of the beaming effect (Dondi & Ghisellini, 1995; Fan et al., 2013a; Chen et al., 2015b; Yang et al., 2022).
The Doppler factor is important for understanding the physics of blazars, but obtaining a reliable estimate is challenging because it is often difficult to determine accurate viewing angles and bulk velocities from observations. As a result, many indirect methods for estimating the Doppler factor have been proposed (Ghisellini et al., 1993; Valtaoja et al., 1999; Zhang et al., 2002; Fan et al., 2009; Hovatta et al., 2009; Fan et al., 2013b, 2014; Liodakis et al., 2018; Pei et al., 2020b; Zhang et al., 2020). Such as the variability Doppler factor estimations from the differences between the observed brightness temperature and equipartition brightness temperature (Valtaoja et al., 1999; Fan et al., 2009; Hovatta et al., 2009; Liodakis et al., 2018); the SED-derived Doppler factors from the SED fitting (Chen, 2018); the Doppler factor estimations from the combination between the X-ray data and the synchrotron self-Compton (SSC) model (Ghisellini et al., 1993); the lower limit of the -ray Doppler factor estimations from the pair-production opacity in the -ray emissions (Dondi & Ghisellini, 1995; Fan et al., 2013b, 2014; Pei et al., 2020b); the Doppler factor estimations from the correlations between the broad-line luminosity and -ray luminosity (Zhang et al., 2020). Zhang et al. (2002) assumed that the multiband radiation of blazars originates from accelerated particles in the jet and used the multiband data to obtain the Doppler factors of blazars at different wavebands (radio, optical, X-ray, and -ray). The authors showed that, on average, radio and -ray Doppler factors are comparable.
As mentioned in Liodakis et al. (2018), the variability Doppler factor method is the best way to describe the blazar populations. Furthermore, the averaged -ray Doppler factor is comparable to the averaged radio Doppler factor (Zhang et al., 2002). Therefore, the Doppler factors given in Liodakis et al. (2018) can be adopted to calculate the intrinsic -ray luminosity as in Yang et al. (2022).
Zhang et al. (2020) obtained the Doppler factors from the correlations between the -ray luminosity and broad-line luminosity, and concluded that their Doppler factors are consistent with the results in Liodakis et al. (2018). Therefore, The Doppler factors reported from Zhang et al. (2020) are also available to obtain the intrinsic luminosity.
Following the method of Mattox et al. (1993), Pei et al. (2020b) assumed that the X-ray and -ray emissions are from the same region and the -ray variability timescale is around one day to estimate the -ray Doppler factors. However, this method can only obtain the lower limit of the -ray Doppler factors, which will cause the intrinsic luminosity to be an upper limit value. Therefore, the Doppler factors of Pei et al. (2020b) are not considered in this work.
By cross-checking the Doppler factors (Liodakis et al., 2018; Zhang et al., 2020) and Fermi-LAT-detected BL Lacs (Abdollahi et al., 2020), we compiled a sample of 126 Fermi-LAT-detected BL Lacs with available Doppler factors. We took the Doppler factors from Zhang et al. (2020) for 22 sources in common. If the Doppler factor , is adopted to compute the intrinsic luminosity, namely, . The detailed parameters for BL Lacs are listed in Table 2.
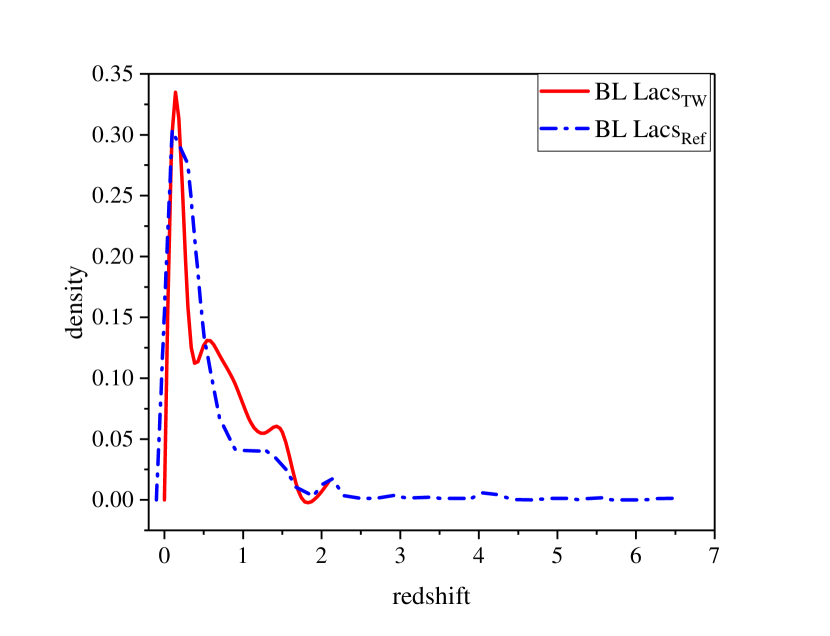
The redshift distribution of the 126 Fermi-LAT-detected BL Lacs in this work (BL LacsTW) is in a range from 0.030 to 2.017 with an average of 0.578, as shown in Fig. 2 (red solid line). We also collected the redshifts from NASA/NED for the whole Fermi-LAT-detected BL Lacs, and obtained a sample of 845 BL Lacs with available redshifts. The redshift distribution for the 845 Fermi-LAT-detected BL Lacs (BL LacsRef) is from 0.00001 and the average is 0.448, which is also presented in Fig. 2 (blue dotted-dash line). From this figure, the redshift distribution of BL LacsTW is similar to that of BL LacsRef, and the difference between their average values is very small, suggesting that the 126 Fermi-LAT-detected BL Lacs in this work are representative of the much larger sample of Fermi-LAT-detected BL Lacs.
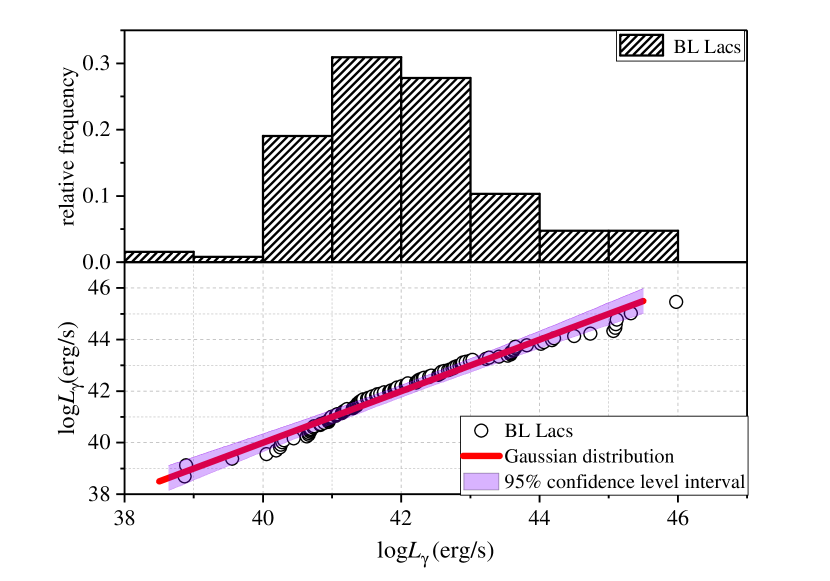
By employing the Doppler factors of Liodakis et al. (2018) and Zhang et al. (2020), we computed the intrinsic luminosities () for the 126 Fermi-LAT-detected BL Lacs in the case of a continuous jet (Fan et al., 1997; Mondal & Mukhopadhyay, 2019; Pei et al., 2020b), , in which is a -ray spectral index, . The intrinsic luminosity for the 126 BL Lacs ranges from 38.87 to 45.98 with an average of , and the median intrinsic luminosity is 41.91, as shown in the upper panel of Fig. 3. The intrinsic luminosity distribution for the 126 BL Lacs is compared with the Gaussian distribution by using the Kolmogorov-Smirnov (K-S) test. The hypothesis for the K-S test is to discriminate between two independent samples, and the probability value threshold that we are using is 0.05. The value for the K-S test between our sample and the Gaussian distribution is , supporting that our intrinsic luminosity sample can be regarded as the Gaussian distribution. The Quantile-quantile (QQ) plot is also applied for the visual inspection (the lower panel of Fig. 3); most of our data are located in the area of 95% confidence level interval of the Gaussian distribution (purple shaded area), so we believed that our sample can be analyzed by a Gaussian fitting. The peak value for the Gaussian fitting is erg/s, which is regarded as the intrinsic luminosity for the whole BL Lac sample. The 95% confidence level interval is adopted to the error for the intrinsic luminosity, erg/s. Compared with the average of our intrinsic luminosity sample, this intrinsic luminosity () obtained from the peak value of the Gaussian fitting is less affected by outliers, which is more representative of the intrinsic luminosity of 126 BL Lacs in this work.
2.4 Doppler factors
From the unification of BL Lacs and FR-Is (Ghisellini et al., 1993; Urry & Padovani, 1995; Bai & Lee, 2001; Xu et al., 2009; Chen et al., 2015a), the intrinsic emissions (after removing the beaming effect) of BL Lacs should be similar to those of FR-Is. Hence we adopted the intrinsic luminosity ( erg/s) of the 126 BL Lacs as the intrinsic luminosity of the 30 FR-Is. Therefore, the expected relation between the -ray flux density and the luminosity distance can be obtained in the case of the luminosity constant of erg/s, . This linear relation with its error is presented in Fig. 1 (red dotted-dash line with red shaded area). The difference between the observed -ray flux densities of FR-Is and the red shaded area may derive the Doppler factors,
| (2) |
where denotes the observed flux densities of FR-Is. The corresponding -ray Doppler factors with their possible maximum and minimum values are listed in Col. 7-9 of Table 1.
| 4FGL Name | Ref | ||||||
| ( erg/cm2/s) | (erg/s) | (erg/s) | |||||
| (1) | (2) | (3) | (4) | (5) | (6) | (7) | (8) |
| J0006.3-0620 | 0.347 | 2.13 | -12.04 | 44.54 | 6.96 | L18 | 41.06 |
| J0014.1+1910 | 0.473 | 2.28 | -11.87 | 45.02 | 5.99 | Z20 | 41.70 |
| J0037.8+1239 | 0.090 | 2.22 | -11.37 | 43.90 | 2.51 | L18 | 42.21 |
| J0047.0+5657 | 0.747 | 2.16 | -11.19 | 46.19 | 21.03 | L18 | 40.69 |
| J0049.7+0237 | 1.474 | 2.21 | -11.04 | 47.07 | 12.83 | L18 | 42.41 |
| J0050.7-0929 | 0.634 | 2.02 | -10.54 | 46.67 | 20.23 | L18 | 41.42 |
| J0056.8+1626 | 0.206 | 2.20 | -11.99 | 44.06 | 5.89 | L18 | 40.83 |
| J0105.1+3929 | 0.440 | 2.30 | -11.57 | 45.25 | 16.12 | L18 | 40.06 |
| J0113.7+0225 | 0.047 | 2.48 | -11.98 | 42.71 | 0.97 | L18 | 42.71 |
| J0127.2-0819 | 1.416 | 2.18 | -11.30 | 46.78 | 14.59 | L18 | 41.92 |
| J0127.9+4857 | 0.067 | 2.59 | -11.98 | 43.02 | 7.95 | L18 | 38.89 |
| J0141.4-0928 | 0.733 | 2.15 | -10.80 | 46.56 | 15.19 | L18 | 41.65 |
| J0153.9+0823 | 0.681 | 1.95 | -10.90 | 46.38 | 7.63 | L18 | 42.89 |
| J0203.7+3042 | 0.760 | 2.24 | -10.84 | 46.56 | 24.58 | Z20 | 40.66 |
| J0209.9+7229 | 0.895 | 2.28 | -11.30 | 46.27 | 20.81 | L18 | 40.64 |
| J0211.2+1051 | 0.200 | 2.12 | -10.46 | 45.56 | 8.41 | L18 | 41.76 |
| J0217.2+0837 | 0.085 | 2.27 | -11.05 | 44.17 | 2.77 | L18 | 42.28 |
| J0238.6+1637 | 0.940 | 2.16 | -10.13 | 47.50 | 33.52 | Z20 | 41.14 |
| … | … | … | … | … | … | … | … |
3 Discussions
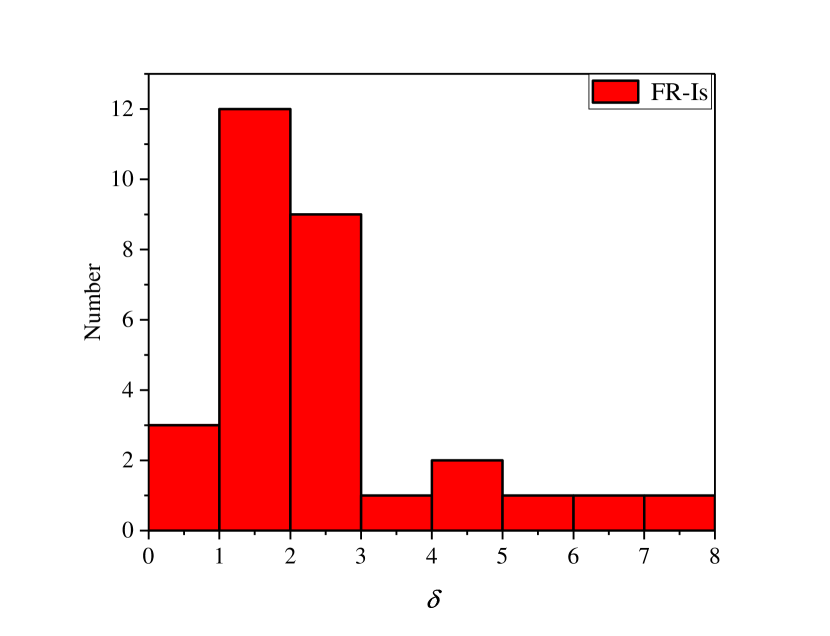
Our understanding of the extragalactic -ray sky has been revolutionized by Fermi-LAT, in particular, the -ray sky of AGNs, in which more than 98% extragalactic sources are blazars, and only 44 sources are identified as radio galaxies in 4FGL-DR2 (Abdollahi et al., 2020). Some Fermi-LAT-detected radio galaxies show blazar-like observational properties, such as rapid variability, strong polarization, superluminal motion or high -ray luminosity (Martin et al., 1976; Bailey et al., 1986; Abdo et al., 2010a; Casadio et al., 2015; Sahakyan et al., 2018; Rulten et al., 2020). Like blazars, these special observational properties may be caused by the jet, which prompts us to consider the beaming effect (modest or strong) for these Fermi-LAT-detected radio galaxies. The -ray Doppler factor for the 30 Fermi-LAT-detected FR-Is is in a range from to . and their distribution is shown in Fig. 4.
The average Doppler factor of the 30 Fermi-LAT-detected FR-Is, , is significantly smaller than that () of the 126 Fermi-LAT-detected BL Lacs in this work. This is consistent with the unified scheme that FR-Is are the parent population of BL Lacs, which have larger viewing angles and smaller Doppler factors.
3.1 Weak beaming
6 of 30 Fermi-LAT-detected FR-Is residing in the red shaded area [] of Fig. 1 may be lobe-dominated FR-Is, of which the dominant emission is located further down the parsec scale jet as opposed to the core. M87 is the first detected TeV radio galaxy showing the shortest variability as short as 2 days (Aharonian et al., 2006). The jet viewing angle is constrained at (Bicknell & Begelman, 1996; Acciari et al., 2011). During the monitoring of VLBA, its average apparent superluminal motion in the core is 1.1. Adopting the jet orientation angle , one can obtain the average Doppler factor for M87. Ghisellini et al. (1993) combined the X-ray emission and SSC model to estimate the Doppler factor of M87 (). Liodakis et al. (2018) calculated the difference between the observed brightness temperature and equipartition brightness temperature to estimate the Doppler factor of M87 (). Our Doppler factor estimation for M87, , is consistent with previous results, also indicating that the total emission of M87 is not significantly boosted by its jet.
Cen A, the first FR-I whose core and lobe emissions can be separated by Fermi-LAT (Abdo et al., 2010b), had been found that the -ray jet morphology is similar to the radio one, implying the -ray emission is from the core and lobe components. Assuming a power law for the -ray spectra of Cen A, Abdo et al. (2010b) found a large fraction () of the -ray emission of Cen A to originate from the lobe. Its radio 5GHz core flux density (6.98 Jy) is significantly smaller than its 5GHz extended flux density (55.85 Jy) (Di Mauro et al., 2014). The Doppler factors for the core of Cen A were estimated by the single-zone SSC model (=1), the SSC model excluding X-rays (=3.9), the SSC model for High Energy Stereoscopic System data only (=3.1) (Abdo et al., 2010c) or the decelerating jet model ( for the case of ) (Georganopoulos & Kazanas, 2003; Abdo et al., 2010c). Our derived Doppler factor for Cen A () is consistent with the estimation in the case of the decelerating jet model.
Fornax A is the second FR-I whose -ray emission can be observed from the lobe by Fermi-LAT (Ackermann et al., 2016). Ackermann et al. (2016) reported its GeV band behavior using 6.1 years of Fermi-LAT data, and concluded that its -ray emission originates in the lobes and the core emission contributes the total emission no more than 14%. Its radio 5GHz core flux density (0.05 Jy) also accounts for a small fraction of the total flux density (72 Jy) (Di Mauro et al., 2014). Our Doppler factor estimation for Fornax A () is also small, supporting that the core emission is not boosted by its jet. The small estimations for Cen A and Fornax A may account for the core and lobe emissions separated by Fermi-LAT. Some Doppler factors in the FR-I samples may be due to the systematic error or the limitation of this method.
NGC 315 was first identified as a radio galaxy in 4FGL (Abdollahi et al., 2020). Park et al. (2021) employed VLBA observation to investigate the jet collimation and acceleration of NGC 315. They found an apparent outward motion () of the core of NGC 315, then combined the jet-to-counterjet ratio to constrain the jet viewing angle of . They suggested that the flux density of NGC 315 from the Doppler boosting effect is at most by a factor of about two. Our Doppler factor estimation for NGC 315 () is suggesting that the flux density of NGC 315 is not strongly enhanced by a Doppler factor, in accordance with Park et al. (2021).
Besides the four FR-Is mentioned above, the other two FR-Is (NGC 3894, NGC 4261) are also possessing the Doppler factors , first reported in 4FGL. There is one FR-I, NGC 4261, whose -ray properties ( erg/s, , ) are similar to those ( erg/s, , ) of Fornax A, and the redshifts between NGC 4261 (0.007) and Fornax A (0.006) are similar. We hoped that NGC 4261 is a potential target whose dominant -ray emissions in the lobe component can be detected by Fermi-LAT in the future just like the observations of Fornax A.
3.2 Modest or strong beaming
24 of 30 Fermi-LAT-detected FR-Is residing outside the red shaded area [] of Fig. 1 may show modest or strong Doppler-boosted flux amplification. IC 1531 is classified as a radio galaxy in Abdollahi et al. (2020), but as a blazar of uncertain type in the third source catalog (3FGL) (Acero et al., 2015). Bassi et al. (2018) used the multiband data to investigate its nature and jet properties, and concluded that IC 1531 is seen at moderate angles () and presented a moderate Doppler beaming effect in the flux emission. They also assembled the multiband data to fit the SED of the core of IC 1531, in which the -ray flux of IC 1531 can be explained by the SSC model with . When a viewing angle of is adopted (Bassi et al., 2018), the SED-derived Doppler factor corresponds to . For IC 1531, our Doppler factor estimation () is smaller than the SED-derived Doppler factor (3.86) from Bassi et al. (2018).
3C 120 shows a blazar-like jet with a Doppler factor of 6.2 (Casadio et al., 2015). Hovatta et al. (2009) compared the observed radio brightness temperature and radio equipartition brightness temperature to obtain the Doppler factor () of 3C 120. Our Doppler factor estimation for 3C 120, , is derived from the average flux density during the Fermi-LAT observations. The rapid short-timescale -ray flux variability of 3C 120 can be observed during the Fermi-LAT observations. If the -ray flux density is adopted from the prominent flare, our estimated Doppler factor for 3C 120 will increase to be comparable to the Doppler factors of Casadio et al. (2015) and Hovatta et al. (2009).
IC 310 presented a one-sided blazar-like jet during VLBI observations, implying a Doppler factor involved (Kadler et al., 2012). Ghisellini et al. (1993) estimated the Doppler factor of IC 310, , based on the X-ray emission and SSC model; Liodakis et al. (2018) obtained the radio variability Doppler factor, , from the difference between the observed brightness temperature and equipartition brightness temperature. Our Doppler factor estimation for IC 310 () is consistent with the previous results.
PKS 0625-35, a TeV-detected source, displays both FR-I and BL Lac properties (Wills et al., 2004; Rani, 2019). Based on the Tracking Active Nuclei with Austral Milliarcsecond Interferometry (TANAMI) observations, Mueller et al. (2012) found the presence of the superluminal motion of 3 in the jet of PKS 0625-35. The superluminal motion of 3 is also later confirmed by Angioni et al. (2019). The jet viewing angle for PKS 0625-35 is constrained to from the X-ray variability (HESS Collaboration et al., 2018), or from the VLBI observations (Angioni et al., 2019). Our Doppler factor estimation for PKS 0625-35, , is similar to the median Doppler factor () of the 126 BL Lacs in this work, suggesting that this FR-I is a misaligned blazar producing a strong beaming effect.
Our Doppler factor estimation () for NGC 1275 is the largest value in the FR-I samples, which is also similar to the median Doppler factor () of the 126 BL Lacs. From the radio observations, Hovatta et al. (2009) obtained the observed brightness temperature of NGC 1275 and assumed the equipartition temperature as K to calculate the variability Doppler factor () for NGC 1275. The significant discrepancy between the variability Doppler factor () and our Doppler factor () may be due to the possible bending in the jet of NGC 1275 (Pei et al., 2020b). If the jet of NGC 1275 is aligned to the observer in the -ray emission region but is bent to a large viewing angle in the radio emission region, it may lead to this discrepancy.
The observational properties of the 24 FR-Is residing outside the red shaded area of Fig. 1, are likely to exhibit modest or strong Doppler beaming effects. As discussed in Abdo et al. (2010a), the -ray luminosities for some Fermi-LAT-detected radio galaxies are similar to those of blazars, implying a strong beaming effect for the -ray emission. These 24 FR-Is are likely effective transition sources between the lobe-dominated FR-Is and blazars.
3.3 Intrinsic luminosity
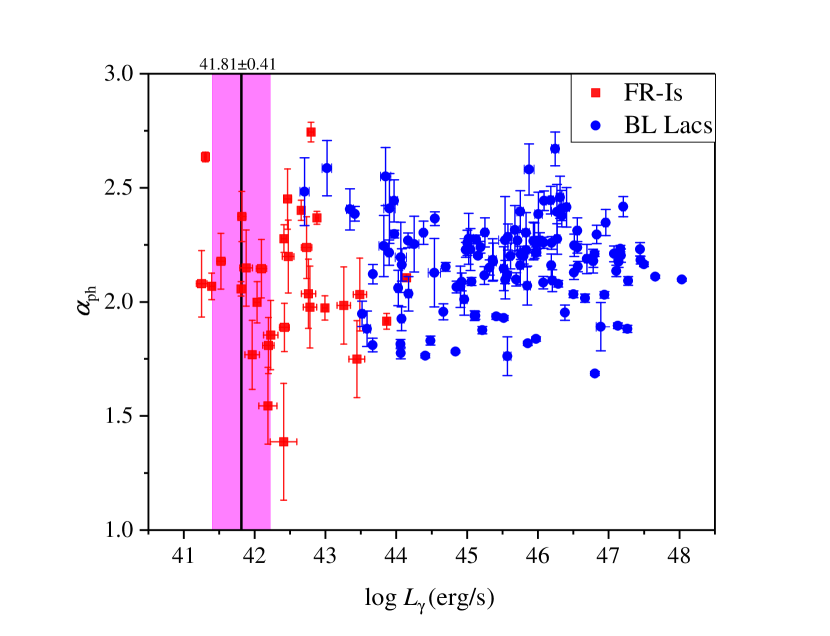
If we consider the unification of BL Lacs and FR-Is (Ghisellini et al., 1993; Urry & Padovani, 1995), it is expected that the observed -ray luminosity of FR-Is should be similar to the intrinsic luminosity of BL Lacs; however, as shown in the Fig. 5, most FR-Is have larger observed -ray luminosities than the intrinsic luminosity ( erg/s) of BL Lacs. Figure 5 shows that the -ray luminosities of some FR-Is fall between the intrinsic luminosity band (pink shaded area, erg/s) and the cluster of BL Lacs (blue-filled circles), which resemble a bridge linking both AGN classes. The observed -ray luminosities for the lobe-dominated FR-Is are comparable with the intrinsic luminosity. Those FR-Is with high -ray luminosity showing special observational properties are thought to be caused by the strong beaming effect. The position of distribution () may be an effective indicator for the beaming effect of FR-Is.
3.4 Comparison with SED-derived Doppler factors
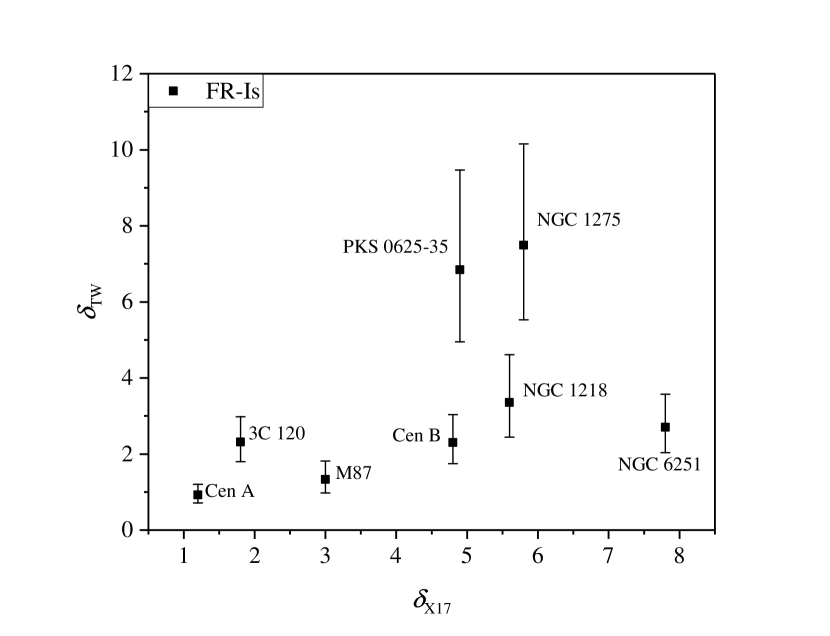
Xue et al. (2017) compiled a sample of SEDs for 12 GeV radio galaxies (8 FR-Is and 4 FR-IIs) with one-zone leptonic model and obtained their Doppler factors. We compare our Doppler factor estimations with those from Xue et al. (2017) for 8 GeV FR-Is. The result is shown in Fig. 6. The probability of linear correlation is 0.053; therefore, our estimated -ray Doppler factors are not correlated with the SED-derived Doppler factors from Xue et al. (2017). The radiation in SED fitting is mainly dominated by the behavior of electrons; however, the radiation for Fermi-LAT-detected FR-Is in the GeV band is dominated by photons. The different particle behaviors may be the reason why our Doppler factors are not correlated with the SED-derived Doppler factors.
3.5 TeV-detected radio galaxies
In the Fermi-LAT-detected 30 FR-I samples, 6 radio galaxies (Cen A, M87, 3C 84, IC 310, 3C 264, PKS 0625-35) have been detected at TeV energies (Wakely & Horan, 2008; Rieger & Levinson, 2018; Rani, 2019; Rulten, 2022). Our Doppler factor estimations for the 6 TeV FR-Is are in a range from to with an average of , while the Doppler factors for the 24 remaining GeV FR-Is range from to with . We perform a Student’s T-test (T-test) between these two samples and ascertain that the probability is , suggesting that they are from the same distribution, and the difference between the TeV and GeV emissions for radio galaxies is not driven by the Doppler beaming effect.
3.6 Core dominance
During the first 15 months of Fermi-LAT sky survey, 11 radio galaxies had been detected, including 7 FR-Is and 4 FR-IIs (Abdo et al., 2010a). 11 -ray radio galaxies from Third Cambridge catalog of radio sources (3CRR) showed higher core dominance than that of non-Fermi-LAT-detected radio galaxies. However, the -ray luminosities for a larger sample of Fermi-LAT-detected radio galaxies do not show any correlation on the core dominance parameter (), suggesting that high-energy emission in Fermi-LAT-detected radio galaxies is not driven by the Doppler beaming effect (Angioni et al., 2019). The incompatible result between Abdo et al. (2010a) and Angioni et al. (2019) may be due to the selection effect. From the first 15 months of observation, Fermi-LAT preferentially detected the strong Doppler factor sources or nearby sources, such as NGC 1218 (), NGC 1275 (), PKS 0625-354 (), 3C 120 () with moderate or large Doppler factors or Cen A () and M87 (), the two closest FR-Is. During the 2008-2018 observations, more FR-Is can be detected by Fermi-LAT, in which more and more lobe-dominated FR-Is will dilute the correlation between -ray luminosities and core dominance parameters.
4 Conclusions
Based on the unification of BL Lacs and FR-Is (Urry & Padovani, 1995; Ghisellini et al., 1993) and the assumption of standard candles for FR-Is, we adopt the relation between the flux density and the luminosity distance, const, to estimate the Doppler factors for the 30 Fermi-LAT-detected FR Is and discuss their beaming effect. Our conclusions are as follows:
-
1.
Our Doppler factor estimations for the 30 FR-Is are in a range of with average for the case of a continuous jet, which is smaller than that of the 126 BL Lacs (), in accordance with the unification of BL Lacs and FR-Is (Urry & Padovani, 1995).
-
2.
In the plot of the -ray luminosity versus the photon spectral index (), we found that FR-Is residing close to the intrinsic luminosity of the 126 BL Lacs are lobe-dominated FR-Is, whose observed emission is regarded as the intrinsic emission, and those FR-Is with high luminosities should be considered about their emission which is strong Doppler-boosted. The position of may be an effective indicator for the beaming effect of Fermi-LAT-detected FR-Is.
-
3.
A statistical test (T-test) of average Doppler factors between the TeV-detected FR-Is and GeV-detected FR-Is results in a probability = 0.46. This suggests that the Doppler beaming effect may not be a key differentiating parameter between the GeV and TeV emissions.
References
- Abdo et al. (2010a) Abdo, A. A., Ackermann, M., Ajello, M., et al. 2010a, ApJ, 720, 912, doi: 10.1088/0004-637X/720/1/912
- Abdo et al. (2010b) —. 2010b, Science, 328, 725, doi: 10.1126/science.1184656
- Abdo et al. (2010c) —. 2010c, ApJ, 719, 1433, doi: 10.1088/0004-637X/719/2/1433
- Abdollahi et al. (2020) Abdollahi, S., Acero, F., Ackermann, M., et al. 2020, ApJS, 247, 33, doi: 10.3847/1538-4365/ab6bcb
- Acciari et al. (2011) Acciari, V. A., Aliu, E., Arlen, T., et al. 2011, ApJ, 738, 25, doi: 10.1088/0004-637X/738/1/25
- Acero et al. (2015) Acero, F., Ackermann, M., Ajello, M., et al. 2015, ApJS, 218, 23, doi: 10.1088/0067-0049/218/2/23
- Ackermann et al. (2016) Ackermann, M., Ajello, M., Baldini, L., et al. 2016, ApJ, 826, 1, doi: 10.3847/0004-637X/826/1/1
- Aharonian et al. (2006) Aharonian, F., Akhperjanian, A. G., Bazer-Bachi, A. R., et al. 2006, Science, 314, 1424, doi: 10.1126/science.1134408
- Aleksić et al. (2010) Aleksić, J., Antonelli, L. A., Antoranz, P., et al. 2010, ApJ, 723, L207, doi: 10.1088/2041-8205/723/2/L207
- Aleksić et al. (2014) Aleksić, J., Ansoldi, S., Antonelli, L. A., et al. 2014, Science, 346, 1080, doi: 10.1126/science.1256183
- Angioni et al. (2019) Angioni, R., Ros, E., Kadler, M., et al. 2019, A&A, 627, A148, doi: 10.1051/0004-6361/201935697
- Angioni et al. (2020) —. 2020, A&A, 641, A152, doi: 10.1051/0004-6361/202038236
- Bai & Lee (2001) Bai, J. M., & Lee, M. G. 2001, ApJ, 548, 244, doi: 10.1086/318695
- Bailey et al. (1986) Bailey, J., Sparks, W. B., Hough, J. H., & Axon, D. J. 1986, Nature, 322, 150, doi: 10.1038/322150a0
- Bassi et al. (2018) Bassi, T., Migliori, G., Grandi, P., et al. 2018, MNRAS, 481, 5236, doi: 10.1093/mnras/sty2622
- Bicknell & Begelman (1996) Bicknell, G. V., & Begelman, M. C. 1996, ApJ, 467, 597, doi: 10.1086/177636
- Casadio et al. (2015) Casadio, C., Gómez, J. L., Grandi, P., et al. 2015, ApJ, 808, 162, doi: 10.1088/0004-637X/808/2/162
- Chen (2018) Chen, L. 2018, ApJS, 235, 39, doi: 10.3847/1538-4365/aab8fb
- Chen et al. (2015a) Chen, Y., Zhang, X., Zhang, H., et al. 2015a, Ap&SS, 357, 100, doi: 10.1007/s10509-015-2303-x
- Chen et al. (2015b) Chen, Y. Y., Zhang, X., Zhang, H. J., & Yu, X. L. 2015b, MNRAS, 451, 4193, doi: 10.1093/mnras/stv658
- Di Mauro et al. (2014) Di Mauro, M., Calore, F., Donato, F., Ajello, M., & Latronico, L. 2014, ApJ, 780, 161, doi: 10.1088/0004-637X/780/2/161
- Dondi & Ghisellini (1995) Dondi, L., & Ghisellini, G. 1995, MNRAS, 273, 583, doi: 10.1093/mnras/273.3.583
- Falomo et al. (2014) Falomo, R., Pian, E., & Treves, A. 2014, A&A Rev., 22, 73, doi: 10.1007/s00159-014-0073-z
- Fan et al. (2013a) Fan, J., Yang, J. H., Zhang, J.-Y., et al. 2013a, PASJ, 65, 25, doi: 10.1093/pasj/65.2.25
- Fan et al. (2014) Fan, J.-H., Bastieri, D., Yang, J.-H., et al. 2014, Research in Astronomy and Astrophysics, 14, 1135, doi: 10.1088/1674-4527/14/9/004
- Fan et al. (1997) Fan, J. H., Cheng, K. S., Zhang, L., & Liu, C. H. 1997, A&A, 327, 947
- Fan et al. (2009) Fan, J.-H., Huang, Y., He, T.-M., et al. 2009, PASJ, 61, 639, doi: 10.1093/pasj/61.4.639
- Fan & Xie (1996) Fan, J. H., & Xie, G. Z. 1996, A&A, 306, 55
- Fan et al. (2013b) Fan, J.-H., Yang, J.-H., Liu, Y., & Zhang, J.-Y. 2013b, Research in Astronomy and Astrophysics, 13, 259, doi: 10.1088/1674-4527/13/3/002
- Fan et al. (2015) Fan, J. H., Xiao, H. B., Bastieri, D., et al. 2015, in Extragalactic Jets from Every Angle, ed. F. Massaro, C. C. Cheung, E. Lopez, & A. Siemiginowska, Vol. 313, 53–57, doi: 10.1017/S1743921315001866
- Fanaroff & Riley (1974) Fanaroff, B. L., & Riley, J. M. 1974, MNRAS, 167, 31P, doi: 10.1093/mnras/167.1.31P
- Georganopoulos & Kazanas (2003) Georganopoulos, M., & Kazanas, D. 2003, ApJ, 594, L27, doi: 10.1086/378557
- Ghisellini et al. (1993) Ghisellini, G., Padovani, P., Celotti, A., & Maraschi, L. 1993, ApJ, 407, 65, doi: 10.1086/172493
- Harvey et al. (2020) Harvey, M., Rulten, C. B., & Chadwick, P. M. 2020, MNRAS, 496, 903, doi: 10.1093/mnras/staa1593
- HESS Collaboration et al. (2018) HESS Collaboration, Abdalla, H., Abramowski, A., et al. 2018, MNRAS, 476, 4187, doi: 10.1093/mnras/sty439
- Hine & Longair (1979) Hine, R. G., & Longair, M. S. 1979, MNRAS, 188, 111, doi: 10.1093/mnras/188.1.111
- Hovatta et al. (2009) Hovatta, T., Valtaoja, E., Tornikoski, M., & Lähteenmäki, A. 2009, A&A, 494, 527, doi: 10.1051/0004-6361:200811150
- Jones et al. (2001) Jones, P. A., Lloyd, B. D., & McAdam, W. B. 2001, MNRAS, 325, 817, doi: 10.1046/j.1365-8711.2001.04518.x
- Kadler et al. (2012) Kadler, M., Eisenacher, D., Ros, E., et al. 2012, A&A, 538, L1, doi: 10.1051/0004-6361/201118212
- Katsuta et al. (2013) Katsuta, J., Tanaka, Y. T., Stawarz, Ł., et al. 2013, A&A, 550, A66, doi: 10.1051/0004-6361/201220270
- Lind & Blandford (1985) Lind, K. R., & Blandford, R. D. 1985, ApJ, 295, 358, doi: 10.1086/163380
- Liodakis et al. (2018) Liodakis, I., Hovatta, T., Huppenkothen, D., et al. 2018, ApJ, 866, 137, doi: 10.3847/1538-4357/aae2b7
- Magliocchetti et al. (2002a) Magliocchetti, M., Celotti, A., & Danese, L. 2002a, MNRAS, 329, 377, doi: 10.1046/j.1365-8711.2002.05031.x
- Magliocchetti et al. (2002b) Magliocchetti, M., Maddox, S. J., Jackson, C. A., et al. 2002b, MNRAS, 333, 100, doi: 10.1046/j.1365-8711.2002.05386.x
- Martin et al. (1976) Martin, P. G., Angel, J. R. P., & Maza, J. 1976, ApJ, 209, L21, doi: 10.1086/182257
- Mattox et al. (1993) Mattox, J. R., Bertsch, D. L., Chiang, J., et al. 1993, ApJ, 410, 609, doi: 10.1086/172778
- Mondal & Mukhopadhyay (2019) Mondal, T., & Mukhopadhyay, B. 2019, MNRAS, 486, 3465, doi: 10.1093/mnras/stz1062
- Mueller et al. (2012) Mueller, C., Krauss, F., Kadler, M., et al. 2012, in Proceedings of the 11th European VLBI Network Symposium & Users Meeting. 9-12 October, 20
- Park et al. (2021) Park, J., Hada, K., Nakamura, M., et al. 2021, ApJ, 909, 76, doi: 10.3847/1538-4357/abd6ee
- Pei et al. (2020a) Pei, Z., Fan, J., Bastieri, D., Yang, J., & Xiao, H. 2020a, Science China Physics, Mechanics, and Astronomy, 63, 259511, doi: 10.1007/s11433-019-1454-6
- Pei et al. (2020b) Pei, Z., Fan, J., Yang, J., & Bastieri, D. 2020b, PASA, 37, e043, doi: 10.1017/pasa.2020.30
- Planck Collaboration et al. (2016) Planck Collaboration, Ade, P. A. R., Aghanim, N., et al. 2016, A&A, 594, A13, doi: 10.1051/0004-6361/201525830
- Pushkarev et al. (2009) Pushkarev, A. B., Kovalev, Y. Y., Lister, M. L., & Savolainen, T. 2009, A&A, 507, L33, doi: 10.1051/0004-6361/200913422
- Rani (2019) Rani, B. 2019, Galaxies, 7, 23, doi: 10.3390/galaxies7010023
- Rieger & Levinson (2018) Rieger, F., & Levinson, A. 2018, Galaxies, 6, 116, doi: 10.3390/galaxies6040116
- Rulten (2022) Rulten, C. 2022, Galaxies, 10, 61, doi: 10.3390/galaxies10030061
- Rulten et al. (2020) Rulten, C. B., Brown, A. M., & Chadwick, P. M. 2020, MNRAS, 492, 4666, doi: 10.1093/mnras/staa054
- Sahakyan et al. (2018) Sahakyan, N., Baghmanyan, V., & Zargaryan, D. 2018, A&A, 614, A6, doi: 10.1051/0004-6361/201732304
- Sandage (1972) Sandage, A. 1972, ApJ, 178, 25, doi: 10.1086/151764
- Stickel et al. (1991) Stickel, M., Padovani, P., Urry, C. M., Fried, J. W., & Kuehr, H. 1991, ApJ, 374, 431, doi: 10.1086/170133
- Urry & Padovani (1995) Urry, C. M., & Padovani, P. 1995, PASP, 107, 803, doi: 10.1086/133630
- Urry et al. (2000) Urry, C. M., Scarpa, R., O’Dowd, M., et al. 2000, ApJ, 532, 816, doi: 10.1086/308616
- Valtaoja et al. (1999) Valtaoja, E., Lähteenmäki, A., Teräsranta, H., & Lainela, M. 1999, ApJS, 120, 95, doi: 10.1086/313170
- Wakely & Horan (2008) Wakely, S. P., & Horan, D. 2008, in International Cosmic Ray Conference, Vol. 3, International Cosmic Ray Conference, 1341–1344
- Wills et al. (2004) Wills, K. A., Morganti, R., Tadhunter, C. N., Robinson, T. G., & Villar-Martin, M. 2004, MNRAS, 347, 771, doi: 10.1111/j.1365-2966.2004.07195.x
- Wu et al. (2014) Wu, Z., Jiang, D., Gu, M., & Chen, L. 2014, A&A, 562, A64, doi: 10.1051/0004-6361/201220851
- Xiao et al. (2019) Xiao, H., Fan, J., Yang, J., et al. 2019, Science China Physics, Mechanics, and Astronomy, 62, 129811, doi: 10.1007/s11433-018-9371-x
- Xu et al. (2009) Xu, Y.-D., Cao, X., & Wu, Q. 2009, ApJ, 694, L107, doi: 10.1088/0004-637X/694/2/L107
- Xue et al. (2017) Xue, Z.-W., Zhang, J., Cui, W., Liang, E.-W., & Zhang, S.-N. 2017, Research in Astronomy and Astrophysics, 17, 090, doi: 10.1088/1674-4527/17/9/90
- Yang et al. (2022) Yang, W. X., Wang, H. G., Liu, Y., et al. 2022, ApJ, 925, 120, doi: 10.3847/1538-4357/ac3a09
- Ye et al. (2021) Ye, X. H., Zeng, X. T., Yang, W. X., et al. 2021, Ap&SS, 366, 110, doi: 10.1007/s10509-021-04018-1
- Zhang et al. (2020) Zhang, L., Chen, S., Xiao, H., Cai, J., & Fan, J. 2020, ApJ, 897, 10, doi: 10.3847/1538-4357/ab9180
- Zhang et al. (2002) Zhang, L. Z., Fan, J.-H., & Cheng, K.-S. 2002, PASJ, 54, 159, doi: 10.1093/pasj/54.2.159