Large-scale machine-learning molecular dynamics simulation of primary radiation damage in tungsten
Abstract
Simulating collision cascades and radiation damage poses a long-standing challenge for existing interatomic potentials, both in terms of accuracy and efficiency. Machine-learning based interatomic potentials have shown sufficiently high accuracy for radiation damage simulations, but most existing ones are still not efficient enough to model high-energy collision cascades with sufficiently large space and time scales. To this end, we here extend the highly efficient neuroevolution potential (NEP) framework by combining it with the Ziegler-Biersack-Littmark (ZBL) screened nuclear repulsion potential, obtaining a NEP-ZBL framework. We train a NEP-ZBL model for tungsten and demonstrate its accuracy in terms of the elastic properties, melting point, and various energetics of defects that are relevant for radiation damage. We then perform large-scale molecular dynamics simulations with the NEP-ZBL model with up to 8.1 million atoms and 240 ps (using a single 40-GB A100 GPU) to study the difference of primary radiation damage in both bulk and thin-foil tungsten. While our findings for bulk tungsten are consistent with existing results simulated by embedded atom method (EAM) models, the radiation damage differs significantly in foils and shows that larger and more vacancy clusters as well as smaller and fewer interstitial clusters are produced due to the presence of a free surface.
I Introduction
Fusion reactor materials must be capable of withstanding extremely severe operational conditions Knaster et al. (2016). Tungsten (W) is a promising candidate of plasma-facing materials due to its multiple excellent properties such as high melting point, high thermal conductivity and high threshold for sputtering Gilbert et al. (2012). High-energy particles emitted from the fusion plasma initiate collision cascades in the reactor wall material, leading to the formation of lattice defects. Upon later evolution, the created defects cause permanent degradation of the materials such as hardening, swelling, embrittlement, and fracture Zinkle and Was (2013). To ensure a controllable production of fusion energy, it is important to achieve a comprehensive understanding of the structural evolution of the reactor materials under the influence of irradiation Nordlund (2019).
The generation, distribution and evolution of defects in the early stage of collision cascades are important information for understanding the mechanisms of irradiation resistance Lin et al. (2020). Yi et al. observed the presence of dislocation loops with both Burgers vectors and in thin tungsten foils through in-situ self-ion irradiations (150 keV W+) and proposed that the loop nucleation mechanism is likely cascade collapse X. Yi and M.L. Jenkins and M. Briceno and S.G. Roberts and Z. Zhou and M.A. Kirk (2013). To further investigate the influence of various factors, including irradiation temperature, dose, grain orientation, and material composition, on the radiation damage defect configurations and geometries, the authors conducted a comprehensive in-situ self-ion irradiation study on tungsten and tungsten-based alloys Yi et al. (2015, 2016). The results showed that dislocation loops with and coexisted in all materials under all irradiation conditions studied, with the majority being of interstitial type. The lowest-dose (0.01 dpa) investigations focused on the “near-surface” cascade effects, revealing that defect clusters formed at individual cascade sites in the form of dislocation loops, most likely of vacancy nature, and of sizes up to point defects. However, this process is beyond the time and length scale of current experiments, making it difficult to experimentally analyze the defect generation and evolution mechanisms at the atomic level.
Fortunately, the process of primary radiation damage is well within the reach of classical molecular dynamics (MD) simulations Zarkadoula et al. ; Nordlund (2019); Lin et al. (2020); Fu et al. (2019); Byggmästar et al. (2019); Peng et al. (2018). The reliability of MD simulations, on the other hand, depends crucially on the accuracy of the interatomic potential. For W, a variety of empirical potentials have been developed, but few can accurately describe the various defect structures and material properties related to the collision cascade process, involving self-interstitial clusters Chen et al. (2018), clustering of vacancies, surface properties Bonny et al. (2014), and local melting followed by rapid recrystallization. In recent years, machine-learned potentials (MLPs) have shown to be able to accurately describe a variety of physical properties that are relevant for radiation damage in typical materials, including silicon Hamedani et al. (2021), W Byggmästar et al. (2019); Granberg et al. (2021); Wang et al. (2022a), aluminium Wang et al. (2019), iron Wang et al. (2022b); Byggmästar et al. (2022a), and high-entropy alloys Byggmästar et al. (2021).
A downside of the existing MLPs is that they are typically a few orders of magnitude slower than empirical potentials such as the embedded-atom method (EAM). Therefore, the MLPs developed so far have not been extensively applied to study primary radiation damage in realistically large systems. For example, the deep potential (DP) model developed for W Wang et al. (2022a), the momentum tensor potential (MTP) model for Fe Wang et al. (2022b), and the DP model for Al Wang et al. (2019) have not been used to perform large-scale MD simulations. The Gaussian approximation potential (GAP) model for W has only been used to anneal structures Granberg et al. (2021) generated by an EAM potential. The tabulated GAP (tabGAP) model developed for high-entropy alloys and iron Byggmästar et al. (2021, 2022b, 2022a) is a notable exception, which is only an order of magnitude slower than EAM and has been used to perform MD simulations with up to 3.5 million atoms Domínguez-Gutiérrez et al. (2023).
Recently, some of the present authors proposed a MLP framework called the neuroevolution potential (NEP) Fan et al. (2021, 2022) that has a computational speed comparable to the EAM potential, reaching about atom-step/second in MD simulations using a single A100 GPU. In this work, we extend the NEP framework by augmenting it with the Ziegler-Biersack-Littmark (ZBL) potential Ziegler and Biersack (1985) that accounts for the strong repulsion at extremely short interatomic distances. The resulting combined framework, which we call NEP-ZBL, retains the high efficiency of the original NEP framework and at the same time enables the applicability to large-scale radiation damage simulations.
As an application, we then develop a NEP-ZBL model for W using the reference data that has been used for constructing a GAP model Byggmästar et al. (2019). We evaluate the performance of the NEP-ZBL model in terms of elastic constants, melting point, phonon dispersion, and defect energetics that are relevant for radiation damage, with a close comparison with the GAP model Byggmästar et al. (2019) as well as some EAM potentials. After demonstrating the high accuracy of the NEP-ZBL model we then apply it to study primary radiation damage in W using large-scale MD simulations with up to 8.1 million atoms and 1 million MD steps. We focus on the differences between irradiation in bulk and thin-foil forms, comparing the generation, distribution and nature of the defects.
II Methodologies
II.1 The NEP-ZBL framework
In the NEP approach Fan et al. (2021), the energy of a system consisting of atoms can be expressed as the sum of the site energies contributed by each atom . The site energy is a function of the atomic-environment descriptor . This function is modelled as a feed-forward fully-connected neural network, following Behler and Parrinello Behler and Parrinello (2007). The atomic-environment descriptor consists of a number of radial and angular components, using the Chebyshev and Legendre polynomials up to a certain degree. The name NEP comes from the training method, which is based on the separable natural evolution strategy (SNES) Schaul et al. (2011). For more details on the NEP approach, the reader is referred to Ref. Fan et al., 2021.
Accurate characterization of short-range repulsive forces is crucial for simulating early-stage primary radiation damage formation processes. The Ziegler-Biersack-Littmark (ZBL) screened nuclear repulsion potential Ziegler and Biersack (1985) has been extensively validated to accurately describe the short-range interactions. In this study, we combine a NEP model with a repulsive two-body ZBL-like potential to form a NEP-ZBL model. The total site energy on atom is then
| (1) |
Here, we do not use the universal ZBL potential, but instead the ZBL-like potential from Ref. Byggmästar et al., 2019 that was specifically optimised for W–W repulsion and used in the GAP model. It has the functional form of the ZBL potential:
| (2) |
where the screening function is optimised for W–W as Byggmästar et al. (2019)
| (3) |
and
| (4) |
Here, is the vacuum dielectric constant, is the nuclear charge of atom , and is the distance between atoms and . For the cutoff function, , we take it as the Tersoff one Tersoff (1989) with an inner cutoff of 1.0 Å and an outer cutoff of 2.0 Å. The outer cutoff is significantly shorter than the nearest-neighbour distance in the W lattice, even for self-interstitial configurations. This means that all near-equilibrium properties are left to the NEP term while the ZBL term ensures a realistic repulsion when atoms are pushed very close to each other. Note that it is also crucial to ensure that the NEP term is well-behaved and negligible at very short distances, so that the ZBL term dominates. This can be achieved by including training structures that contain relatively short interatomic distances, which also ensures a smooth and accurate transition from near-equilibrium distances to the ZBL-relevant distances. For more discussion on this, see Ref. Byggmästar et al., 2019 and Sec. III.1.
II.2 Molecular dynamics simulations of high-energy collision cascades
We apply the NEP-ZBL model for W to conduct large-scale MD simulations to investigate high-energy collision cascades in body-centered cubic (bcc) W. We explore both bulk and thin-foil W systems. All MD simulations are performed using the gpumd package Fan et al. (2017).
To prepare the system for initiating a cascade, we equilibrate it under the isothermal-isobaric ensemble for 30 ps, with a target temperature of 300 K and a target pressure of 0 GPa. For foil systems, the free surfaces in the direction are modeled using open boundaries, while for bulk materials, all three directions are treated as periodic. High-energy particles are created at the center of the simulation box for bulk simulations and near the top surface for thin-foil simulations. Each simulation is run ten times with different selections of the primary knock-on atom (PKA). The PKA energies, numbers of simulation steps, box lengths and numbers of atoms, are presented in Table 1. To avoid the channeling effect (requiring prohibitively large simulation cells), the initial momenta of high-energy particles are chosen to be in the high-index direction . It is essential to acknowledge the potential influence of the incident angle on the formation of defects, e.g., for channeling or near-channeling directions. Consequently, undertaking additional research and conducting comprehensive investigations in the future hold significant value. Atoms within a thickness of of the boundaries of the simulation boxes (except for the surfaces along the direction of the thin-foil systems) are maintained at 300 K using the Nose-Hoover chain thermostat Martyna et al. (1992). The integration time step is dynamically determined so that the fastest atom can move at most 0.01 Å (smaller than 0.5% of the lattice constant) within one step, with an upper limit of 1 fs also set. Electronic stopping is not considered, as it has not yet been implemented in the gpumd code.
| bulk | 1 | 50 000 | 54 000 | |
| 5 | 50 000 | 54 000 | ||
| 10 | 80 000 | 250 000 | ||
| 20 | 100 000 | 1 024 000 | ||
| 30 | 100 000 | 2 000 000 | ||
| 40 | 100 000 | 2 000 000 | ||
| 50 | 100 000 | 2 000 000 | ||
| 100 | 200 000 | 3 456 000 | ||
| 200 | 200 000 | 6 750 000 | ||
| foil | 100 | 200 000 | 4 320 000 | |
| 200 | 300 000 | 8 100 000 |
We used the ovito package Stukowski (2009) for defect analyses and visualization. The interstitials and vacancies were identified by using the Wigner-Seitz cell methods Nordlund and Averback (1997) and the defects were grouped into clusters: two vacancies are considered to be in the same cluster if the distance between them is within the second-nearest-neighbor distance, while the third-nearest-neighbor distance is assumed for self-interstitials. The dislocation analyses were performed using the dislocation extraction algorithm Stukowski et al. (2012).
III Results and discussion
III.1 Training a NEP-ZBL model for W
To train a NEP-ZBL model for W, we utilized the training data set for W from Ref. Byggmästar et al., 2020, which comprises a diverse range of configurations such as dimers, bulk bcc structures with different cell sizes and defects (vacancies, self-interstitials), bcc structures with surfaces, liquid structures, as well as bcc crystals with high-energy short-range interstitials. The latter as well as the repulsive dimers are important to fit the repulsive NEP-to-ZBL transition. It should be noted that the data set includes 3,526 structures, but not all the structures in Ref. Byggmästar et al., 2020 were used, as we removed distorted crystals (fcc, hcp, sc, diamond), which was later realized to be unnecessary. Each structure in the data set has a target energy, and some have a target virial tensor, with every atom having three target force components. For detailed information on the quantum-mechanical density-functional theory (DFT) calculations for the reference data, please refer to Ref. Byggmästar et al., 2020.
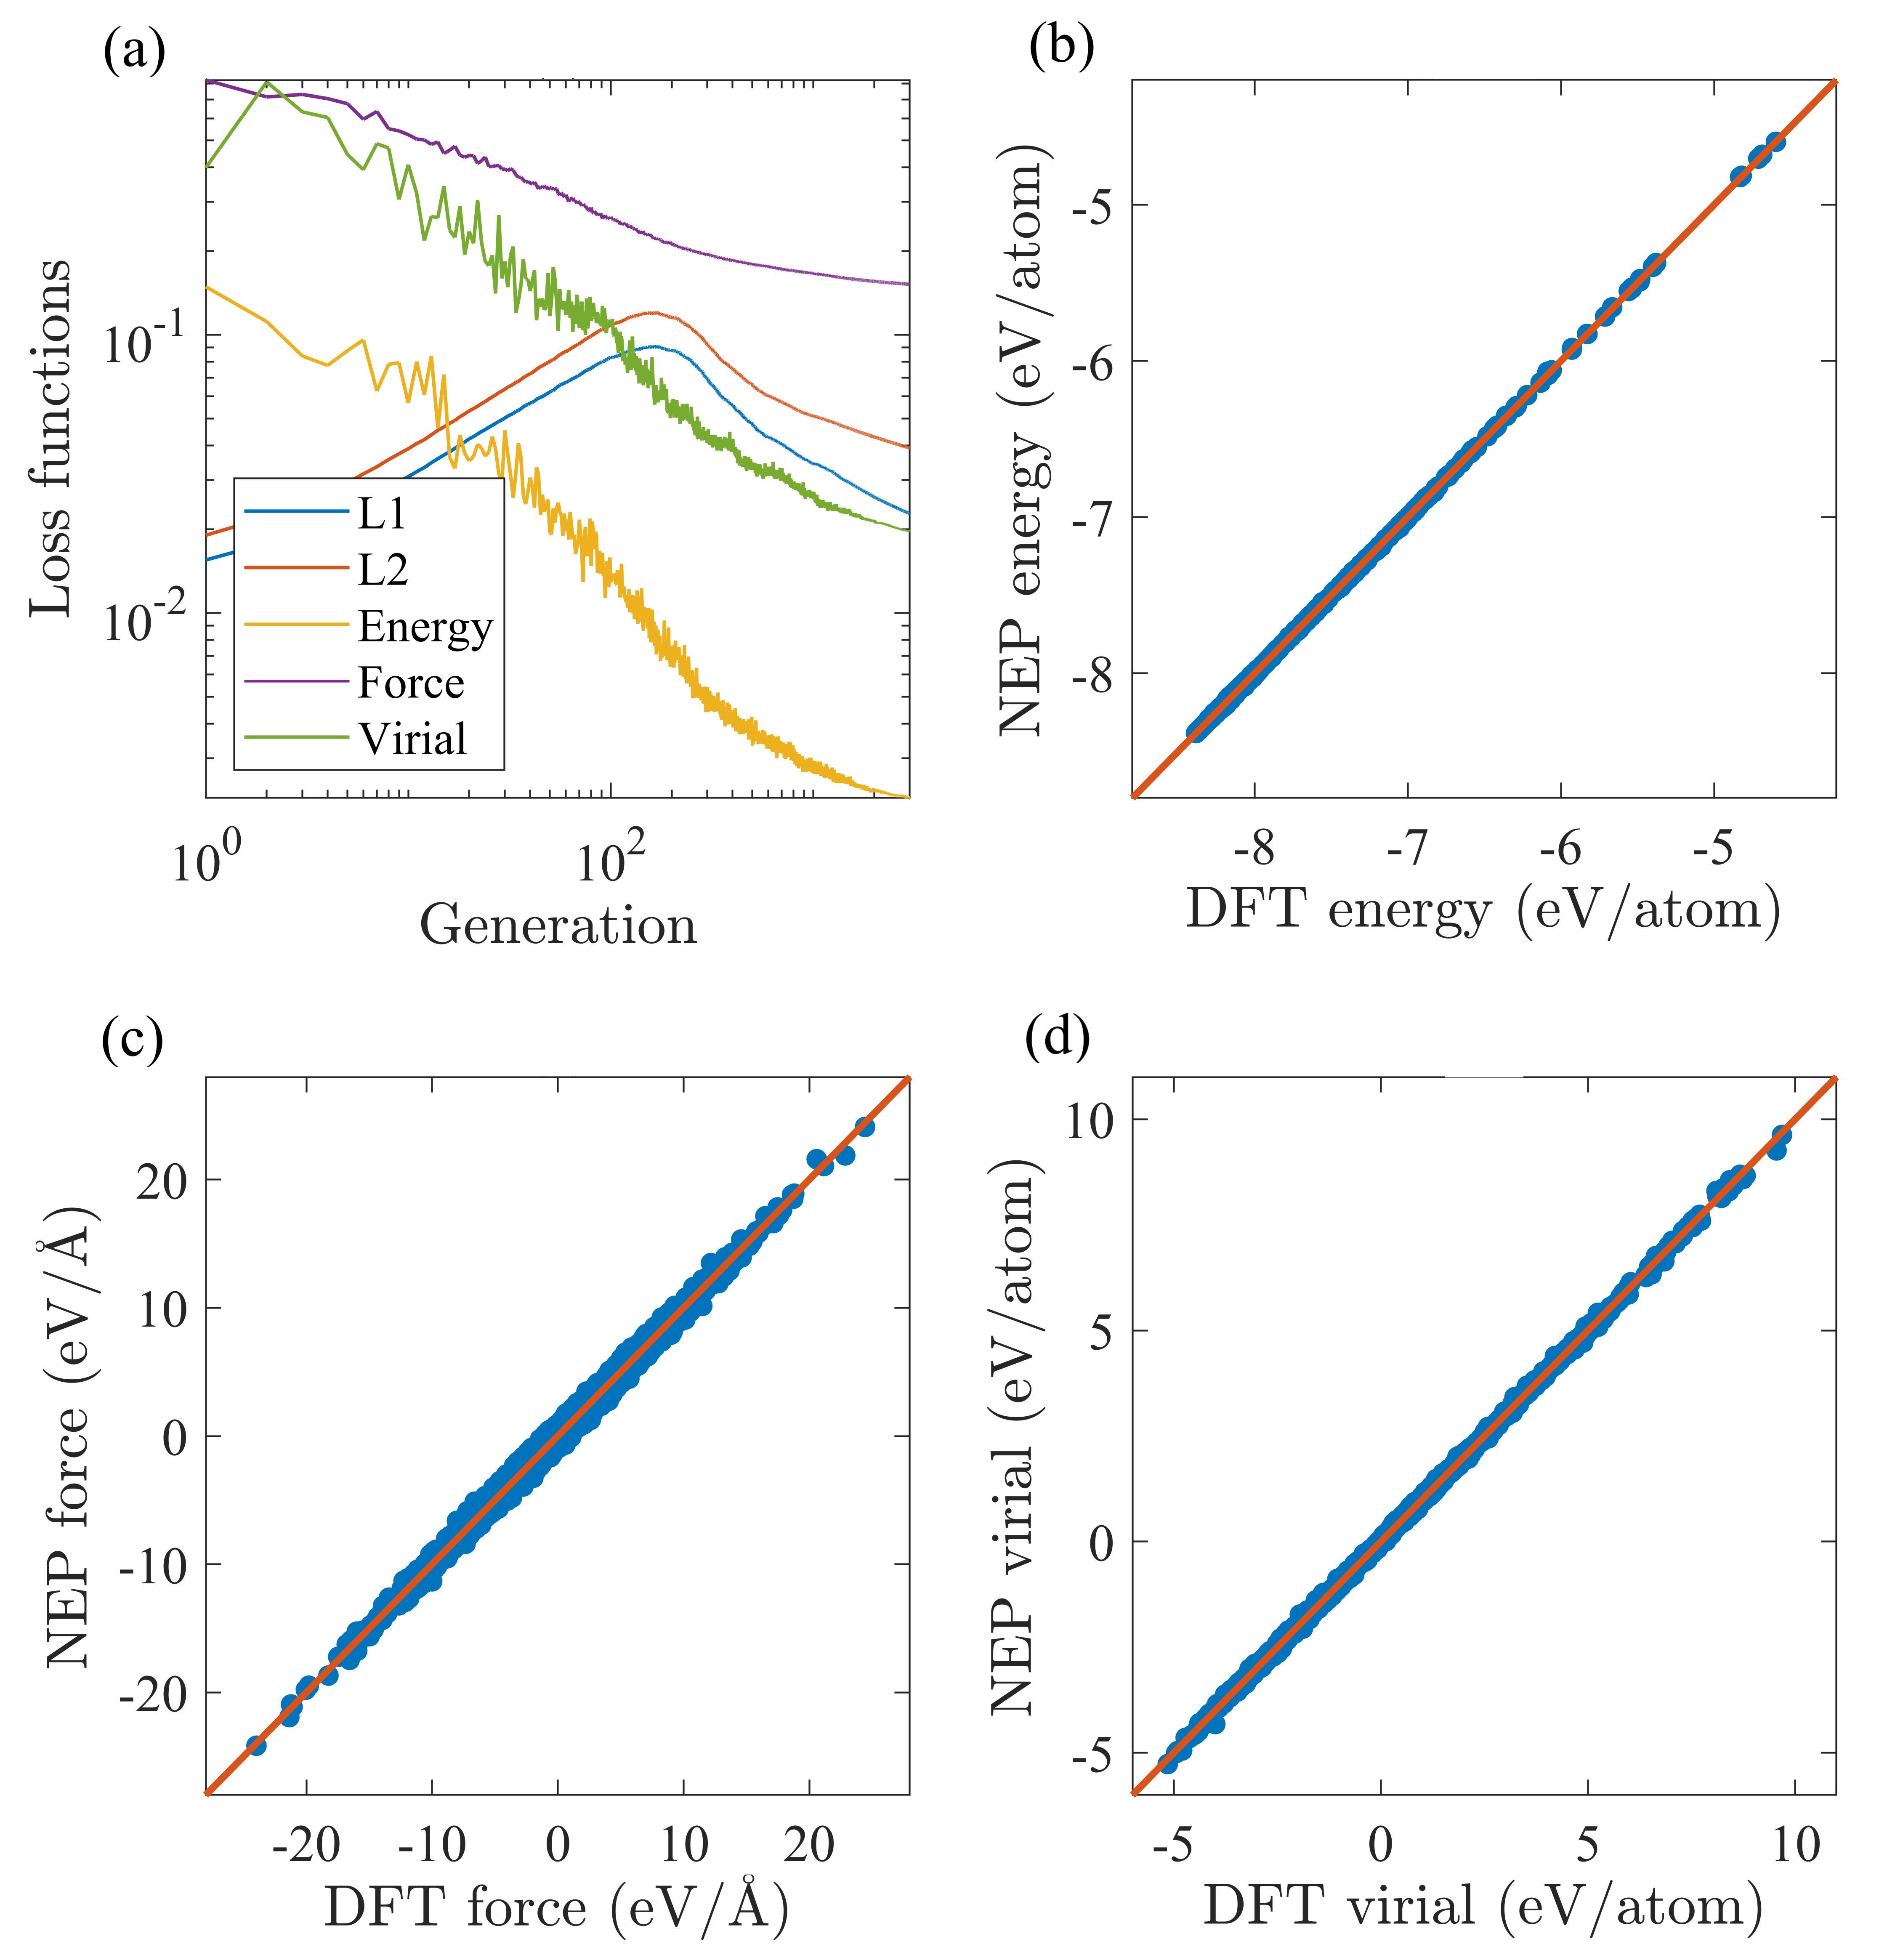
The NEP-ZBL potential was trained using the gpumd package Fan et al. (2017). The various hyperparameters in the NEP model defined in Ref. Fan et al., 2021 are chosen as follows. The cutoff radii for the radial and angular descriptor components are Å and Å, respectively. Note that we do not need larger cutoff radius for the radial descriptor components as is required in the case of describing dispersion forces between molecules Dong et al. (2023). The Chebyshev polynomial expansion order for the radial and angular descriptor components are and , respectively. The Legendre polynomial expansion order for the angular descriptor components is . The number of neurons in the hidden layer of the neural network is . The weighting factors in the loss function as defined in Ref. Fan et al., 2021 are , , and . The population size and the number of generations in the SNES algorithm Schaul et al. (2011) are and .
Figure 1(a) shows the evolution of the various loss terms with respect to the generation. Figure 1(b)-(d) compare the predicted energy, force, and virial values by NEP-ZBL and those from quantum-mechanical DFT calculations for the training set. The root-mean-square errors (RMSEs) of energy, force, and virial for the NEP-ZBL model are listed in Table 2. The accuracy is comparable to that obtained by the GAP-ZBL model Byggmästar et al. (2019).
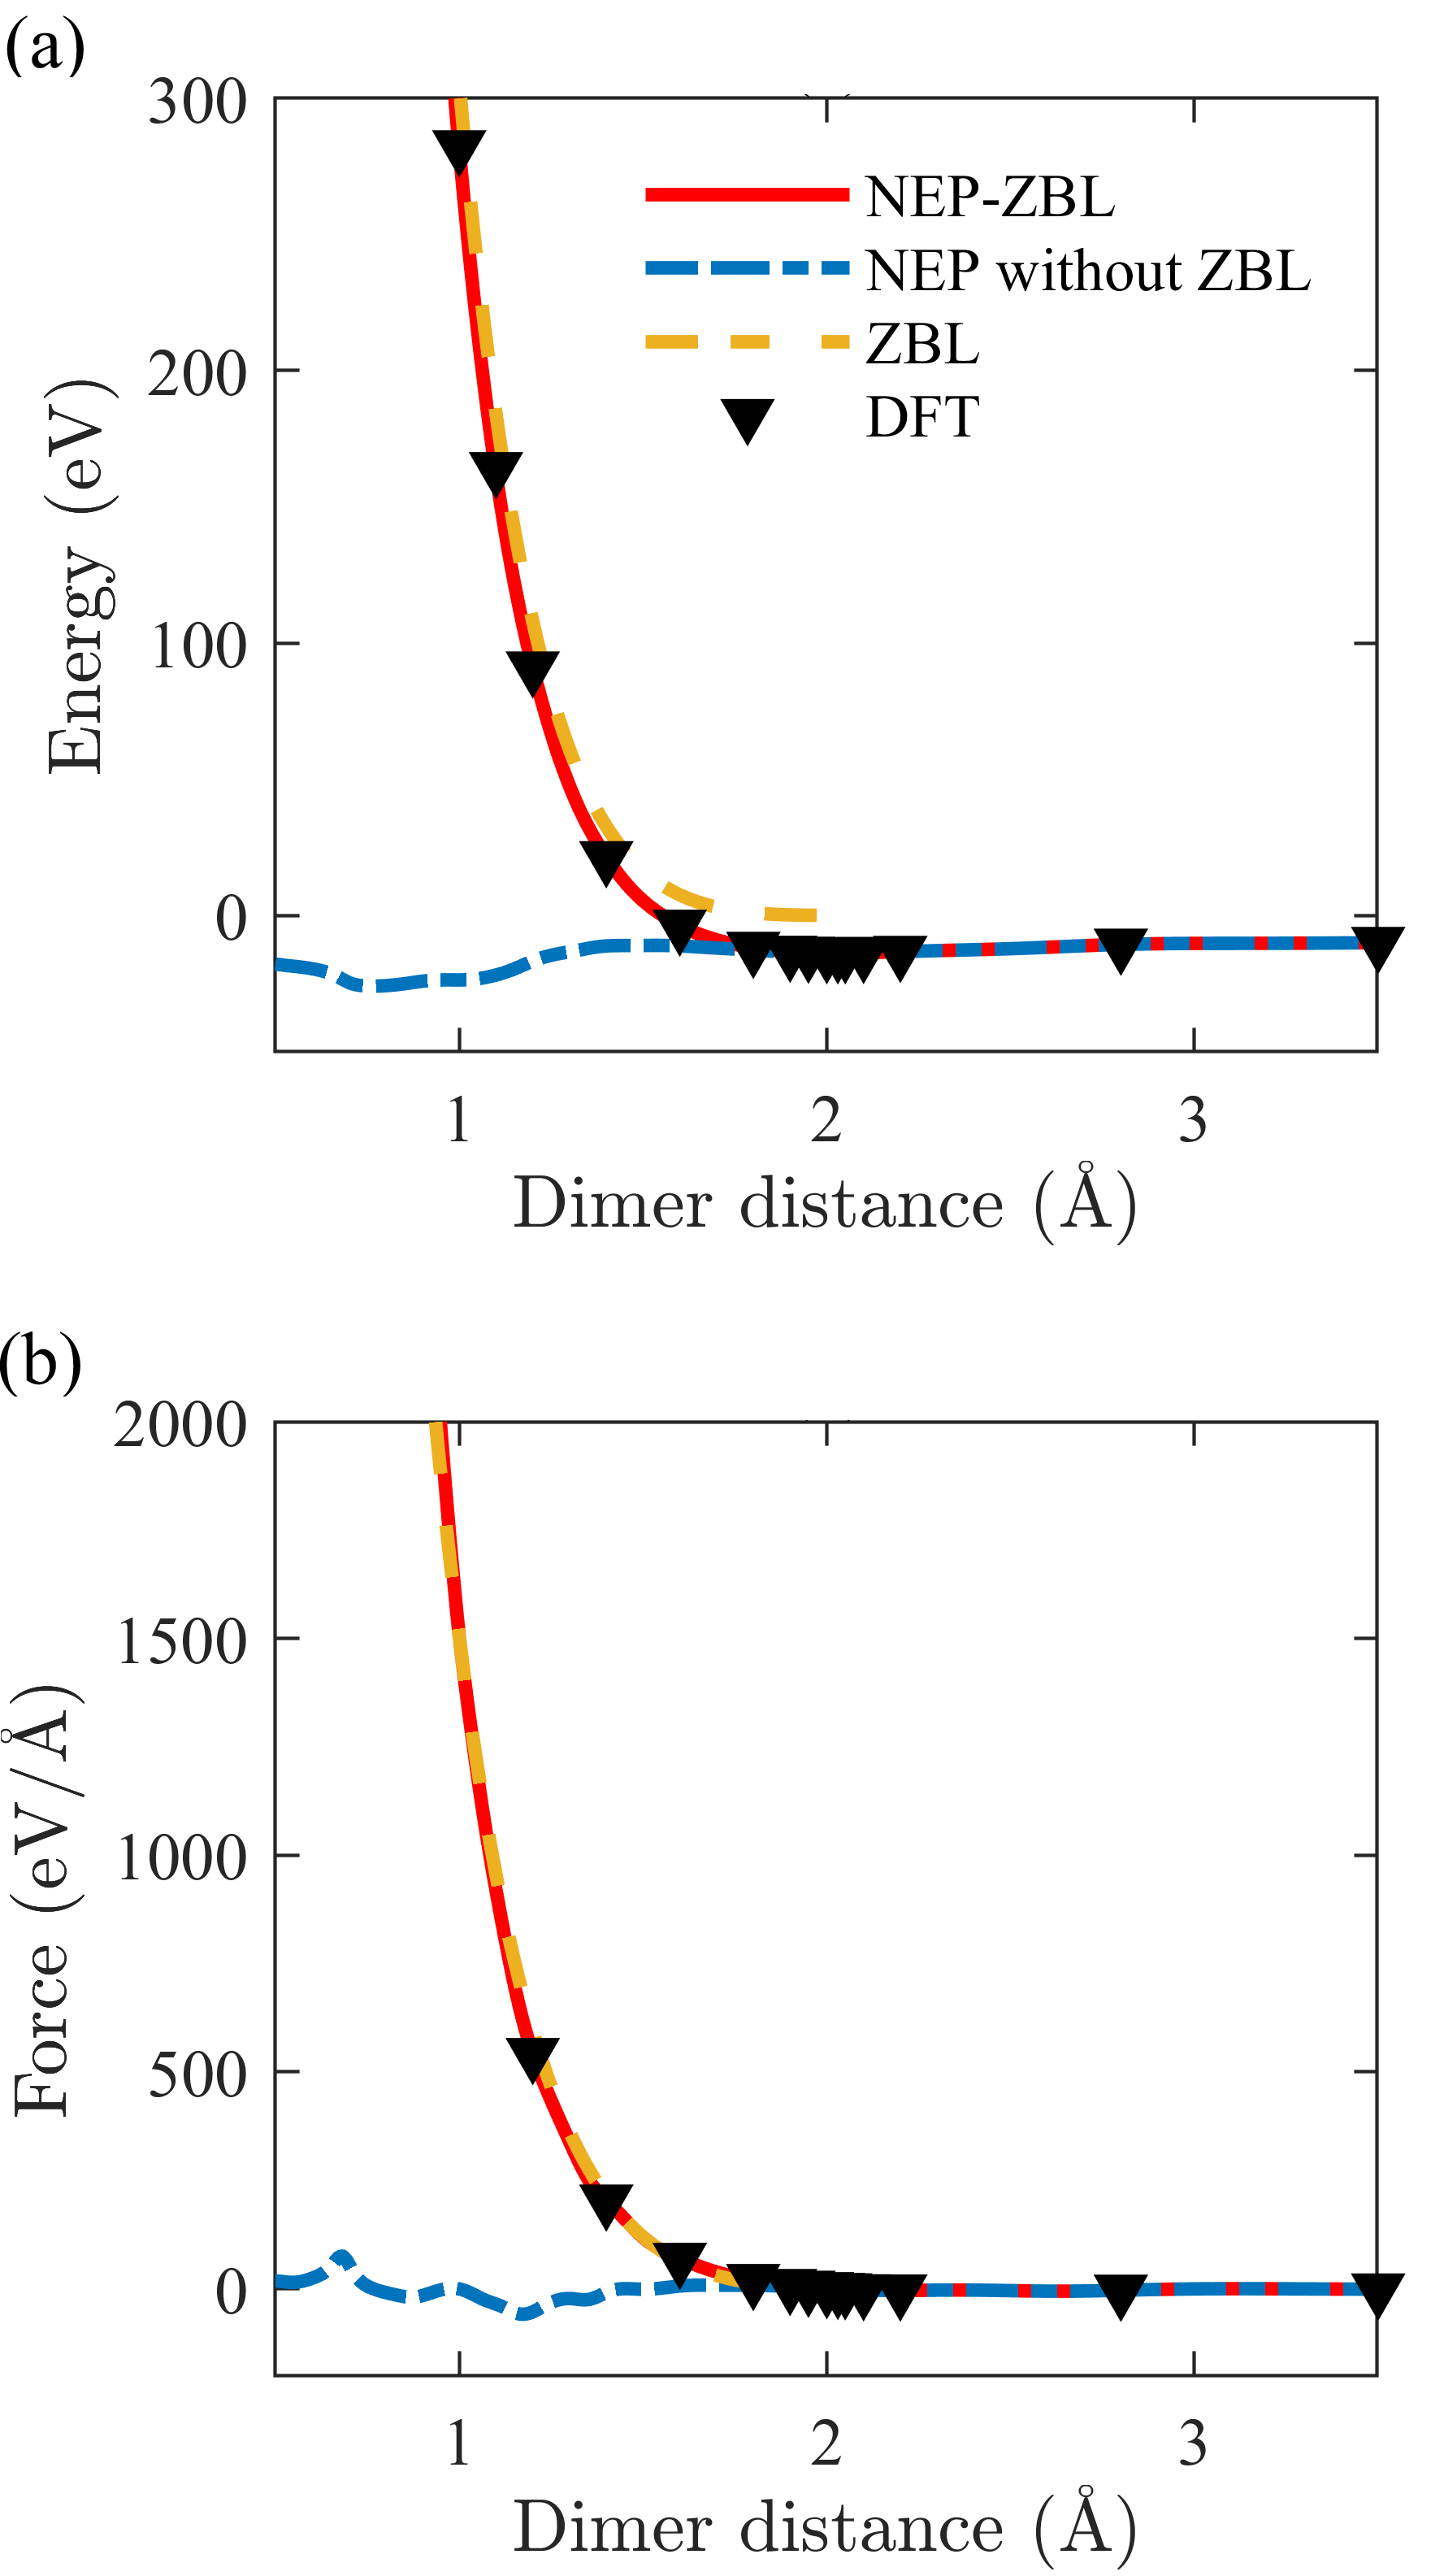
It is crucial to verify that the NEP-ZBL matches the interatomic repulsion provided by the DFT training data and smoothly connects to and follows the refitted ZBL potential at short interatomic distances, with no strong or ill-behaved predictions by the NEP part. Fig. 2 shows the short-range repulsion of a W-W dimer calculated respectively by the trained NEP-ZBL, the NEP part of NEP-ZBL, the ZBL part of NEP-ZBL, and DFT. The results show that the NEP part of energy and force at short interatomic distances is of negligible magnitude compared to ZBL and has little effect on the strong repulsion.
| Crystal | 1.89 (1.95) | 69.7 (60.0) | 19.6 (14.7) |
| Liquid | 5.25 (4.04) | 250 (340) | NA |
| All | 2.16 (2.09) | 152 (198) | 19.6 (14.7) |
III.2 Validating the NEP-ZBL model
| Exp. | DFT | NEP-ZBL | GAP Byggmästar et al. (2019) | CHEN Chen et al. (2018) | AT Chen et al. (2018) | JW Chen et al. (2018) | MV2-B Marinica et al. (2013) | MV4-S Marinica et al. (2013) | |
|---|---|---|---|---|---|---|---|---|---|
| -8.9a | -8.39d | -8.38 | -8.39 | -8.9 | -8.9 | -8.9 | -8.9 | -8.9 | |
| 3.165a | 3.185d | 3.185 | 3.185 | 3.165 | 3.165 | 3.165 | 3.140 | 3.143 | |
| 310a | 304d | 307 | 309 | 310 | 310 | 310 | 320 | 309 | |
| 522a | 522d | 518 | 526 | 522 | 522 | 522 | 544 | 523 | |
| 204a | 195d | 201 | 200 | 204 | 204 | 204 | 208 | 202 | |
| 161a | 148d | 144 | 149 | 161 | 161 | 161 | 160 | 161 | |
| 187b, 203b | 204d | 205 | 204 | 159 | 161 | 161 | 144j | 157k | |
| … | 9.55e, 10.29f | 10.87 | 10.38 | 9.46 | 8.92 | 9.50 | 10.52 | 10.53 | |
| … | 9.84e, 10.58f | 11.09 | 10.59 | 9.80 | 9.64 | 10.16 | 10.82 | 10.82 | |
| … | 11.49e, 12.20f | 12.15 | 12.11 | 11.01 | 9.82 | 10.30 | 12.86 | 12.72 | |
| c | 3.22d | 3.28 | 3.32 | 3.54 | 3.63 | 3.63 | 3.49 | 3.81 | |
| c | 1.73g | 1.74 | 1.71 | 1.91 | 1.44 | 1.44 | 1.85j | 1.84l | |
| 3687a | 3450100h | 354010 | 354010 | 458010 | 520050i | … | … | … |
- •
- •
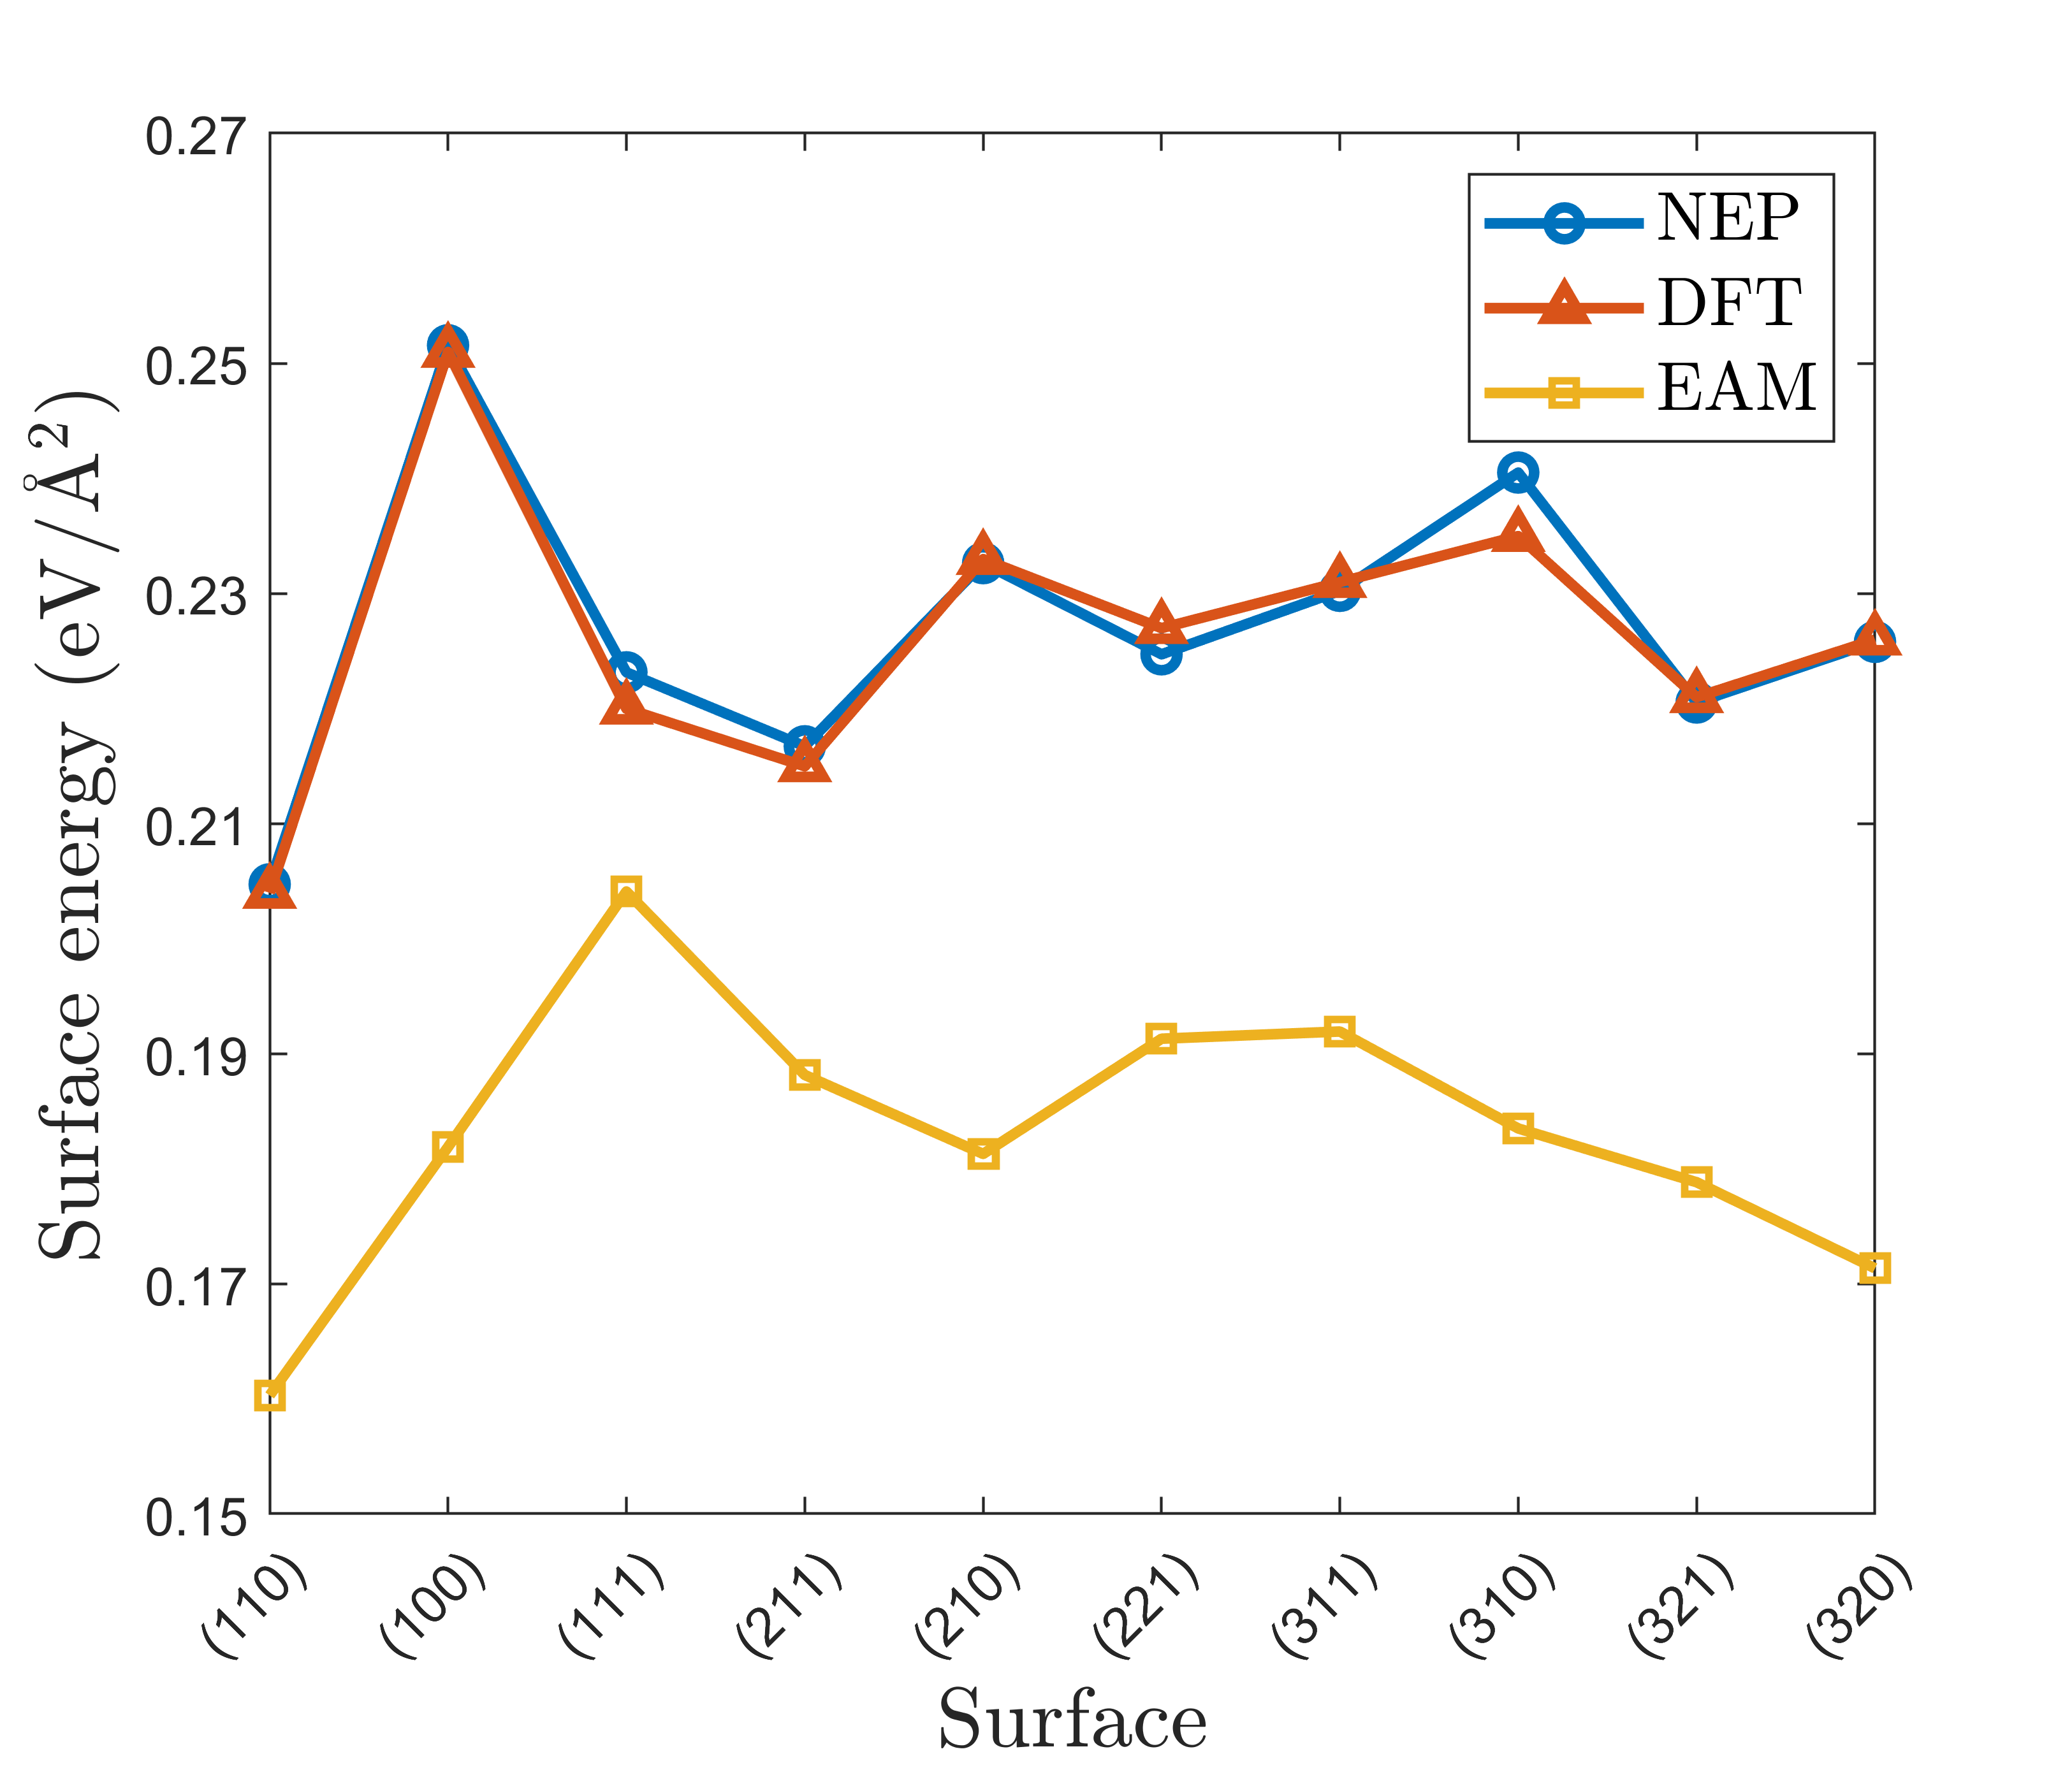
To evaluate the reliability of the NEP-ZBL model in modelling irradiation effects, we calculated a set of relevant material properties. Static calculations were carried out using ase Larsen et al. (2017). In Table 3, the NEP-ZBL results are compared with those from experiments, DFT calculations, and some empirical potentials. The NEP-ZBL model shows a satisfactory agreement in the predictions of lattice parameters, cohesive energies, and elastic constants. As shown in Figure 3, the formation energies of 10 free surfaces calculated by the NEP-ZBL model are significantly better than traditional analytical potentials, which often significantly underestimate surface energies and predict the wrong order of stability of different surface orientations Bonny et al. (2014). Note that only the first four low-index surfaces in Fig. 3 are included in the training database, thus the accuracy is evidence of good generalizability outside of the training data. The generalization of surface formation energy can also be achieved by GAP Byggmästar et al. (2019) and DP models Wang et al. (2022a).
The point defect formation energies were evaluated in supercells for comparing with DFT. The formation energies of self-interstitial atoms (SIAs) calculated by the NEP-ZBL model are overestimated compared to the DFT reference due to the slightly underestimated cohesive energy, but it correctly predicts the relative stability between the interstitial structures. The vacancy formation energy and the vacancy migration barrier are also consistent with DFT. The binding of divacancies is a peculiar feature of tungsten and some other bcc transition metals Byggmästar et al. (2019). It is reported that the binding energy of the second-nearest neighbor (2NN) divacancy is strongly repulsive ( eV Mason et al. (2017)). In contrast, the interaction between the first-nearest-neighbor (1NN) vacancies is weakly binding ( eV Mason et al. (2017) or weakly repulsive ( eV Becquart and Domain (2007)) depending on DFT code and settings. In the NEP-ZBL model, is eV and is eV. Overall, the NEP-ZBL model predicts qualitatively the correct binding energies in good agreement with DFT.
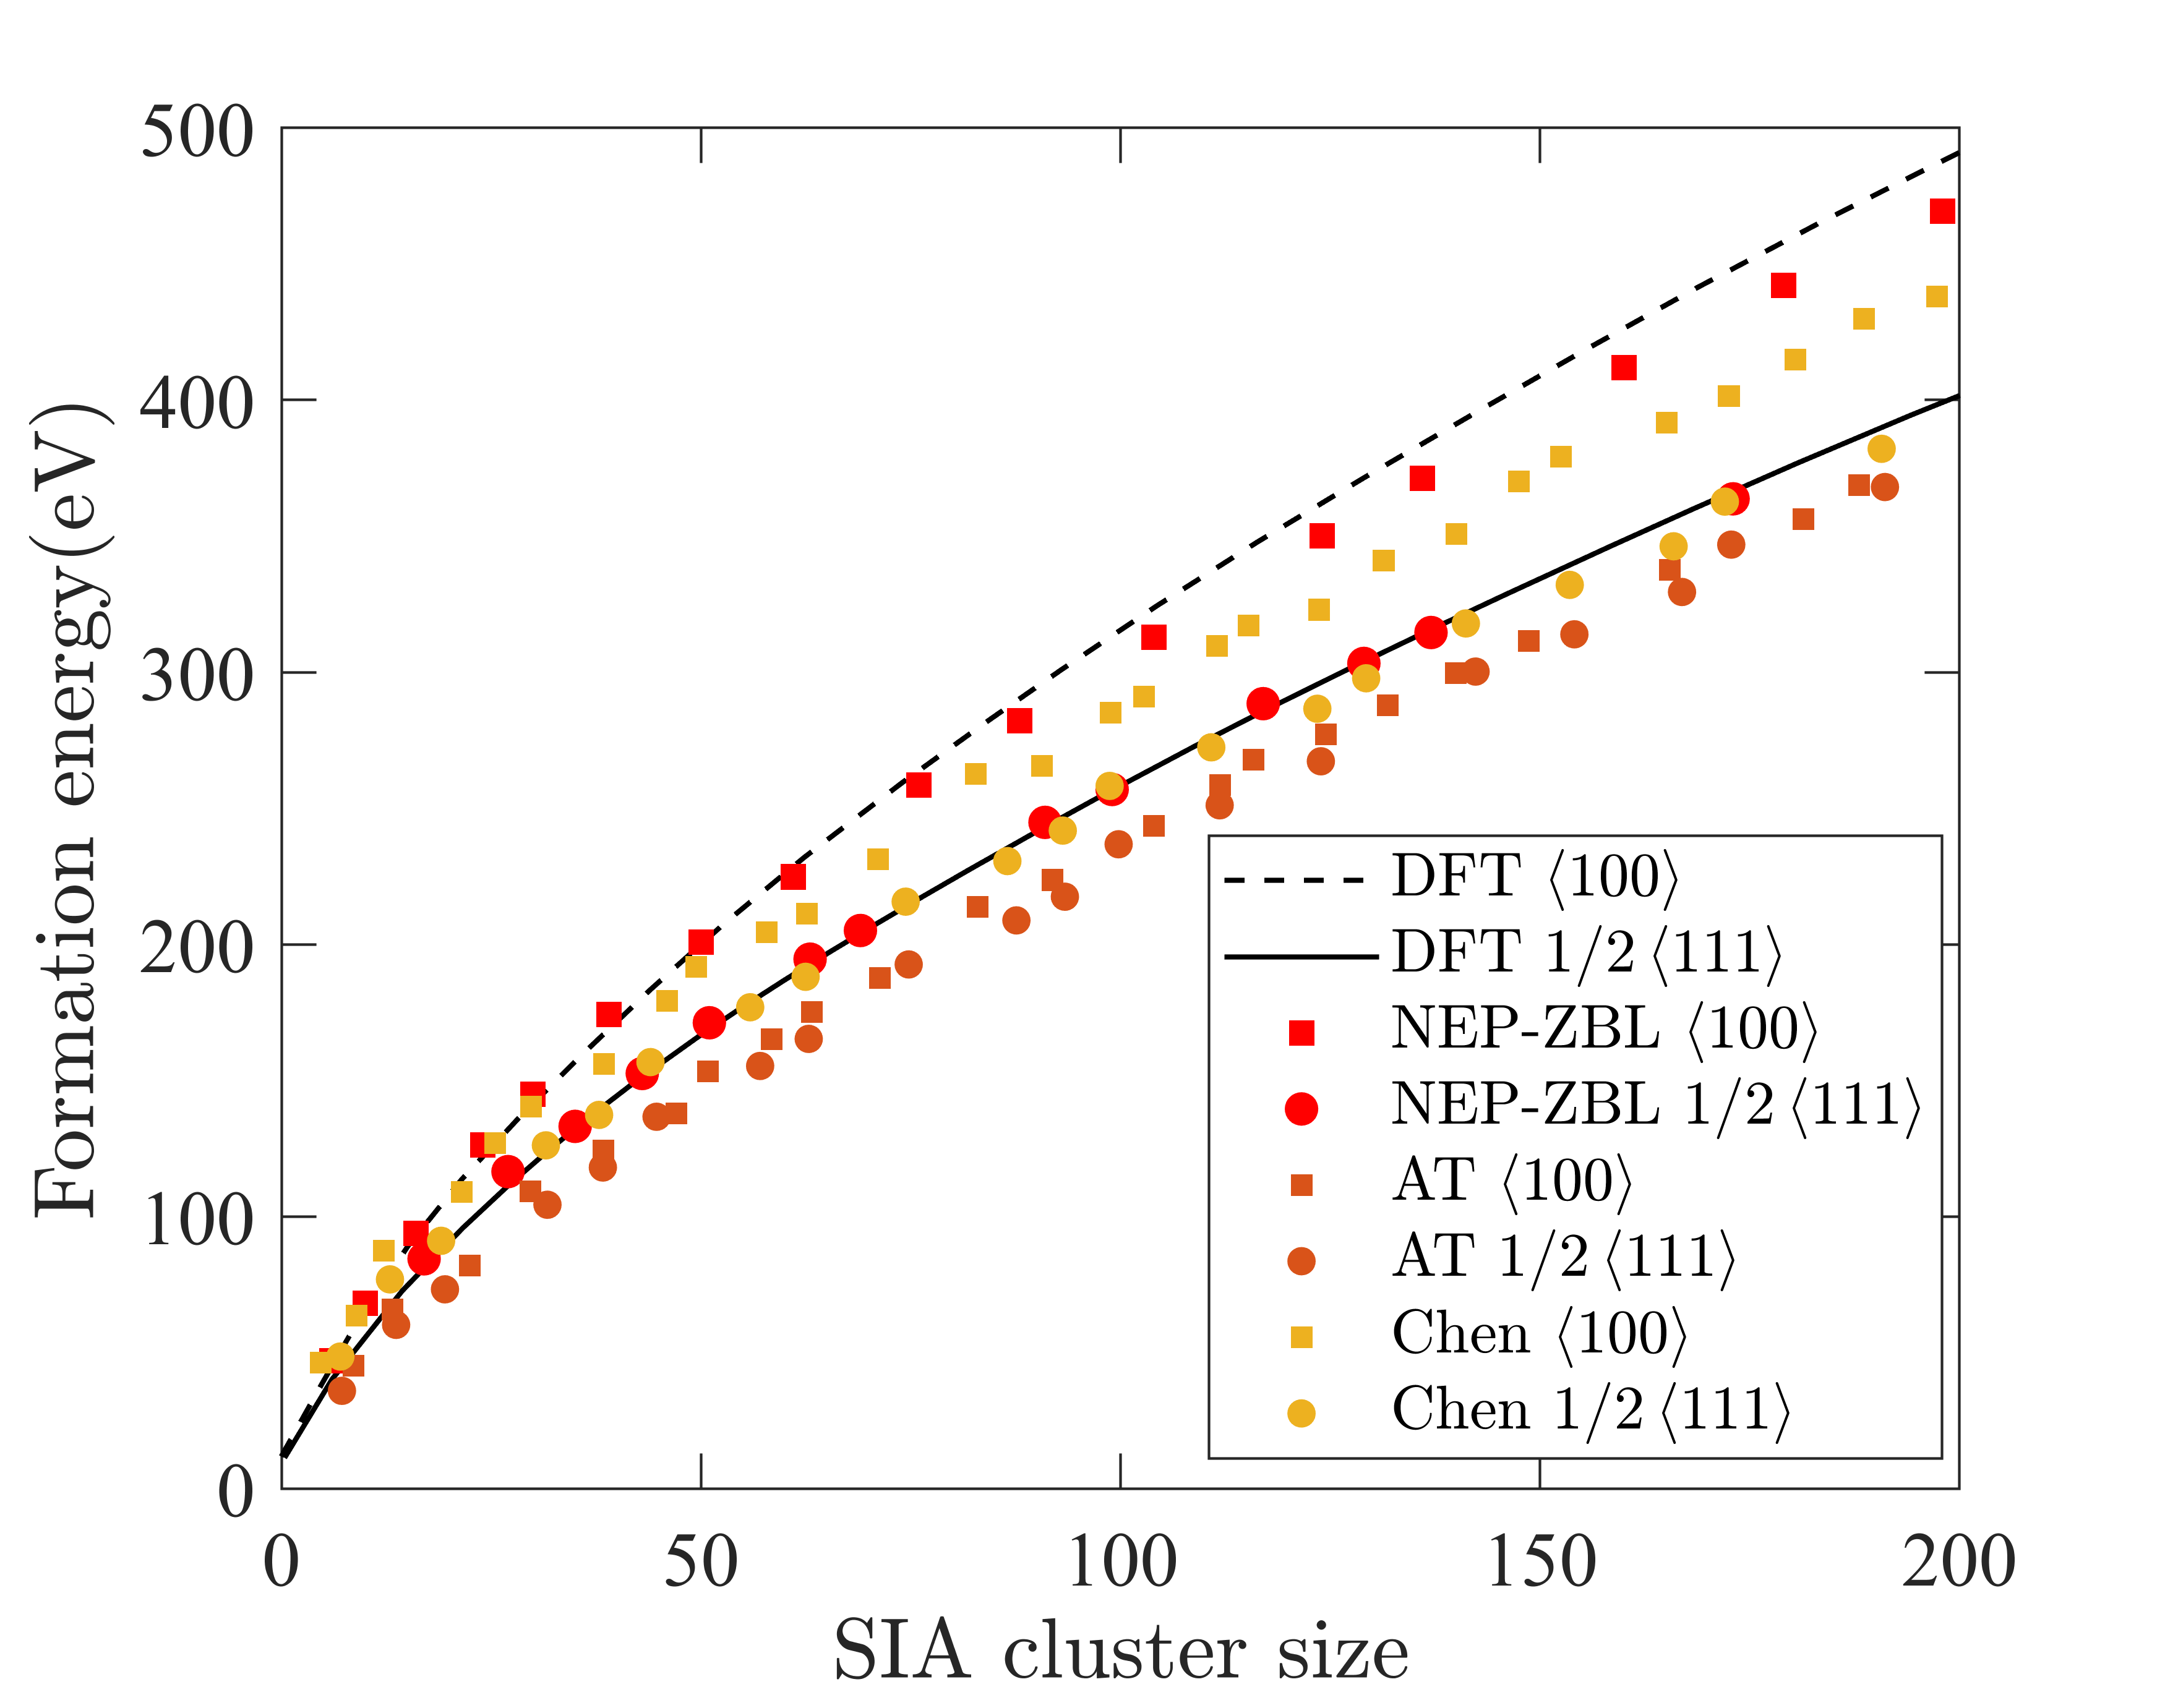
The impact of point defects on the material’s mechanical properties is relatively weak compared to the clusters formed due to migration and grouping of vacancies and self-interstitials Wang et al. (2022a). Hence, we investigate the formation energy and relative stability of SIA and clusters (dislocation loops) with a box of 250,000 atoms. Figure 4 shows the formation energies of and prismatic loops predicted by NEP-ZBL, other EAM models Chen et al. (2018); Ackland and Thetford (1987) and the DFT extrapolation model Alexander et al. (2016). The NEP-ZBL data closely follows the DFT extrapolation model, unlike the EAM potentials.
We also simulated threshold displacement energies () with the NEP-ZBL model at 30 K. The simulation box was a supercell containing 4608 atoms. The simulations were cooled down by one lattice atomic layer at boundaries. The time-step was variable and limited the displacement of the fastest atom to 0.005 Å. The minimum value is 49 eV for the direction. We calculated for six other directions (, , , , , and ) and determined the average of our potential to be 117 eV. Note that a reliable global average over crystal directions typically requires on the order of a hundred or thousand directions, but this value serves as a first approximation.
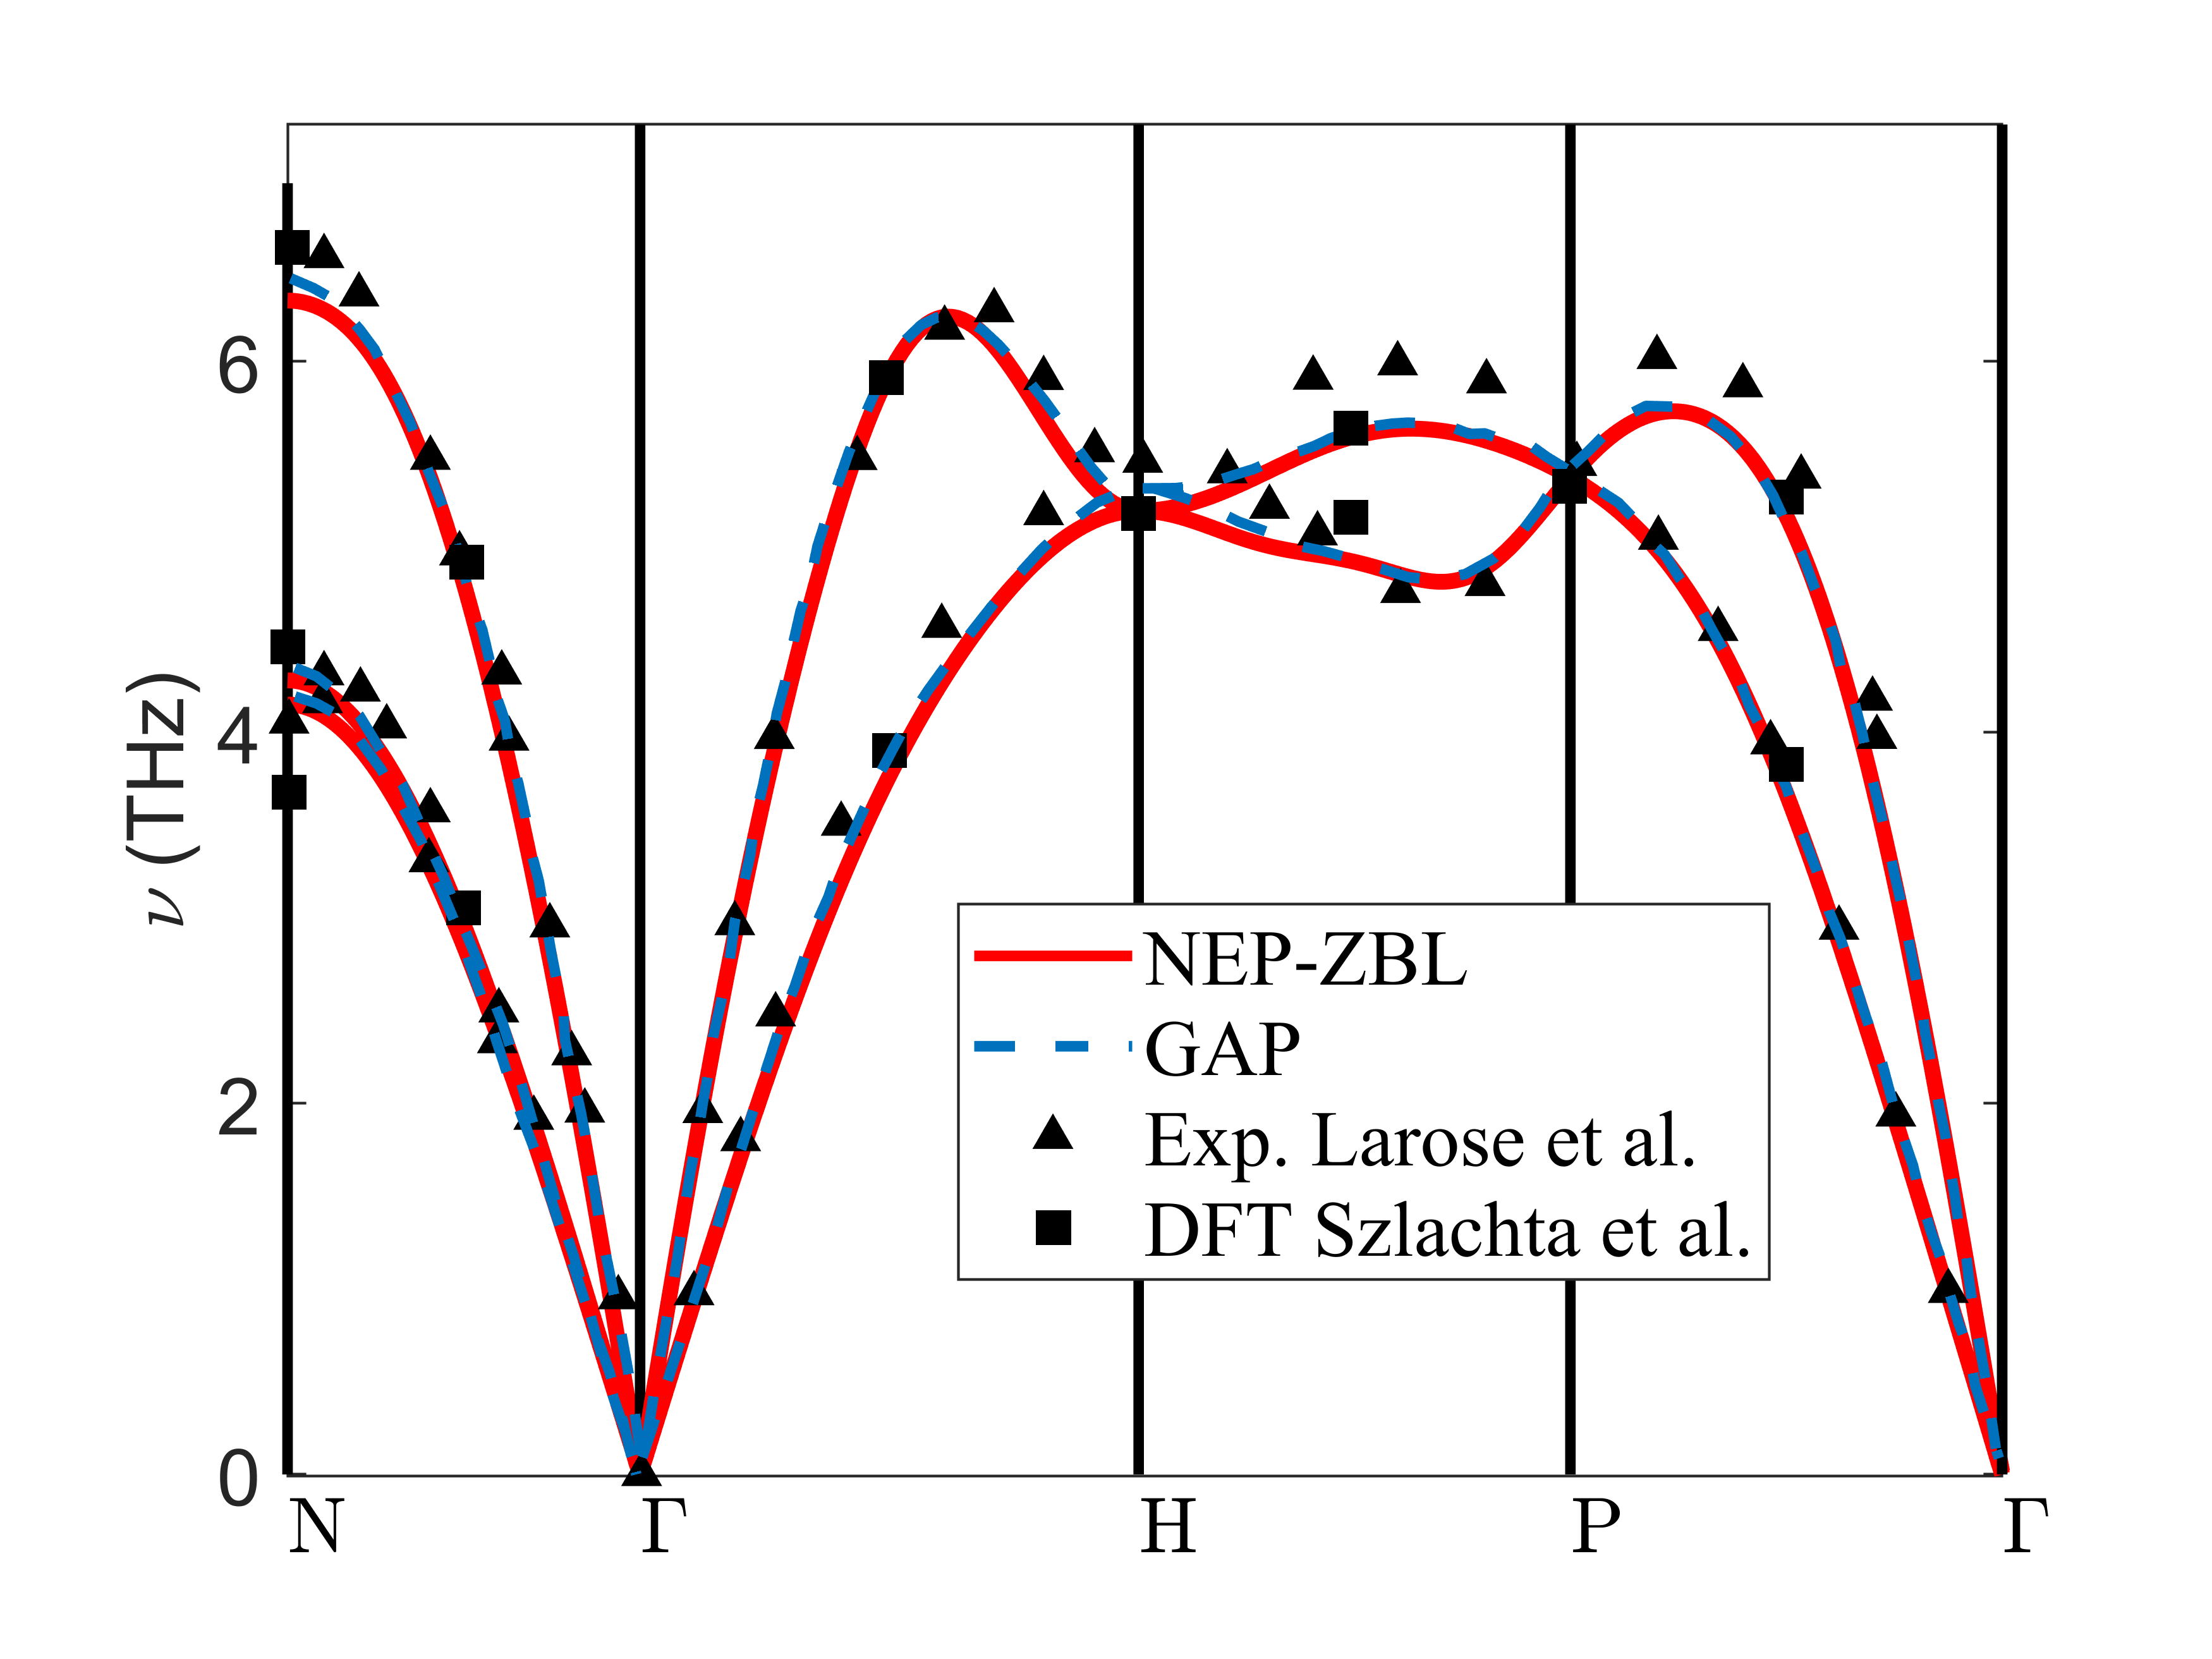
The melting point was calculated by the solid-liquid coexistence method Luo et al. (2004). The bi-phase system containing 13500 atoms with half of the atoms in the liquid phase and the other half in the solid bcc phase was simulated at temperatures ranging from 3500 K to 3600 K, and the pressures were kept at 0 GPa. The system remained as bi-phase using NEP-ZBL potential at 3540 K, above which the liquid phase grows, and below this temperature the system crystallizes. Figure 5 presents the phonon dispersion of bcc tungsten calculated by NEP-ZBL compared with experimental data Larose and Brockhouse (1976), the results calculated by GAP Byggmästar et al. (2019), and previous DFT studies Szlachta et al. (2014). The results show that the dispersion relation is well-reproduced by the NEP-ZBL model. All the above results demonstrate that the NEP-ZBL potential is not negatively affected by the ZBL potential and can provide accurate predictions about the material properties near the equilibrium state.
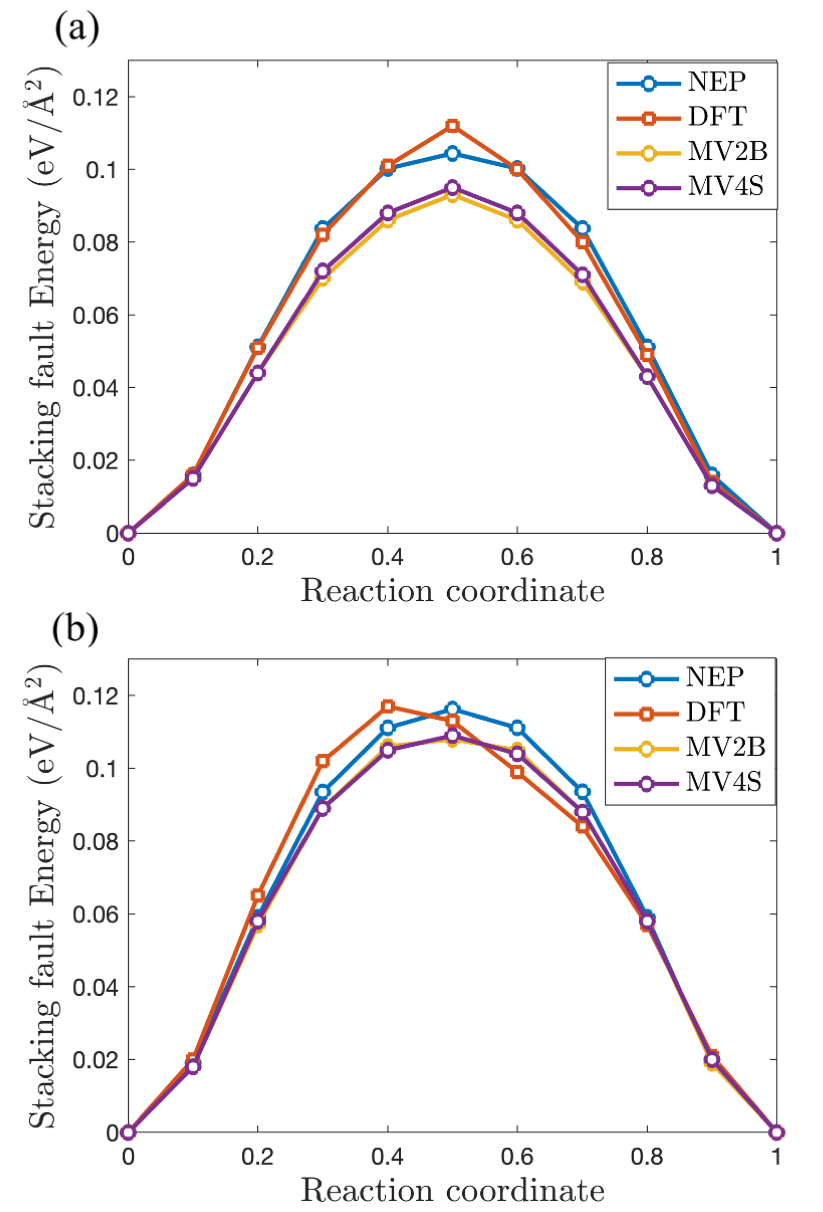
The energy landscape of generalized stacking fault (GSF) is defined by the energy change that occur when one section of the crystal is displaced in relation to the other along a specific plane ( plane). The GSF energy along a given direction is referred to as the -line. We evaluate the two common -lines that are relevant for screw dislocation motion using the NEP-ZBL model: displacement along the direction for both the plane and plane. We compare our findings with the results Wang et al. (2022a) of -lines computed via DFT and EAM models, as depicted in Figure 6. The predictions of the -lines by NEP-ZBL model exhibit a good agreement with DFT. The EAM predictions for -lines are marginally lower than DFT values at both the and planes.
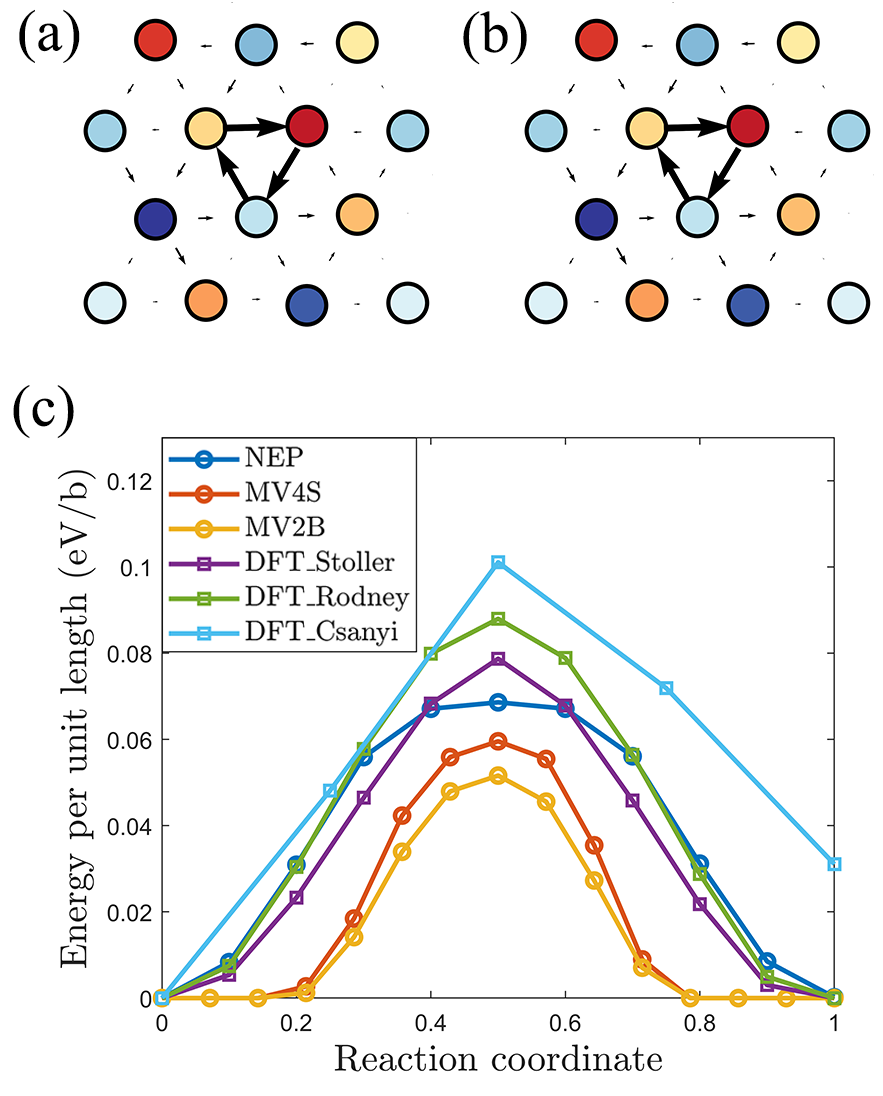
Reproducing the fundamental properties of screw dislocations has often been challenging for traditional interatomic potentials. To evaluate the relaxed core of the screw dislocation and Peierls barrier for screw dislocation migration, we employed 135-atom boxes with quadrupolar periodic arrangements of screw dislocation dipoles to generate two screw dislocations with opposite Burgers vectors, following the method established in Ref. Ventelon et al. (2013). Figure 7 presents the relaxed core of the screw dislocation in NEP-ZBL (a) and DFT (b), while Figure 7 (c) shows the Peierls barrier obtained from the NEP-ZBL model, EAM Marinica et al. (2013) models (MV2-B and MV4-S model) and DFT Wang et al. (2022a) calculations. Barriers are determined with simultaneous migration of both dislocations using the NEB method Henkelman et al. (2000). The NEP-ZBL model successfully replicates the symmetric nondegenerate core structure of the screw dislocation, as predicted by DFT. Moreover, the NEP-ZBL model yields similar barriers with consistent shapes in comparison to the DFT results, demonstrating a notable improvement over the EAM models.
Apart from accuracy, computational efficiency is also vital for simulating primary radiation damage. Table. 4 compares NEP-ZBL against an EAM-ZBL model Chen et al. (2018) and a DP-ZBL model Wang et al. (2022a) in terms of the computational speed and the upper limit of the system size in MD simulations, using one 40-GB A100 GPU. The NEP-ZBL model is only a couple of times slower than the empirical EAM-ZBL model and is about two orders of magnitude as efficient as the DP-ZBL model. The superior computational efficiency for NEP aginst MTP and GAP has been discussed previously Fan et al. (2022).
| Potential | Speed | |
|---|---|---|
| EAM-ZBL | ||
| NEP-ZBL | ||
| DP-ZBL |
III.3 Radiation-induced defects in bulk tungsten
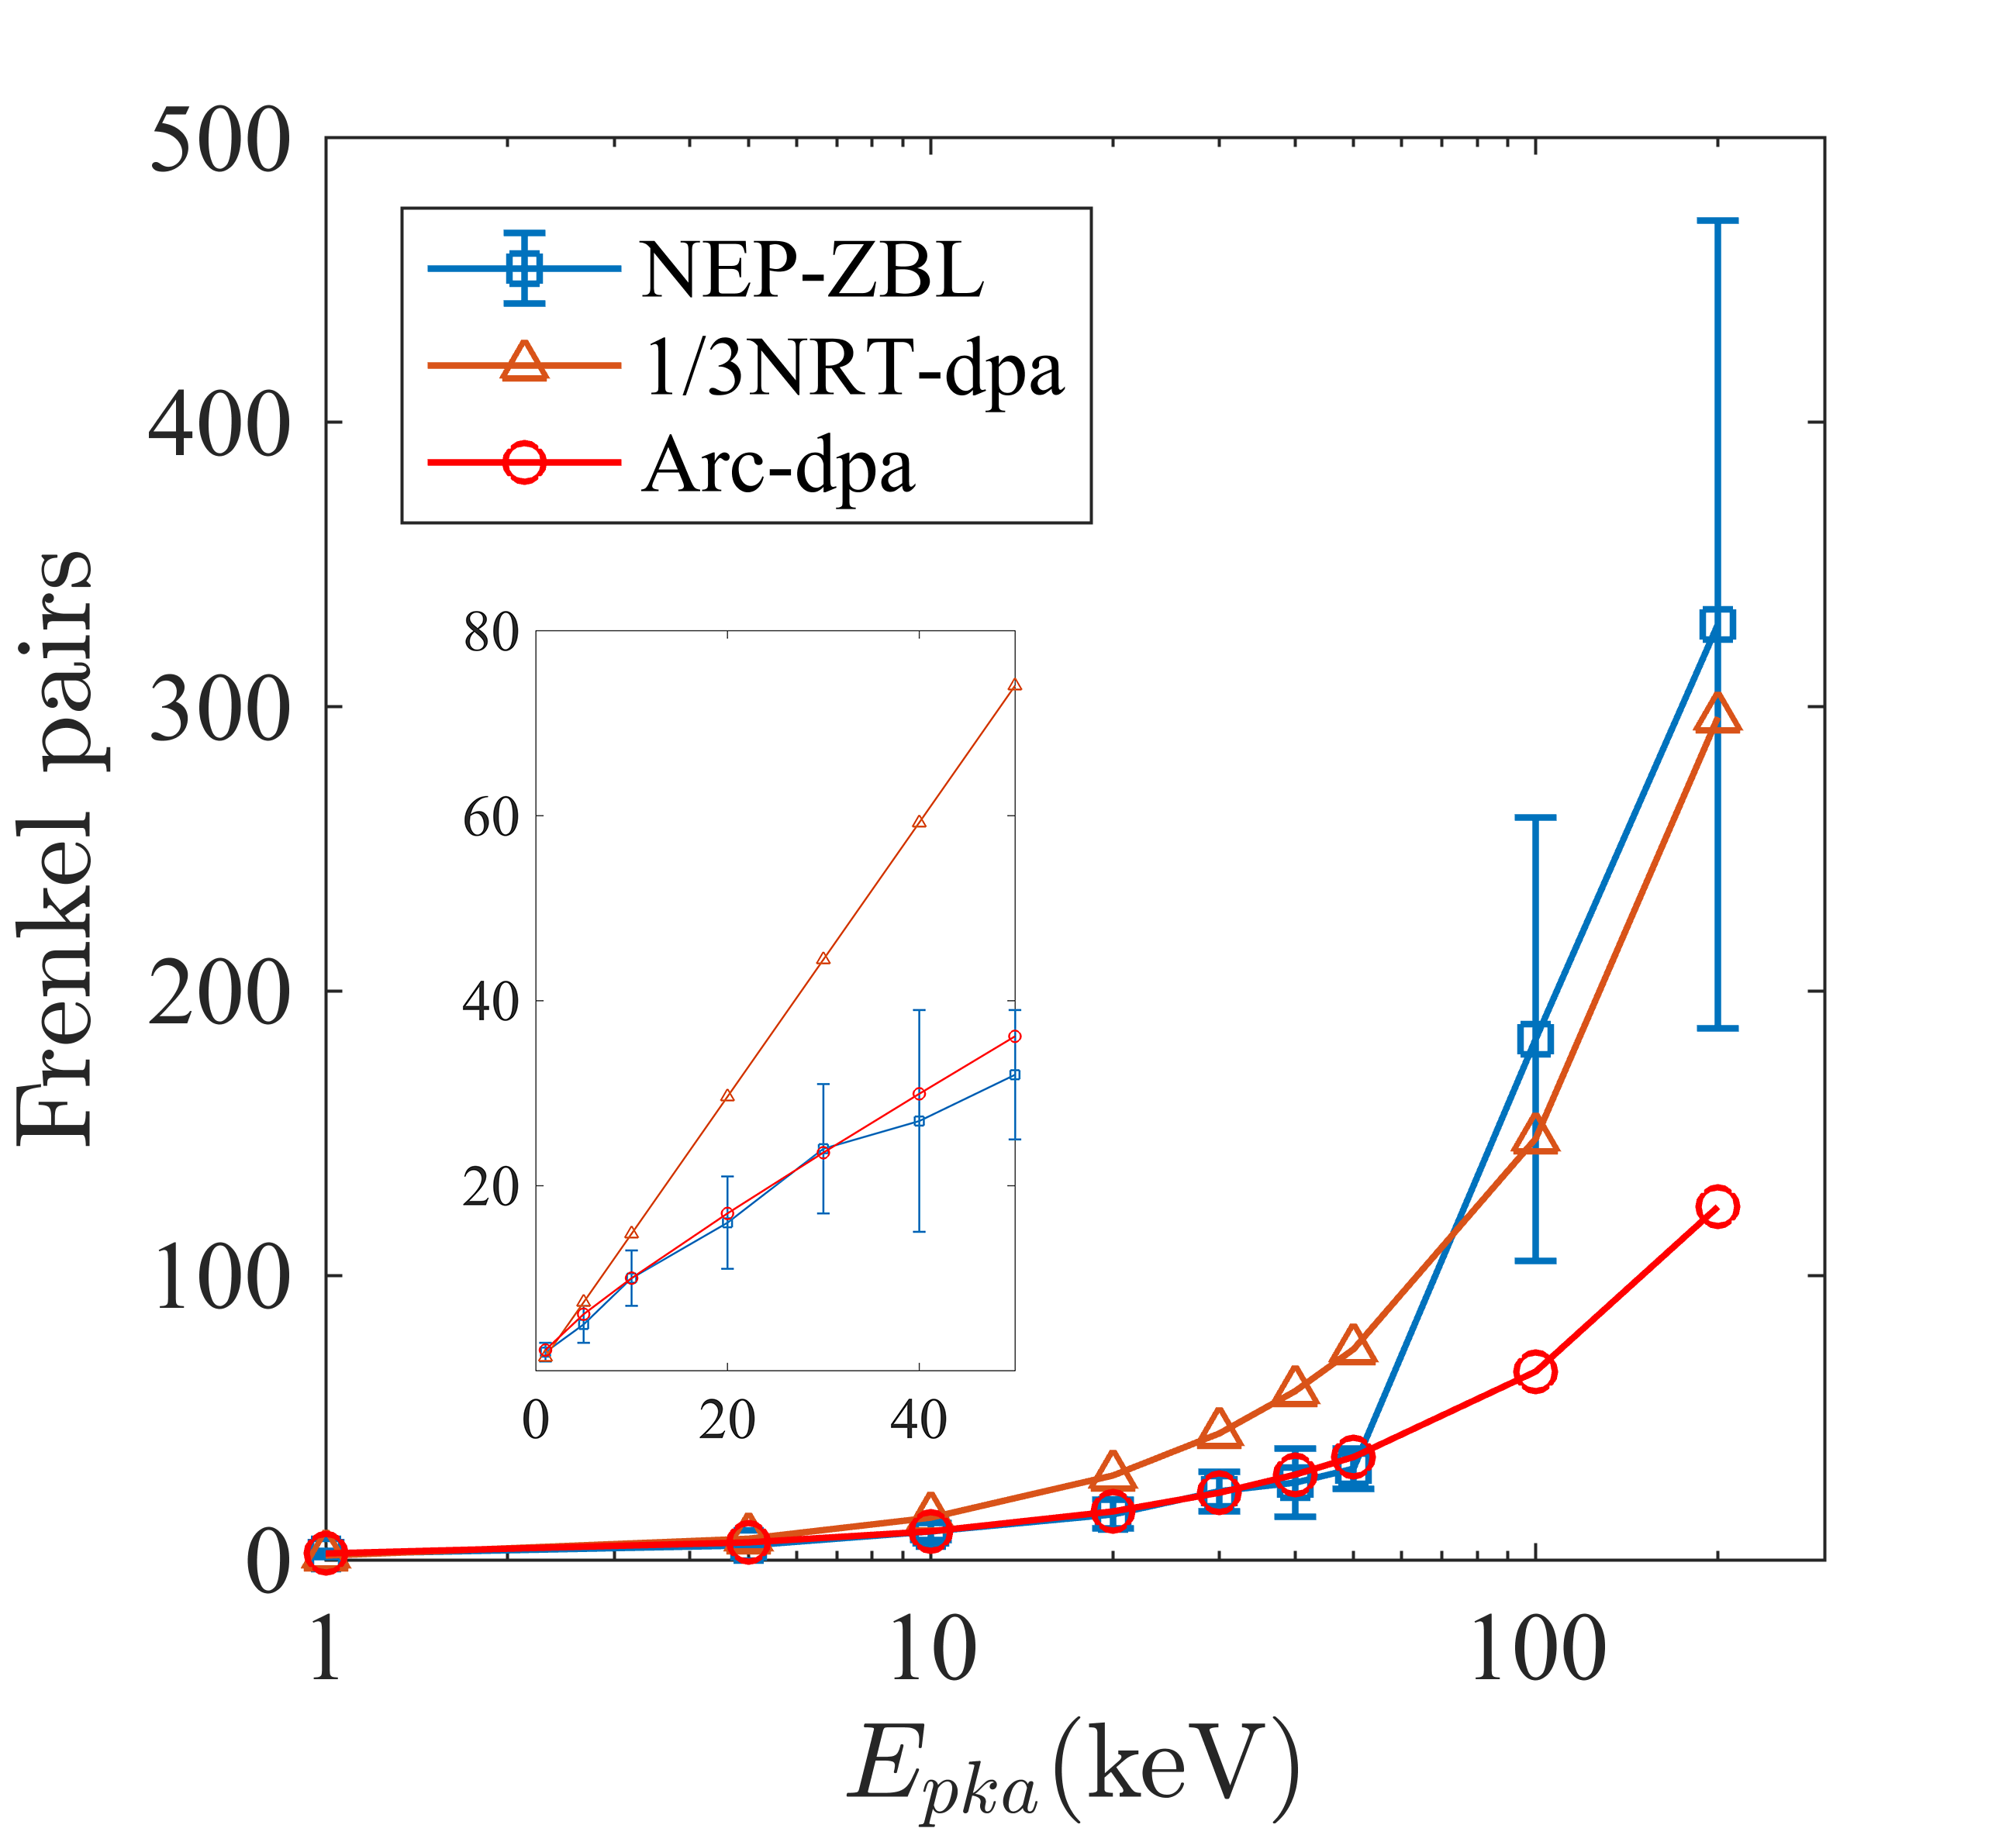
First, we quantified the number of residual point defects in the cascades with PKA energies ranging from 1 to 200 keV at 300 K. The Norgett-Robinson-Torrens displacements per atom (NRT-dpa) model Norgett et al. (1975) is the current international standard for quantifying this energetic particle damage. However, it has been observed that in metals, the number of defects produced in energetic cascades is only one-third of the NRT-dpa prediction Nordlund et al. (2018a). The athermal recombination corrected displacements per atom (arc-dpa) function, proposed by Nordlund et al., improves upon the NRT-dpa by providing a more physically realistic description of primary defect creation in materials Nordlund et al. (2018b). Figure 8 presents the residual point defects calculated by the NEP-ZBL model, the NRT model and the arc-dpa model Nordlund et al. (2018b). The value of used in the model is 90 eV, as commonly used in experimental studies. Setyawan et al. Setyawan et al. (2015) reported two regimes of energy-dependence for defect production in metals. The number of surviving Frenkel pairs (FPs) obtained by the NEP-ZBL model is consistent with the arc-dpa model at lower energy regions. In the higher energy region, the number of surviving FPs () follows a function () of the reduced energy, , with the threshold displacement energy set to 117 eV. The pre-factor is 0.03 and the fitted exponent is 1.25, similar to the results reported by Setyawan et al. Setyawan et al. (2015) with a pre-factor of 0.02 and a fitted exponent of 1.30.
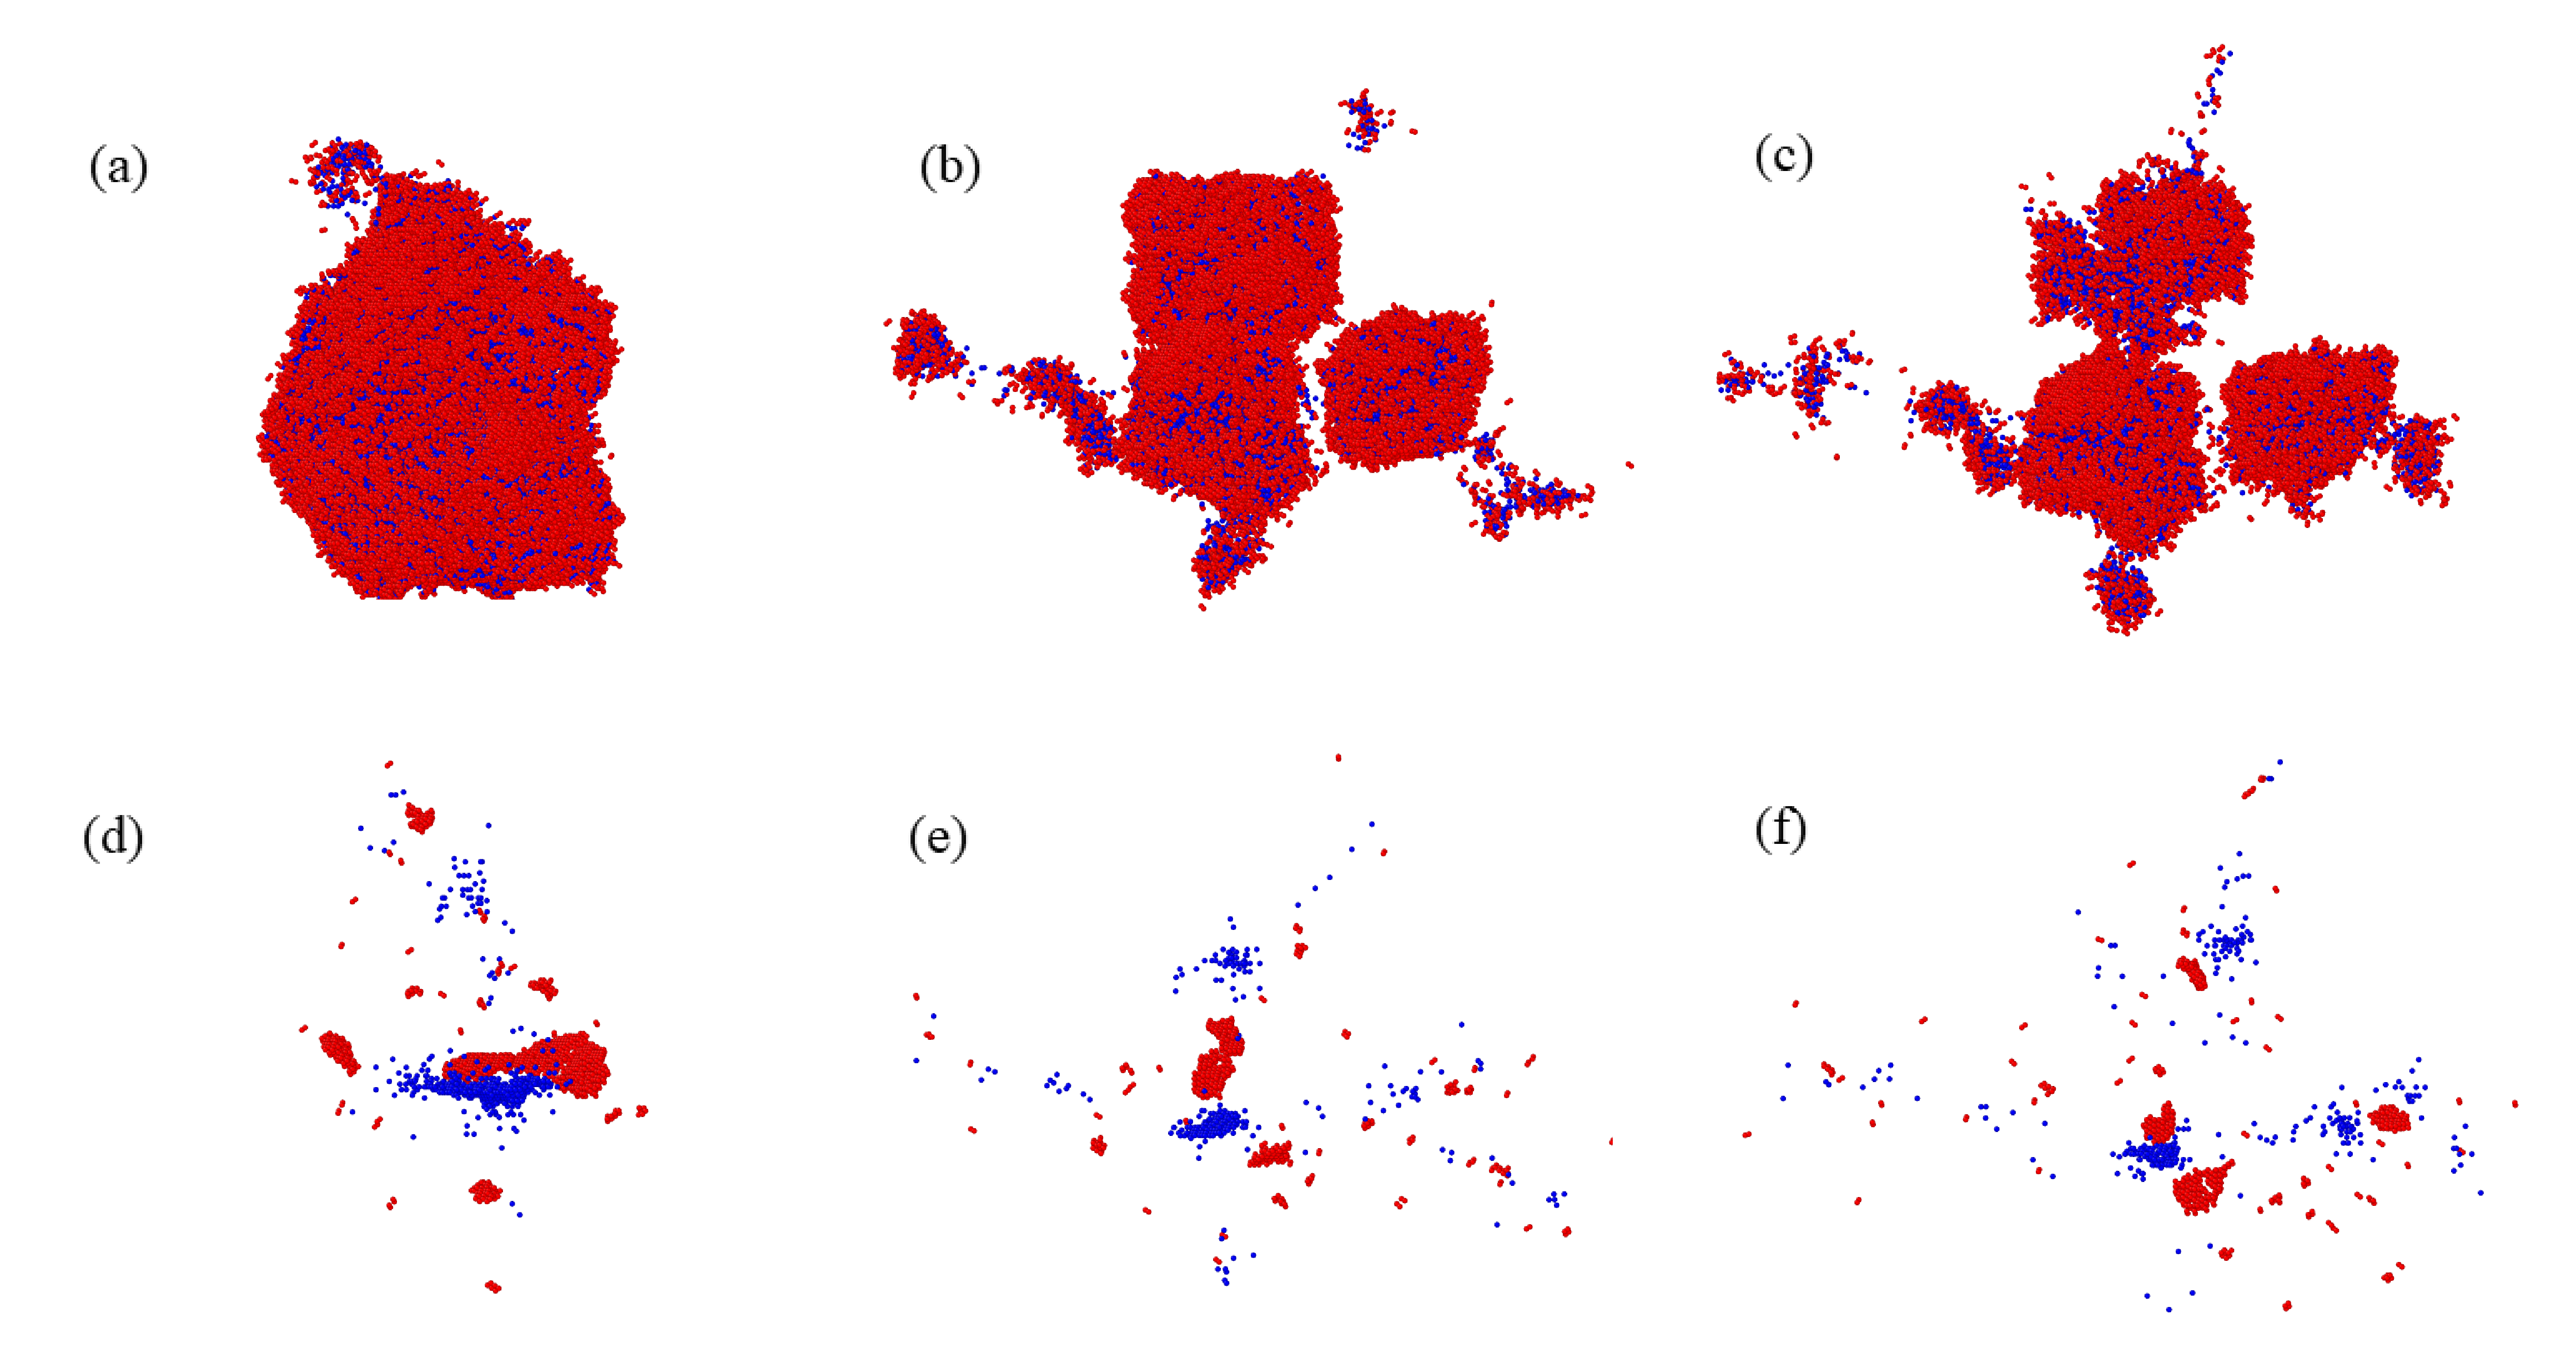
Figure 9 presents snapshots of three typical defects resulting from a displacement cascade with a PKA energy of 200 keV. We classify the cascades by the peak damage state into three categories, unfragmented, unconnected, and connected, following the criterion suggested in Ref. Antoshchenkova et al., 2015. The observed probability of subcascade splitting is 70% for the 200 keV PKA energy and decreases to 20% for a PKA energy of 100 keV. This is consistent with the subcascade splitting threshold for self-ions in tungsten, which is estimated to be around 160 keV based on the analysis of binary collision approximation (BCA) cascades Backer et al. (2016). Figure 9 (a) depicts an unfragmented case where the cascade appears in a locally compact region, producing a massive and unbroken molten region, and Figure 9 (d) shows the defect distribution of this case after 150 ps. Large interstitial clusters are accompanied by the formation of large vacancy clusters, both exhibiting a two-dimensional platelet shape (loops). Figure 9 (b)-(e) and Figure 9 (c)-(f) respectively illustrate the continuous morphology of the fragmentations and the defect distribution of them after 150 ps through the connected and the unconnected subcascades. It can be seen that the distribution of defects correlates with the morphology at the peak damage state. Compared to unfragmented cascades, the distribution of defects in fragmented cascades is more dispersed and the clusters are smaller in size.
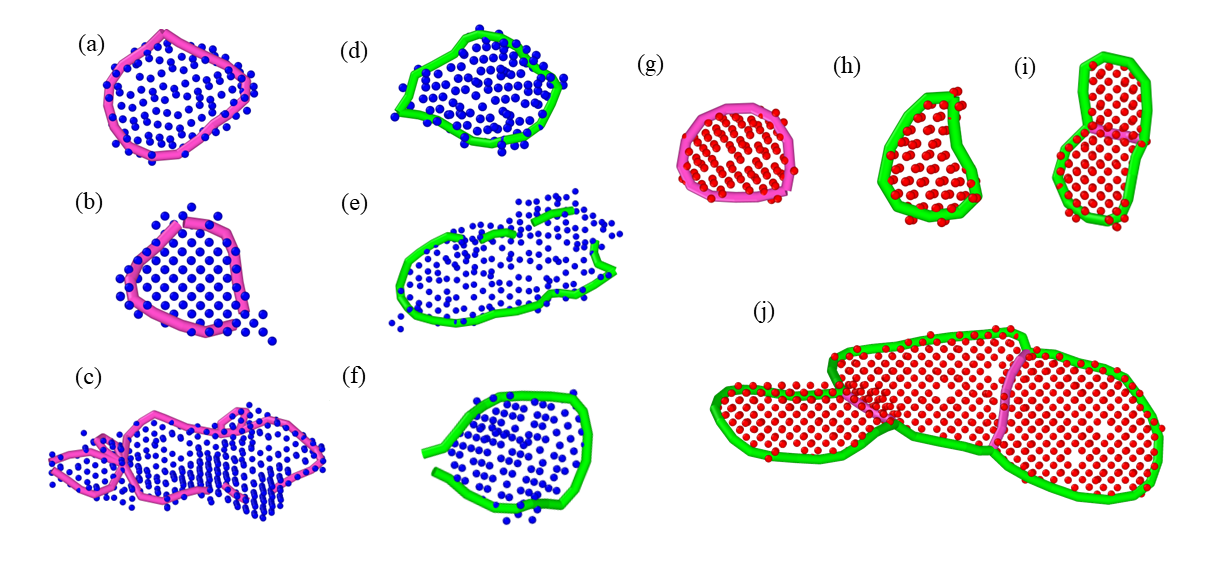
We analysed each large defect cluster to determine the nature of the dislocation loops. Figure 10 shows the typical defect clusters produced by a 200 keV cascade. Most of the dislocation loops observed have the Burgers vector . It is worth mentioning that we observed an interstitial loop in Figure 9 (f). Although this interstitial loop is the only one observed in ten cascades, it is stable within a time scale of 1 ns. The dynamic process of this cascade is showcased in Supplementary Movie 1.
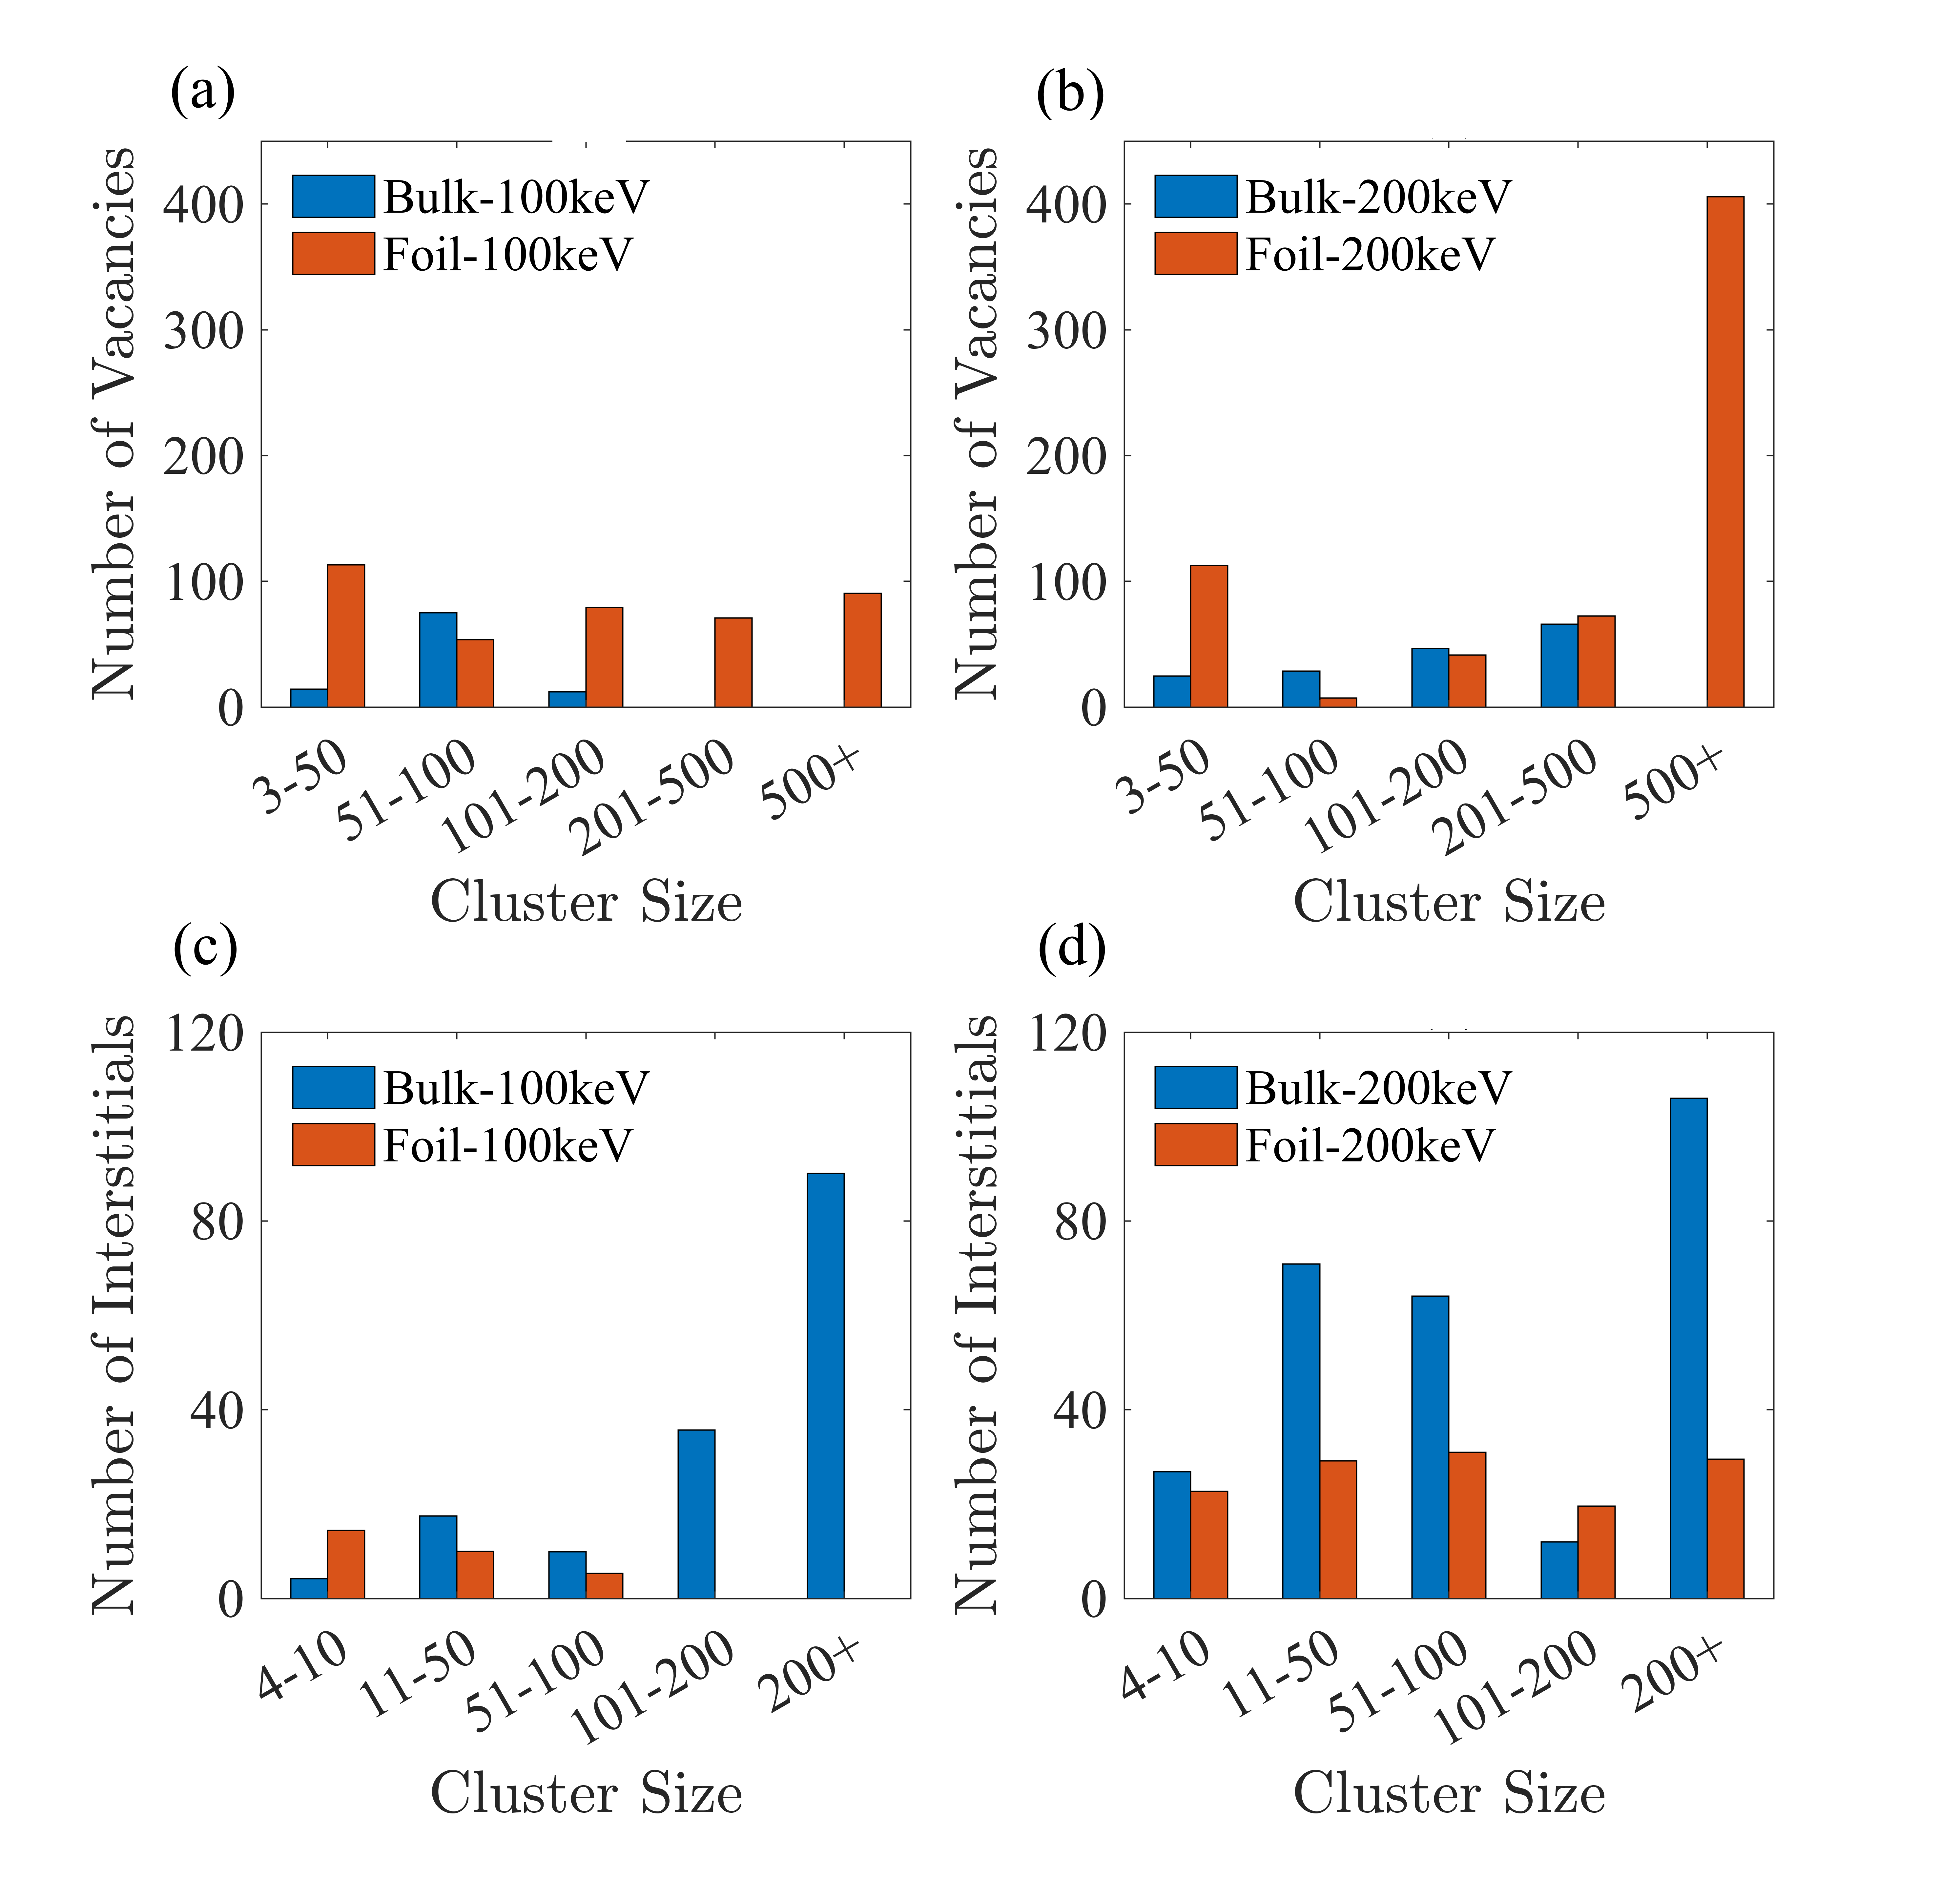
The detailed size distributions of the interstitial and vacancy clusters obtained with 100 keV and 200 keV PKA energies are shown in Fig. 12. The largest clusters of both interstitial and vacancy type were produced by the 200 keV unfragmented cascade. Large vacancy clusters are accompanied by the formation of large interstitial clusters, with sizes more than 80 vacancies mainly exhibiting a two-dimensional platelet shape (loops), while sizes below 80 vacancies exhibit three dimensional shapes (cavity). The interstitial clusters exhibit a two-dimensional platelet shape (loops). Note that a larger number density and smaller average size distribution of defect clusters were found by the 200 keV cascade. With 100 keV PKA energy, 59% vacancy clusters are smaller than 50 defects in size, 71% SIA clusters are smaller than 100 defects, and the ratios are 79% and 95% at 200 keV energy. The more frequent subcascade splitting at 200 keV is the cause of this difference.
III.4 Radiation-induced defects in thin-foil tungsten
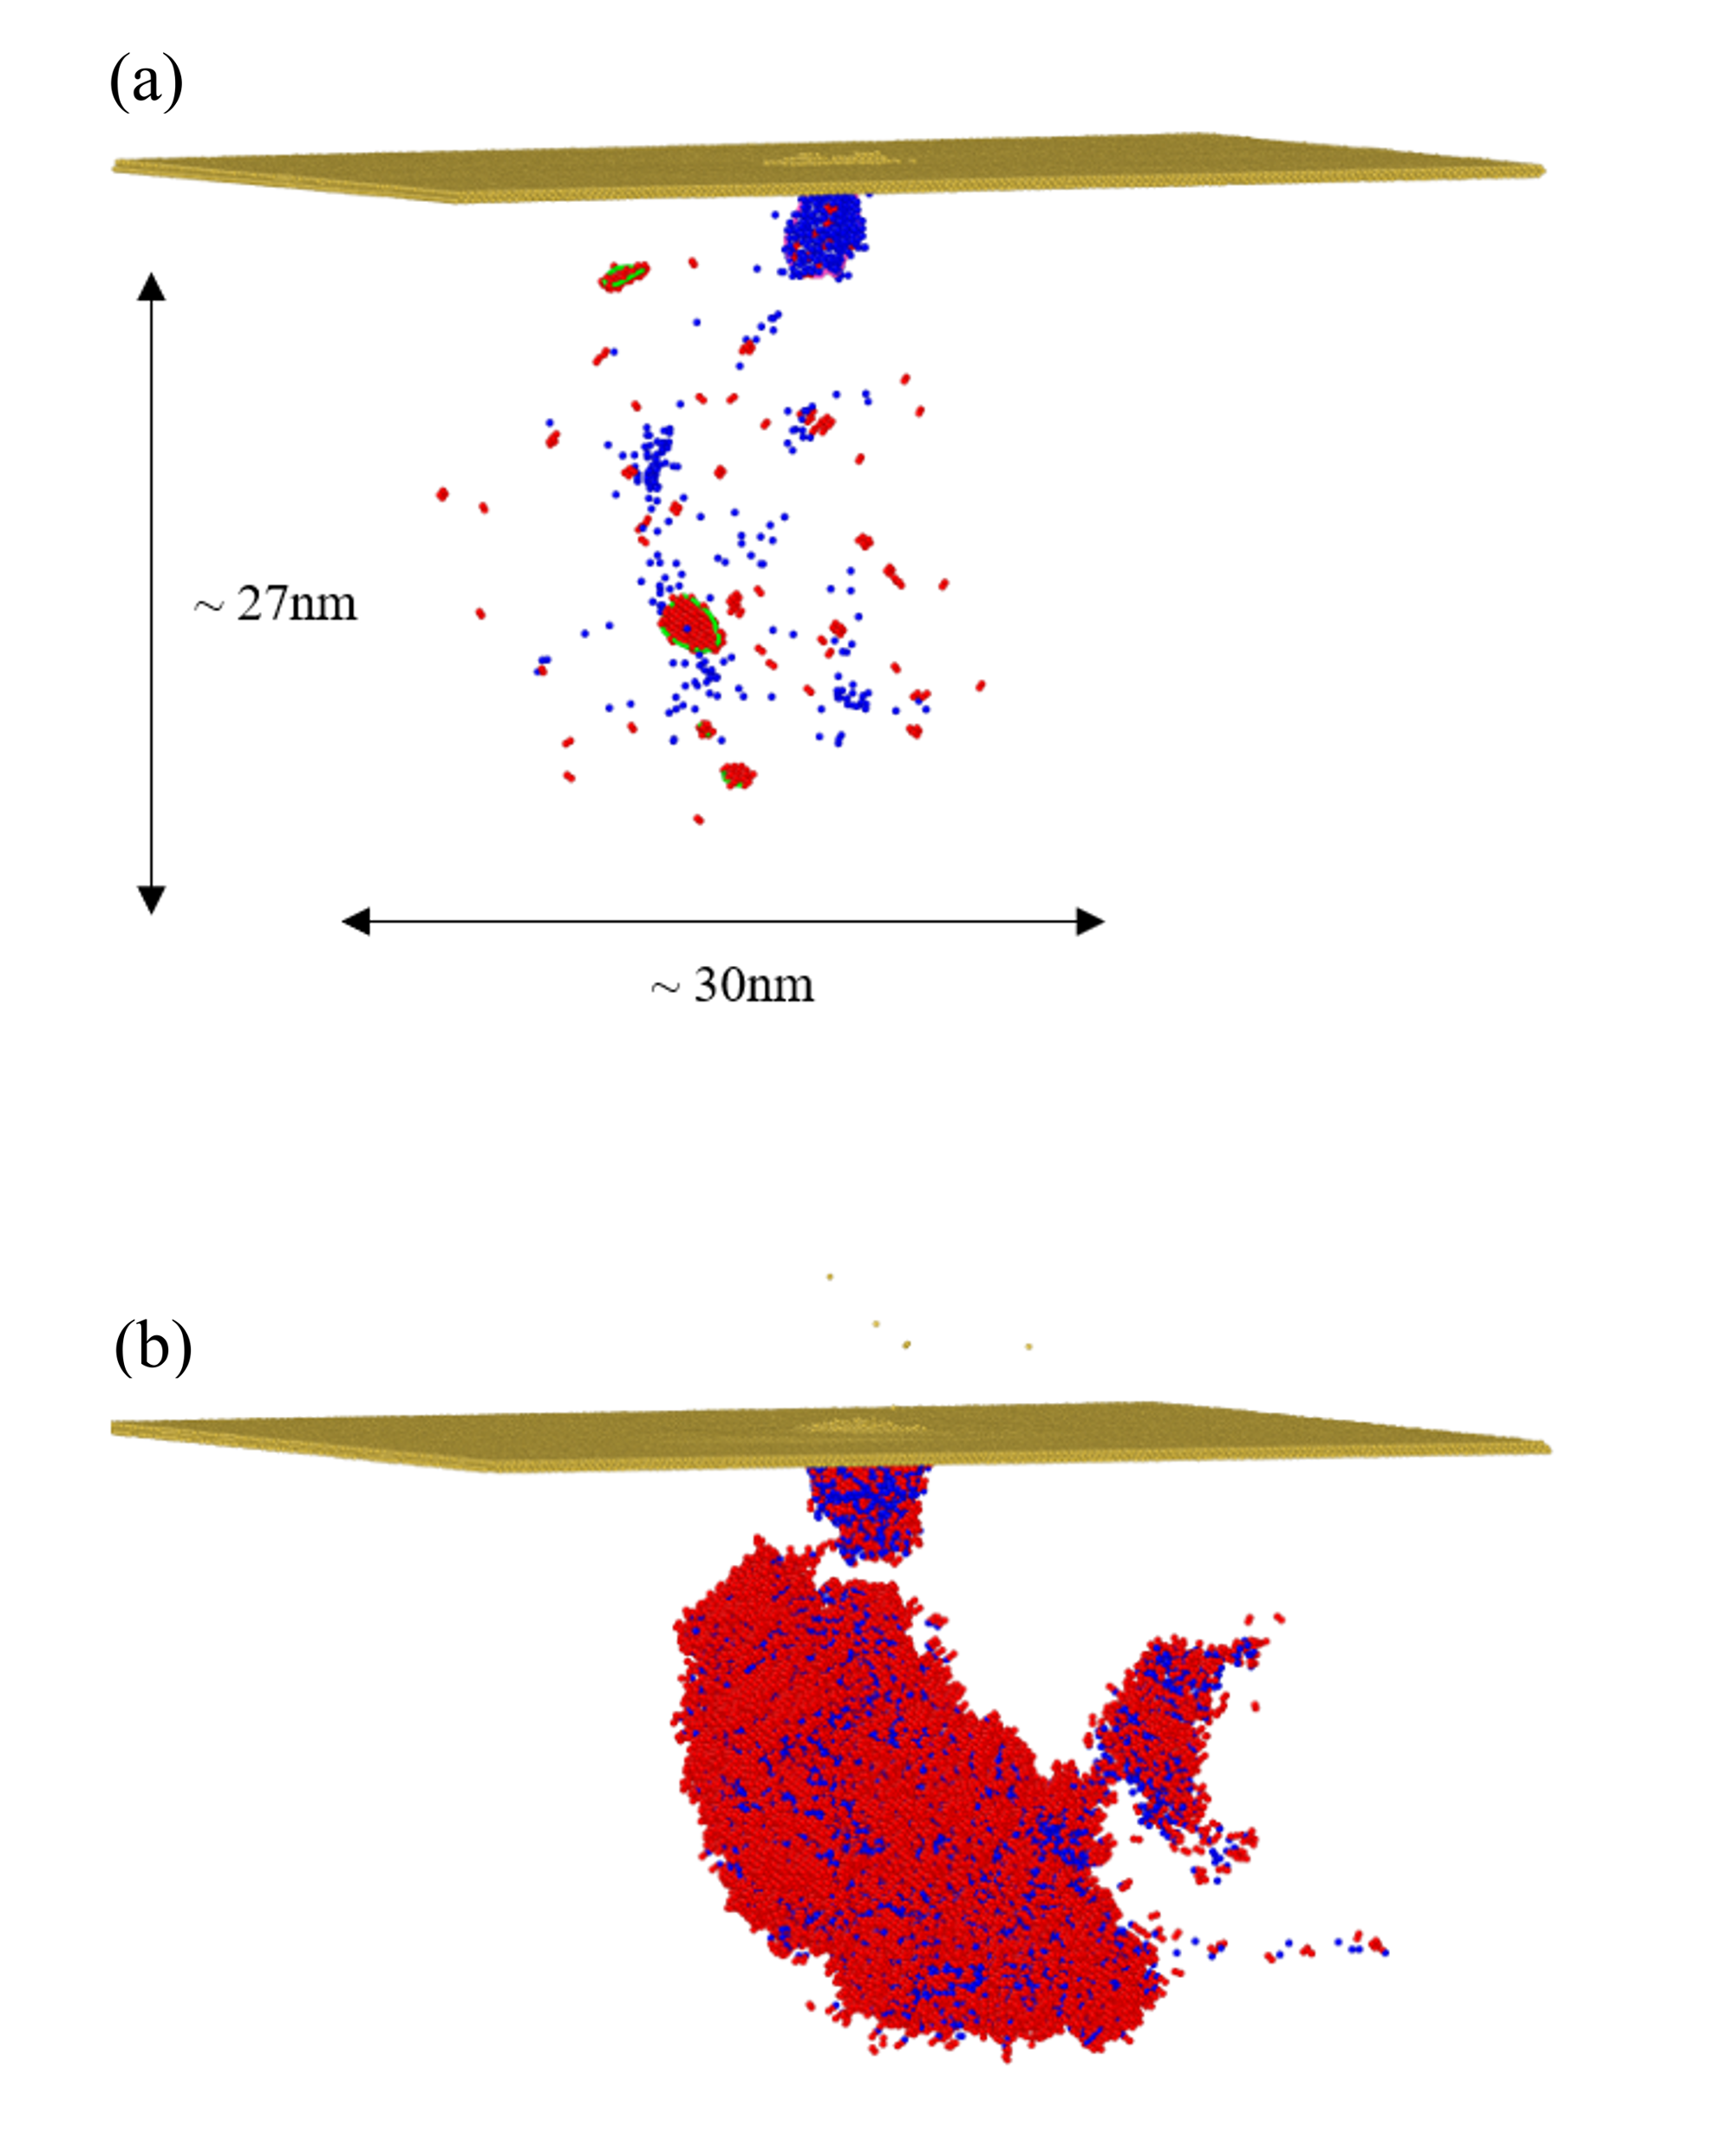
Figure 11 shows the damage microstructure of the tungsten thin film 220 ps after launching the 200 keV PKA as well as the peak damage state. Blue spheres mark the location of vacancies while red particles are interstitial atoms. Surface-layer atoms, including ad-atoms and sputtered atoms, are also represented in the figure with yellow spheres. In this fragmented cascade, the liquid core of the subcascade heat spike extends to the surface causing near-surface material to be ejected in the form of sputtered atoms and atom clusters. In addition, there is a viscous flow of atoms to the surface resulting in a depleted zone in the core of the cascade and subsequent formation of large vacancy clusters. Figure 11 (a) shows that the damage consists of isolated interstitials and vacancies, three smaller clusters and a relative large cluster of 22, 17, 8, and 76 interstitials, and a significantly larger clusters of 275 vacancies. The total number of vacancies in this case is 478, while the total number of self-interstitials is 212. There are 260 ad-atoms at the free surface and 6 sputtered atoms corresponding to the mismatch between the vacancy and interstitial counts. These observations are consistent with previous simulations of thin-foil tungsten Sand et al. (2018).
As can be observed in Fig. 11 , most of the damage distribution is scattered, while the displacement cascade reached a maximum depth of 27 nm and width of 30 nm. Figure 11 (a) shows an incomplete dislocation loop with 127 vacancies, which remains stable within a time scale of 1 ns. The dynamic process of this cascade is showcased in Supplementary Movie 2. The presence of dislocation loops following displacement cascades in W was already shown by Yi et al. X. Yi and M.L. Jenkins and M. Briceno and S.G. Roberts and Z. Zhou and M.A. Kirk (2013). Figure 11 (b) exhibits a snapshot of the cascade at the peak. We find that all cascades with the formation of vacancy dislocation loops are fragmented and the subcascade near the surface is unconnected to the main cascade core further below. The dislocation loops are formed by cascade collapse from the subscascade. We also obtained one damage configuration which consists of a dislocation network connected to the surface similar to that obtained by Ghaly and Averback in Au Ghaly and Averback (1994). This is also consistent with previous simulations of Fe and W thin foils Aliaga et al. (2015); Sand et al. (2018).
In order to quantify the surface effect on radiation-induced defects, we performed a statistical analysis of the data including the mean values of the number of point defects as well as their percentage in clusters, listed in Table 5. Due to the surface effect, the number of self-interstitials is always lower than the number of vacancies in foil simulations. As shown in Table 5 the damage exhibits an increase of 391% and 264% for the number of vacancies compared to bulk simulations and a decrease of 66.7% and 39.2% for interstitials for 100 keV and 200 keV PKAs, where the missing self-interstitials correspond to ad-atoms and sputtered atoms Aliaga et al. (2015). The maximum number of atoms sputtered out is 73 with 100 keV PKA energy. Table 5 shows that the percentage of vacancies in clusters is very similar for bulk and foil material, but the percentage of interstitials in clusters decreases 37% and 19% for 100 keV and 200 keV, respectively. Due to the mechanisms explained above, the main effects of the free surface is that more vacancies are formed but fewer interstitials. Interstitials also remain more isolated instead of efficiently clustering like in bulk cascades. The surface effect decreases with increasing energy since the core of the cascade is further away from the surface with increasing energy.
| Energy (keV) | % in clusters | |||||
|---|---|---|---|---|---|---|
| 100 | Bulk | 183(78) | 183(78) | 97 | 237 | 55/86 |
| Foil | 898(278) | 61(72) | 905 | 53 | 45/49 | |
| 200 | Bulk | 329(142) | 329(142) | 457 | 429 | 50/85 |
| Foil | 1200(695) | 200(205) | 1103 | 295 | 52/66 | |
Figure 12 shows the size distributions of clusters of vacancies and interstitials in thin foils. It is clear that larger and more vacancy clusters as well as smaller and less interstitial clusters are produced, compared to bulk tungsten. In addition, the scatter in the size of clusters is extensive. There is one vacancy cluster with 1103 vacancies formed by a 200 keV cascade. The surface also affects the dislocation density. Compared to bulk, the dislocation density of Burgers vectors increases from to as well as from to for 100 keV and 200 keV PKAs respectively. Correspondingly the 1/2 dislocation density decreases from to as well as from to . Overall, the simulations show that the frequency and size of vacancy dislocation loops and the -dislocation density is greater when damage is produced in thin foils.
In our computational modeling study, we have observed results consistent with the experimental findings reported by Yi et al. Yi et al. (2015). The emergence of 1/2 and vacancy loops in low-dose heavy-ion irradiated tungsten is validated as an intrinsic cascade phenomenon. This suggests that these loops primarily originate from cascade nucleation rather than resulting from long-term evolution of the defect structure. Moreover, our simulations emphasize the impact of foil surfaces, as seen in thin-foil irradiation specimens or back-thinned irradiated specimens, on the evolution of damage. The notable trends elucidated by Yi et al. Yi et al. (2016) were consistently replicated in our computational investigation: the total vacancy count was observed to be an order of magnitude greater than the number of SIAs, indicating a substantial effect of proximate free surfaces on defect formation. In contrast to EAM models wherein the effect of surface on defect statistics is more pronounced in Fe than in W Sand et al. (2016) and the formation of SIA clusters is only slightly affected by the surface, the NEP-ZBL potential shows a noticeable impact of the free surface in tungsten. This difference suggests that EAM models may not fully capture free surface effects, which is in line with the fact that surfaces in EAM models are often significantly too stable (i.e., surface energies are severely underestimated, Fig. 3).
IV Summary and Conclusions
We have introduced a hybrid scheme of the Ziegler-Biersack-Littmark (ZBL) screened nuclear repulsion potential and the neuroevolution machine learning potential. This novel model achieves accuracy comparable to other ML potentials, while exhibiting high computational efficiency in terms of computation time and memory usage. This allowed us to investigate energetic radiation-induced collision cascades in large-scale molecular dynamics simulations. Primary radiation damage of tungsten was investigated by irradiation with ions of energies ranging from 1 keV to 200 keV in both thin foil and bulk form. We observed that low-dose high-energy irradiation directly generates interstitial dislocation loops in tungsten, which remained stable within 1 ns. The simulations also generated complete dislocation loops of vacancy type, including dislocation loops and 1/2 dislocation loops. The presence of a surface led to the formation of more numerous and larger vacancy clusters as well as smaller and less interstitial clusters. Some of vacancy clusters coalesced into incomplete dislocation loops. This significantly enhances the linear density of dislocations in the irradiated material. Our results shows that one should carefully account for the effect of free surfaces in tungsten.
We showed that the NEP-ZBL potential provides accurate predictions of material properties which have been persistent challenges for empirical potentials, such as the relative stability of defect clusters and surface properties. Furthermore molecular dynamics simulations revealed that our findings for bulk tungsten agree with existing results from EAM models. However we see pronounced differences in the simulations for foils compared to EAM models. These differences suggest that while EAM models can depict radiation damage in bulk structures, they may not fully reproduce the effects of free surfaces. With an efficient gpu implementation, the NEP-ZBL framework hence offers good opportunities for large-scale simulations of radiation damage also in other materials, particularly in systems lacking suitable empirical potentials such as high-entropy alloys and ceramics.
Data availability
The training and validation results for the NEP-ZBL model of tungsten can be freely available from the Github repository https://github.com/Jonsnow-willow/GPUMD-Wizard. Other data presented in this paper are available from the corresponding authors upon reasonable request.
Acknowledgements.
The authors acknowledge funding from the CNNC Science Fund for Talented Young Scholars FY222506000902. (Y. S. & J. L.), the National Natural Science Foundation of China (NSFC) under grant no. 11974059 (Z. F.), the Academy of Finland Flagship programme: Finnish Center for Artificial Intelligence FCAI (J. B.), the National Key Research and Development Program of China under grant no. 2021YFB3802104 (P. Q.), and USTB MatCom of Beijing Advanced Innovation Center for Materials Genome Engineering.References
- Knaster et al. (2016) J. Knaster, A. Moeslang, and T. Muroga, “Materials research for fusion,” Nature Physics 12, 424–434 (2016).
- Gilbert et al. (2012) M.R. Gilbert, S.L. Dudarev, S. Zheng, L.W. Packer, and J.-Ch. Sublet, “An integrated model for materials in a fusion power plant: transmutation, gas production, and helium embrittlement under neutron irradiation,” Nuclear Fusion 52, 083019 (2012).
- Zinkle and Was (2013) S.J. Zinkle and G.S. Was, “Materials challenges in nuclear energy,” Acta Materialia 61, 735–758 (2013).
- Nordlund (2019) K. Nordlund, “Historical review of computer simulation of radiation effects in materials,” Journal of Nuclear Materials 520, 273–295 (2019).
- Lin et al. (2020) Yeping Lin, Tengfei Yang, Lin Lang, Chang Shan, Huiqiu Deng, Wangyu Hu, and Fei Gao, “Enhanced radiation tolerance of the Ni-Co-Cr-Fe high-entropy alloy as revealed from primary damage,” Acta Materialia 196, 133–143 (2020).
- X. Yi and M.L. Jenkins and M. Briceno and S.G. Roberts and Z. Zhou and M.A. Kirk (2013) X. Yi and M.L. Jenkins and M. Briceno and S.G. Roberts and Z. Zhou and M.A. Kirk, “In situ study of self-ion irradiation damage in W and W–5Re at 500 C,” Philosophical Magazine 93, 1715–1738 (2013).
- Yi et al. (2015) Xiaoou Yi, Michael L. Jenkins, Khalid Hattar, Philip D. Edmondson, and Steve G. Roberts, “Characterisation of radiation damage in W and W-based alloys from 2MeV self-ion near-bulk implantations,” Acta Materialia 92, 163–177 (2015).
- Yi et al. (2016) Xiaoou Yi, Michael L. Jenkins, Marquis A. Kirk, Zhongfu Zhou, and Steven G. Roberts, “In-situ TEM studies of 150 keV W+ ion irradiated W and W-alloys: Damage production and microstructural evolution,” Acta Materialia 112, 105–120 (2016).
- (9) E Zarkadoula, S L Daraszewicz, D M Duffy, M A Seaton, I T Todorov, K Nordlund, M T Dove, and K Trachenko, “The nature of high-energy radiation damage in iron,” Journal of Physics: Condensed Matter 25, 125402.
- Fu et al. (2019) Jun Fu, Yangchun Chen, Jingzhong Fang, Ning Gao, Wangyu Hu, Chao Jiang, Hong-Bo Zhou, Guang-Hong Lu, Fei Gao, and Huiqiu Deng, “Molecular dynamics simulations of high-energy radiation damage in W and W-Re alloys,” Journal of Nuclear Materials 524, 9–20 (2019).
- Byggmästar et al. (2019) J Byggmästar, F Granberg, A E Sand, A Pirttikoski, R Alexander, M-C Marinica, and K Nordlund, “Collision cascades overlapping with self-interstitial defect clusters in Fe and W,” Journal of Physics: Condensed Matter 31, 245402 (2019).
- Peng et al. (2018) Qing Peng, Fanjiang Meng, Yizhong Yang, Chenyang Lu, Huiqiu Deng, Lumin Wang, Suvranu De, and Fei Gao, “Shockwave generates dislocation loops in bcc iron,” Nature Communications 9, 4880 (2018).
- Chen et al. (2018) Yangchun Chen, Yu-Hao Li, Ning Gao, Hong-Bo Zhou, Wangyu Hu, Guang-Hong Lu, Fei Gao, and Huiqiu Deng, “New interatomic potentials of W, Re and W-Re alloy for radiation defects,” Journal of Nuclear Materials 502, 141–153 (2018).
- Bonny et al. (2014) G Bonny, D Terentyev, A Bakaev, P Grigorev, and D Van Neck, “Many-body central force potentials for tungsten,” Modelling and Simulation in Materials Science and Engineering 22, 053001 (2014).
- Hamedani et al. (2021) A. Hamedani, J. Byggmästar, F. Djurabekova, G. Alahyarizadeh, R. Ghaderi, A. Minuchehr, and K. Nordlund, “Primary radiation damage in silicon from the viewpoint of a machine learning interatomic potential,” Phys. Rev. Materials 5, 114603 (2021).
- Byggmästar et al. (2019) J. Byggmästar, A. Hamedani, K. Nordlund, and F. Djurabekova, “Machine-learning interatomic potential for radiation damage and defects in tungsten,” Phys. Rev. B 100, 144105 (2019).
- Granberg et al. (2021) F. Granberg, J. Byggmästar, and K. Nordlund, “Molecular dynamics simulations of high-dose damage production and defect evolution in tungsten,” Journal of Nuclear Materials 556, 153158 (2021).
- Wang et al. (2022a) Xiaoyang Wang, Yinan Wang, Linfeng Zhang, Fuzhi Dai, and Han Wang, “A tungsten deep neural-network potential for simulating mechanical property degradation under fusion service environment,” Nuclear Fusion (2022a).
- Wang et al. (2019) Hao Wang, Xun Guo, Linfeng Zhang, Han Wang, and Jianming Xue, “Deep learning inter-atomic potential model for accurate irradiation damage simulations,” Applied Physics Letters 114, 244101 (2019).
- Wang et al. (2022b) Yi Wang, Jianbo Liu, Jiahao Li, Jinna Mei, Zhengcao Li, Wensheng Lai, and Fei Xue, “Machine-learning interatomic potential for radiation damage effects in bcc-iron,” Computational Materials Science 202, 110960 (2022b).
- Byggmästar et al. (2022a) J Byggmästar, G Nikoulis, A Fellman, F Granberg, F Djurabekova, and K Nordlund, “Multiscale machine-learning interatomic potentials for ferromagnetic and liquid iron,” Journal of Physics: Condensed Matter 34, 305402 (2022a).
- Byggmästar et al. (2021) J. Byggmästar, K. Nordlund, and F. Djurabekova, “Modeling refractory high-entropy alloys with efficient machine-learned interatomic potentials: Defects and segregation,” Phys. Rev. B 104, 104101 (2021).
- Byggmästar et al. (2022b) J. Byggmästar, K. Nordlund, and F. Djurabekova, “Simple machine-learned interatomic potentials for complex alloys,” Phys. Rev. Mater. 6, 083801 (2022b).
- Domínguez-Gutiérrez et al. (2023) F. J. Domínguez-Gutiérrez, P. Grigorev, A. Naghdi, J. Byggmästar, G. Y. Wei, T. D. Swinburne, S. Papanikolaou, and M. J. Alava, “Nanoindentation of tungsten: From interatomic potentials to dislocation plasticity mechanisms,” Phys. Rev. Materials (2023), in press.
- Fan et al. (2021) Zheyong Fan, Zezhu Zeng, Cunzhi Zhang, Yanzhou Wang, Keke Song, Haikuan Dong, Yue Chen, and Tapio Ala-Nissila, “Neuroevolution machine learning potentials: Combining high accuracy and low cost in atomistic simulations and application to heat transport,” Phys. Rev. B 104, 104309 (2021).
- Fan et al. (2022) Zheyong Fan, Yanzhou Wang, Penghua Ying, Keke Song, Junjie Wang, Yong Wang, Zezhu Zeng, Ke Xu, Eric Lindgren, J. Magnus Rahm, Alexander J. Gabourie, Jiahui Liu, Haikuan Dong, Jianyang Wu, Yue Chen, Zheng Zhong, Jian Sun, Paul Erhart, Yanjing Su, and Tapio Ala-Nissila, “Gpumd: A package for constructing accurate machine-learned potentials and performing highly efficient atomistic simulations,” The Journal of Chemical Physics 157, 114801 (2022).
- Ziegler and Biersack (1985) James F. Ziegler and Jochen P. Biersack, “The stopping and range of ions in matter,” in Treatise on Heavy-Ion Science: Volume 6: Astrophysics, Chemistry, and Condensed Matter, edited by D. Allan Bromley (Springer US, Boston, MA, 1985) pp. 93–129.
- Behler and Parrinello (2007) Jörg Behler and Michele Parrinello, “Generalized Neural-Network Representation of High-Dimensional Potential-Energy Surfaces,” Phys. Rev. Lett. 98, 146401 (2007).
- Schaul et al. (2011) Tom Schaul, Tobias Glasmachers, and Jürgen Schmidhuber, “High Dimensions and Heavy Tails for Natural Evolution Strategies,” in Proceedings of the 13th Annual Conference on Genetic and Evolutionary Computation, GECCO ’11 (Association for Computing Machinery, New York, NY, USA, 2011) pp. 845–852.
- Tersoff (1989) J. Tersoff, “Modeling solid-state chemistry: Interatomic potentials for multicomponent systems,” Phys. Rev. B 39, 5566–5568 (1989).
- Fan et al. (2017) Zheyong Fan, Wei Chen, Ville Vierimaa, and Ari Harju, “Efficient molecular dynamics simulations with many-body potentials on graphics processing units,” Computer Physics Communications 218, 10 – 16 (2017).
- Martyna et al. (1992) Glenn J. Martyna, Michael L. Klein, and Mark Tuckerman, “Nosé–hoover chains: The canonical ensemble via continuous dynamics,” The Journal of Chemical Physics 97, 2635–2643 (1992).
- Stukowski (2009) Alexander Stukowski, “Visualization and analysis of atomistic simulation data with ovito–the open visualization tool,” Modelling and Simulation in Materials Science and Engineering 18, 015012 (2009).
- Nordlund and Averback (1997) K. Nordlund and R. Averback, “Point defect movement and annealing in collision cascades,” Physical Review B 56, 2421 – 2431 (1997).
- Stukowski et al. (2012) Alexander Stukowski, Vasily V Bulatov, and Athanasios Arsenlis, “Automated identification and indexing of dislocations in crystal interfaces,” Modelling and Simulation in Materials Science and Engineering 20, 085007 (2012).
- Byggmästar et al. (2020) J. Byggmästar, K. Nordlund, and F. Djurabekova, “Gaussian approximation potentials for body-centered-cubic transition metals,” Phys. Rev. Mater. 4, 093802 (2020).
- Dong et al. (2023) Haikuan Dong, Chenyang Cao, Penghua Ying, Zheyong Fan, Ping Qian, and Yanjing Su, “Anisotropic and high thermal conductivity in monolayer quasi-hexagonal fullerene: A comparative study against bulk phase fullerene,” International Journal of Heat and Mass Transfer 206, 123943 (2023).
- Marinica et al. (2013) M-C Marinica, Lisa Ventelon, M R Gilbert, L Proville, S L Dudarev, J Marian, G Bencteux, and F Willaime, “Interatomic potentials for modelling radiation defects and dislocations in tungsten,” Journal of Physics: Condensed Matter 25, 395502 (2013).
- Rumble (2019) J Rumble, “CRC handbook of chemistry and physics (100th ed.). Boca Rotan, FL,” (2019).
- Tyson and Miller (1977) W.R. Tyson and W.A. Miller, “Surface free energies of solid metals: Estimation from liquid surface tension measurements,” Surface Science 62, 267–276 (1977).
- Rasch et al. (1980) K-D. Rasch, R. W. Siegel, and H. Schultz, “Quenching and recovery investigations of vacancies in tungsten,” Philosophical Magazine A 41, 91–117 (1980).
- Nguyen-Manh et al. (2006) D. Nguyen-Manh, A. P. Horsfield, and S. L. Dudarev, “Self-interstitial atom defects in bcc transition metals: Group-specific trends,” Phys. Rev. B 73, 020101 (2006).
- Ma and Dudarev (2019a) Pui-Wai Ma and S. L. Dudarev, “Universality of point defect structure in body-centered cubic metals,” Phys. Rev. Materials 3, 013605 (2019a).
- Ma and Dudarev (2019b) Pui-Wai Ma and S. L. Dudarev, “Effect of stress on vacancy formation and migration in body-centered-cubic metals,” Phys. Rev. Materials 3, 063601 (2019b).
- Wang et al. (2011) L. G. Wang, A. van de Walle, and D. Alfè, “Melting temperature of tungsten from two ab initio approaches,” Phys. Rev. B 84, 092102 (2011).
- Fikar and Schäublin (2009) J. Fikar and R. Schäublin, “Molecular dynamics simulation of radiation damage in bcc tungsten,” Journal of Nuclear Materials 386-388, 97–101 (2009), fusion Reactor Materials.
- Liu et al. (2020) Li-Xia Liu, Xiao-Chun Li, Yangchun Chen, Wang-Yu Hu, Guang-Nan Luo, Fei Gao, and Huiqiu Deng, “Evaluation of tungsten interatomic potentials for radiation damage simulations,” Tungsten 2, 1–12 (2020).
- Larsen et al. (2017) Ask Hjorth Larsen, Jens Jørgen Mortensen, Jakob Blomqvist, Ivano E Castelli, Rune Christensen, Marcin Dułak, Jesper Friis, Michael N Groves, Bjørk Hammer, Cory Hargus, Eric D Hermes, Paul C Jennings, Peter Bjerre Jensen, James Kermode, John R Kitchin, Esben Leonhard Kolsbjerg, Joseph Kubal, Kristen Kaasbjerg, Steen Lysgaard, Jón Bergmann Maronsson, Tristan Maxson, Thomas Olsen, Lars Pastewka, Andrew Peterson, Carsten Rostgaard, Jakob Schiøtz, Ole Schütt, Mikkel Strange, Kristian S Thygesen, Tejs Vegge, Lasse Vilhelmsen, Michael Walter, Zhenhua Zeng, and Karsten W Jacobsen, “The atomic simulation environment—a python library for working with atoms,” Journal of Physics: Condensed Matter 29, 273002 (2017).
- Ackland and Thetford (1987) G. J. Ackland and R. Thetford, “An improved N-body semi-empirical model for body-centred cubic transition metals,” Philosophical Magazine A 56, 15–30 (1987).
- Mason et al. (2017) D R Mason, D Nguyen-Manh, and C S Becquart, “An empirical potential for simulating vacancy clusters in tungsten,” Journal of Physics: Condensed Matter 29, 505501 (2017).
- Becquart and Domain (2007) C.S. Becquart and C. Domain, “Ab initio calculations about intrinsic point defects and He in W,” Nuclear Instruments and Methods in Physics Research Section B: Beam Interactions with Materials and Atoms 255, 23–26 (2007).
- Alexander et al. (2016) R. Alexander, M.-C. Marinica, L. Proville, F. Willaime, K. Arakawa, M. R. Gilbert, and S. L. Dudarev, “Ab initio scaling laws for the formation energy of nanosized interstitial defect clusters in iron, tungsten, and vanadium,” Phys. Rev. B 94, 024103 (2016).
- Szlachta et al. (2014) Wojciech J. Szlachta, Albert P. Bartók, and Gábor Csányi, “Accuracy and transferability of gaussian approximation potential models for tungsten,” Phys. Rev. B 90, 104108 (2014).
- Larose and Brockhouse (1976) A. Larose and B. N. Brockhouse, “Lattice vibrations in tungsten at 22 °C studied by neutron scattering,” Canadian Journal of Physics 54, 1819–1823 (1976).
- Luo et al. (2004) Sheng-Nian Luo, Alejandro Strachan, and Damian C. Swift, “Nonequilibrium melting and crystallization of a model lennard-jones system,” The Journal of Chemical Physics 120, 11640–11649 (2004).
- Vítek et al. (1970) V. Vítek, R. C. Perrin, and D. K. Bowen, “The core structure of ? screw dislocations in b.c.c. crystals,” Philosophical Magazine 21, 1049–1073 (1970).
- Ventelon et al. (2013) Lisa Ventelon, F. Willaime, E. Clouet, and D. Rodney, “Ab initio investigation of the peierls potential of screw dislocations in bcc fe and w,” Acta Materialia 61, 3973–3985 (2013).
- Samolyuk et al. (2012) G D Samolyuk, Y N Osetsky, and R E Stoller, “The influence of transition metal solutes on the dislocation core structure and values of the peierls stress and barrier in tungsten,” Journal of Physics: Condensed Matter 25, 025403 (2012).
- Henkelman et al. (2000) Graeme Henkelman, Blas P. Uberuaga, and Hannes Jónsson, “A climbing image nudged elastic band method for finding saddle points and minimum energy paths,” The Journal of Chemical Physics 113, 9901–9904 (2000).
- Norgett et al. (1975) M. J. Norgett, M. T. Robinson, and I. M. Torrens, “A proposed method of calculating displacement dose rates,” Nuclear Engineering and Design 33, 50–54 (1975).
- Nordlund et al. (2018a) Kai Nordlund, Steven J. Zinkle, Andrea E. Sand, Fredric Granberg, Robert S. Averback, Roger E. Stoller, Tomoaki Suzudo, Lorenzo Malerba, Florian Banhart, William J. Weber, Francois Willaime, Sergei L. Dudarev, and David Simeone, “Primary radiation damage: A review of current understanding and models,” Journal of Nuclear Materials 512, 450–479 (2018a).
- Nordlund et al. (2018b) Kai Nordlund, Steven J. Zinkle, Andrea E. Sand, Fredric Granberg, Robert S. Averback, Roger Stoller, Tomoaki Suzudo, Lorenzo Malerba, Florian Banhart, William J. Weber, Francois Willaime, Sergei L. Dudarev, and David Simeone, “Improving atomic displacement and replacement calculations with physically realistic damage models,” Nature Communications 9, 1084 (2018b).
- Setyawan et al. (2015) Wahyu Setyawan, Giridhar Nandipati, Kenneth J. Roche, Howard L. Heinisch, Brian D. Wirth, and Richard J. Kurtz, “Displacement cascades and defects annealing in tungsten, Part I: Defect database from molecular dynamics simulations,” Journal of Nuclear Materials 462, 329–337 (2015).
- Antoshchenkova et al. (2015) E. Antoshchenkova, L. Luneville, D. Simeone, R.E. Stoller, and M. Hayoun, “Fragmentation of displacement cascades into subcascades: A molecular dynamics study,” Journal of Nuclear Materials 458, 168–175 (2015).
- Backer et al. (2016) A. De Backer, A. E. Sand, K. Nordlund, L. Luneville, D. Simeone, and S. L. Dudarev, “Subcascade formation and defect cluster size scaling in high-energy collision events in metals,” EPL (Europhysics Letters) 115, 26001 (2016).
- Sand et al. (2018) A. E. Sand, J. Byggmästar, A. Zitting, and K. Nordlund, “Defect structures and statistics in overlapping cascade damage in fusion-relevant bcc metals,” Journal of Nuclear Materials 511, 64–74 (2018).
- Ghaly and Averback (1994) Mai Ghaly and R. S. Averback, “Effect of viscous flow on ion damage near solid surfaces,” Phys. Rev. Lett. 72, 364–367 (1994).
- Aliaga et al. (2015) M.J. Aliaga, R. Schäublin, J.F. Löffler, and M.J. Caturla, “Surface-induced vacancy loops and damage dispersion in irradiated Fe thin films,” Acta Materialia 101, 22–30 (2015).
- Sand et al. (2016) A. E. Sand, M. J. Aliaga, M. J. Caturla, and K. Nordlund, “Surface effects and statistical laws of defects in primary radiation damage: Tungsten vs. iron,” EPL (Europhysics Letters) 115, 36001 (2016).