Compton-thick AGN in the NuSTAR Era X: Analysing seven local CT-AGN candidates
Abstract
Context. We present the broad-band X-ray spectral analysis (0.6-50 keV) of seven Compton-thick active galactic nuclei (CT-AGN; line-of-sight, l.o.s., column density cm-2) candidates selected from the Swift-BAT 100-month catalog, using archival NuSTAR data.
Aims. We aim at obtaining a complete census of the heavily obscured active galactic nuclei in the local Universe ().
Methods. This work is in continuation of the on-going research of the Clemson-INAF group to classify CT-AGN candidates at redshift , using physically-motivated torus models.
Results. Our results confirm that three out of seven targets are bona-fide CT-AGN. Adding our results to the previously analysed sources using NuSTAR data, we increase the population of bona-fide CT-AGN by , bringing the total number to 35 out of 414 AGN. We also performed a comparative study using MYTorus and borus02 on the spectra in our sample, finding that both physical models are strongly consistent in the parameter space of l.o.s. column density and photon index. Furthermore, the clumpiness of the torus clouds is also investigated by separately computing the l.o.s. and average torus column densities, in each of the seven sources. Adding our results to all the previous 48 CT-AGN candidates analysed by the Clemson-INAF research team having NuSTAR observations: we find that of the sources are likely to have a clumpy distribution of the obscuring material surrounding the accreting supermassive black hole.
Key Words.:
Galaxies: active; X-rays: galaxies; Galaxies: Seyfert1 Introduction
Diffuse X-ray emission from the central regions of accreting supermassive black holes in active galactic nuclei (AGN) is responsible for most of the cosmic X-ray background (CXB) radiation from a few keV to a few hundred keV (Comastri 2004; Gilli et al. 2007; Ueda et al. 2014). The contribution of unobscured AGN to the CXB is almost completely resolved into point-like sources at E keV (Worsley et al. 2005; Hickox & Markevitch 2006). CT-AGN (CT-AGN; line-of-sight, l.o.s., column density cm-2) significantly contribute ( Gilli et al. 2007; Ananna et al. 2019) to the CXB around its peak ( keV; Ajello et al. 2008). In the local universe (), the fraction of CT-AGN revealed by the X-ray observations is found to be (Vasudevan et al. 2013; Ricci et al. 2015; Torres-Albà et al. 2021). This reveals a big gap with the predictions of AGN population synthesis models, which postulates that the fraction of local CT-AGN should be of (Ueda et al. 2014; Ananna et al. 2019) to model the CXB properly.
For low-redshift AGN, the circum-nuclear dusty torus clouds are considered as the dominant medium of obscuration, i.e. obscuration from the inter-stellar medium (ISM) of the host galaxy is expected to be less significant (e.g. Gilli et al. 2022). Due to significant suppression of intrinsic X-rays below 10 keV by these obscuring Compton-Thick clouds, it is difficult to detect heavily obscured AGN at in the soft X-ray (E keV) band. Since heavily obscured AGN have a noticeable Compton hump at keV, hard X-ray (E keV) observatories allow for the detection and characterization of this kind of sources at . For example, the Swift Burst Alert Telescope (BAT) is used as it is less biased against CT-AGN sources, being sensitive in the 15-150 keV range. To determine the existing CT-AGN fraction, using a BAT volume-limited sample is among the most efficient ways to reduce the bias against the obscured sources. The importance of an obscuring medium surrounding the meso-scale ( pc) around AGN has been highlighted by several theoretical and numerical investigations (Gaspari et al. 2020, for a review). In a nutshell, in realistic turbulent environments, the host diffuse medium is expected to recurrently condense in a top-down multiphase condensation cascade of warm and cold clouds, which then rain onto the central AGN. Such chaotic cold accretion (CCA; Gaspari et al. 2013) is thus often responsible for a clumpy distribution at the meso-scale, as well as boosting the feeding rates at the micro scale ( pc). This multi-scale rain has been constrained and detected in a wide range of galaxies and AGN (e.g., Rose et al. 2019; Gaspari et al. 2019; Maccagni et al. 2021; Marchesi et al. 2022; McKinley et al. 2022; Temi et al. 2022).
The 100 month Swift-BAT catalog111http://bat.ifc.inaf.it/100m_bat_catalog/100m_bat_catalog_v0.0.htm (the updated 150 month BAT catalog is in preparation, K. Imam et al.) consists of 414 AGN at . From this AGN population, our Clemson-INAF research group222https://science.clemson.edu/ctagn/ have selected a sample of 55 CT-AGN candidates which have archival and Guest Observer observations with the Nuclear Spectroscopic Telescope Array (NuSTAR; Harrison et al. 2013). The target sources are observed by NuSTAR within the energy range of 3-79 keV, with high sensitivity, since NuSTAR is the first instrument to focus X-ray photons at E10 keV. For the soft X-ray coverage at E10 keV, we have used the available X-ray spectra from XMM-Newton, Chandra or Swift-XRT. We have carried out a systematic and comprehensive spectral analysis in keV band, on each of the 55 sources by using the uniform torus models- MYTorus and borus02 (See Marchesi et al. (2018); Zhao et al. (2021); Torres-Albà et al. (2021); Traina et al. (2021)). In this work, we are showing the results of the last seven sources from this sample. Here, we have independently computed line-of-sight (l.o.s.) column density (NH,l.o.s.) and average torus column density (NH,avr or NH,tor), to study the clumpiness of the torus clouds even within the uniform torus framework. The NH,l.o.s. is derived from the absorbed powerlaw coming directly from the ‘corona’. The NH,avr is instead obtained from the reflection component, which can be modelled to derive the average properties of the obscuring medium, such as the above mentioned average torus column density, the obscuring medium covering factor () and its inclination angle () with respect to the observer.
This paper is organised as follows: in Section 2, we discuss the selection methods and data analysis techniques. In Section 3, we present physically motivated torus models used in this work. Then, in Section 4, we show the results of each of the sources we have analysed. In Section 5, we analyse and discuss our and display the current census of CT-AGN at , combining our results with those obtained in previous works. Finally, in section 6, we present the conclusions and a brief summary of our work, along with a mention about the future projects. In Appendix A and B, we show the tables of best-fit parameters and X-ray spectral fitting plots, respectively. All reported error ranges are at the confidence level, if not mentioned otherwise. Through the rest of the work, we assume a flat CDM cosmology with H0 = 69.6 km s-1 Mpc-1, =0.29 and =0.71 (Bennett et al. 2014).
2 Sample Selection and Data Reduction
The seven sources (see Table 1 for details) of our sample are CT-AGN candidates selected from the volume limited sample of Swift-BAT 100 month catalog, in the local Universe (z 0.05, Mpc). These Seyfert galaxies were previously classified as CT-AGN in Ricci et al. (2015) using the BNtorus model (Brightman & Nandra 2011), where Swift-XRT was used for E keV (except for ESO138-G001, where XMM-Newton data were used) and Swift-BAT for E keV. Instead of BAT observations (15-150 keV), we are using NuSTAR in the 3-50 keV range, as it is a grazing incidence telescope with lower background and smaller field of view resulting excellent sensitivity to source detection with better photon statistics. At E keV, we preferred XMM-Newton or Chandra for better data quality, particularly in terms of source statistics compared to Swift-XRT. For NGC 2788A, only Swift-XRT data was available. The objects analysed in this work are CT-AGN candidates in the 100-month BAT sample for which no analysis with MYTorus and borus02 of the joint soft X-ray and NuSTAR spectra have been published yet.
| Source | AGNa𝑎aa𝑎a = is the cross calibration constant between NuSTAR observation of 2014 and XMM-Newton observation of 2016. | log fluxb𝑏bb𝑏b = is the cross calibration constant between NuSTAR observation of 2016 and XMM-Newton observation of 2016. | Redshift | Instrument | Sequence | Start Time | Exposure Time | Net Spectral Countsc𝑐cc𝑐cThe reported XMM-Newton net counts (background-subtracted total source counts) are those of the PN, MOS1 and MOS2 modules for a radius of 30″ in 0.3–10 keV, respectively. The reported NuSTAR net counts are those of the FPMA and FPMB modules for a radius of 30″ between 3–50 keV, respectively. The reported Chandra net counts are for the ACIS-I detector for a radius of 5″ in 0.5–7 keV. The reported Swift-XRT net counts are for a radius of 12″ in 0.5–10 keV. |
| Types | in erg cm-2 s-1 | (z) | ObsID | (UTC) | (ks) | |||
| XMM-Newton | 0762920601 | 2016-03-01 | 30.0 | 753, 225, 270 | ||||
| MCG-02-12-017 | Sy2 candidate | 8.84 | 0.03246 | NuSTAR | 60001160002 | 2014-11-28 | 34.0 | 441, 379 |
| NuSTAR | 60101015002 | 2016-03-02 | 19.5 | 349, 369 | ||||
| Chandra | 9438 | 2008-11-16 | 2.1 | 6 | ||||
| NGC 4180 | Sy2 | 17.58 | 0.00699 | NuSTAR | 60201038002 | 2016-07-14 | 23.4 | 429, 387 |
| NuSTAR | 60160480002 | 2020-07-14 | 31.6 | 212, 212 | ||||
| Swift-XRT | 2008—2020 | 17.8d𝑑dd𝑑dTotal exposure time of all the Swift-XRT observations | 34 | |||||
| NGC 2788A | Sy2 | 21.46 | 0.01335 | NuSTAR | 60469001002 | 2019-06-14 | 27.6 | 608, 617 |
| NuSTAR | 60160344002 | 2020-08-14 | 23.2 | 639, 530 | ||||
| XMM-Newton | 0821870301 | 2019-03-02 | 32.6 | 1129, 257, 422 | ||||
| NGC 1106 | Sy2 | 15.49 | 0.01447 | NuSTAR | 60469002002 | 2019-02-22 | 18.7 | 285, 332 |
| NuSTAR | 60160130002 | 2020-09-09 | 22.3 | 360, 354 | ||||
| Chandra | 14050 | 2012-06-07 | 5.1 | 25 | ||||
| ESO406-G004 | Sy2 | 12.38 | 0.02897 | NuSTAR | 60201039002 | 2016-05-25 | 36.3 | 390, 357 |
| NuSTAR | 60161799002 | 2020-06-26 | 23.7 | 120, 86 | ||||
| XMM-Newton | 0802450501 | 2017-11-18 | 44.8 | 5232, 1980, 1134 | ||||
| 2MASX | Sy2 | 10.55 | 0.04422 | Chandra | 21299 | 2018-12-17 | 3.7 | 532 |
| J20145928+2523010 | NuSTAR | 60201032002 | 2017-05-27 | 28.1 | 1252, 1137 | |||
| NuSTAR | 60160731002 | 2020-04-21 | 9.4 | 608, 624 | ||||
| XMM-Newton | 0690580101 | 2013-02-24 | 135.4 | 27058, 8878, 9016 | ||||
| ESO138-G001 | Sy2 | 19.46 | 0.00914 | NuSTAR | 60201040002 | 2016-05-22 | 45.7 | 3101, 2806 |
| NuSTAR | 60061274002 | 2020-04-01 | 53.2 | 3463, 3328 |
2.1 NuSTAR Data Reduction
We have used both focal plane modules FPMA, FPMB of NuSTAR for each source. The collected data have been processed by NuSTAR Data Analysis Software– NUSTARDAS version 2.0.0. The raw event files are calibrated by the nupipeline script, using the response file from the Calibration Database– CALDB version 20210202. The source and background spectra are extracted from a ( of the encircled energy fraction–EEF at 10 keV) and circular region respectively. Using nuproducts scripts, we have generated source and background spectra files, along with ARF and RMF. Finally, the NuSTAR spectra are grouped with at least 20 counts per bin, using grppha. For each source, we have used all the available NuSTAR observational data taken during different epochs, to a) check variability, and b) to improve the statistic of the spectra of these obscured sources between 3 and 50 keV.
2.2 XMM-Newton Data Reduction
In XMM-Newton, we have collected the data from the PN, MOS1 and MOS2 detectors. Using SAS version 19.0.0, we have processed the data using epproc and emproc for the PN and MOS filters, respectively. Finally we reduced and cleaned the flares using evselect. The source photons were obtained from a circular region, with EEF for EPIC-PN at 1.5 keV. Background spectra were extracted from a circle near the source. Each spectrum has been binned at 20 counts per bin, using grppha. We prefer to use XMM-Newton wherever it is available, because the effective area of XMM-Newton in 0.3-10 keV is times bigger than the Swift-XRT one and times bigger than the Chandra one.
2.3 Chandra Data Reduction
Although the effective area of Chandra is smaller than that of XMM-Newton, it is still 5 times larger than Swift-XRT. Also, it has better angular resolution, a lower background and the higher capability of resolving extended emission from non-nuclear sources. We use Chandra in two different scenarios: 1) when XMM-Newton data are unavailable, and 2) when XMM-Newton data are available, but to improve the photon statistics at E keV. CIAO version 4.13 is used to process and reduce the data. The source spectra are extracted using a -radius circular region, that include EEF.
3 Spectral Modeling
For X-ray spectral fitting on the objects in our sample, we have used XSPEC (Arnaud 1996) version 12.11.1 in HEASOFT. The metal abundance is fixed to Solar metallicity from Anders & Grevesse (1989), while the photoelectric cross sections for all absorption components are obtained by using the approach of Verner et al. (1996). The Galactic absorption column density is fixed for each source in our sample following Kalberla et al. (2005). We also used a thermal mekal(Mewe et al. 1985; Kaastra 1992; Liedahl et al. 1995) component to phenomenologically model the soft excess which is often observed in the spectra of obscured AGN.
We followed a standard approach in analysing the CT-AGN candidates, using self-consistent and up-to-date physically motivated uniform torus models, based on Monte Carlo simulations: MYTorus (Murphy & Yaqoob 2009; Yaqoob 2012) and borus02 (Baloković et al. 2018), which are specifically developed to characterise the X-ray spectra of heavily obscured AGN. In this Section, we describe how these two uniform torus models are used.
3.1 MyTorus
The obscuring material in MYTorus follows a toroidal or donut-like geometry, with circular cross-section. This model consists of three components: direct continuum (MYTZ), Compton-scattered continuum (MYTS) and fluorescent line component (MYTL). The MYTZ, also called zeroth-order component, models the attenuation of intrinsic X-ray radiation by the obscuring torus on the observer line-of-sight. The second component MYTS computes the Compton-scattered photons, which are responsible for the “Compton hump” near keV. Finally, MYTL models prominent fluorescent emission lines such as: Fe Kα and Fe Kβ around 6.4 keV and 7.06 keV, respectively. Following the techniques in Yaqoob (2012) and from the previous results of Marchesi et al. (2018, 2019b, 2019a); Zhao et al. (2019b, a); Traina et al. (2021); Torres-Albà et al. (2021); Silver et al. (2022); we have used only the decoupled-configuration of MYTorus, to estimate the clumpiness of the torus clouds. Here, we calculated the column density from direct continuum (NH,z) and scattered continuum (NH,S) separately, allowing flexibility on the parameter estimation even within a uniform cloud distribution framework.The ratio NH,z/NH,S is used to evaluate the clumpiness, depending on how far the ratio is from unity. In XSPEC, the configuration is as follows:
| (1) | |||
| (2) | |||
Here, equation 1 models the Edge-On view () and equation 2 the Face-On view () on the AGN. We have used both inclination angles to compute a comparative study on the scattering column density arising from the polar dust (Edge-On) vs back-reflection of the torus (Face-On). We have equated and fixed the relative normalizations from scattering and line components, , as we consider them to have been originated from the same regions where the direct power-law emerged. is a cross-calibration constant between the different instruments of telescopes (or a cross-normalization constant between different observations of same telescopes). We also included some additional components: to compute the scattering fraction from the direct powerlaw that does not interact (or elastically interact) with the torus, to phenomenologically model the soft excess, and to include any additional emission lines.
3.2 BORUS02
The obscuring medium in borus02 consists of a spherical geometry with bi-conical (polar) cut-out regions (Baloković et al. 2018). This model is composed of three components: a) borus02 itself which is a reprocessed component (including Compton-scattered fluorescent line component), b) to include l.o.s. absorption with Compton scattering through the obscuring clouds. With this component we multiply a to take into account the primary power-law continuum. C) Finally, another component is included separately with to include a scattered unabsorbed continuum. The significant difference of borus02 from MYTorus is that the torus covering factor () in this model is kept as a free parameter varying from (i.e. the torus opening angle is ranging between ), along with inclination angle which is kept free between . In our analysis using XSPEC, we have used the following model configuration:
| (3) | |||
Here is included to compute the soft excess below keV, and is introduced if there is any emission line signature not included in borus02.
4 Results of The X-ray Spectral Analysis
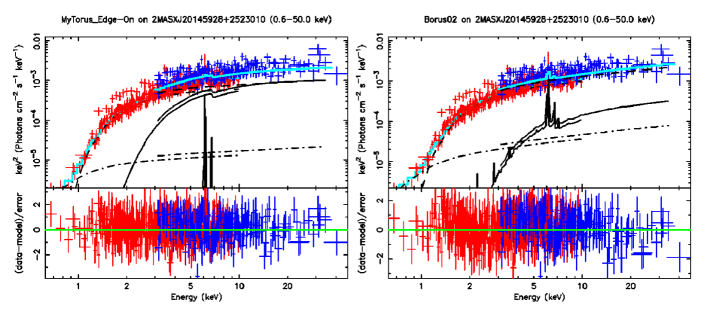
In this Section, we are showing the results of X-ray spectral fitting on each CT-AGN candidate from Ricci et al. (2015), using both physically motivated models mentioned in Section 3, with two versions of MYTorus and one borus02. In table 7, we display the summary of our analysis on the sample using borus02. The best fit parameters are reported in Table 2 and in A. The plots with X-ray spectral fitting are shown in figure 1 and B. The background contribution for all these sources is within 20%, unless mentioned otherwise. In the Tables, we also report the observed flux and intrinsic luminosity for each source.
| Model: | MyTorus | MyTorus | borus02 | |
|---|---|---|---|---|
| Edge-on | Face-on | |||
| /dof | 192/200 | 192/200 | 186/198 | |
| a𝑎aa𝑎a = is the cross calibration constant between NuSTAR observation of 2014 and XMM-Newton observation of 2016. | 0.88 | 0.89 | 0.89 | |
| b𝑏bb𝑏b = is the cross calibration constant between NuSTAR observation of 2016 and XMM-Newton observation of 2016. | 1.24 | 1.28 | 1.25 | |
| 1.94 | 1.98 | 2.11 | ||
| c𝑐cc𝑐cCovering Factor: Fraction of sky covered by the torus, as seen by the nucleus, given by = cos(). | — | — | 1.00 | |
| d𝑑dd𝑑dInclination Angle: The angle (in degrees) between symmetry axis of torus and line of sight angle | — | — | 49 | |
| NH,ze𝑒ee𝑒e“Line of sight” column density in cm-2. | 0.26 | 0.26 | 0.27 | |
| NH,Sf𝑓ff𝑓fAverage column density from scattering in cm-2. | 2.00 | 10.0 | 1.98 | |
| g𝑔gg𝑔gFraction of primary emission getting scattered, rather than absorbed by the obscuring material. 10-2 | 0.25 | 0.17 | 0.20 | |
| kThℎhhℎhTemperature in the thermal component mekal in keV. | 0.46 | 0.48 | 0.47 | |
| Fi𝑖ii𝑖iFlux between 2–10 keV in erg cm-2 s-1.2-10keV | 5.65 | 5.59 | 5.55 | |
| Fj𝑗jj𝑗jFlux between 10–40 keV in erg cm-2 s-1.10-40keV | 1.57 | 1.65 | 1.63 | |
| Lk𝑘kk𝑘kIntrinsic luminosity between 2–10 keV in erg s-1.2-10keV | 4.98 | 4.82 | 5.17 | |
| Ll𝑙ll𝑙lIntrinsic luminosity between 10–40 keV in erg s-1.10-40keV | 4.69 | 4.27 | 3.77 |
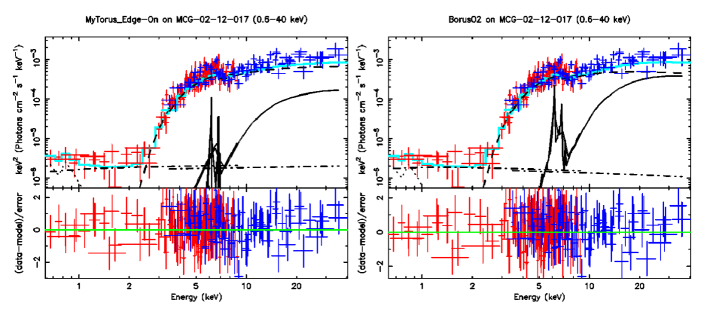
4.1 MCG-02-12-017
The source was marked as a CT-AGN candidate based on the data of Swift-XRT and Swift-BAT, with log NH,l.o.s.=24.25 in cm-2. For our analysis, we have used the quasi-simultaneous observations of XMM-Newton and NuSTAR, along with another NuSTAR observation which was taken about 15 months earlier with a longer exposure time ks. The cross-calibration ratio between XMM-Newton and NuSTAR detector for quasi-simultaneous observations is whereas for the previous NuSTAR observation, it is .
This source is very well fitted (see Table 2 and Figure 1) by all three models. All the physically motivated models are in agreement that the observed line-of-sight column density N cm-2 is Compton-Thin, in disagreement with the Ricci et al. (2015) result. Even when we only used the quasi-simultaneous observations, the line-of-sight (l.o.s.) column density is consistent as N cm-2. The average torus column density is instead found to be close or above the Compton thick threshold by MYTorus Edge-On and borus02 (N cm-2). The best-fit value of the photon index ranges between =1.94-2.11, considering all the models. The estimation of torus properties, such as covering factor and opening angle in borus02, is found to be difficult since the reflection component is sub-dominant.
4.2 NGC 4180
This target was classified as a CT-AGN candidate based on the data of Swift-XRT and Swift-BAT, log NH=24.15 cm-2. For our analysis, we included only the two NuSTAR observations, excluding the Chandra one due to its extremely poor photon statistic (Table 1). We used Portable Interactive Multi-Mission Simulator444https://cxc.harvard.edu/toolkit/pimms.jsp to convert NuSTAR spectrum for E2 keV, and found the predicted count rate (1.56 cts/s) for Chandra is within the error range of the observed one (1.42 cts/s). Moreover, the cross-normalization ratio between two separate observations (2016 and 2020) of the FPMA detector is , portraying noticeable variability of the source.
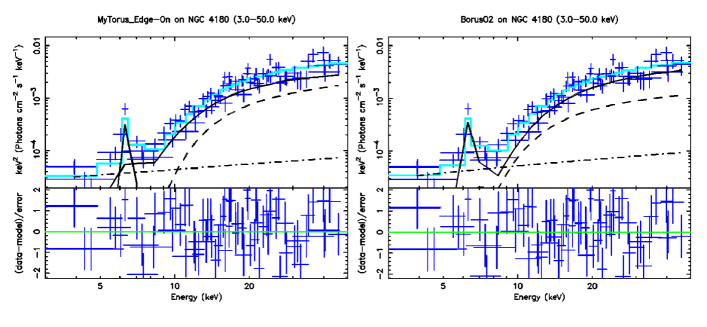
The source is very well fitted (see Table 8 and Figure 7) by all models, showing consistent results with each other, having Compton-Thick l.o.s. column density N cm-2 in agreement with the results obtained by Ricci et al. (2015). Even the average torus column density, which is more accurately constrained by MYTorus Edge-On and borus02 in this case, shows N cm-2, suggesting a moderate CT nature of the obscuring material as a whole. The best-fit values of photon index are , considering all the models. The hard index value shows that the models might not be able to properly estimate the direct power-law component contribution, in absence of soft X-ray data, and therefore cannot fully break the NH,l.o.s.- degeneracy. For similar reasons, the covering factor and inclination angle also show a large range of uncertainty. However, as it is shown in Figure 7, the overall spectral emission is dominated by the reflected component over the l.o.s. component. Therefore, from the available data, this source can be identified as a bona fide CT-AGN. However, soft X-ray observations would be required to put stronger constraints on the different obscuring material parameters.
4.3 NGC 2788A
This source was marked as a CT-AGN candidate based on the data of Swift-XRT and Swift-BAT, with log NH=25.55 in cm-2. For our analysis, we have two NuSTAR observations (taken in 2019 and 2020; total exposure ks). To cover the keV energy range, we make use of 12 Swift-XRT observations taken from 2008 to 2020555We obtained a joint spectrum using the tool available at www.swift.ac.uk/user_objects/. Due to very low spectral counts in soft X-ray ( counts; see Table 1), we have groupped the spectra from XRT with 1 count/bin and jointly fitted the Swift-XRT and NuSTAR spectra applying C-statistics over the entire range, in XSPEC. The cross-calibration variability between Swift-XRT and NuSTAR detectors fall within .
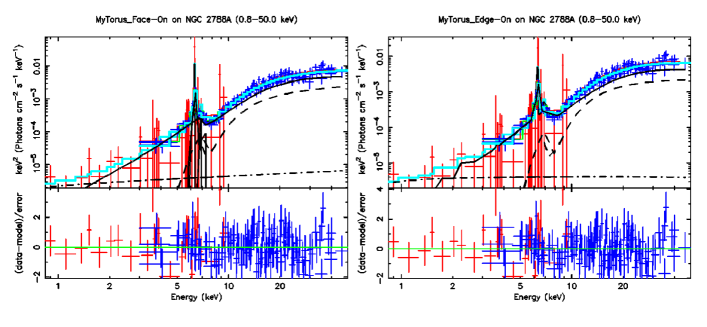
This source is very well fitted using the physically motivated models (see Table 9 and Figure 5). All models show consistent results between each other. The l.o.s. column density N cm-2 shows a CT column density, which validates the result of Ricci et al. (2015), although with a significantly lower value. In comparison with the average column density of the torus, the best-fit value of MYTorus Face-On and borus02 are close to each other with the range N cm-2, agreeing with the CT nature of the cloud distribution. On these two models, the best-fit value of is around 1.8-1.9. In addition, the borus02 model best fits the data with an intermediate covering factor, although with large uncertainties (0.49), and inclination angle in the range . In Figure 5, both models show considerable dominance of the reflection component over the l.o.s. component, suggesting even more the CT nature of the source. From the available NuSTAR data, this source is confirmed to be a bona fide CT-AGN. However, we need more observations below 10 keV for a better understanding of the properties of the obscuring material.
4.4 NGC 1106
This candidate was marked as a CT-AGN, based on the data of Swift-XRT and Swift-BAT, claiming it to have log NH=24.25 in cm-2. For our analysis, we have used XMM-Newton observation (taken in 03/2019; ks) and NuSTAR observations (taken in 02-2019 and 09-2020; total exposure ks). The cross-calibration ratio between XMM-Newton and NuSTAR detectors is .
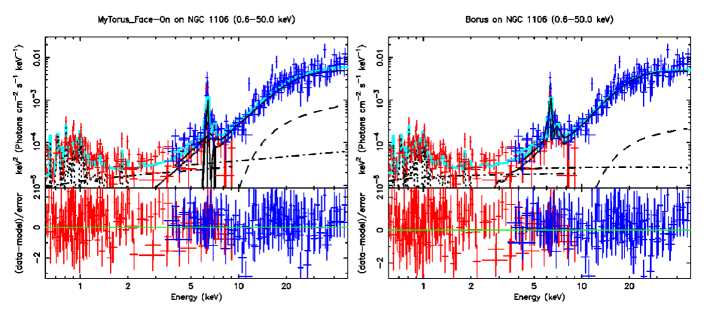
This source is very well fitted (see Table 10 and Figure 6). All three models show consistent results with each other. The l.o.s. column density N cm-2 shows a CT column density, which validates the result of Ricci et al. (2015). The torus average column density is N cm-2, in agreement with the CT nature of the torus. It is also interesting to note that borus02, which has better Reduced value () and a value of () closer to the AGN average (Marchesi et al. 2016), also estimates that the l.o.s. column density is in agreement with the average torus column density, thus suggesting that the obscuring material is likely uniform (see Table 10). Besides, the borus02 model gives a high covering factor (0.87), and moderate inclination angle between . Figure 6 shows how the reflection component is dominant over the direct power-law. From the above analysis, this source can be counted as a bona fide CT-AGN.
4.5 ESO406-G004
This target was marked as a CT-AGN candidate based on the data of Swift-XRT and Swift-BAT, claiming to have log NH=24.74 in cm-2. For our analysis, we have a Chandra observation with very low exposure ( ks) and only 25 spectral counts in soft X-rays. Furthermore, even though the two archival NuSTAR observations have a much higher exposure time (total ks), the source count statistic is significantly lower than that of the other sources ( net counts in 2016 and net counts in 2020; see Table 1). Due to such low spectral counts, we have used C-Statistics to fit the data after binning with 1 count/bin in Chandra, 10 counts/bin and 20 counts/bin on NuSTAR observations of 2020 and 2016 respectively. It is also noticeable that the observations were taken after large gaps ( years), and the cross-calibration ratio between ACIS (of Chandra) and FMPA (of NuSTAR) detectors show large variability . Furthermore, in the NuSTAR observation of 06/2020, the background-noise contribution on the spectral signal is , whereas the other data sets have contribution.
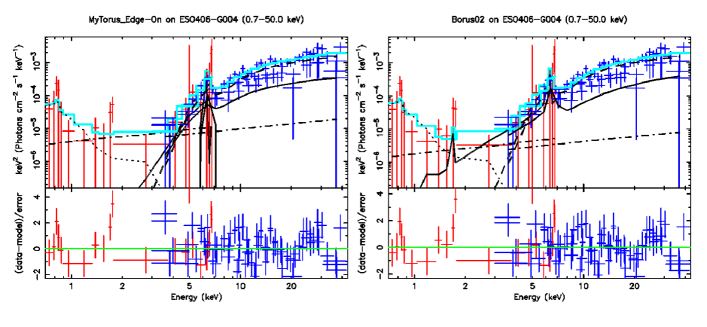
This source is very well fitted by all the models. All the three models show consistent results with each other. The l.o.s. column density for this source N cm-2 shows a mostly Compton-Thin column density, contrary to the result of Ricci et al. (2015). The decoupled MYTorus estimates N cm-2 and borus02 estimates with large error range N cm-2. Overall, it shows mostly Compton-Thin clouds with upper bounds crossing the CT threshold. Due to the lack of XMM-Newton data, it is likely that the low-statistic in the soft X-ray along with a fairly low statistic in the hard X-ray makes it difficult to properly disentangle the -NH,l.o.s. degeneracy. For similar reasons, we find that borus02 computes low covering factor (best-fit value ), and inclination angle () with high or unconstrained error range.
Furthermore, we have noticed a significant cross-calibration variability for the two NuSTAR observations (see Table 11). So, we also carried out a comparative study on the NuSTAR observations of this source taken in 05/2016 and 06/2020, to check flux and l.o.s. column density variability (following the approach of Marchesi et al. 2022; Torres-Albà et al. 2023; Pizzetti et al. 2022), in Table 3. The cross-calibration flux value is measured with respect to the Chandra observation of 06/2012. We fixed all the other parameters for these two NuSTAR observations to the best-fit values, and only kept the NH,l.o.s. and flux free to vary. We studied the variability by fixing one of the two parameters and letting the other free to vary, and finally compared the values by varying both of them. We find that the NH,l.o.s. increases from 2016 to 2020 and the flux is significantly increased () in the 2020 observation with respect to the 2016 one. However, from the reduced C-stat value, we that find the residual (data-model) worsens if we vary only the l.o.s. column density. Whereas fixing the NH,l.o.s. does not significantly change the fit in respect to varying both flux and column density for the different NuSTAR epochs. This indicates that the variability observed between the two NuSTAR observations can be explained within a pure-luminosity variability scenario, while the fit improvement is not significant when allowing the l.o.s. column density free to vary.
| Parameter | Fixing only | Fixing only | Varying both |
|---|---|---|---|
| NH,l.o.s. | |||
| a𝑎aa𝑎aCross-calibration value from FPMA detector, observed in 2020 | 0.77 | 0.84 | 0.82 |
| b𝑏bb𝑏bCross-calibration value from FPMA detector, observed in 2016 | 0.35 | ” | 0.25 |
| NH,l.o.s.,NuS1c𝑐cc𝑐cl.o.s. column density from FPMA detector in cm-2, , observed in 2020 | 0.82 | 0.88 | 0.86 |
| NH,l.o.s.,NuS2d𝑑dd𝑑dl.o.s. column density from FPMA detector in cm-2, observed in 2016 | ” | 1.88 | 0.58 |
| C-Stat/d.o.f. |
4.6 2MASX J20145928+2523010
This candidate was also classified as a CT-AGN, based on the data of Swift-XRT and Swift-BAT, claiming to have log NH=24.42 in cm-2. For our analysis, we have Chandra (taken in 12/2018) and XMM-Newton (taken in 11/2017) spectra with excellent photon statistics in the keV energy range (total spectral counts k). Even in hard X-rays, the two archival NuSTAR observations (taken in 05/2017 and 04/2020) have a high exposure time and net spectral counts (total k). It is worth noting, that for the joint NuSTAR and XMM-Newton observation taken in 2017, we measure a cross-calibration ratio . However, the flux of the 2018 Chandra and the 2020 NuSTAR observation is almost twice () that of the 2017 XMM-Newton observation. There is also a significant flux variability (factor of 0.77) between the NuSTAR and XMM-Newton observations taken only 6 months apart.
| Parameter | Fixing only | Fixing only | Varying both |
|---|---|---|---|
| NH,l.o.s. | |||
| a𝑎aa𝑎aCross-calibration value from FPMA detector, observed in 2017 | 1.23 | 1.53 | 1.25 |
| b𝑏bb𝑏bCross-calibration value from FPMA detector, observed in 2020 | 1.94 | ” | 1.94 |
| NH,l.o.s.,NuS1c𝑐cc𝑐cl.o.s. column density from FPMA detector in cm-2, observed in 2017 | * | 5.63 | 0.33 |
| NH,l.o.s.,NuS2d𝑑dd𝑑dl.o.s. column density from FPMA detector in 2020 is unconstrained, represented as * | ” | * | * |
This source is very well fitted by all the models (see Table 12). All the three models show consistent results with each other. The l.o.s. column density for this source is N cm-2, with a fairly low l.o.s. column density, just above the standard cm-2 threshold which is used to classify obscured AGN. Such a result is in strong disagreement with the one by of Ricci et al. (2015). Even the average column density of the torus is N cm-2, i.e. Compton-Thin. The decoupled MYTorus model shows a better estimate of the photon index compared to borus02, in terms of consistency with the expected value. Due to strong domination of the intrinsic powerlaw over the reflection component in the hard X-ray regime, borus02 fails to compute the covering factor and inclination angle properly. Noticing the absence of a reflection component, we also tested a simple phenomenological model using photoelectric absorption and powerlaw above 3 keV. We found with NH,l.o.s. and within the error range of borus02 results, considering a direct powerlaw along the line-of-sight. Thus, for the similarity of the results and to maintain consistency with the other sources, we have shown the results of physically motivated torus models only in Table 12.
Furthermore, also for this source, we find a cross-calibration variability for different NuSTAR observations. So, we show in Table 4 the comparative study on the NuSTAR observations of this source taken in 05/2017 and 04/2020, to check for flux and l.o.s. column density variability, similar to Table 3. The cross-calibration value is measured with respect to the XMM-Newton observation of 11/2017. Here also, we see the reduced value does not show any significant change when fixing only l.o.s. column density. But the increases and worsens the fit, when we fix the cross-calibration parameter only. Therefore, similarly to the previous case, the observed flux change for this source also can be explained by the intrinsic luminosity variability.
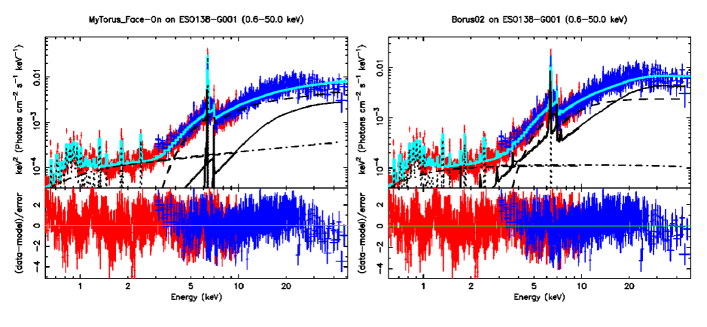
4.7 ESO138-G001
| Lines | MyTorus | MyTorus | borus02 | |
|---|---|---|---|---|
| Edge-on | Face-on | |||
| of Mg XI | 0.10 | 0.09 | 0.10 | |
| Intensity of Mg XI 10-5 | 0.66 | 0.66 | 0.67 | |
| of S XV | 0.10 | 0.10 | 0.09 | |
| Intensity of S XV 10-5 | 0.23 | 0.23 | 0.22 | |
| of Si XIII | 0.07 | 0.07 | 0.07 | |
| Intensity of Si XIII 10-5 | 0.28 | 0.28 | 0.28 |
(2) Equivalent Width () of the lines are shown in keV. Normalization of line components are shown in photons/cm-2 s-1.
This source was marked as a CT-AGN based on the data of XMM-Newton and Swift-BAT, claiming to have log NH=25.25 cm-2. For our analysis, we have used XMM-Newton and NuSTAR observations, both having excellent count statistic ( counts in the keV and counts in the keV band, respectively). The cross-calibration ratio of the NuSTAR detector on XMM-Newton for the source is .
The fit is worse (reduced ; see Table 13 and Figure 10) than those measured in the other sources. The models are better fitted in the soft X-rays when adding all the emission lines listed in Table 5, following the previous works of Piconcelli et al. (2011); De Cicco et al. (2015b). All three models are almost consistent with each other.
Studying all the models, the l.o.s. column density N cm-2 shows Compton-Thin clouds, differing from the results of Ricci et al. (2015). In comparison with the average column density of torus, the decoupled MYTorus (Face-On) and borus02 estimates N cm-2, supporting a CT average column density scenario. It is also noticeable that the borus02 gives comparatively better Reduced value () and . Besides, the borus02 model further computes moderate-to-high covering factor (), but low inclination angle with unconstrained error. We also had to include an extra Gaussian line profile for the fluorescent lines in the models, to account for a broader line profile than the one implemented within the torus models. The high NH,tor and high covering factor show that the reprocessed emission is significantly dominant with prominent Fe line. In borus02, adding the Gaussian line improves the fit significantly, with F-statistic value.
5 Discussions
This paper reports the analysis of 7 CT-AGN candidates: MCG-02-12-017, NGC 2788A, NGC 4180, 2MASX J20145928+2523010, ESO406 G-004, NGC 1106 and ESO138 G-001 from the 100-month Palermo BAT sample. For the first time, we analysed the NuSTAR spectra of these sources using MYTorus and borus02.
5.1 Clumpy Torus and Variability
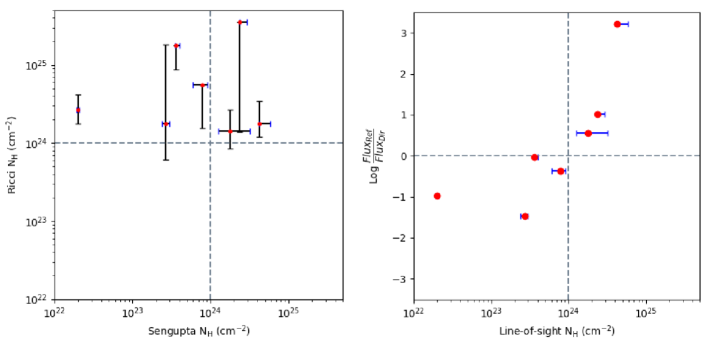
The l.o.s. column density and average torus column density of three out of seven sources in our sample (NGC 4180, NGC 2788A and NGC 1106) are found to be in agreement within their uncertainty ranges and above the Compton-Thick threshold ( cm-2). For ESO406 G-004, the column densities are compatible within their error range, but fall in the Compton-Thin range. The remaining three sources (MCG-02-12-017, 2MASX J20145928+2523010, ESO138 G-001) show incompatible column densities thus hinting at a clumpy nature of the obscuring medium. In the left panel of Figure 2, we compare the l.o.s. column density results of our sample using borus02 along with the results of Ricci et al. (2015). All the seven candidates from Ricci’s paper lie above the CT threshold with large uncertainties, whereas the use of NuSTAR data instead of Swift-BAT reduces the error bar significantly, displaying only three sources above CT line, leading to the confirmation of only three sources as CT. On the right side panel of Figure 2 shows a clear trend of the flux ratio at 2-10 keV as a function of NH,l.o.s.: the larger the l.o.s. column density, the stronger the flux of reflected continuum over direct continuum.
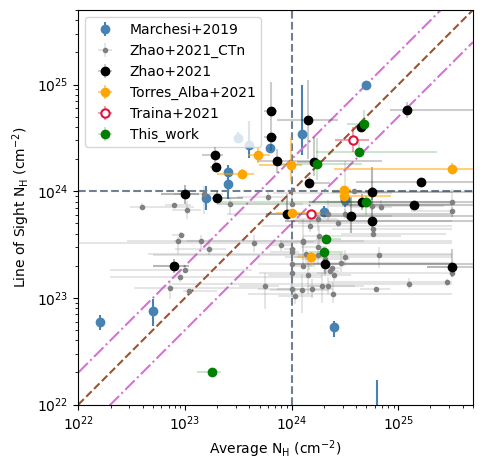
Furthermore, in Figure 3, we show the distribution of NH,l.o.s. and NH,avr of our sample AGN along with all the previous results of the CT-AGN candidates analysed by the Clemson-INAF group. The =1 line is shown as a brown-dashed line and, 1:2 and 2:1 ratios are shown as pink dot-dashed lines to classify the sources with comparatively homogeneous torus when they produce the column density ratio within . Only 12 sources ( of the sample) fall within this region. The remaining 43 sources ( of the sample) show instead a significant inhomogeneity, and considering error bar at 3 level, 34 sources () fall completely outside the given area. This is also a natural outcome of a CCA scenario, in which the multi-phase clouds continuously rain through the meso scale, thus recurrently obscuring the line-of-sight. The residual gas experiencing less inelastic collisions (and thus less angular momentum cancellation) tends to accumulate in a clumpy torus-like structure at such meso scale (Gaspari et al. 2017). Therefore, from all the previous results along with those presented in this work, we can conclude that most of these obscured active galaxies have a significantly clumpy torus ( of the total population). It is also important to note that the two column densities are strongly non-correlated. By statistically analysing the parameters for all the 55 sources, their Pearson correlation coefficient777 or for strong linear correlation or anti-correlation respectively, and for lack of correlation. yields (similar to what was obtained by Torres-Albà et al. (2021): -0.017). This states that a bona fide CT-AGN should not necessarily be made of CT-torus. As supported by hydrodynamical simulations (see for example Gaspari et al. 2020), a realistic torus is a composition of multi-phase and multi-scale clouds, whose integral (e.g., density) can substantially change along each line of sight. This result of non-correlation is consistent even with the results of Zhao et al. (2021), in which a sample of local Compton-Thin AGN were studied (along with CT-AGN) using high quality NuSTAR data along with soft X-ray data, finding that NH,tor shows similar value ( cm-2) for different NH,l.o.s.. In Figure 3, we increased our sample by including 74 sources from Zhao et al. (2021), marked as small grey circles. All of them have NH,l.o.s. ¿ 1022 cm-2. We found that the percentage of total population of homogeneous torus comes down to of the enlarged sample, including the Compton-Thin sources. By calculating the Pearson correlation coefficient between the column densities with this enlarged sample, we find similar non-correlation scenario (), as obtained before including these Compton-Thin AGN.
Through multi-epoch X-ray monitoring on these obscured sources, we can study the l.o.s. column density variability and confirm the in-homogeneity of the circum-nuclear cloud distribution. Some previous observations have reported extreme variability even like a “changing-look” nature from CT to Compton-Thin or vice-versa: NGC 7582 (Bianchi et al. 2009; Rivers et al. 2015), IC 751 (Ricci et al. 2016), NGC 1358 (Marchesi et al. 2022) and a few more. In our sample, 2MASX J20145928+2523010 shows strong variability over a three-year time-span. On the other hand, ESO138 G-001 shows almost no variability after 7 years of observational gap (Section 4.7). We would need follow-up observations with longer exposures on all these sources, for a better study on variability (i.e. clumpiness) over the time scales from weeks to years. Nevertheless, to properly assess the complex cloud distribution within the torus, a joint analysis of both X-ray and mid-IR (Berta et al. 2013; Buchner et al. 2019; Esparza-Arredondo et al. 2021) is required for an optimal study of each of these obscured sources along with the multi-epoch X-ray observations. We consider this for our future work.
5.2 Updated Census of local CT-AGN candidates
Out of the seven 100-month BAT candidate CT-AGN analysed in this work, three are confirmed to be bona fide CT-AGN. This brings the total number of CT-AGN at , to 35888https://science.clemson.edu/ctagn/ (Koss et al. 2016; Oda et al. 2017; Marchesi et al. 2018, 2019b, 2019a; Georgantopoulos & Akylas 2019; Tanimoto et al. 2019a; Kammoun et al. 2020; Zhao et al. 2021, 2020; Traina et al. 2021; Torres-Albà et al. 2021). In the left panel of Figure 3, we studied 55 CT-AGN candidates analysed by our Clemson-INAF group in the parameter space of observed NH,l.o.s. and computed NH,avr. 27 () of them have N cm-2.
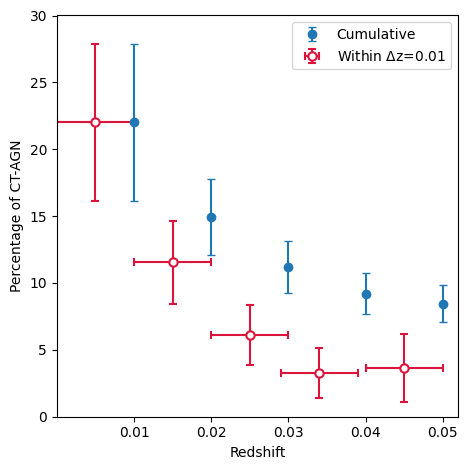
The total percentage of confirmed CT-AGN from Swift-BAT selection within local Universe (z) is (35/414), much lower than the CT-AGN fraction predicted by the population synthesis models. Our results also update the CT-AGN fraction within the distance to 999Standard error in binomial distribution. (11 CT-AGN out of 50 AGN; on Torres-Albà et al. 2021 the stats showed 10 CT-AGN out of 50). In figure 4, we show the fraction of CT-AGN from the total AGN population in the 100 month Swift-BAT catalog. The fraction drops by moving towards higher redshifts () because the CT-AGN sources become too faint to be detected by Swift-BAT (Koss et al. 2016).
5.3 Comparison with XClumpy results
Recently, Tanimoto et al. 2022 (T22 hereafter) published the results of the X-ray spectral analysis with the ‘XClumpy’ model (Tanimoto et al. 2019b) of the sources analysed in this work (as part of a larger sample of low–redshift, heavily obscured AGN). ‘XClumpy’ model considers the torus as clumpy and in-homogeneous, assuming power-law distribution along the radial axis and Gaussian distribution along the vertical axis of the torus. Below, we compare their results with those obtained using MYTorus decoupled and borus02 in this work.
| Models: | borus02 | MYTorus | (Decoupled Edge-On) | XClumpy | (from T22) | ||
| Sources | NH,torus | NH,S | NH,eq | ||||
| ( cm-2) | ( cm-2) | ( cm-2) | |||||
| MCG-02-12-017 | 2.11 | 1.98 | 1.94 | 2.00 | 1.54 | 9.59 | |
| NGC4180 | 1.55 | 1.74 | 1.66 | 1.97 | 1.61 | 4.10 | |
| NGC2788A | 1.95 | 4.26 | 1.56 | 1.25 | 1.67 | 2.37 | |
| NGC1106 | 1.92 | 4.83 | 1.40 | 1.46 | 1.67 | 8.17 | |
| ESO406-G004 | 1.42 | 4.97 | 1.48 | 0.49 | 1.10 | 0.64 | |
| 2MASX J20145928+2523010 | 1.52 | 0.18 | 1.79 | 0.12 | 1.42 | 1.01 | |
| ESO138-G001 | 1.98 | 10.35 | 1.53 | 1.47 | 1.45 | 5.34 |
-
•
MCG-02-12-017: For this source, T22 used the quasi-simultaneous observations of XMM-Newton and NuSTAR (ObsID: 60101015002). The l.o.s. column density and photon index, at confidence, gives N cm-2 and , respectively. The results are very consistent with our results (see Table 2). Similarly, the computed equatorial (average) column density mostly falls within the limits of error range (N cm-2) of our analysis, which is also in agreement with our prediction of clumpy nature of the torus. Overall, for this source, the XClumpy model is in agreement with the decoupled MYTorus and borus02 models.
-
•
NGC 4180: For this source, T22 used the observations of Chandra and NuSTAR (ObsID: 60201038002). The l.o.s. column density and photon index, at the confidence level, gives N cm-2 and , respectively. The results are consistent with the decoupled Face-ON MYTorus and borus02 results (see Table 8). Similarly, the computed equatorial (average) column density mostly falls within the range (N cm-2) computed in our analysis, which is also in agreement with our prediction of clumpy nature of the torus. Even though in our analysis, we only used NuSTAR data on this source, the results of MYTorus and borus02 model still comes in agreement with the XClumpy results.
-
•
NGC 2788A: For this source, T22 used the observations of Suzaku (obsID: 710007010) and NuSTAR (ObsID: 60469001002). The l.o.s. column density and photon index, at the confidence level, gives N cm-2 and , respectively. The results are very consistent with our results (see Table 9), even though we have used Swift-XRT instead of Suzaku at energies E keV. The computed equatorial (average) column density also falls within the range (N cm-2) of our analysis. Even for the covering factor measurement, XClumpy estimates , which significantly narrows the error range and falls within the borus02 computed range of . Also, while computing the inclination angle , the values can be considered in agreement within the uncertainties with borus02 fitting (). Overall, for this source, the results obtained using the XClumpy model can be regarded as consistent with those obtained using the decoupled MYTorus and borus02 ones.
Table 7: Best fit borus02 parameters for the sample Sources NH,l.o.s. NH,torus ( cm-2) ( cm-2) (Degees) MCG-02-12-017 2.11 0.27 1.98 1.00 49 NGC4180 1.55 1.78 1.74 0.88 49 NGC2788A 1.95 2.34 4.26 0.49 63 NGC1106 1.92 4.79 4.83 0.87 37 ESO406-G004 1.42 0.79 4.97 0.10 18 2MASX J20145928+2523010 1.52 0.02 0.18 1.00 18 ESO138-G001 1.98 0.47 10.35 0.80 18 -
•
NGC 1106: For this source, T22 used the observations of XMM-Newton and NuSTAR (ObsID: 60469002002). The l.o.s. column density and photon index, at confidence, shows N cm-2 and , respectively. These results are consistent with our results (see Table 10). On the other hand, the computed equatorial (average) column density falls in the upper limits of error range (N cm-2) compared to our analysis. In case of computing the inclination angle and covering factor , their results falls within the large confidence range of our analysis ( and ). It is noticeable that the error ranges are significantly reduced while using XClumpy. Nevertheless, for this source, the XClumpy model results are compatible with those obtained using the decoupled MYTorus and borus02 models.
-
•
ESO406 G-004: For this source, T22 used the observations of Swift-XRT (ObsID: 00081420001) and NuSTAR (ObsID: 60161799002). The l.o.s. column density and photon index, at the confidence level, shows N cm-2 and , respectively. As we used Chandra and both available NuSTAR data, our results show better constraints (see Table 11) on this source compared to their results. However, the computed equatorial (average) column density mostly falls within the range (N cm-2) of our analysis. The XClumpy model is compatible with decoupled MYTorus and borus02 results.
-
•
2MASX J20145928+2523010: For this source, T22 used the observations of XMM-Newton and NuSTAR (ObsID: 60201032002). The l.o.s. column density and photon index, at confidence, gives N cm-2 and , respectively. The results of NH,l.o.s. shows consistency with our results, but value is much lower than MYTorus and borus02 (see Table 12). However, the computed equatorial (average) column density falls within the range (N cm-2) of our analysis, which is also in agreement with our prediction of clumpy torus clouds. Overall, for this source, the XClumpy model is consistent with most of the results of decoupled MYTorus and borus02 models, except in .
-
•
ESO138 G-001: For this source, T22 used the observations of XMM-Newton and NuSTAR (ObsID: 60201040002). The l.o.s. column density and photon index, at confidence, gives N cm-2 and , respectively. The results are quite inconsistent with our results (see Table 13), specially compared to the photon index from borus02 which is . Similarly, the computed equatorial (average) column density has a value within the range (N cm-2) of our analysis. Their covering factor lies much below than the borus02 estimates of . For this source, the XClumpy model in T22 is inconsistent with the decoupled MYTorus and borus02 results. We note that, borus02 results in a better fit (reduced value ) compared to the fit exhibited in T22 paper (reduced =1.39).
Summarizing the above comparisons, we find XClumpy places stronger constraints on the different torus parameters, by having smaller uncertainties, with respect to borus02 and MYTorus. The only exception is ESO138 G-001, which is best-fitted using borus02 in our analysis, because T22 did not include the prominent emission lines that we mentioned in Table 5. We also noticed that XClumpy model shifts the best-fit value of photon index to harder values by compared to borus02 and by compared to the best-fit model of decoupled MYTorus, in our sample. In table 6, we have shown the values of photon index and average torus column density, computed using different torus models for each source. We note that T22 used only one NuSTAR observation for each source. In this work, we have used all the available observations from NuSTAR for these heavily obscured sources, to increase the photon statistic over 10keV and minimise the under/over-estimation of spectral parameters. Overall, for our sources, we do not find any significant discrepancies when using XClumpy in comparison with borus02 and decoupled MYTorus models.
6 Conclusions and Summary
In this work, we studied and classified 7 CT-AGN candidates from 100 month Swift-BAT catalog using archival NuSTAR observations. All sources have at least one NuSTAR observation covering the 3–50 keV energy range. In the 0.6–10 keV band, we have used XMM-Newton data for three targets, Chandra data for two targets and both XMM-Newton–Chandra in one target. NGC 2788A has only Swift-XRT data in the soft X-ray. We classified the sources on the basis of their best-fit value of l.o.s. hydrogen column density, i.e., if N cm-2 the candidates are marked as bona-fide CT-AGN. Otherwise they are identified as partially CT-AGN or Compton-Thin AGN depending on their column density. The summary of our results and conclusions are as follows:
-
1.
From the 7 CT-AGN candidates, 3 are confirmed as bona fide CT-AGN with moderate to high covering factors, using NuSTAR data above 10 keV. Three of them shows l.o.s. column density Compton-Thin, but torus column density above CT-threshold. Only 2MASX J20145928+2523010 shows Compton-Thin values in both the column densities. The summary of the results of all these sources with borus02 model is displayed in Table 7.
-
2.
This present work updates the total number of NuSTAR-confirmed CT-AGN to 35, for , which is of the total AGN population in 100 month BAT catalog. This value is still quite below the predicted value () of the CXB population synthesis models, which suggests that a significant fraction of heavily obscured AGN are missed even by a hard X-ray telescope such as Swift-BAT.
-
3.
Out of 55 CT-AGN candidates analysed by our Clemson-INAF research group, adding the results of this work brings the population of bona fide CT-AGN to 27 (). Among these, only 14 () candidates show both NH,l.o.s. and NH,avr above the CT-threshold.
-
4.
We find no correlation between these two column densities (NH,l.o.s. and NH,avr) from our sample. Our results state that identifying a bona fide CT-AGN i.e. obscured AGN with N 1024 cm-2 would not lead to the conclusion that the torus is also CT. Similarly, Compton-Thin NH,l.o.s. should not mean that the torus is also Compton-Thin.
-
5.
Most of these obscured galaxies have significantly clumpy or in-homogeneous distribution of clouds. Multi-epoch monitoring of these sources using telescopes like XMM-Newton, Chandra and NuSTAR will help us to study their intrinsic flux and l.o.s. column density variability. This will give a better understanding of cloud movements in the obscuring medium and X-ray emission from the central engine.
-
6.
MYTorus and borus02 results are consistent with each other, in estimating the column densities and other parameters of the sources. In most of the cases, borus02 shows better fitting from a statistical point of view, along with the estimation of torus opening angle and inclination angle of the obscured AGN which are fixed parameters in MYTorus.
-
7.
We find our results on the 7 CT-AGN candidates using the uniform torus models are compatible with the results of the non-uniform torus model XClumpy in Tanimoto et al. (2022). However we also notice the trend that XClumpy shifts the photon index to harder values in comparison to the uniform torus models we have used. As proof, we have displayed the and torus column density values of T22 with respect to our results in table 6.
For future works, a joint analysis of the X-ray properties and the reprocessed emission at mid-IR will be carried out for a better understanding of the torus structure and obscuration properties (Sengupta et al. in prep.). We will also use multi-epoch observations on some of these sources, in the framework of theoretical models like CCA (Gaspari et al. 2013), warped-accretion disk (Buchner et al. 2021) and others, in the future works (Torres-Albà et al. 2023, Sengupta et al. in prep., Pizzetti et al. in prep).
7 Acknowledgements
We thank the referee for the useful suggestions that helped us in improving the paper. This research has made use of the NuSTAR Data Analysis Software (NuSTARDAS) jointly developed by the ASI Space Science Data Center (SSDC, Italy) and the California Institute of Technology (Caltech, USA). DS acknowledges the PhD and “MARCO POLO UNIVERSITY PROGRAM” funding from the Dipartimento di Fisica e Astronomia (DIFA), Università di Bologna. DS and SM acknowledge the funding from INAF “Progetti di Ricerca di Rilevante Interesse Nazionale” (PRIN), Bando 2019 (project: “Piercing through the clouds: a multiwavelength study of obscured accretion in nearby supermassive black holes”). MG acknowledges partial support by HST GO-15890.020/023-A and the BlackHoleWeather program.
References
- Ajello et al. (2008) Ajello, Greiner, J., Sato, G., et al. 2008, The Astrophysical Journal, 689, 666
- Ananna et al. (2019) Ananna, T. T., Treister, E., Urry, C. M., et al. 2019, ApJ, 871, 240
- Anders & Grevesse (1989) Anders, E. & Grevesse, N. 1989, Geochim. Cosmochim. Acta., 53, 197
- Arnaud (1996) Arnaud, K. A. 1996, in Astronomical Society of the Pacific Conference Series, Vol. 101, Astronomical Data Analysis Software and Systems V, ed. G. H. Jacoby & J. Barnes, 17
- Baloković et al. (2018) Baloković, M., Brightman, M., Harrison, F. A., et al. 2018, The Astrophysical Journal, 854, 42
- Bennett et al. (2014) Bennett, C. L., Larson, D., Weiland, J. L., & Hinshaw, G. 2014, ApJ, 794, 135
- Berta et al. (2013) Berta, S., Lutz, D., Santini, P., et al. 2013, A&A, 551, A100
- Bianchi et al. (2009) Bianchi, S., Piconcelli, E., Chiaberge, M., et al. 2009, ApJ, 695, 781
- Brightman & Nandra (2011) Brightman & Nandra. 2011, Monthly Notices of the Royal Astronomical Society, 413, 1206
- Buchner et al. (2021) Buchner, J., Brightman, M., Baloković, M., et al. 2021, A&A, 651, A58
- Buchner et al. (2019) Buchner, J., Brightman, M., Nandra, K., Nikutta, R., & Bauer, F. E. 2019, A&A, 629, A16
- Comastri (2004) Comastri. 2004, in Supermassive Black Holes in the Distant Universe (Springer), 245–272
- De Cicco et al. (2015a) De Cicco, M., Marinucci, A., Bianchi, S., et al. 2015a, MNRAS, 453, 2155
- De Cicco et al. (2015b) De Cicco, M., Marinucci, A., Bianchi, S., et al. 2015b, MNRAS, 453, 2155
- Esparza-Arredondo et al. (2021) Esparza-Arredondo, D., Gonzalez-Martín, O., Dultzin, D., et al. 2021, A&A, 651, A91
- Gaspari et al. (2019) Gaspari, M., Eckert, D., Ettori, S., et al. 2019, ApJ, 884, 169
- Gaspari et al. (2013) Gaspari, M., Ruszkowski, M., & Oh, S. P. 2013, MNRAS, 432, 3401
- Gaspari et al. (2017) Gaspari, M., Temi, P., & Brighenti, F. 2017, MNRAS, 466, 677
- Gaspari et al. (2020) Gaspari, M., Tombesi, F., & Cappi, M. 2020, Nature Astronomy, 4, 10
- Georgantopoulos & Akylas (2019) Georgantopoulos, I. & Akylas, A. 2019, A&A, 621, A28
- Gilli et al. (2007) Gilli et al. 2007, Astronomy & Astrophysics, 463, 79
- Gilli et al. (2022) Gilli, R., Norman, C., Calura, F., et al. 2022, A&A, 666, A17
- Harrison et al. (2013) Harrison, F. A., Craig, W. W., Christensen, F. E., et al. 2013, ApJ, 770, 103
- Hickox & Markevitch (2006) Hickox, R. C. & Markevitch, M. 2006, ApJ, 645, 95
- Kaastra (1992) Kaastra, J. 1992, Internal SRON-Leiden Report
- Kalberla et al. (2005) Kalberla, P. M. W., Burton, W. B., Hartmann, D., et al. 2005, A&A, 440, 775
- Kammoun et al. (2020) Kammoun, E. S., Miller, J. M., Koss, M., et al. 2020, ApJ, 901, 161
- Koss et al. (2016) Koss, M. J., Assef, R., Baloković, M., et al. 2016, The Astrophysical Journal, 825, 85
- Liedahl et al. (1995) Liedahl, D. A., Osterheld, A. L., & Goldstein, W. H. 1995, ApJ, 438, L115
- Maccagni et al. (2021) Maccagni, F. M., Serra, P., Gaspari, M., et al. 2021, A&A, 656, A45
- Marchesi et al. (2018) Marchesi et al. 2018, The Astrophysical Journal, 854, 49
- Marchesi et al. (2019a) Marchesi, S., Ajello, M., Zhao, X., et al. 2019a, ApJ, 882, 162
- Marchesi et al. (2019b) Marchesi, S., Ajello, M., Zhao, X., et al. 2019b, ApJ, 872, 8
- Marchesi et al. (2016) Marchesi, S., Lanzuisi, G., Civano, F., et al. 2016, The Astrophysical Journal, 830, 100
- Marchesi et al. (2022) Marchesi, S., Zhao, X., Torres-Albà, N., et al. 2022, ApJ, 935, 114
- McKinley et al. (2022) McKinley, B., Tingay, S. J., Gaspari, M., et al. 2022, Nature Astronomy, 6, 109
- Mewe et al. (1985) Mewe, R., Gronenschild, E., & Van Den Oord, G. 1985, Astronomy and Astrophysics supplement series, 62, 197
- Murphy & Yaqoob (2009) Murphy & Yaqoob. 2009, Monthly Notices of the Royal Astronomical Society, 397, 1549
- Oda et al. (2017) Oda, S., Tanimoto, A., Ueda, Y., et al. 2017, ApJ, 835, 179
- Oh et al. (2018) Oh, K., Koss, M., Markwardt, C. B., et al. 2018, ApJS, 235, 4
- Piconcelli et al. (2011) Piconcelli, E., Bianchi, S., Vignali, C., Jiménez-Bailón, E., & Fiore, F. 2011, A&A, 534, A126
- Piconcelli et al. (2011) Piconcelli, E., Bianchi, S., Vignali, C., Jiménez-Bailón, E., & Fiore, F. 2011, Astronomy & Astrophysics, 534, A126
- Pizzetti et al. (2022) Pizzetti, A., Torres-Albà, N., Marchesi, S., et al. 2022, ApJ, 936, 149
- Ricci et al. (2016) Ricci, C., Bauer, F. E., Treister, E., et al. 2016, ApJ, 819, 4
- Ricci et al. (2015) Ricci, C., Ueda, Y., Koss, M. J., et al. 2015, ApJ, 815, L13
- Ricci et al. (2015) Ricci, C., Ueda, Y., Koss, M. J., et al. 2015, The Astrophysical Journal Letters, 815, L13
- Rivers et al. (2015) Rivers, E., Baloković, M., Arévalo, P., et al. 2015, ApJ, 815, 55
- Rose et al. (2019) Rose, T., Edge, A. C., Combes, F., et al. 2019, MNRAS, 489, 349
- Silver et al. (2022) Silver, R., Torres-Albà, N., Zhao, X., et al. 2022, ApJ, 940, 148
- Tanimoto et al. (2019a) Tanimoto, A., Ueda, Y., Odaka, H., et al. 2019a, ApJ, 877, 95
- Tanimoto et al. (2019b) Tanimoto, A., Ueda, Y., Odaka, H., et al. 2019b, ApJ, 877, 95
- Tanimoto et al. (2022) Tanimoto, A., Ueda, Y., Odaka, H., Yamada, S., & Ricci, C. 2022, ApJS, 260, 30
- Temi et al. (2022) Temi, P., Gaspari, M., Brighenti, F., et al. 2022, ApJ, 928, 150
- Torres-Albà et al. (2021) Torres-Albà, N., Marchesi, S., Zhao, X., et al. 2021, ApJ, 922, 252
- Torres-Albà et al. (2023) Torres-Albà, N., Marchesi, S., Zhao, X., et al. 2023, arXiv e-prints, arXiv:2301.07138
- Traina et al. (2021) Traina, A., Marchesi, S., Vignali, C., et al. 2021, ApJ, 922, 159
- Ueda et al. (2014) Ueda, Y., Akiyama, M., Hasinger, G., Miyaji, T., & Watson, M. G. 2014, The Astrophysical Journal, 786, 104
- Vasudevan et al. (2013) Vasudevan, R. V., Mushotzky, R. F., & Gandhi, P. 2013, ApJ, 770, L37
- Verner et al. (1996) Verner, D. A., Ferland, G. J., Korista, K. T., & Yakovlev, D. G. 1996, ApJ, 465, 487
- Worsley et al. (2005) Worsley, M., Fabian, A., Bauer, F., et al. 2005, Monthly Notices of the Royal Astronomical Society, 357, 1281
- Yaqoob (2012) Yaqoob. 2012, Monthly Notices of the Royal Astronomical Society, 423, 3360
- Zhao et al. (2019a) Zhao, X., Marchesi, S., & Ajello, M. 2019a, ApJ, 871, 182
- Zhao et al. (2020) Zhao, X., Marchesi, S., Ajello, M., Baloković, M., & Fischer, T. 2020, ApJ, 894, 71
- Zhao et al. (2021) Zhao, X., Marchesi, S., Ajello, M., et al. 2021, A&A, 650, A57
- Zhao et al. (2019b) Zhao, X., Marchesi, S., Ajello, M., et al. 2019b, ApJ, 870, 60
Appendix A Tables of X-Ray Spectra
| Model | MyTorus | MyTorus | borus02 | |
|---|---|---|---|---|
| Edge-on | Face-on | |||
| /dof | 76/64 | 84/64 | 76/62 | |
| a𝑎aa𝑎a is the ratio of cross-normalization constant between two NuSTAR observations through their FPMA detectors. | 1.47 | 1.48 | 1.47 | |
| 1.66 | 1.40 | 1.55 | ||
| — | — | 0.88 | ||
| — | — | 49 | ||
| NH,z | 6.10 | 1.49 | 1.78 | |
| NH,S | 1.97 | 3.98 | 1.74 | |
| 10-2 | 0.40 | 0.55 | 2.27 | |
| F2-10keV | 1.34 | 1.30 | 1.33 | |
| F10-50keV | 4.49 | 4.73 | 4.54 | |
| L2-10keVb𝑏bb𝑏bIntrinsic luminosity between 2–10 keV in erg s-1. | 11.01 | 2.72 | 3.21 | |
| L10-50keVc𝑐cc𝑐cIntrinsic luminosity between 10–50 keV in erg s-1. | 19.05 | 7.14 | 6.63 |
| Model | MyTorus | MyTorus | borus02 | |
|---|---|---|---|---|
| Edge-on | Face-on | |||
| C-Stat/dof | 136/153 | 116/153 | 116/151 | |
| a𝑎aa𝑎a = is the cross calibration constant between NuSTAR observation of 2019 and Swift-XRT. | 1.12 | 0.93 | 0.94 | |
| b𝑏bb𝑏b = is the cross calibration constant between NuSTAR observation of 2020 and Swift-XRT. | 1.36 | 1.13 | 1.14 | |
| 1.56 | 1.75 | 1.95 | ||
| — | — | 0.49 | ||
| — | — | 63 | ||
| NH,z | 3.95 | 1.95 | 2.34 | |
| NH,S | 1.25 | 3.74 | 4.26 | |
| 10-2 | 0.23 | 0.07 | 0.03 | |
| F2-10keV | 4.36 | 4.56 | 4.50 | |
| Fc𝑐cc𝑐cFlux between 10–50 keV in erg cm-2 s-1.10-50keV | 1.15 | 1.12 | 1.11 | |
| L2-10keV | 9.48 | 5.33 | 11.29 | |
| L10-50keV | 19.10 | 8.04 | 12.33 |
| Model | MyTorus | MyTorus | borus02 | |
|---|---|---|---|---|
| Edge-on | Face-on | |||
| /dof | 357/295 | 310/295 | 304/293 | |
| a𝑎aa𝑎a = is the cross calibration constant between NuSTAR observation of 2020 and XMM-Newton observation of 2019. | 0.75 | 1.05 | 1.07 | |
| b𝑏bb𝑏b = is the cross calibration constant between NuSTAR observation of 2020 and XMM-Newton observation of 2019. | 0.92 | 1.28 | 1.29 | |
| 1.40 | 1.68 | 1.92 | ||
| — | — | 0.87 | ||
| — | — | 37 | ||
| NH,z | 4.00 | 3.43 | 4.79 | |
| NH,S | 1.46 | 7.98 | 4.83 | |
| 10-2 | 0.71 | 0.72 | 0.46 | |
| kT | 0.97 | 1.01 | 0.99 | |
| kT | 0.38 | 0.42 | 0.42 | |
| F2-10keV | 2.73 | 2.63 | 2.60 | |
| F10-50keV | 7.62 | 7.83 | 7.98 | |
| L2-10keV | 6.87 | 3.68 | 5.02 | |
| L10-50keV | 18.04 | 6.16 | 5.50 |
| Model | MyTorus | MyTorus | borus02 | |
|---|---|---|---|---|
| Edge-on | Face-on | |||
| C-Stat/dof | 84/86 | 84/86 | 83/84 | |
| a𝑎aa𝑎a141414missing | 0.73 | 0.85 | 0.68 | |
| b𝑏bb𝑏b = is the cross calibration constant between NuSTAR observation of 2020 and Chandra observation of 2012. | 0.35 | 0.41 | 0.34 | |
| 1.48 | 1.40 | 1.42 | ||
| — | — | 0.10 | ||
| — | — | 18 | ||
| NH,z | 0.85 | 0.73 | 0.79 | |
| NH,S | 0.49 | 1.30 | 4.97 | |
| 10-2 | 0.65 | 0.81 | 0.37 | |
| kT | 0.51 | 0.52 | 0.52 | |
| F2-10keV | 3.41 | 3.19 | 3.56 | |
| F10-50keV | 3.50 | 3.61 | 3.56 | |
| L2-10keV | 6.77 | 3.97 | 6.47 | |
| L10-50keV | 15.58 | 10.27 | 16.55 |
= is the cross calibration constant between NuSTAR observation of 2016 and Chandra observation of 2012.
| Model | MyTorus | MyTorus | borus02 | |
|---|---|---|---|---|
| Edge-on | Face-on | |||
| /dof | 545/581 | 545/581 | 564/580 | |
| a𝑎aa𝑎a = is the cross calibration constant between Chandra observation of 2018 and XMM-Newton observation of 2017. | 1.98 | 1.98 | 1.98 | |
| b𝑏bb𝑏b = is the cross calibration constant between NuSTAR observation of 2017 and XMM-Newton observation of 2017. | 1.32 | 1.32 | 1.31 | |
| c𝑐cc𝑐c = is the cross calibration constant between NuSTAR observation of 2020 and XMM-Newton observation of 2017. | 1.95 | 1.95 | 1.94 | |
| 1.79 | 1.77 | 1.52 | ||
| — | — | 1.00 | ||
| — | — | 18 | ||
| NH,zd𝑑dd𝑑d“Line of sight” column density in cm-2. | 2.02 | 2.04 | 2.18 | |
| NH,Se𝑒ee𝑒eAverage column density from scattering in cm-2. | 11.93 | 20.15 | 17.63 | |
| 10-2 | 0.68 | 0.42 | 1.06 | |
| Ff𝑓ff𝑓fFlux between 2–10 keV in erg cm-2 s-1.2-10keV | 1.83 | 1.83 | 1.81 | |
| F10-50keV | 5.04 | 5.07 | 6.81 | |
| L2-10keV | 6.27 | 5.95 | 8.20 | |
| L10-50keV | 8.76 | 8.52 | 17.57 |
| Model | MyTorus | MyTorus | borus02 | |
|---|---|---|---|---|
| Edge-on | Face-on | |||
| /dof | 2636/1818 | 2566/1818 | 2419/1816 | |
| a𝑎aa𝑎a = is the cross calibration constant between NuSTAR observation of 2016 and XMM-Newton observation of 2013. | 1.15 | 1.15 | 1.16 | |
| b𝑏bb𝑏b = is the cross calibration constant between NuSTAR observation of 2020 and XMM-Newton observation of 2013. | 1.07 | 1.08 | 1.09 | |
| 1.53 | 1.66 | 1.98 | ||
| — | — | 0.80 | ||
| — | — | 18 | ||
| NH,z | 0.33 | 0.34 | 0.47 | |
| NH,S | 1.47 | 3.00 | 10.35 | |
| Fe c𝑐cc𝑐cEnergy of the Iron line in keV. | 6.42 | 6.42 | 6.44 | |
| Fe normd𝑑dd𝑑dNormalization of line component depicting total photons in cm-2 s-1.10-5 | 2.28 | 1.91 | 1.04 | |
| 10-2 | 7.46 | 8.14 | 3.22 | |
| kT | 0.68 | 0.68 | 0.74 | |
| Fe𝑒ee𝑒eFlux between 2–10 keV in erg cm-2 s-1.2-10keV | 2.25 | 2.24 | 2.24 | |
| Ff𝑓ff𝑓fFlux between 10–50 keV in erg cm-2 s-1.10-50keV | 1.42 | 1.44 | 1.43 | |
| L2-10keVg𝑔gg𝑔gIntrinsic luminosity between 2–10 keV in erg s-1. | 11.59 | 12.11 | 3.61 | |
| L10-50keVhℎhhℎhIntrinsic luminosity between 2–10 keV in erg s-1. | 24.51 | 20.90 | 3.34 |
Appendix B Figures of X-Ray Spectra