TOI-2498 b: A hot bloated super-Neptune within the Neptune desert
Abstract
We present the discovery and confirmation of a transiting hot, bloated Super-Neptune using photometry from TESS and LCOGT and radial velocity measurements from HARPS. The host star TOI-2498 is a V = 11.2, G-type (Teff = 5905 ± 12 K) solar-like star with a mass of 1.12 ± 0.02 M and a radius of 1.26 ± 0.04 R. The planet, TOI-2498 b, orbits the star with a period of 3.7 days, has a radius of 6.1 ± 0.3 R, and a mass of 35 ± 4 M. This results in a density of 0.86 ± 0.25 g cm-3. TOI-2498 b resides on the edge of the Neptune desert; a region of mass-period parameter space in which there appears to be a dearth of planets. Therefore TOI-2498 b is an interesting case to study to further understand the origins and boundaries of the Neptune desert. Through modelling the evaporation history, we determine that over its 3.6 Gyr lifespan, TOI-2498 b has likely reduced from a Saturn sized planet to its current radius through photoevaporation. Moreover, TOI-2498 b is a potential candidate for future atmospheric studies searching for species like water or sodium in the optical using high-resolution, and for carbon based molecules in the infra-red using JWST.
keywords:
planets and satellites: detection - stars: individual: TOI-2498 (TIC-263179590, GAIA DR3 3330907293088717824) - techniques: photometric - techniques: radial velocities1 Introduction
Since the seminal discovery of 51 Pegasi b (Mayor & Queloz, 1995), over 5000 exoplanets have been confirmed. Our search for exoplanets has reached a stage where detection capabilities are beginning to catch up to demands, meaning that we are able to look past detection biases and study the true exoplanet sample. This allows us to perform statistical studies on the exoplanet population, which forms a key role in gaining a better understanding of the formation of planetary systems.
The Kepler (Borucki et al., 2010) space mission was particularly successful in terms of the number of exoplanet detections, being responsible for over half of all confirmed exoplanets. Kepler was also successful in detecting smaller planets than were previously possible and found multitudes of super-Earths, filling in gaps in our knowledge of the exoplanet population. One key feature of the current exoplanet sample that was confirmed though Kepler discoveries is an apparent dearth of close orbit, Neptune sized planets (Szabó & Kiss, 2011; Beauge & Nesvornỳ, 2012; Helled et al., 2015; Lundkvist et al., 2016; Mazeh et al., 2016; Owen & Lai, 2018a).
Continuing the work of the Kepler space telescope, the Transiting Exoplanet Survey Satellite (TESS) telescope (Sullivan et al., 2015) was launched in 2018 and has since confirmed 285 exoplanets. Furthermore, TESS has been optimised to find planets around stars that are bright enough to be able to extract meaningful information from radial velocity observations. This enables us to be able to calculate mass and radius parameters of detected planets. Consequently, the TESS mission, along with spectroscopic instruments such as HARPS (Pepe et al., 2002), have been integral in finding and characterising planets within the Neptune desert. In particular, the HARPS-NOMADS program endeavours to increase the number of planets in this category with precise mass and radius measurements. The objective of this pursuit is to be able to better study and understand the origins of the Neptune desert, and to better constrain the boundaries. Analysis of the boundaries of the Neptune desert could lead towards an improved understanding of formation and evolution of close orbit planets.
This paper presents the detection of TOI-2498 b, a hot super-Neptune transiting a G type star, residing on the edge of the Neptune desert. The observations used in this work include transits from TESS and LCO, spectroscopy from HARPS and spectral imaging from SOAR. The details of these observations are outlined in Section 2. Analysis of these observations, including joint modelling to constrain the planetary parameters and analysis to determine stellar parameters can be found in Section 3. Section 4 contains the results of the analysis and a discussion involving the position of the planet in the Neptune desert and in mass-radius parameter space. This section also includes an analysis of the internal structure and evaporation history of the planet. Finally the conclusions of this work can be found in Section 5.
2 Observations
TOI-2498 is a V = 11.2, G-type (Teff = 5905 ± 12 K) solar-like star. The properties of the star are set out in Table 1
| Stellar Parameters | Value | Source |
| Identifiers | ||
| TIC ID | TIC-263179590 | TIC v8.2 |
| 2MASS ID | J06213989+1115062 | 2MASS |
| Gaia ID | 3330907293088717824 | Gaia DR3 |
| Astrometric Properties | ||
| R.A. (deg) | Gaia DR3 | |
| DEC (deg) | Gaia DR3 | |
| Parallax (mas) | Gaia DR3 | |
| RVsys (km s-1) | 8.36 | Gaia DR3 |
| Photometric Parameters | ||
| B (mag) | TIC v8.2 | |
| V (mag) | TIC v8.2 | |
| G (mag) | Gaia DR3 | |
| J (mag) | TIC v8.2 | |
| H (mag) | TIC v8.2 | |
| K (mag) | TIC v8.2 | |
| Gaia BP (mag) | 11.61 | Gaia DR3 |
| Gaia RP (mag) | 10.80 | Gaia DR3 |
2.1 TESS photometry
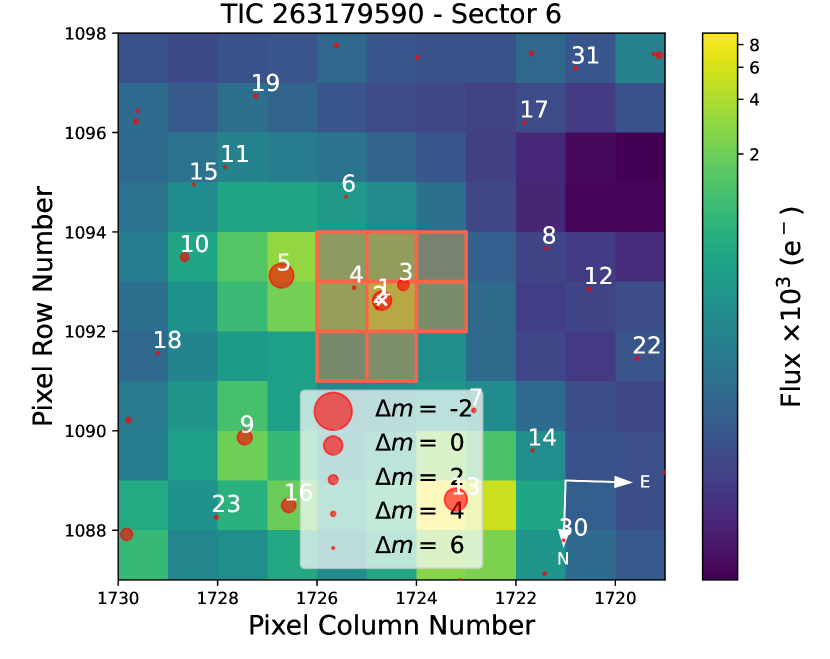
TESS observed TOI-2498 for the first time during its primary mission (cycle 1) within sector 6, in Full Frame Images (FFIs) with a 30-min cadence. It was observed again during the first extended mission in sector 33 (cycle 3), with a 10 minute cadence FFI and a 2 minute cadence pixel stamp observation.
The candidate was alerted as a TOI (TESS Object of Interest, Guerrero et al., 2021) based on the identification of a transit signal from the SPOC pipeline (Jenkins, 2002; Jenkins et al., 2010, 2020). This pipeline uses the PDCSAP (Presearch Data Conditioning Simple Aperture Photometry; Stumpe et al., 2012; Stumpe et al., 2014; Smith et al., 2012) light curves, which removes instrumental and some stellar trends from the SAP (Simple Aperture Photometry) data, but retains local features such as transits. The transit signal passed all the diagnostic tests conducted by Data Validation module (Twicken et al., 2018; Li et al., 2019), and the difference image centroiding test located TOI-2498 to within 3.55 +/- 2.75 arcsec of the location of the transit source.
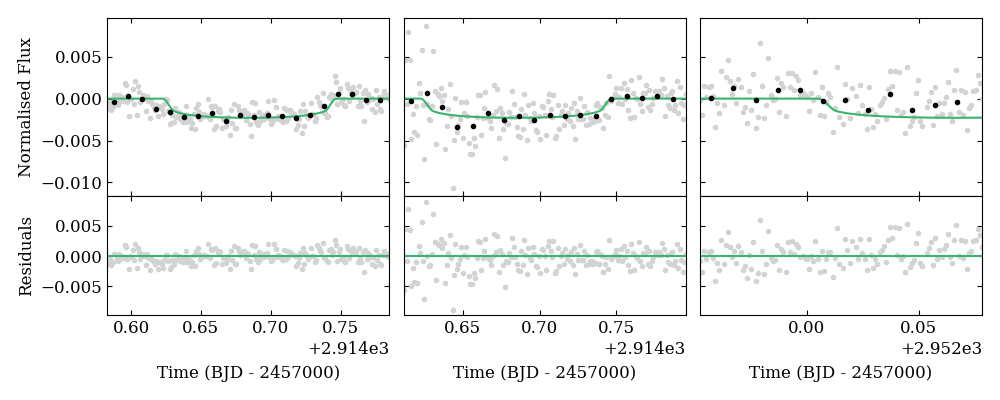
In this work, the PDCSAP lightcurves are flattened by removing the transits and fitting a spline to the data. The resulting flattened lightcurves are used in the joint model outlined in section 3.2. We present the normalised lightcurves along with the generated best-fit model in Figure 1.
Figure 2 shows the TESS Target Pixel File (TPF) created with tpfplotter111https://github.com/jlillo/tpfplotter (Aller et al., 2020), with TOI-2498 as the central object overlaid with nearby catalog sources. As can be seen in Figure 2, there are several sources of potential contamination around the target star, meaning it is likely that the TESS data is affected by blending of sources. To accurately measure the extent of this blending and correct for it, follow up ground based photometry was necessary; the details of these observations are described below.

2.2 LCOGT follow-up photometry
The TESS pixel scale is pixel-1 and photometric apertures typically extend out to roughly 1 arcminute, generally causing multiple stars to blend in the TESS aperture. To determine the true source of the TOI-2498 b detection in the TESS data, improve the transit ephemeris, and check the SPOC pipeline transit depth after accounting for the crowding metric, we conducted ground-based lightcurve follow-up observations of the field around TOI-2498 as part of the TESS Follow-up Observing Program222https://tess.mit.edu/followup Sub Group 1 (TFOP; Collins, 2019). We used the TESS Transit Finder, which is a customized version of the Tapir software package (Jensen, 2013), to schedule our transit observations.
We observed a full predicted transit window of TOI-2498.01 on 2022 December 01 UT simultaneously using the Las Cumbres Observatory Global Telescope (LCOGT; Brown et al., 2013) 1.0 m network nodes at Teide Observatory and Cerro Tololo Inter-American Observatory. We also attempted a full transit observation on 2023 January 07 UT from the LCOGT 1.0 m network node at Siding Spring Observatory, but deteriorating weather limited the in-transit coverage to about 60% of the transit duration. The 1 m telescopes are equipped with SINISTRO cameras having an image scale of per pixel, resulting in a field of view. The images were calibrated by the standard LCOGT BANZAI pipeline (McCully et al., 2018) and differential photometric data were extracted using AstroImageJ (Collins et al., 2017).
We conducted focused observations to improve the separation of TOI-2498 from its nearest Gaia DR3 neighbor, which is northwest and 5.7 magnitudes fainter in TESS band. Typical stellar point spread functions (PSFs) in the images had full-width half-maximum (FWHM) in the range of 2-3 arcseconds. The Teide light curve had the smallest FWHM of and the longest pre- and post-transit baseline of all three light curves, so resulted in the strongest constraints on transit model parameters. We first extracted differential light curves using circular photometric apertures with radius . In this case, the target star aperture included most of the flux of the nearest Gaia DR3 neighbor. A clear transit-like event was detected with a depth of ppm (deeper than predicted by the SPOC pipeline). We then extracted light curves using smaller apertures that exclude the majority of the flux from the neighbor. We again find a ppm event in the smaller target aperture, confirming that the event occurs on-target relative to known Gaia DR3 stars. Since the flux contamination in the larger target star aperture is less than 1%, we use the light curves from the the apertures in the joint modeling in Section 3.2. We present the normalised lightcurves and generated best-fit model in Figure 3.
2.3 ULMT photometry
We observed transit windows of TOI-2498 on 2021 February 26 and again on 2023 February 10 in the Sloan band from the 0.61 m University of Louisville Manner Telescope (ULMT) located at the Steward Observatory near Tucson, AZ. We used the TESS Transit Finder to schedule these transit observations based on the ephemerides current at those times. The SBIG STX-16803 camera on ULMT has an image scale of per pixel, resulting in a field of view. The images on both nights were slightly defocused and had typical stellar point-spread-functions with FWHM of and respectively. The images were calibrated and photometric data were extracted with AstroImageJ (Collins et al., 2017) using circular aperture with radii and respectively. In 2021, we tentatively detected a shallow event on-target and did not find any obvious evidence of a blended nearby eclipsing binary that could be the cause of the TESS detection. In 2023, the shallow ingress was detected in detrended fitting. Due to the relatively high amount of noise compared the rest of our photometry, we decide not to include this data in our analysis.
2.4 HARPS Radial Velocity observations
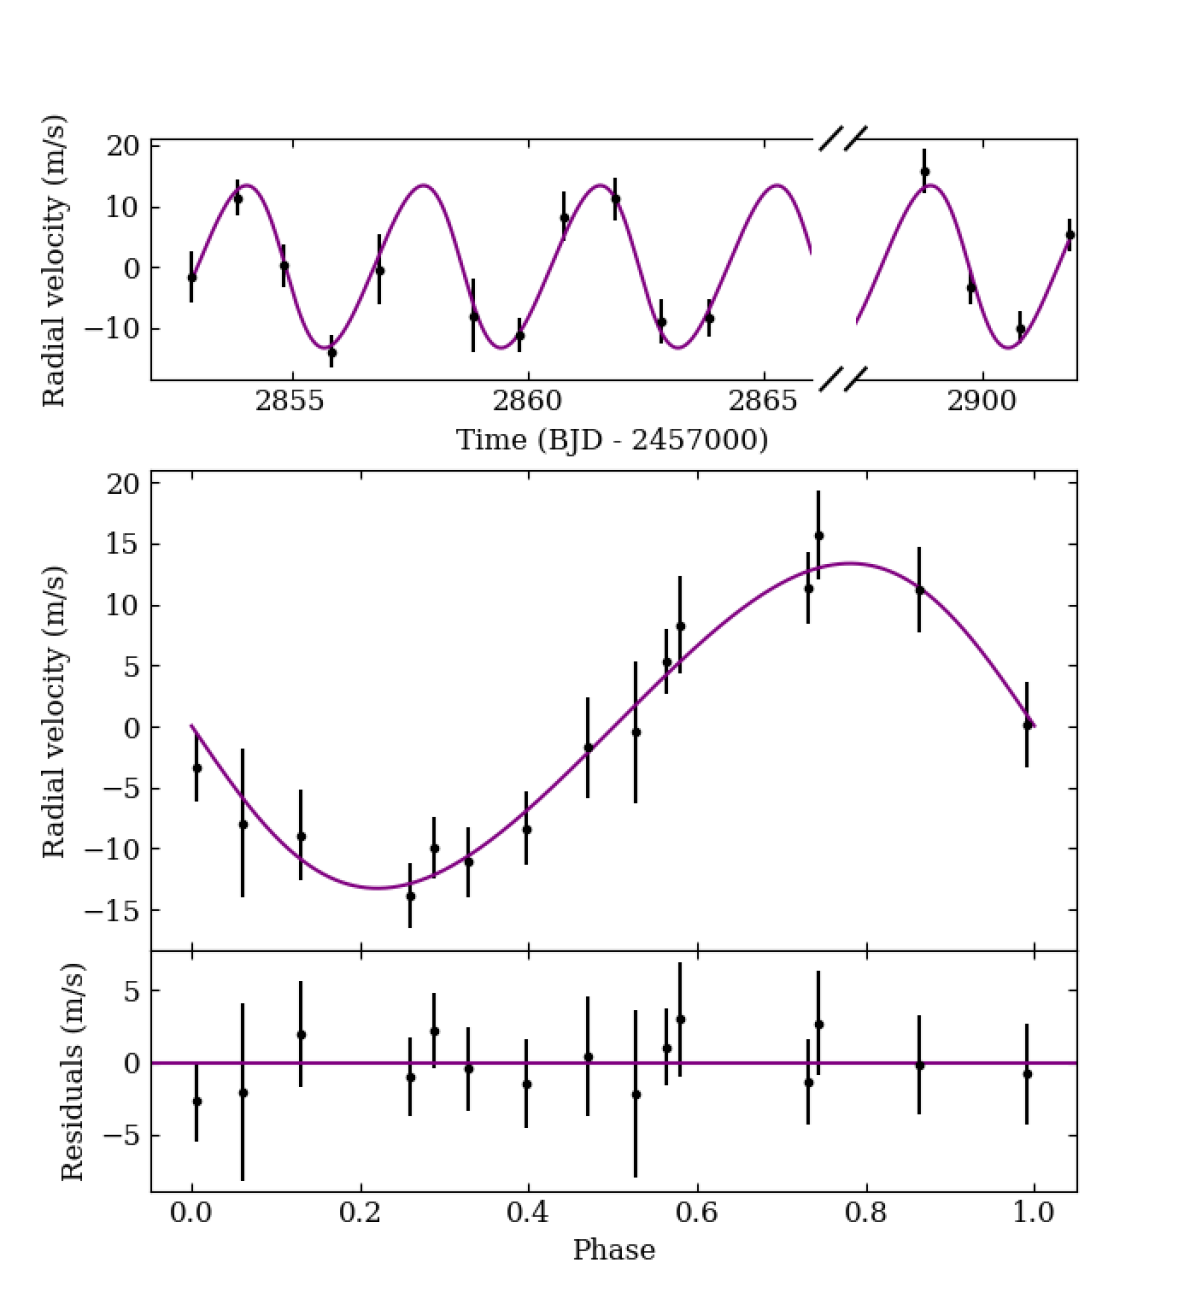
We acquired 16 spectra through the HARPS-NOMADS program (PI Armstrong, 1108.C-0697) using HARPS (the High Accuracy Radial velocity Planetary Searcher Mayor et al. (2003)). HARPS is an Echelle spectrograph mounted on the ESO 3.6-m telescope at the La Silla Observatory in Chile. The data were collected between 2022 September 30 to October 12 and 2022 November 15 to November 18. The HARPS High-Accuracy mode was utilised, with a fibre diameter of 1", a resolution of and an exposure time of approximately 1800 seconds. This resulted in a signal to noise ratio (SNR) of between 30 and 35 per pixel at a wavelength of 550nm. The standard HARPS data reduction software outlined in Lovis & Pepe (2007) was used to reduce the raw HARPS data, in which a weighted cross correlation is applied with a G2 spectral mask. Measurements of the Radial Velocity (RV), FWHM, the line bisector span, the contrast of the Cross-Correalation Function (CCF) and the S-index are displayed in Table 2. The median photon noise per measurement for this dataset is 3.45 m s-1. The last datapoint from the first set of observations is discarded due to anolamous results in RV error, FWHM, bisector span, contrast and S-index (see Table 2). This datapoint also has a lower SNR than the others, which we attribute to cloud coverage at the time of observation.
We present the HARPS radial velocity data along with the generated best-fit model (see Section 3.2 for details) in Figure 4.
2.5 SOAR imaging
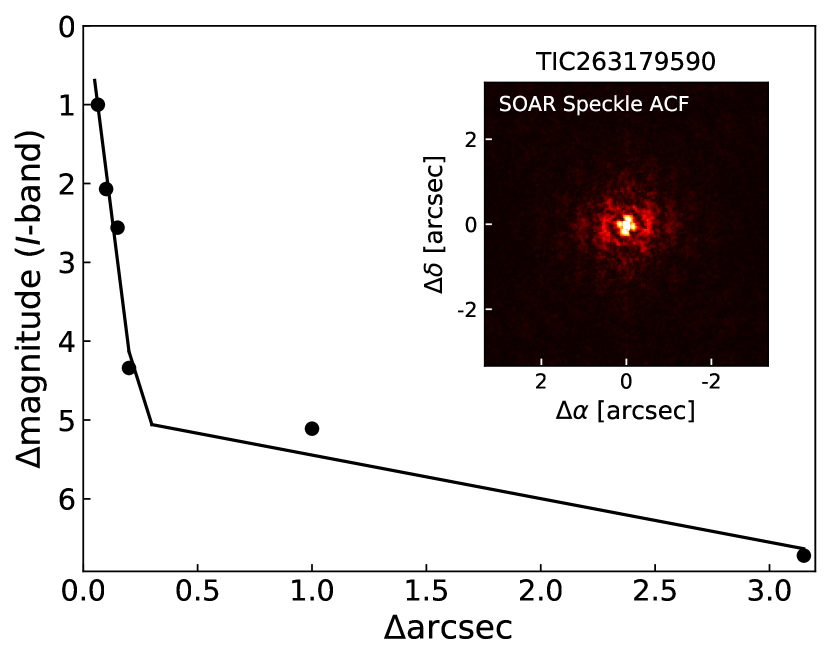
High-angular resolution imaging is needed to search for nearby sources that can contaminate the TESS photometry, resulting in an underestimated planetary radius, or be the source of astrophysical false positives, such as background eclipsing binaries. We searched for stellar companions to TOI-2498 with speckle imaging on the 4.1-m Southern Astrophysical Research (SOAR) telescope (Tokovinin, 2018) on 27 February 2021 UT, observing in Cousins I-band, a similar visible bandpass as TESS. This observation was sensitive to a 5.1-magnitude fainter star at an angular distance of 1 arcsec from the target. More details of the observations within the SOAR TESS survey are available in Ziegler et al. (2020). The 5 detection sensitivity and speckle auto-correlation functions from the observations are shown in Figure 5. No nearby stars were detected within 3 of TOI-2498 in the SOAR observations.
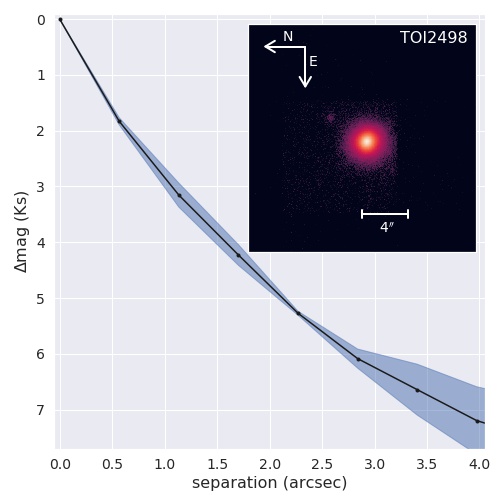
2.6 Shane imaging
We observed TOI-2498 on 2021 March 4 using the ShARCS camera on the Shane 3-meter telescope at Lick Observatory (Kupke et al., 2012; Gavel et al., 2014; McGurk et al., 2014). Observations were taken with the Shane adaptive optics system in natural guide star mode to search for nearby, unresolved stellar companions. We collected a single sequence of observations using a filter ( m, m). We reduced the data using the publicly available SImMER pipeline (Savel et al., 2020; Savel et al., 2022).333https://github.com/arjunsavel/SImMER Our reduced images and corresponding contrast curves are shown in Figure 6. Our observations achieve a contrast of 2.9 at 1″and 4.8 at 2″. We detect the known star TIC 715328024 (T = 5.7, sep = 3.8″, PA = 328∘), but find no other nearby stellar companions within our detection limits.
| Time (BJD | RV | RV error | FWHM | Bisector span | Contrast | S-indexMW |
|---|---|---|---|---|---|---|
| -2457000) | (m/s) | (m/s) | (m/s) | (m/s) | ||
| 2852.89471 | 7441.0 | 4.2 | 7262.1 | 17.8 | 46.57 | 0.13 |
| 2853.86784 | 7454.1 | 2.9 | 7282.7 | -3.0 | 46.93 | 0.14 |
| 2854.83784 | 7443.0 | 3.5 | 7285.0 | 8.3 | 46.87 | 0.13 |
| 2855.84365 | 7429.0 | 2.7 | 7295.1 | 2.2 | 46.90 | 0.13 |
| 2856.84238 | 7442.3 | 5.8 | 7251.6 | 11.1 | 46.90 | 0.11 |
| 2858.83733 | 7434.8 | 6.1 | 7302.1 | 6.6 | 46.72 | 0.14 |
| 2859.83526 | 7431.7 | 2.9 | 7286.3 | -3.9 | 46.86 | 0.13 |
| 2860.77664 | 7451.0 | 4.0 | 7281.4 | -0.68 | 46.45 | 0.11 |
| 2861.83705 | 7453.9 | 3.4 | 7259.7 | 9.3 | 46.65 | 0.14 |
| 2862.83113 | 7433.9 | 3.7 | 7265.3 | 1.5 | 46.46 | 0.12 |
| 2863.83660 | 7434.4 | 3.0 | 7281.2 | 12.5 | 46.64 | 0.13 |
| 2864.86315 | 7463.7 | 11.4 | 7176.2 | 40.1 | 44.29 | 0.06 |
| 2898.77390 | 7458.4 | 3.6 | 7285.9 | 8.1 | 46.77 | 0.12 |
| 2899.75712 | 7439.4 | 2.7 | 7276.7 | 1.1 | 46.96 | 0.14 |
| 2900.80942 | 7432.8 | 2.6 | 7287.5 | 11.6 | 46.81 | 0.12 |
| 2901.84129 | 7448.1 | 2.7 | 7289.8 | -2.3 | 46.86 | 0.13 |
3 Analysis and Results
3.1 Stellar Analysis
We used ARES+MOOG to derive the stellar atmospheric parameters Teff, , microturbulence and [Fe/H]), and their respective uncertainties following the methodology described in Sousa (2014); Santos et al. (2013). We measured equivalent widths (EW) of iron lines on the combined HARPS spectrum of TOI-2498 using the ARES v2 code444The last version of ARES code (ARES v2) can be downloaded at http://www.astro.up.pt/sousasag/ares (Sousa et al., 2015). Then we used a minimization process where we assume ionization and excitation equilibrium to converge in the best set of spectroscopic parameters. This process makes use of a grid of Kurucz model atmospheres (Kurucz, 1993) and the radiative transfer code MOOG (Sneden, 1973).
Stellar abundances of the elements were derived using the classical curve-of-growth analysis method assuming local thermodynamic equilibrium and with the same codes and models that were used for the stellar parameters determinations. For the derivation of chemical abundances of refractory elements we closely followed the methods described in Adibekyan et al. (2012); Adibekyan et al. (2015); Delgado Mena et al. (2017). Abundances of the volatile elements, C and O, were derived following the method of Delgado Mena et al. (2021); Bertran de Lis et al. (2015). We note that the oxygen lines are very weak and difficult to measure given the signal to noise ratio of the co-added spectrum and thus the final abundance has a large uncertainty. All the [X/H] ratios are obtained through a differential analysis with respect to a high S/N solar (Vesta) spectrum from HARPS. The stellar parameters and abundances of the elements are presented in Table 3.
We find that the [X/Fe] ratios of TOI-2498 are typical for a thin disk star. Moreover, we used the chemical abundances of some elements to derive ages through the so-called chemical clocks (i.e. certain chemical abundance ratios which have a strong correlation for age). We applied the 3D formulas described in Table 10 of Delgado Mena et al. (2019), which also consider the variation in age produced by the effective temperature and iron abundance. The chemical clocks [Y/Mg], [Y/Zn], [Y/Ti], [Y/Si], [Y/Al], [Sr/Ti], [Sr/Mg] and [Sr/Si] were used from which we obtain a weighted average age of 3.6 1.1 Gyr.
3.1.1 Spectral Energy Distribution Analysis
As an independent determination of the basic stellar parameters, we performed an analysis of the broadband spectral energy distribution (SED) of the star together with the Gaia DR3 parallax (with no systematic offset applied; see, e.g., Stassun & Torres, 2021), in order to determine an empirical measurement of the stellar radius, following the procedures described in Stassun & Torres (2016); Stassun et al. (2017); Stassun et al. (2018). We pulled the magnitudes from Tycho-2, the magnitudes from 2MASS, the W1–W3 magnitudes from WISE, and the magnitudes from Gaia. Together, the available photometry spans the full stellar SED over the wavelength range 0.4–10 m.
We performed a fit using PHOENIX stellar atmosphere models (Husser et al., 2013), with the effective temperature (), surface gravity (), and metallicity ([Fe/H]) initially set to the spectroscopically determined values. The remaining free parameter is the extinction , which we limited to maximum line-of-sight value from the Galactic dust maps of Schlegel et al. (1998). The resulting fit has a best-fit , with a reduced of 1.3. Integrating the (unreddened) model SED gives the bolometric flux at Earth, erg s-1 cm-2. Taking the together with the Gaia parallax, gives the bolometric luminosity, L⊙, which via the Stefan-Boltzmann relation gives the stellar radius, R⊙. In addition, we can estimate the stellar mass from the empirical eclipsing-binary relations of Torres et al. (2010), giving M⊙.
Finally, we performed a fit allowing the stellar parameters to vary, finding only the metallicity differed marginally from the spectroscopically determined value, [Fe/H] = , with an improved reduced of 0.8. In that case, the resulting stellar properties are as follows: , erg s-1 cm-2, L⊙, R⊙, and M⊙.
As all determined stellar parameters were in agreement, we adopt the ARES+MOOG parameter set for consistency.
3.2 Joint modelling
The photometry from both TESS and LCO and spectroscopy from HARPS, described in Section 2, were combined in a joint fit using the exoplanet (Foreman-Mackey et al., 2021) code framework. This package also makes use of starry (Luger et al., 2019b) and PYMC3 (Salvatier et al., 2016a).
3.2.1 Photometry
We include the flattened photometric data from the two TESS sectors described in section 2.1 and the two full and one partial transit from LCOGT described in section 2.2.
Firstly, we normalise all photometry by dividing each lightcurve by the median of the out-of-transit flux and subtracting one. Each transit is then modelled through exoplanet as a Keplerian orbit, with quadratic limb-darkening parameterisation from Kipping (2013). The Keplerian orbit model is parameterised in terms of stellar mass () and radius () in solar units, the orbital period P in days, central transit ephemeris TC in TBJD (BJD - 2457000), impact parameter , eccentricity and argument of periastron in radians. Transit models are generated using starry, and include planetary radius ( and the exposure time for the relevant instrument.
3.2.2 Spectroscopy
We include the spectroscopic data from HARPS described in section 2.4. We find no need to fit a GP model as periodogram analysis through the DACE555DACE can be accessed at https://dace.unige.ch platform shows no indication of stellar activity or signals from stellar rotation, suggesting that TOI-2498 is magnetically quiet. We fit for the semi-amplitude K of the RV signal, starting with a widely set uniform prior centered around the value found via analysis using DACE (13.37 m s-1). We also fit for HARPS instrument offset, and implement a noise model which adds a white noise (jitter) term in quadrature with the nominal RV uncertainties.
3.2.3 Joint fit results
We first maximise the log probability of the PYMC3 model, and use the resulting parameters as our initial fit values. We then use a No U-Turn Sampler (NUTS) variant of the Hamiltonian Monte Carlo (HMC) algorithm to draw samples from the posterior chain, for which we use 20 chains with 20,000 steps. We treat the first 4000 samples drawn as burn-in and subsequently discard them.
Through the results of this analysis, we determine that TOI-2498 b is a Super-Neptune of radius 6.06 ± 0.29 R and mass 34.62 ± 4.10 M. From this we infer a bulk density of 0.86 ± 0.25 gcm-3. We present all parameter best-fit results in Table 5.
| Stellar Parameters | Value |
|---|---|
| Mass (M⊙) | |
| Radius (R⊙) | |
| Density (g cm-3) | |
| log g | |
| Teff (K) | |
| vturb (km s-1) | |
| Age (Gyr) | |
| Stellar abundances | |
| [Fe/H] (dex) | |
| [C/H] (dex) | |
| [O/H] (dex) | |
| [Mg/H] (dex) | |
| [Al/H] (dex) | |
| [Si/H] (dex) | |
| [Ti/H] (dex) | |
| [Ni/H] (dex) | |
| [Cu/H] (dex) | |
| [Zn/H] (dex) | |
| [Sr/H] (dex) | |
| [Y/H] (dex) | |
| [Zr/H] (dex) | |
| [Ba/H] (dex) | |
| [Ce/H] (dex) | |
| [Nd/H] (dex) |
| Parameter | Prior distribution | Fitted value |
| TESS Sector 6 mean | (0, 1) | |
| TESS Sector 33 mean | (0, 1) | |
| Contamination ∗ | (0.66, 0.2) | |
| LCO Teide mean | (0, 1) | |
| LCO CTIO mean | (0, 1) | |
| LCO SSO mean | (0, 1) | |
| log(K) (m s-1) | (0.0, 4.0) | Table 5 |
| HARPS offset | (7442.50, 10.0) | |
| log(HARPS jitter) | (1.895, 5.0) | |
| LD coefficient | Kipping (2013)† | |
| LD coefficient | Kipping (2013)† | |
| Orbital period (days) | (3.737882, 0.001) | Table 5 |
| TC (TBJD) | (2204.4183, 0.01) | Table 5 |
| log(Rp) (R⊙) | (-3.05, 1.0) | Table 5 |
| unitdisk‡ | Table 5 | |
| Impact parameter | (0.0, 1.0) | Table 5 |
∗ Proportion of the measured flux from TESS that is due to TOI-2498.
† The distributions for limb darkening coefficients are built into the exoplanet framework and are based on Kipping (2013).
‡ Eccentricity and the argument of periastron are sampled with a Uniform distribution on a unit disk in two dimensions using pmx.unitdisk from PYMC3 (Salvatier
et al., 2016b).
: Normal distribution with mean and standard deviation .
: Uniform distribution with lower bound and upper bound .
| Fitted Parameters | Value |
|---|---|
| Orbital period (days) | |
| Radius (R⊕) | |
| Rp/R* | |
| TC (TBJD) | |
| Impact parameter | |
| K (m s-1) | |
| Eccentricity | |
| Argument of periastron (∘) | |
| Derived Parameters | Value |
| Mass (M⊕) | |
| Density (g cm-3) | |
| Inclination (∘) | |
| Semi-major axis (AU) | |
| Temperature Teq (K) ∗ |
∗ Assuming Albedo = 0 and uniform surface temperature
3.3 Transit timing variations
We perform an initial check for additional planets using the DACE platform. Using DACE, we generate a lomb-scargle periodogram of the HARPS data and search for additional signals after removal of the radial velocity signal caused by TOI-2498 b. We find no evidence of additional signals above a False Alarm Probability (FAP) of 0.1, suggesting that TOI-2498 b is the only massive, short period planet orbiting TOI-2498.
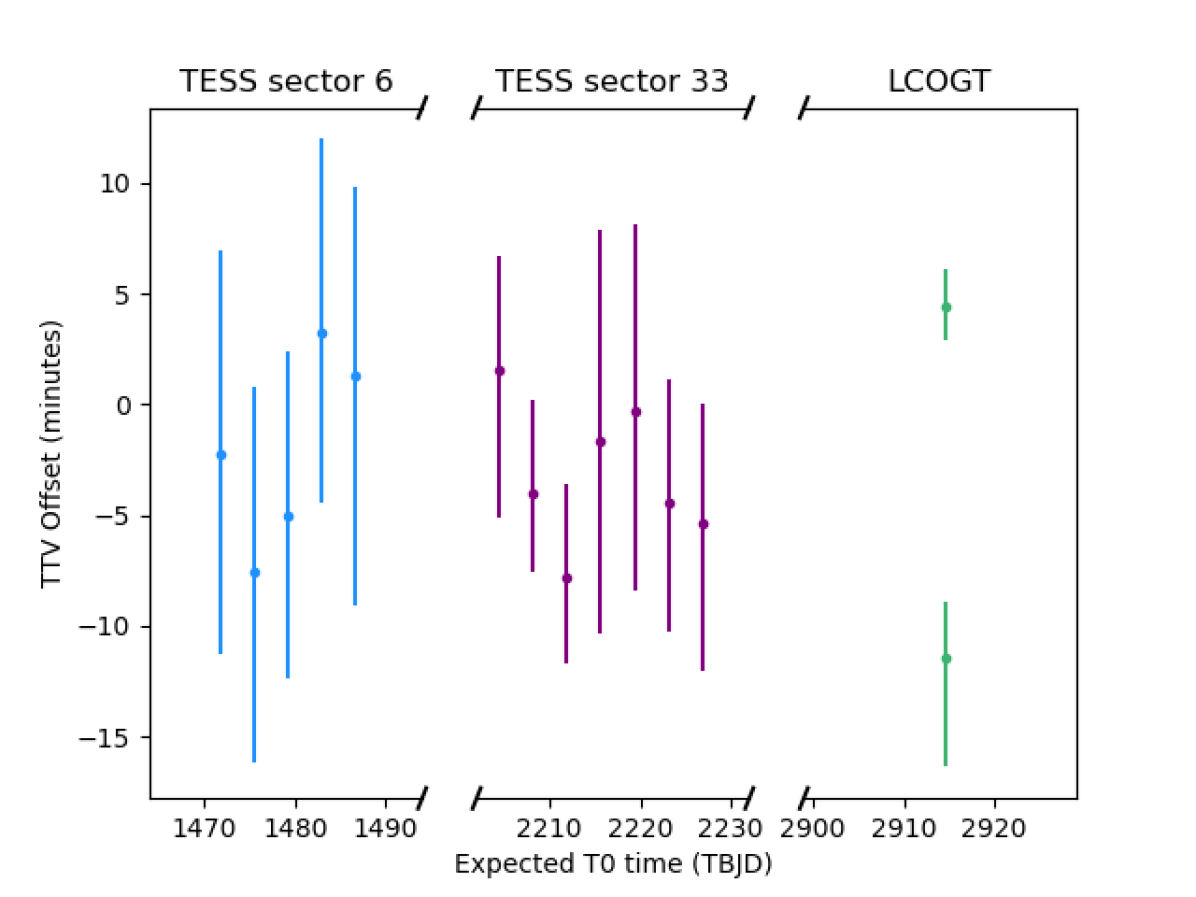
To support this analysis, we examine each individual full transit from TESS and LCO and check for transit timing variations. We re-run the transit model described in section 3.2.1 for each individual transit. We fix all of the parameters to the best fit results in Table 5, other than the central transit time T0, for which we set a uniform prior, centered around the expected value. The results of this fitting are subtracted from the expected value to find the TTV offset for each transit. We present this analysis in Figure 7. We again find no evidence of additional planets, although more transits would allow a more thorough check. It is worth noting the apparent discrepancy between the two LCOGT TTV offsets, as these points are different observations of the same transit and therefore should agree. We attribute this discrepancy to high airmass having a significant impact on the ingress of one of the transits (see Figure 3).
4 Discussion
4.1 Planet position in the Neptune Desert
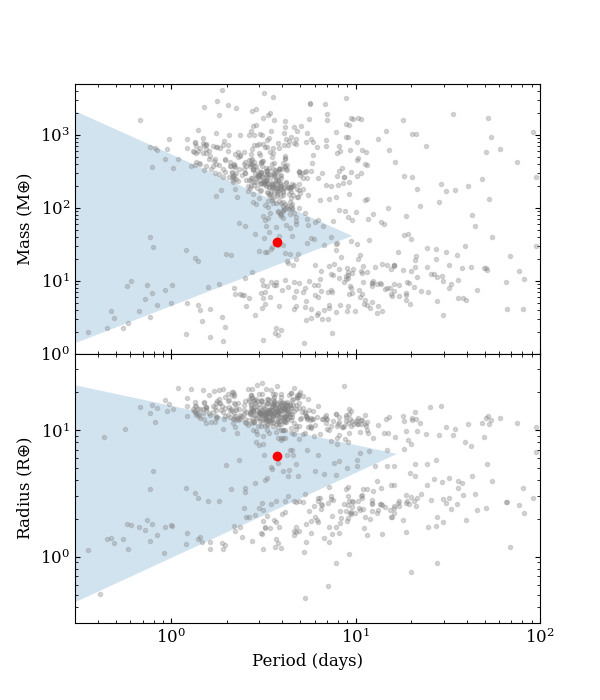
We find that TOI-2498 b is situated just within the Neptune desert, close to the lower edge in the mass-period parameter space. The positioning is displayed in Figure 8 in both the mass-period and radius-period parameter spaces, with boundaries as given in Mazeh et al. (2016).
As explained in Owen & Lai (2018a), it is thought that the upper boundary is due to high-eccentricity migration, while the lower boundary is due to photoevaporation. Mazeh et al. (2016) also provides an alternative explanation for the lower boundary, suggesting that as the planet-star separation grows, the size of the Hill sphere of the forming planet, the orbital path and the dust-to-gas ratio all increase. This results in an increased core mass at the end of the first stage of planetary formation. Hence planets that are further from their host stars have an increased total mass.
As is apparent from Figure 8, the upper boundary of the Neptune desert is significantly more defined than the lower. There is an observational bias to take into account here, where larger, higher mass planets are substantially easier to detect and characterise. Consequently, as more planets close to the lower edge of the mass-period desert (such as TOI-2498 b) are added to the sample, the boundary becomes even more blurred. This raises the question of whether the lower boundary of the Neptune desert needs to be re-evaluated. However, it is worth pointing out that programs such as HARPS-NOMADS specifically target planets within the desert parameter space, creating a biased sample of planets and potentially providing some explanation for this blurring of the boundary.
4.2 Planet density
We plot the position of TOI-2498 b in mass-radius parameter space in Figure 9. When considering the general exoplanet population, it can be seen that TOI-2498 b sits in a relatively sparse area of this parameter space. This Figure also shows the planets proximity to composition models from Zeng et al. (2016, 2019), with the closest relation being the model for planets with a 5% H2 envelope and a rocky core with a surface equilibrium temperature of 2000 K.
We also present the position of TOI-2498 b in a more mass-constrained mass-radius space in the right-hand side of Figure 9. In this plot, planets that are located within the Neptune desert are highlighted in red. Note that for these planets, there is an apparent upper size bound that falls rapidly as mass decreases. This could be a reflection of planets’ on a closer orbit (shorter period) inability to maintain their envelopes due to irradiation from host stars.
We highlight 6 Neptune desert planets closest to TOI-2498 b in mass-radius parameter space in Figure 9. These planets are as follows: HATS-7 b (Bakos et al., 2015), WASP-156 b (Demangeon et al., 2018), WASP-166 b (Hellier et al., 2019), TOI-181 b (Mistry et al., 2023b), HATS-38 b (Jordán et al., 2020), TOI-1694 b (Mistry et al., 2023a).
Of particular interest here is WASP-166 b, as not only does it share a very similar mass and radius to TOI-2498 b, it also has a similar orbital period and equilibrium temperature. These similarities suggest that there is potential insight to be gained from a comparative study between atmospheres of TOI-2498 b and WASP-166 b. Several atmospheric studies have been performed on WASP-166 b, in particular searches for sodium (Seidel et al., 2022) and water (Lafarga et al., 2023). We therefore suggest that TOI-2498 b is a potential candidate for searching for species such as water or sodium in the optical using high-resolution, and also perhaps for carbon based molecules in the infrared using JWST.
4.3 Composition and Internal structure
TOI-2498 b’s low density of g cm-3 is indicative of the presence of a gaseous envelope. We estimate its internal structure by assuming it is comprised of a rocky core surrounded by an H/He-rich atmosphere, following Rogers & Owen (2021). This model consists of four parameters: the rocky core radius R and mass M, and the envelope thickness R and mass fraction f. The envelope mass fraction is defined as the ratio of envelope mass to total planet mass .
To solve for these parameters, we adopted a system of four equations. These include (1) the definition of envelope mass fraction above, (2) the definition of envelope thickness as the difference between planet and core radii , (3) the mass-radius relations for rocky cores by Otegi et al. (2020), and (4) the envelope structure model by Chen & Rogers (2016), which determines the thickness of the gaseous envelope from its mass. The resulting internal structure of TOI-2498 b, as shown in Table 6, indicates that the planet hosts a significant gaseous envelope which consists of % of its mass. However, this model assumes no water content or significant atmospheric metallicity. Whilst massive planets with high water content are thought to have a mixed interior with a moderate metallicity gradient (Stevenson et al., 2022), smaller dry sub-Neptunes are thought to settle into a structure with distinct core and envelope (Bodenheimer et al., 2018). TOI-2498 b is intermediate in size and would likely fall somewhere between these two scenarios. Future spectroscopic observations could constrain the metallicity of its atmosphere and its H2O content.
| Property | Symbol (Units) | Value |
|---|---|---|
| Core radius | R (R⊕) | |
| Core mass | M (M⊕) | |
| Envelope thickness | R (R⊕) | |
| Envelope mass fraction | f |
4.4 Evaporation history
Atmospheric evaporation is thought to have a significant influence in sculpting exoplanet populations, giving rise to the Neptune desert (Owen & Lai, 2018b) as well as the period-radius valley (e.g. Lopez et al., 2012; Owen & Wu, 2013; Jin et al., 2014; Owen & Wu, 2017). The underlying mechanisms for evaporation, however, are still unclear. One of the proposed mechanisms is photoevaporation, where X-ray and extreme ultraviolet photons (together, XUV) emitted by stars are readily absorbed by the upper atmospheres of close-in planets, heating up the gas and driving a hydrodynamic wind that escapes the planet’s gravitational well (e.g. Lammer et al., 2003; Erkaev et al., 2007; Kislyakova et al., 2013). Additional mechanisms have also been proposed, such as core-powered mass loss (Ginzburg et al., 2016; Gupta & Schlichting, 2020), in which the energy for evaporation is provided by the core’s internal heat.
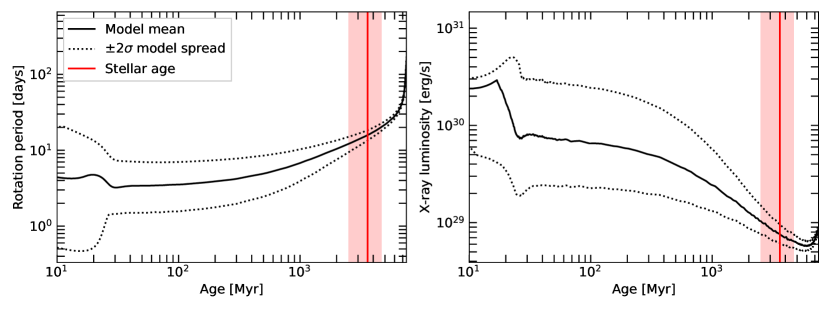
Moreover, the XUV emission history of a star can be estimated from its spin period history, as the two quantities are related via the rotation-activity relation (Wright et al., 2011), where a shorter stellar rotation period leads to a brighter X-ray emission. We adopted the stellar spin evolution models by Johnstone et al. (2021) to determine the X-ray emission past of TOI-2498. For a given stellar mass, they modelled a distribution of starting rotation periods which is then evolved in time through various angular momentum transfer mechanisms. The spin and X-ray evolution models for a 1.1 M⊙ star are shown on Figure 10. Even though we did not measure a rotation period for TOI-2498, we were able to determine an age of Gyr, from which these models predict a present-day spin period between 8 and 24 days.
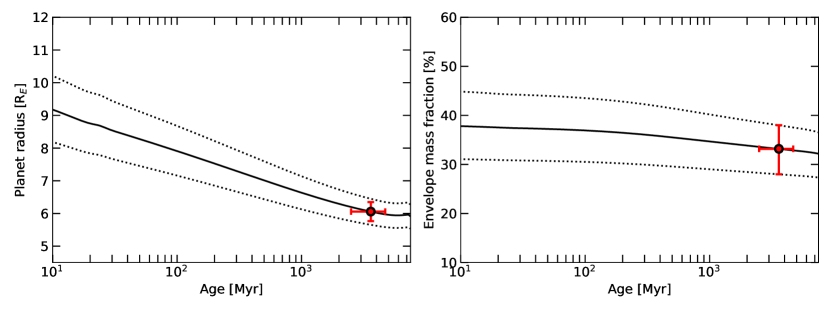
We modelled the evaporation history of TOI-2498 b using the method by Fernández Fernández et al. (submitted). We utilise the photoevolver code 666The code is available on GitHub through: https://github.com/jorgefz/photoevolver to simulate the evaporation history of the planet. This method combines three ingredients: (1) a description of the stellar XUV emission history from the models by Johnstone et al. (2021) as shown on Figure 10, (2) the evaporation model by Kubyshkina et al. (2018), which determines the mass loss rate from the incident XUV flux, and (3) the envelope structure model by Chen & Rogers (2016), which recalculates the envelope thickness after mass is removed from it. We evolved the planet under photoevaporation backwards in time to the age of 10 Myr and forwards to 7.5 Gyr.
Figure 11 shows the evaporation history of TOI-2498 b. Overall, we find TOI-2498 b to be a stable super-Neptune that has experienced little evaporation throughout its lifetime, relative to its mass. The planet, after formation, might have started out as a puffy Saturn-sized world of radius 8–10 R⊕ and envelope mass fraction 30–45 %. We also find its envelope is unlikely to be stripped prior to its host star evolving off the main sequence.
5 Conclusions
In this work, we have presented the discovery of a hot, bloated Super-Neptune transiting a G type star. Our analysis includes photometry from TESS sector 6 and sector 33, follow up ground based photometry from LCOGT and spectroscopy from HARPS. We combine this data in a joint model to discern a planet radius of 6.1 ± 0.3 R, planet mass of 35 ± 4 M and an orbital period of 3.7 days. We calculate a stellar mass of 1.12 ± 0.02 M and a stellar radius of 1.26 ± 0.04 R. We find no indication of additional planets through radial velocity periodograms and TTV analyis.
We estimate through internal structure models that 274% of the mass of TOI-2498 b constitutes a gaseous envelope. We present the evaporation history of the planet and find that it is likely a stable Super-Neptune, with little evaporation having taken place throughout its lifetime. We find that TOI-2498 b likely started its life as a puffy Saturn-sized world before shrinking to its current size over 3.6 1.1 Gyr.
We highlight similarities in mass, radius, period and temperature in TOI-2498 b and WASP-166 b and suggest that there is potential for comparative atmospheric studies between the two planets. We also point out that spectroscopic atmospheric observations would allow for constraints on water content and atmospheric metallicity. This would improve our abilities to study the composition and internal structure of TOI-2498 b.
Acknowledgements
This work makes use of tpfplotter by J. Lillo-Box (publicly available in www.github.com/jlillo/tpfplotter), which also made use of the python packages astropy, lightkurve, matplotlib and numpy.
This research makes use of exoplanet (Foreman-Mackey et al., 2021) and its dependencies (Agol et al., 2020; Kumar et al., 2019; Astropy Collaboration et al., 2013, 2018; Foreman-Mackey et al., 2021; Kipping, 2013; Luger et al., 2019a; Salvatier et al., 2016b; Theano Development Team, 2016).
This work makes use of data from the European Space Agency (ESA) mission Gaia (https://www.cosmos.esa.int/gaia), processed by the Gaia Data Processing and Analysis Consortium (DPAC, https://www.cosmos.esa.int/web/gaia/dpac/consortium). Funding for the DPAC has been provided by national institutions, in particular the institutions participating in the Gaia Multilateral Agreement.
This paper includes data collected by the TESS mission. Funding for the TESS mission is provided by the NASA Explorer Program. Resources supporting this work were provided by the NASA High-End Computing (HEC) Program through the NASA Advanced Supercomputing (NAS) Division at Ames Research Center for the production of the SPOC data products. The TESS team shall assure that the masses of fifty (50) planets with radii less than 4 REarth are determined.
We acknowledge the use of public TESS Alert data from pipelines at the TESS Science Office and at the TESS Science Processing Operations Center.
This research makes use of the Exoplanet Follow-up Observation Program website, which is operated by the California Institute of Technology, under contract with the National Aeronautics and Space Administration under the Exoplanet Exploration Program.
This work makes use of observations from the LCOGT network. Part of the LCOGT telescope time was granted by NOIRLab through the Mid-Scale Innovations Program (MSIP). MSIP is funded by NSF.
This study is based on observations collected at the European Southern Observatory under ESO programme 1108.C-0697 (PI: Armstrong).
Based in part on observations obtained at the Southern Astrophysical Research (SOAR) telescope, which is a joint project of the Ministério da Ciência, Tecnologia e Inovações (MCTI/LNA) do Brasil, the US National Science Foundation’s NOIRLab, the University of North Carolina at Chapel Hill (UNC), and Michigan State University (MSU).
We acknowledge the support from Fundação para a Ciência e a Tecnologia (FCT) through national funds and from FEDER through COMPETE2020 by the following grants: UIDB/04434/2020 & UIDP/04434/2020, 2022.04416.PTDC and 2022.06962.PTDC. E.D.M. acknowledges the support from FCT through Stimulus FCT contract 2021.01294.CEECIND. S.G.S. acknowledges the support from FCT through Investigador FCT contract nr.CEECIND/00826/2018 and POPH/FSE (EC). DJA is supported by UKRI through the STFC (ST/R00384X/1) and EPSRC (EP/X027562/1).
This work has been carried out within the framework of the National Centre of Competence in Research PlanetS supported by the Swiss National Science Foundation under grants 51NF40_182901 and 51NF40_205606. The authors acknowledge the financial support of the SNSF. This project has received funding from the European Research Council (ERC) under the European Union’s Horizon 2020 research and innovation program (grant agreement SCORE No. 851555)
GF acknowledges a Warwick prize scholarship (PhD) made possible thanks to a generous philanthropic donation. GF and HMC acknowledge funding from a UKRI Future Leader Fellowship, grant number MR/S035214/1. FH is supported by an STFC studentship. PJW acknowledges support from the UK Science and Technology Facilities Council (STFC) through consolidated grant ST/T000406/1. KAC acknowledges support from the TESS mission via subaward s3449 from MIT.
Data Availability
The TESS data can be accessed through the MAST (Mikulski Archive for Space Telescopes) portal at https://mast.stsci.edu/portal/Mashup/Clients/Mast/Portal.html. Photometry and imaging data from LCO and SOAR are accessible via the ExoFOP-TESS archive at https://exofop.ipac.caltech.edu/tess/target.php?id=350153977. All python scripts, including the exoplanet modelling code, parameter analysis and plotting can be made available upon reasonable request to the author.
References
- Adibekyan et al. (2012) Adibekyan V. Z., Sousa S. G., Santos N. C., Delgado Mena E., González Hernández J. I., Israelian G., Mayor M., Khachatryan G., 2012, A&A, 545, A32
- Adibekyan et al. (2015) Adibekyan V., et al., 2015, A&A, 583, A94
- Agol et al. (2020) Agol E., Luger R., Foreman-Mackey D., 2020, AJ, 159, 123
- Aller et al. (2020) Aller A., Lillo-Box J., Jones D., Miranda L. F., Forteza S. B., 2020, Astronomy & Astrophysics, 635, A128
- Astropy Collaboration et al. (2013) Astropy Collaboration et al., 2013, A&A, 558, A33
- Astropy Collaboration et al. (2018) Astropy Collaboration et al., 2018, AJ, 156, 123
- Bakos et al. (2015) Bakos G., et al., 2015, The Astrophysical Journal, 813, 111
- Beauge & Nesvornỳ (2012) Beauge C., Nesvornỳ D., 2012, The Astrophysical Journal, 763, 12
- Bertran de Lis et al. (2015) Bertran de Lis S., Delgado Mena E., Adibekyan V. Z., Santos N. C., Sousa S. G., 2015, A&A, 576, A89
- Bodenheimer et al. (2018) Bodenheimer P., Stevenson D. J., Lissauer J. J., D’Angelo G., 2018, ApJ, 868, 138
- Borucki et al. (2010) Borucki W. J., et al., 2010, Science, 327, 977
- Brown et al. (2013) Brown T. M., et al., 2013, PASP, 125, 1031
- Chen & Rogers (2016) Chen H., Rogers L. A., 2016, ApJ, 831, 180
- Collins (2019) Collins K., 2019, in American Astronomical Society Meeting Abstracts #233. p. 140.05
- Collins et al. (2017) Collins K. A., Kielkopf J. F., Stassun K. G., Hessman F. V., 2017, AJ, 153, 77
- Delgado Mena et al. (2017) Delgado Mena E., Tsantaki M., Adibekyan V. Z., Sousa S. G., Santos N. C., González Hernández J. I., Israelian G., 2017, A&A, 606, A94
- Delgado Mena et al. (2019) Delgado Mena E., et al., 2019, A&A, 624, A78
- Delgado Mena et al. (2021) Delgado Mena E., Adibekyan V., Santos N. C., Tsantaki M., González Hernández J. I., Sousa S. G., Bertrán de Lis S., 2021, A&A, 655, A99
- Demangeon et al. (2018) Demangeon O. D., et al., 2018, Astronomy & Astrophysics, 610, A63
- Erkaev et al. (2007) Erkaev N. V., Kulikov Y. N., Lammer H., Selsis F., Langmayr D., Jaritz G. F., Biernat H. K., 2007, A&A, 472, 329
- Foreman-Mackey et al. (2021) Foreman-Mackey D., et al., 2021, exoplanet-dev/exoplanet v0.4.4, doi:10.5281/zenodo.1998447, https://doi.org/10.5281/zenodo.1998447
- Gavel et al. (2014) Gavel D., et al., 2014, in Marchetti E., Close L. M., Vran J.-P., eds, Society of Photo-Optical Instrumentation Engineers (SPIE) Conference Series Vol. 9148, Adaptive Optics Systems IV. p. 914805 (arXiv:1407.8207), doi:10.1117/12.2055256
- Ginzburg et al. (2016) Ginzburg S., Schlichting H. E., Sari R., 2016, ApJ, 825, 29
- Guerrero et al. (2021) Guerrero N. M., et al., 2021, The Astrophysical Journal Supplement Series, 254, 39
- Gupta & Schlichting (2020) Gupta A., Schlichting H. E., 2020, MNRAS, 493, 792
- Helled et al. (2015) Helled R., Lozovsky M., Zucker S., 2015, Monthly Notices of the Royal Astronomical Society: Letters, 455, L96
- Hellier et al. (2019) Hellier C., et al., 2019, Monthly Notices of the Royal Astronomical Society, 488, 3067
- Husser et al. (2013) Husser T. O., Wende-von Berg S., Dreizler S., Homeier D., Reiners A., Barman T., Hauschildt P. H., 2013, A&A, 553, A6
- Jenkins (2002) Jenkins J. M., 2002, The Astrophysical Journal, 575, 493
- Jenkins et al. (2010) Jenkins J. M., et al., 2010, in Radziwill N. M., Bridger A., eds, Proceedings of SPIE Vol. 7740, Software and Cyberinfrastructure for Astronomy. SPIE, p. 77400D, doi:10.1117/12.856764, https://doi.org/10.1117/12.856764
- Jenkins et al. (2020) Jenkins J. M., et al., 2020, Kepler Science Document KSCI-19081-003
- Jensen (2013) Jensen E., 2013, Tapir: A web interface for transit/eclipse observability, Astrophysics Source Code Library (ascl:1306.007)
- Jin et al. (2014) Jin S., Mordasini C., Parmentier V., van Boekel R., Henning T., Ji J., 2014, ApJ, 795, 65
- Johnstone et al. (2021) Johnstone C. P., Bartel M., Güdel M., 2021, A&A, 649, A96
- Jordán et al. (2020) Jordán A., et al., 2020, The Astronomical Journal, 160, 222
- Kipping (2013) Kipping D. M., 2013, MNRAS, 435, 2152
- Kislyakova et al. (2013) Kislyakova K. G., et al., 2013, Astrobiology, 13, 1030
- Kubyshkina et al. (2018) Kubyshkina D., et al., 2018, ApJ, 866, L18
- Kumar et al. (2019) Kumar R., Carroll C., Hartikainen A., Martin O. A., 2019, The Journal of Open Source Software
- Kupke et al. (2012) Kupke R., et al., 2012, in Ellerbroek B. L., Marchetti E., Véran J.-P., eds, Society of Photo-Optical Instrumentation Engineers (SPIE) Conference Series Vol. 8447, Adaptive Optics Systems III. p. 84473G, doi:10.1117/12.926470
- Kurucz (1993) Kurucz R. L., 1993, SYNTHE spectrum synthesis programs and line data
- Lafarga et al. (2023) Lafarga M., et al., 2023, Monthly Notices of the Royal Astronomical Society, p. stad480
- Lammer et al. (2003) Lammer H., Selsis F., Ribas I., Guinan E. F., Bauer S. J., Weiss W. W., 2003, ApJ, 598, L121
- Li et al. (2019) Li J., Tenenbaum P., Twicken J. D., Burke C. J., Jenkins J. M., Quintana E. V., Rowe J. F., Seader S. E., 2019, PASP, 131, 024506
- Lopez et al. (2012) Lopez E. D., Fortney J. J., Miller N., 2012, ApJ, 761, 59
- Lovis & Pepe (2007) Lovis C., Pepe F., 2007, Astronomy & Astrophysics, 468, 1115
- Luger et al. (2019a) Luger R., Agol E., Foreman-Mackey D., Fleming D. P., Lustig-Yaeger J., Deitrick R., 2019a, AJ, 157, 64
- Luger et al. (2019b) Luger R., Agol E., Foreman-Mackey D., Fleming D. P., Lustig-Yaeger J., Deitrick R., 2019b, The astronomical journal, 157, 64
- Lundkvist et al. (2016) Lundkvist M., et al., 2016, Nature Communications, 7, 11201
- Mayor & Queloz (1995) Mayor M., Queloz D., 1995, Nature, 378, 355
- Mayor et al. (2003) Mayor M., et al., 2003, The Messenger, 114, 20
- Mazeh et al. (2016) Mazeh T., Holczer T., Faigler S., 2016, Astronomy & Astrophysics, 589, A75
- McCully et al. (2018) McCully C., Volgenau N. H., Harbeck D.-R., Lister T. A., Saunders E. S., Turner M. L., Siiverd R. J., Bowman M., 2018, in Proc. SPIE. p. 107070K (arXiv:1811.04163), doi:10.1117/12.2314340
- McGurk et al. (2014) McGurk R., et al., 2014, in Marchetti E., Close L. M., Vran J.-P., eds, Society of Photo-Optical Instrumentation Engineers (SPIE) Conference Series Vol. 9148, Adaptive Optics Systems IV. p. 91483A (arXiv:1407.8205), doi:10.1117/12.2057027
- Mistry et al. (2023a) Mistry P., et al., 2023a, arXiv preprint arXiv:2301.09865
- Mistry et al. (2023b) Mistry P., et al., 2023b, Monthly Notices of the Royal Astronomical Society, p. stad543
- Otegi et al. (2020) Otegi J. F., Bouchy F., Helled R., 2020, A&A, 634, A43
- Owen & Lai (2018a) Owen J. E., Lai D., 2018a, Monthly Notices of the Royal Astronomical Society, 479, 5012
- Owen & Lai (2018b) Owen J. E., Lai D., 2018b, MNRAS, 479, 5012
- Owen & Wu (2013) Owen J. E., Wu Y., 2013, ApJ, 775, 105
- Owen & Wu (2017) Owen J. E., Wu Y., 2017, ApJ, 847, 29
- Paegert et al. (2022) Paegert M., Stassun K. G., Collins K. A., Pepper J., Torres G., Jenkins J., Twicken J. D., Latham D. W., 2022, VizieR Online Data Catalog, p. IV/39
- Pepe et al. (2002) Pepe F., et al., 2002, The Messenger, 110, 9
- Rogers & Owen (2021) Rogers J. G., Owen J. E., 2021, MNRAS, 503, 1526
- Salvatier et al. (2016a) Salvatier J., Wieckiâ T. V., Fonnesbeck C., 2016a, Astrophysics Source Code Library, pp ascl–1610
- Salvatier et al. (2016b) Salvatier J., Wiecki T. V., Fonnesbeck C., 2016b, PeerJ Computer Science, 2, e55
- Santos et al. (2013) Santos N. C., et al., 2013, A&A, 556, A150
- Savel et al. (2020) Savel A. B., Dressing C. D., Hirsch L. A., Ciardi D. R., Fleming J. P. C., Giacalone S. A., Mayo A. W., Christiansen J. L., 2020, AJ, 160, 287
- Savel et al. (2022) Savel A. B., Hirsch L. A., Gill H., Dressing C. D., Ciardi D. R., 2022, PASP, 134, 124501
- Schlegel et al. (1998) Schlegel D. J., Finkbeiner D. P., Davis M., 1998, ApJ, 500, 525
- Seidel et al. (2022) Seidel J. V., et al., 2022, MNRAS, 513, L15
- Skrutskie et al. (2006) Skrutskie M. F., et al., 2006, AJ, 131, 1163
- Smith et al. (2012) Smith J. C., et al., 2012, Publications of the Astronomical Society of the Pacific, 124, 1000
- Sneden (1973) Sneden C. A., 1973, PhD thesis, THE UNIVERSITY OF TEXAS AT AUSTIN.
- Sousa (2014) Sousa S. G., 2014, [arXiv:1407.5817],
- Sousa et al. (2015) Sousa S. G., Santos N. C., Adibekyan V., Delgado-Mena E., Israelian G., 2015, A&A, 577, A67
- Stassun & Torres (2016) Stassun K. G., Torres G., 2016, AJ, 152, 180
- Stassun & Torres (2021) Stassun K. G., Torres G., 2021, ApJ, 907, L33
- Stassun et al. (2017) Stassun K. G., Collins K. A., Gaudi B. S., 2017, AJ, 153, 136
- Stassun et al. (2018) Stassun K. G., Corsaro E., Pepper J. A., Gaudi B. S., 2018, AJ, 155, 22
- Stevenson et al. (2022) Stevenson D. J., Bodenheimer P., Lissauer J. J., D’Angelo G., 2022, The Planetary Science Journal, 3, 74
- Stumpe et al. (2012) Stumpe M. C., et al., 2012, Publications of the Astronomical Society of the Pacific, 124, 985
- Stumpe et al. (2014) Stumpe M. C., Smith J. C., Catanzarite J. H., Van Cleve J. E., Jenkins J. M., Twicken J. D., Girouard F. R., 2014, Publications of the Astronomical Society of the Pacific, 126, 100
- Sullivan et al. (2015) Sullivan P. W., et al., 2015, The Astrophysical Journal, 809, 77
- Szabó & Kiss (2011) Szabó G. M., Kiss L., 2011, The Astrophysical Journal Letters, 727, L44
- Theano Development Team (2016) Theano Development Team 2016, arXiv e-prints, abs/1605.02688
- Tokovinin (2018) Tokovinin A., 2018, PASP, 130, 035002
- Torres et al. (2010) Torres G., Andersen J., Giménez A., 2010, A&ARv, 18, 67
- Twicken et al. (2018) Twicken J. D., et al., 2018, PASP, 130, 064502
- Vallenari et al. (2022) Vallenari A., Brown A., Prusti T., 2022, Astronomy & Astrophysics
- Wright et al. (2011) Wright N. J., Drake J. J., Mamajek E. E., Henry G. W., 2011, ApJ, 743, 48
- Zeng et al. (2016) Zeng L., Sasselov D. D., Jacobsen S. B., 2016, The Astrophysical Journal, 819, 127
- Zeng et al. (2019) Zeng L., et al., 2019, Proceedings of the National Academy of Sciences, 116, 9723
- Ziegler et al. (2020) Ziegler C., Tokovinin A., Briceño C., Mang J., Law N., Mann A. W., 2020, AJ, 159, 19