[1,2,3,4]Lorenzo Lucchini [3,5]Ollin D. Langle-Chimal
1]Centre for Social Dynamics and Public Policy, Bocconi University, Milan, Italy 2]Institute for Data Science and Analytics, Bocconi University, Milan, Italy 3]World Bank Group, Washington, DC, USA 4]Fondazione Bruno Kessler, Trento, Italy 5]University of Vermont, Burlington, VT, USA 6]Massachussets Institute of Technology, Cambridge, MA, USA 7]New York University, New York, NY
8]To whom correspondence should be addressed.
E-mail: sfraiberger@worldbank.org
*]These authors contributed equally to the work
Socioeconomic disparities in mobility behavior during the COVID-19 pandemic in developing countries
Abstract
Mobile phone data have played a key role in quantifying human mobility during the COVID-19 pandemic. Existing studies on mobility patterns have primarily focused on regional aggregates in high-income countries, obfuscating the accentuated impact of the pandemic on the most vulnerable populations. By combining geolocation data from mobile phones and population census for 6 middle-income countries across 3 continents between March and December 2020, we uncovered common disparities in the behavioral response to the pandemic across socioeconomic groups. When the pandemic hit, urban users living in low-wealth neighborhoods were less likely to respond by self-isolating at home, relocating to rural areas, or refraining from commuting to work. The gap in the behavioral responses between socioeconomic groups persisted during the entire observation period. Among low-wealth users, those who used to commute to work in high-wealth neighborhoods pre-pandemic were particularly at risk, facing both the reduction in activity in the high-wealth neighborhood and being more likely to be affected by public transport closures due to their longer commute distances. While confinement policies were predominantly country-wide, these results suggest a role for place-based policies informed by mobility data to target aid to the most vulnerable.
keywords:
human mobility, mobile phone data, COVID-19, developing countries1 Introduction
Since its emergence in late 2019, SARS-CoV-2 has led to millions of infections and deaths worldwide, disrupted economies, strained healthcare systems, and caused social and psychological challenges for many individuals and communities at an unprecedented scale. With no vaccine in sight in the early stages of the pandemic, governments and local authorities quickly implemented non-pharmaceutical interventions (NPIs), such as stay-at-home orders or workplace closures, aiming to reduce physical contacts [1, 2, 3, 4, 5, 6]. Such measures coupled with the fear of the virus triggered an unimaginable reduction in mobility, which contributed to slowing down the spread of the disease [7, 8, 9, 10]. However, these policies were predominantly untargeted, with little regard to socioeconomic status or need, prompting questions on the differentiated impact of the pandemic on the most vulnerable populations [11].
Over the past decade, mobile phone data have become the primary source of real-time disaggregated information on human movements [12, 13, 14], and this trend has accelerated during the pandemic [15, 16, 17, 18]. Quantifying human mobility in real-time has been key to anticipating the evolution of the virus and the resulting economic shock. Previous works quantifying mobility during the pandemic, from epidemiological surveillance [19, 20] to policy impact evaluation [21], predominantly focused on high-income countries [22]. While some of these studies have shown that the pandemic has had a more pronounced impact on the most vulnerable [23, 24, 25, 26, 27, 28, 29], little is known on the socioeconomic disparities in mobility behavior across middle-income economies. Existing studies on mobility in middle-income countries either focused on aggregated trends without taking into account socioeconomic backgrounds [30, 31] or on country-specific case studies [32, 33, 34].
Here, we provided a fine-grained analysis of human mobility across 6 middle-income countries, spanning over 3 continents, during the period from March 2020 to December 2020. Using GPS location data from the mobile device applications of 281 million users, we developed a methodology based on spatiotemporal clustering to accurately infer how a user allocated their time between their home, their workplace, and other locations that they visit. By assigning to each user a wealth proxy derived from census data on the administrative unit where they live, we then characterized the propensity of mobile phone users of various socioeconomic groups to self-isolate at home, relocate to a rural area, or commute to work.
We found that the wealth of the neighborhood where a user lives is a strong determinant of their mobility behavior during the pandemic, and our results are remarkably consistent across countries. Relative to the pre-pandemic period, users living in an administrative unit of a metropolitan area where the top 20% richest people are located (“high-wealth place”) were times more likely to self-isolate than those living in the bottom 40% (“low-wealth place”), they were times more likely to relocate to a rural area once the pandemic hit, and times more likely to stop commuting to work. While users’ mobility slowly started to revert toward pre-pandemic levels, the gap in the behavioral response across socioeconomic groups persisted over the entire observation period. Furthermore, by specifically focusing on users living in low-wealth places, we found that those who used to commute to high-wealth places prior to the pandemic stopped commuting times more during the observation period than those who used to commute to low-wealth places. Using a dataset of policy actions standardized across countries, we also discovered that the closure of public transportation was associated with a stronger reduction in commuting for low-wealth users who used to commute to high-wealth places, whereas it had no significant impact on those commuting to low-wealth places. As the ability of the poor to work from home is extremely limited in most developing countries and in particular for low-wealth individuals [35, 36], these findings suggest that attention to vulnerable groups is needed when untargeted policies are implemented. Our results also indicate that, when data to identify vulnerable individuals are not available, place-based policies informed by mobile phone data can be a good substitute to target aid to vulnerable groups.
2 Results
2.1 Inferring location type and time use
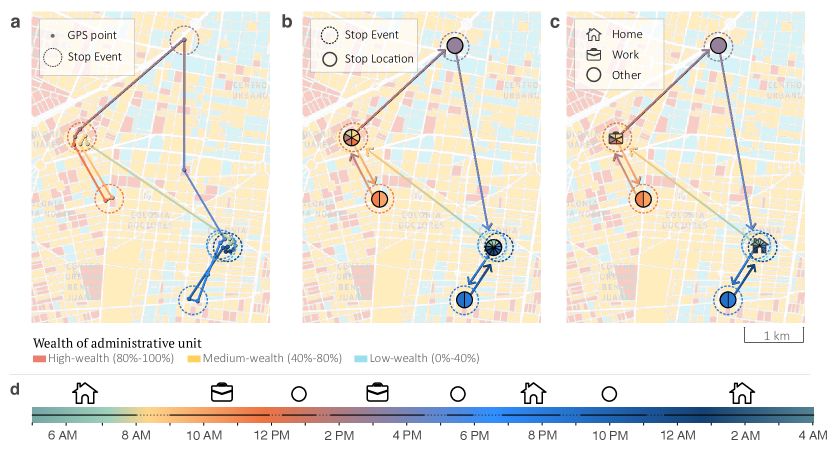
Our GPS dataset comes from Veraset [37] and contains the anonymized timestamped geocoordinates of 281 million mobile phone users located in 6 middle-income countries –Brazil, Colombia, Indonesia, Mexico, Philippines, and South Africa– between January 1st and December 31st, 2020 (“observation period”). We discarded occasional users to focus on the longitudinal behavior of 1.35% of users active on at least of days during the observation period and at least of days between January 1st and March 15th (“pre-pandemic period”). To uncover how users spent their time, we first applied a spatiotemporal clustering algorithm to convert their GPS coordinates into a sequence of stop events where a user spent at least 5 minutes within a 25 meter distance (Figure 1). We then spatially clustered stop events to identify unique locations repeatedly visited by a user over time (“stop locations”). Finally, we classified stop locations as home, workplace, or other based on how frequently they were visited during the observation period and the hours of the day at which a visit occurred. A manually annotated sample of 500 users’ trajectories enabled us to obtain optimal parameter values for our classifier of location type, which reached an out-of-sample classification accuracy of 80% (see Sec. SI 5). Taken together, these steps allowed us to convert a mobile user trajectory into a non-continuous time series of stop events labeled by location type.
2.2 Classifying users by wealth
In the absence of socioeconomic data on individual users, we used the most recent population census in each country to generate a proxy of their wealth from that of the administrative unit where they live [38]. We estimated a one-dimensional wealth index from data on asset ownership and access to services for the most disaggregated level of administrative units in each country (see Materials and Methods). We then assigned to each user the wealth index of the administrative unit where their most frequently visited home during the pre-pandemic period was located (“primary home”). This procedure allowed us to quantify how users who differ by the wealth of their primary home’s administrative unit allocated their time between their homes, their workplaces, and other locations over time. In what follows, we restricted our analysis to the of frequent users whose primary home is located in one of the five most populated cities of each country, where mobile phone users are concentrated. (see Tab. 1 in Material and Methods).
2.3 Self-isolating at home
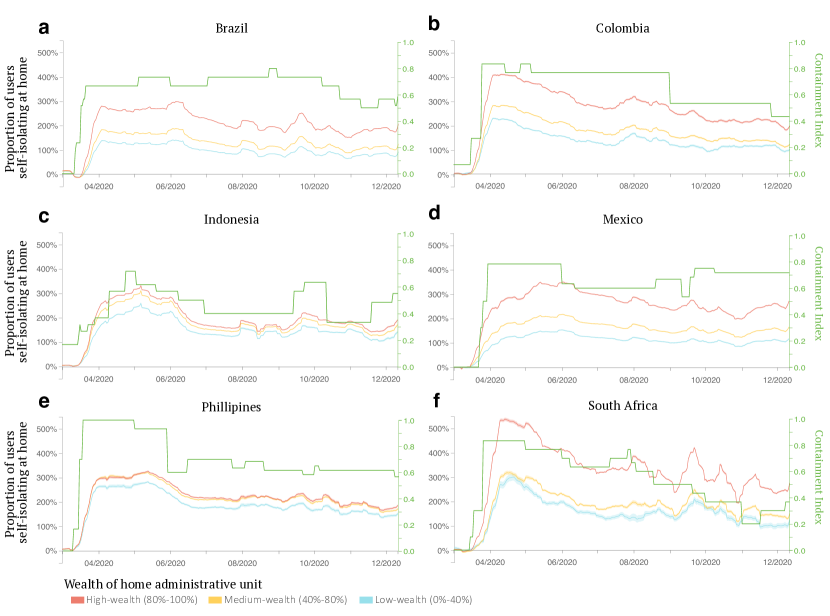
To characterize mobility behavior during the pandemic, we started by focusing on the propensity of users to self-isolate at home relative to the pre-pandemic period (Fig. 2). In the early stages of the pandemic when no vaccines were available, home self-isolation was the most efficient way to avoid getting infected. We found that, on average, the proportion of high-wealth users self-isolating at home increased about 78% more than that of low-wealth users – 252% versus 141%. The gap between high- and low-wealth groups’ propensity to self-isolate is observed across all 6 countries in our sample, ranging from a difference of 36% for the Philippines to 175% for South Africa. While 55% of users kept spending some of their time outside of home, time spent at home increased on average by 19% for the high-wealth group versus 13% for the low-wealth group. The reduction in time spent outside of home was primarily driven by a reduction in time spent at work, which dropped by 40% on average for the high-wealth group while only 29% for the low-wealth one after the pandemic declaration (Fig. SI 3), suggesting that the capacity to work from home was the main determining factor in the decision to self-isolate. Although the mobility of all socioeconomic groups gradually started to revert back to its pre-pandemic level, the gap between high- and low-wealth groups persisted, indicating that low-wealth groups remained more exposed to physical contact during the observation period.
2.4 Relocating to rural areas
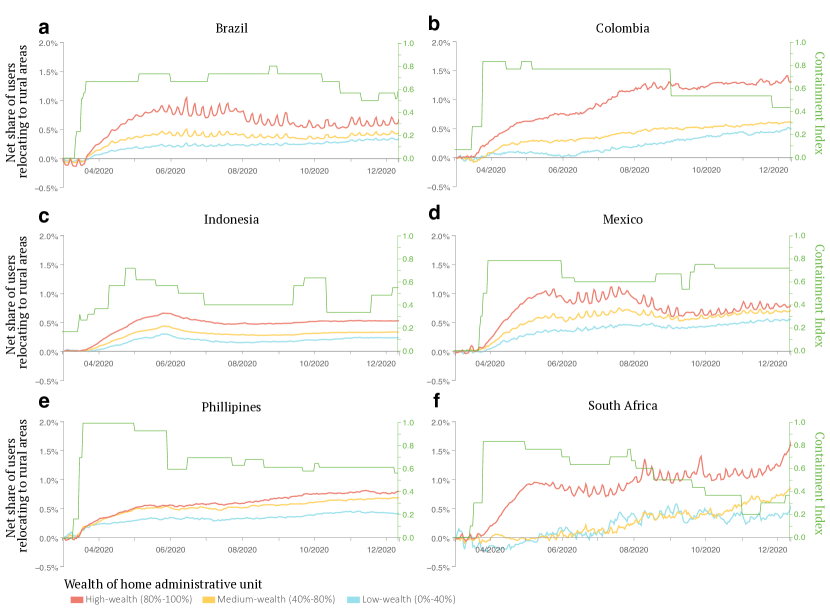
Quantifying population movements between urban and rural areas is key to uncovering how the virus propagated geographically within countries and provides some insights into the capacity of mobile users to respond to the evolution of the pandemic and mobility restrictions. Thanks to our dynamic classification of home locations, we could identify users relocating during the observation period (Fig. 3). Across all 30 cities in our sample, we find that a net flow of about 0.61% of users relocated to rural areas during the first 3 months of the pandemic. Users in the high-wealth group were on average 159% more likely to relocate compared to those in the low-wealth groups, with these average gaps ranging from a 79% difference for the Philippines to a 355% difference for South Africa which faced the largest relocation gap between socioeconomic groups. Relocation flows then remained relatively flat in the latter half of 2020. These patterns are consistent with the more risk-averse users living in high-wealth administrative units having more options than low-wealth users to relocate to less densely populated rural areas to minimize physical contact. Similar results were obtained in high-income countries [39], highlighting the potential acceleration of the virus propagation caused by high-wealth individuals having relocated to rural areas.
2.5 Commuting patterns
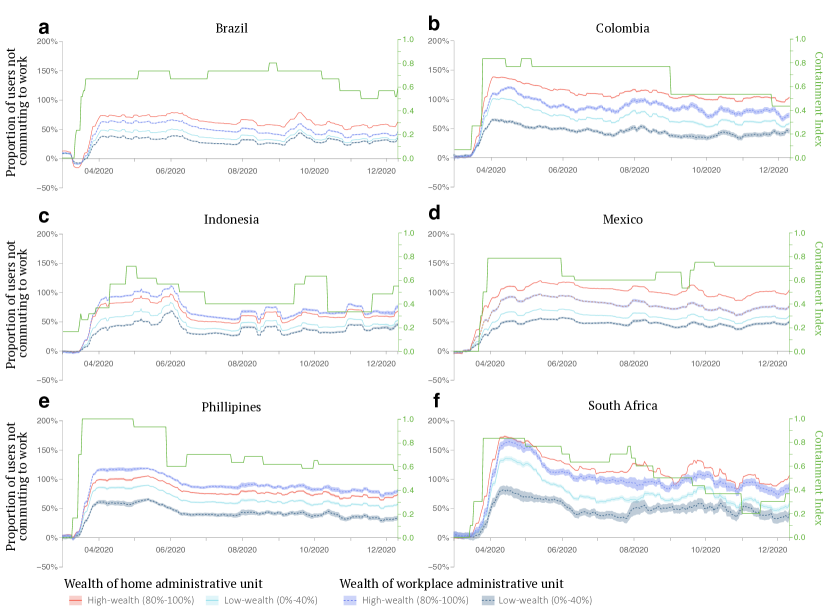
A key challenge of untargeted confinement policies stems from the uneven ability to work from home across socioeconomic groups. While this issue has extensively been documented in high-income countries, it is exacerbated in developing countries where only a small fraction of rich individuals can work remotely due to the structure of labor markets, higher levels of informal employment, reduced internet access, and a lack of compensatory income support [35]. To shed light on these issues, we estimate users’ propensity to commute relative to the pre-pandemic period (Fig. 4). Although we do not have fine-grained measures of changes in unemployment, we hypothesize that low-wealth users lack the ability to work from home, and therefore a change in commuting behavior is a good proxy for a change in employment status for this group. We find that the proportion of users who stopped commuting increased sharply in all countries in the early stage of the pandemic. It then reverted before stabilizing in the latter half of 2020. Consistent with our findings on self-isolating behavior, users in the high-wealth group were 52% times more likely to stop commuting compared to users in the low-wealth group once the pandemic started. The difference between high- and low-wealth groups ranges from 23% for the Philippines to 74% for Mexico. We then separated low-wealth users by the wealth of the administrative unit where they used to commute during the pre-pandemic period. Those who used to commute to high-wealth neighborhoods were about 89% more likely to stop commuting than those who used to commute to low-wealth neighborhoods. These results are consistent with existing studies of high-income countries [40, 41]: high-wealth users’ decision to self-isolate led to a reduction in demand for goods and services in high-wealth neighborhoods where they live. This, in turn, predominantly impacted the employment prospects of low-wealth users who used to work in high-wealth neighborhoods before the pandemic started.
2.6 Policy restrictions and mobility behavior
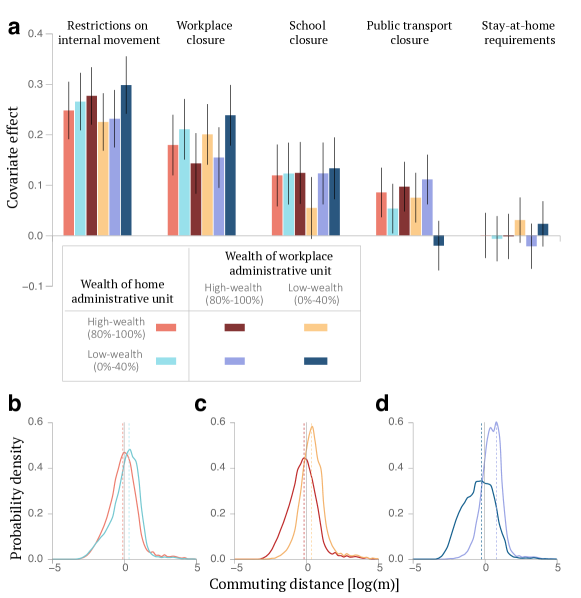
Taken together, our results indicate that users’ mobility changed sharply during the first weeks of the pandemic, predominantly for users located in high-wealth neighborhoods, generating a socioeconomic gap that persisted during the entire observation period. These findings call into question the extent to which government interventions imposing restrictions on mobility to reduce the spread of infections contributed to this gap. We, therefore, analyzed the statistical associations between containment measures –restrictions on internal movement, school closure, workplace closure, public transport closure, and stay-at-home requirements– and mobility. We specifically focused on the fraction of users commuting to work across wealth groups, an outcome of utmost importance to characterize the distributional impact of containment policies on jobs in a timely fashion. We estimated a multivariate panel regression model for each wealth group, which includes local and global incidence of cases obtained from Our World in Data [42], and stringency indices of policy restrictions from the Oxford COVID-19 Government Response Tracker [43]. All the explanatory variables are independently standardized for each wealth group, therefore our panel regression with fixed effects can be used to elicit relative differences between group-specific responses to containment measures (see Materials and Methods).
The majority of policy restrictions during the observation period were implemented country-wide within a short time frame in the first weeks of the pandemic when people’s risk perception of the virus also shifted abruptly (Fig. SI 27). It is therefore difficult to tease out the effect of a single policy enactment happening during this period. To overcome this issue, we estimated our model from April , –one month after the pandemic declaration– to December , (see Sec. SI 10B for additional results over the entire pandemic period). Except for stay-at-home requirements, we found that all containment policies were associated with a higher fraction of users who stopped commuting to work (Fig 5a). As we excluded the first month of the pandemic from the analysis, we did not find a significant difference in mobility response between high- and low-wealth users. However, by focusing specifically on low-wealth users, we found that public transport closures were associated with a significant reduction in commuting for users commuting to high-wealth neighborhoods (coefficient=, confidence interval). By contrast, low-wealth users commuting to low-wealth neighborhoods were not significantly affected by such measures. These findings reflect the fact that low-wealth users working in high-wealth neighborhoods are those commuting the longest distances on average, therefore often relying on public transport to get to work, while those working in low-wealth neighborhoods have the shortest commuting distances (Fig. 5b-d). Without conditioning by the wealth of workplace neighborhood, average commuting distances are not statistically different between wealth groups based on their home location, stressing the value of having detailed information on individual users to characterize their behavior.
3 Discussion
GPS data from personal mobile devices have played a key role in providing timely information to quantify the impact of the COVID-19 pandemic. Here, we focused on four upper-middle income countries [22] –Brazil, Colombia, Mexico, and South Africa– and two lower-middle income countries –Indonesia and Philippines– from Latin America, Sub-Saharan Africa, and South East Asia to elicit common disparities across socioeconomic groups in the behavioral responses to the pandemic and containment measures. By analyzing longitudinal data over one year, we quantified the behavior of mobile users living in urban areas in terms of their propensity to self-isolate at home, relocate to rural areas, and suspend their daily commute.
We uncovered a consistent socioeconomic gap in the percentage of users who adapted their mobility behavior in response to the pandemic. Individuals from high-wealth socioeconomic groups were more likely to self-isolate at home and to relocate to rural areas to reduce their exposure to the virus. A greater percentage of high-wealth users stopped their daily commute, reflecting their higher propensity to work from home. On average, we observed wider gaps between high and low-wealth groups in upper-middle-income countries, indicating a greater ability of high-wealth users in these countries to work from home than for lower-middle-income countries [35].
When we focused specifically on the commuting patterns of low-wealth users –who, to a higher degree, lack the ability to work from home– we discovered that in all six countries, those commuting to high-wealth neighborhoods pre-pandemic were more likely to stop commuting during the pandemic than those commuting to low-wealth neighborhoods. By limiting their outside activities or abandoning urban areas, high-wealth individuals amplified the economic shock affecting low-wealth individuals working in high-wealth neighborhoods. Furthermore, owing to their longer commuting distances, low-wealth users working in high-wealth neighborhoods were also more likely to stop commuting following public transport closures, whereas the commuting behavior of those working in low-wealth neighborhoods was not significantly affected by this policy restriction. Taken together, these results indicate that individuals living in low-wealth neighborhoods and working in high-wealth neighborhoods were disproportionately burdened in their ability to work.
These results illustrate the delicate balance between ensuring a forceful response to a pandemic and the unintended consequences resulting from untargeted interventions, which could disproportionately impact economically vulnerable groups. While targeting based on individual information is always preferred, information may not be available or it may be difficult to acquire in cases of emergency where time is of the essence. In such cases, place-based policy interventions may provide an alternative for effective targeting and optimally distributing additional support to the most vulnerable. As developing countries often lack the possibility to access up-to-date information on individuals [44], mobile data could provide a tool to implement such targeted policies in a timely fashion and respond to future pandemics more appropriately.
4 Materials and Methods
4.1 Datasets
Population census
We collected data from the most recent population census in each country to construct a wealth index measuring the socioeconomic level of an administrative unit. We used data on the level of education, access to health services, assets’ ownership, and various household and social characteristics for the smallest administrative unit available. These different dimensions are then aggregated into a single index using principal component analysis to produce a one-dimensional wealth index of an administrative unit [45, 46].
Administrative boundaries
Administrative boundaries consist of geolocalized polygons with unique identifiers. They were retrieved from the National Institute of Statistics or the National Institute of Geography website for each country. The spatial-resolution level varies depending on the country. All the administrative boundary files share at least four common administrative levels: national, regional, urban, and suburban units. Administrative boundaries were used to compute the wealth index and mobility patterns across socioeconomic groups.
Urban extents
Urban extents were obtained from the GHS Urban Centre Database (GHS-UCDB). It characterizes spatial entities called “urban centers” according to a set of multitemporal thematic attributes gathered from the Global Human Settlement Layer sources and integrated with other sources available in the open scientific domain. The urban centers are defined by specific cut-off values on resident population and built-up surface share in a 1x1 km uniform global grid. As such, urban extents are defined as contiguous cells (without diagonals and with gap filling) with a density of at least 1,500 inhabitants/ and a minimum of 50,000 inhabitants. This dataset has global coverage and is therefore well-suited for multi-country applications.
Veraset movements
Mobile data were provided by the data company Veraset. It consists of the anonymized timestamped GPS coordinates of mobile devices, covering about of the global population. Their data is sourced from thousands of Software Development Kits (SDKs), which reduces sampling biases [37].
4.2 Mobility data processing
We present a brief description of the procedure to infer relevant information about individual users. We refer to a single GPS point within an individual’s trajectory as “ping”. Each ping has an associated accuracy measure providing an estimate of the coordinates’ precision. Starting from a collection of trajectories we perform a series of steps to identify the types of locations being visited by a user [6]:
-
1.
First, we aggregate pings into stop events, which are clusters of spatiotemporally contiguous pings (for more details, see Sec. SI 3A).
-
2.
Second, we perform an additional spatial clustering step to aggregate stop events that are close enough to be associated with a single location.
- 3.
-
4.
Fourth, we restrict the set of users to those who appear in our records at least once per day for at least of the days pre-pandemic, and of the days during the observation period (see Sec. SI 3B for additional details).
After these processing steps, we associated each user with a wealth proxy based on the administrative unit where their primary home location is located (Tab. 1). To precisely connect mobility with demographic data at the smallest sub-urban scale available, further processing is required, which we describe in Sec. SI 4.
| BR | CO | ID | MX | PH | ZA | |
|---|---|---|---|---|---|---|
| Active users | 1514679 | 142933 | 1205827 | 676775 | 104681 | 144445 |
| GPS points | 3.9e10 | 2.9e9 | 1.9e10 | 1.7e10 | 1.9e9 | 3.4e9 |
| Stop events | 1452M | 103M | 893M | 656M | 75M | 154M |
| Stop locations | 111M | 8M | 76M | 50M | 5M | 12M |
| Population fraction | 1.7% | 0.5% | 1.0% | 1.6% | 0.2% | 0.7% |
| Median area [] | 0.067 | 0.003 | 2.352 | 0.005 | 0.483 | 1.191 |
Reweighting and wealth labels
GPS data, sourced from mobile phones, are known to potentially introduce biases due to an uneven distribution of wealth among the devices’ owners [52, 53]. These biases need to be taken into account in the process of assigning labels to individuals and aggregating them into groups. In general, official demographic data are associated with single individuals based on the smallest sub-urban areas available for each country. While demographic data from the National Institutes of Statistics of each country (see Sec. 4.1) can be considered as an unbiased information source, the process with which we link them with individual GPS information and aggregate them in groups afterward could drastically impact the reliability of the analyses. A simplistic approach would be to group individuals with lower wealth values, based on the wealth of the administrative unit their home location falls in. This would create groups based on mobile-phone user percentiles of wealth. In this framework, given a sample of users, the users with lower wealth would be labeled as “low-wealth individuals”. However, this would automatically transfer biases within the user base into biased wealth groups. Our population-based reweighting approach, in contrast, consists of a top-down classification of wealth groups. Administrative units with which at least one user is associated are considered and divided into wealth categories based both on their average wealth and on the fraction of the population living there. High-wealth, Medium-wealth, and Low-wealth labels are then associated with each administrative unit considering discrete percentile groups. Thus, “low-wealth individuals” will only be represented by those users living in administrative units whose wealth is in the lower of the population wealth (and not the user wealth). We stress that we consider as a population the total number of residents living in all retained administrative units as provided by the most recent demographic data before the pandemic was declared. Table 2 reports the percentages of mobile-phone users in our dataset divided into the three wealth groups that were considered in this analysis. More precisely, high-wealth individuals represent the wealthiest of the population and account, on average, for more than of the user base. In contrast, low-wealth individuals represent the less-wealthy of the population and only accounts for of the mobile-phone user base on average.
| BR | CO | MX | ID | PH | ZA | |
|---|---|---|---|---|---|---|
| High wealth | 42.17 % | 36.75 % | 39.85 % | 36.58 % | 39.48 % | 76.77 % |
| Medium wealth | 34.75 % | 41.51 % | 38.87 % | 44.95 % | 39.91 % | 18.3 % |
| Low wealth | 23.08 % | 21.74 % | 21.27 % | 18.46 % | 20.61 % | 4.93 % |
Commute distances
To compute distances between home and work locations in Fig. 5, we process individual-level information. We take the logarithm of distances to regularize the distribution. Then, log distances are standardized by subtracting the average of all users in a wealth group and dividing by the standard deviation, such that all distributions are centered around with a width of .
4.3 Panel regression model
We model the association between mobility indicators and policy restrictions for different socioeconomic groups. Mobility indicators by socioeconomic group are determined by the socioeconomic status of the home and work location of a user. In this framework, the standardized mobility of group in country is modelled as:
where is a cross-country free parameter capturing the group-specific association with the global incidence of COVID-19 reported cases (), is the cross-country free parameter, pooled over all countries in our panel, to capture the association of the dependant variable with the local incidence of cases (), and are coefficients modeling the policy effect on mobility for the -group. Five different policy types are included in the model discussed in Sec. 2.6: school closure policies, workplace closure policies, public transport closures, internal movement restrictions, and stay-at-home orders. is the index associated with the policy and is the corresponding group association coefficient. The choice of the components to include in the model is based on the hierarchical selection of the most important components in a modeling framework where policies are grouped in summary indices (containment, economic, and health) [43]. Model selection is performed using the Bayesian Information Criterion (BIC) comparing models with different covariate compositions. Selection robustness tests, performed on single countries as well as on single wealth-groups BIC values, provide consistent results in terms of model selection. Multicollinearity tests are performed in terms of the Variance Inflation Factor (VIF) and only models which do not present any factor with are included among those to be selected (see Sec. SI 10A). The estimated coefficients reported in the main manuscript are those referring to the policy covariates and are estimated on the period starting from April 11th, 2020, and spanning until January 1st, 2021. Extensive robustness testing is performed to ensure the results’ reliability. In Sec. SI 10B, we show parameter estimates for the different policy covariates performing the regression i) over a different time window, and ii) excluding from the regression one country at a time (to ensure stability over country selection). We refer to Sec. SI 10 for more details on the model. It is important to stress that the adopted framework accounts for inter-country and inter-wealth-group differences using both standardized covariates and target variables for each country and wealth group.
While other modeling techniques –such as diff-in-diff and event studies– can provide stronger causality claims on the effect of policies on group behavior, the choice of modeling mobility behavior using a panel regression model is motivated by the fact that (i) selecting non-overlapping events and (ii) finding a reliable “untreated” reference population is not possible with policies being enacted/revoked in concomitant periods and with the continuously changing underlying epidemiological situation. Modeling group behavior in terms of a linear combination of epidemiological conditions and intensity of containment policies partially solves these issues allowing for an in-depth analysis of the association between different policy types and individual behavioral responses. Nevertheless, it is important to stress that the results obtained with this approach cannot be interpreted as causal relations between the outcome variable and its covariates.
Author contributions
L.L. and S.F. conceived the original idea and planned the experiments. A.C., A.M. provided geographical and demographic information. L.L., O.L.C., L.C., and L.M. processed the mobility data and carried out the experiments. L.L., O.L.C., B.L., N.L.G, and S.F. contributed to the interpretation of the results and wrote the manuscript.
Competing Interests
The authors declare no competing interests.
Acknowledgements
L.L. thanks G.K. for the insightful discussions and for his support during the entire project development. L.L. has been supported by the ERC project “IMMUNE” (Grant agreement ID: 101003183). The findings, interpretations, and conclusions expressed in this paper are entirely those of the authors. They do not necessarily represent the views of the International Bank for Reconstruction and Development/World Bank and its affiliated organizations, or those of the Executive Directors of the World Bank or the governments they represent.
References
- \bibcommenthead
- Tian et al. [2020] Tian, H., Liu, Y., Li, Y., Wu, C.-H., Chen, B., Kraemer, M.U., Li, B., Cai, J., Xu, B., Yang, Q., et al.: An investigation of transmission control measures during the first 50 days of the covid-19 epidemic in china. Science 368(6491), 638–642 (2020)
- Gatto et al. [2020] Gatto, M., Bertuzzo, E., Mari, L., Miccoli, S., Carraro, L., Casagrandi, R., Rinaldo, A.: Spread and dynamics of the covid-19 epidemic in italy: Effects of emergency containment measures. Proceedings of the National Academy of Sciences 117(19), 10484–10491 (2020)
- Chinazzi et al. [2020] Chinazzi, M., Davis, J.T., Ajelli, M., Gioannini, C., Litvinova, M., Merler, S., Piontti, A.P., Mu, K., Rossi, L., Sun, K., et al.: The effect of travel restrictions on the spread of the 2019 novel coronavirus (covid-19) outbreak. Science 368(6489), 395–400 (2020)
- Kraemer et al. [2020] Kraemer, M.U.G., Yang, C.-H., Gutierrez, B., Wu, C.-H., Klein, B., Pigott, D.M., Plessis, L., Faria, N.R., Li, R., Hanage, W.P., Brownstein, J.S., Layan, M., Vespignani, A., Tian, H., Dye, C., Pybus, O.G., Scarpino, S.V.: The effect of human mobility and control measures on the covid-19 epidemic in china. Science 368(6490), 493–497 (2020) https://doi.org/10.1126/science.abb4218
- Perra [2021] Perra, N.: Non-pharmaceutical interventions during the covid-19 pandemic: A review. Physics Reports 913, 1–52 (2021)
- Lucchini et al. [2021] Lucchini, L., Centellegher, S., Pappalardo, L., Gallotti, R., Privitera, F., Lepri, B., De Nadai, M.: Living in a pandemic: changes in mobility routines, social activity and adherence to covid-19 protective measures. Scientific reports 11(1), 1–12 (2021)
- Pullano et al. [2020] Pullano, G., Valdano, E., Scarpa, N., Rubrichi, S., Colizza, V.: Evaluating the effect of demographic factors, socioeconomic factors, and risk aversion on mobility during the covid-19 epidemic in france under lockdown: a population-based study. The Lancet Digital Health 2(12), 638–649 (2020) https://doi.org/10.1016/S2589-7500(20)30243-0
- Woskie et al. [2021] Woskie, L.R., Hennessy, J., Espinosa, V., Tsai, T.C., Vispute, S., Jacobson, B.H., Cattuto, C., Gauvin, L., Tizzoni, M., Fabrikant, A., Gadepalli, K., Boulanger, A., Pearce, A., Kamath, C., Schlosberg, A., Stanton, C., Bavadekar, S., Abueg, M., Hogue, M., Oplinger, A., Chou, K., Corrado, G., Shekel, T., Jha, A.K., Wellenius, G.A., Gabrilovic, E.: Early social distancing policies in europe, changes in mobility & covid-19 case trajectories: Insights from spring 2020. PloS ONE 16(6), 0253071 (2021)
- Lai et al. [2020] Lai, S., Ruktanonchai, N.W., Zhou, L., Prosper, O., Luo, W., Floyd, J.R., Wesolowski, A., Santillana, M., Zhang, C., Du, X., Yu, H., Tatem, A.J.: Effect of non-pharmaceutical interventions to contain COVID-19 in china. Nature 585(7825), 410–413 (2020) https://doi.org/10.1038/s41586-020-2293-x
- Nouvellet et al. [2021] Nouvellet, P., Bhatia, S., Cori, A., Ainslie, K.E.C., Baguelin, M., Bhatt, S., Boonyasiri, A., Brazeau, N.F., Cattarino, L., Cooper, L.V., Coupland, H., Cucunuba, Z.M., Cuomo-Dannenburg, G., Dighe, A., Djaafara, B.A., Dorigatti, I., Eales, O.D., Elsland, S.L., Nascimento, F.F., FitzJohn, R.G., Gaythorpe, K.A.M., Geidelberg, L., Green, W.D., Hamlet, A., Hauck, K., Hinsley, W., Imai, N., Jeffrey, B., Knock, E., Laydon, D.J., Lees, J.A., Mangal, T., Mellan, T.A., Nedjati-Gilani, G., Parag, K.V., Pons-Salort, M., Ragonnet-Cronin, M., Riley, S., Unwin, H.J.T., Verity, R., Vollmer, M.A.C., Volz, E., Walker, P.G.T., Walters, C.E., Wang, H., Watson, O.J., Whittaker, C., Whittles, L.K., Xi, X., Ferguson, N.M., Donnelly, C.A.: Reduction in mobility and covid-19 transmission. Nature Communications 12(1090) (2021)
- Checo et al. [2022] Checo, A., Grigoli, F., Mota, J.M.: Assessing targeted containment policies to fight covid-19. The BE Journal of Macroeconomics 22(1), 159–196 (2022)
- Fudolig et al. [2021] Fudolig, M.I.D., Monsivais, D., Bhattacharya, K., Jo, H.-H., Kaski, K.: Internal migration and mobile communication patterns among pairs with strong ties. EPJ Data Science 10(1), 16 (2021)
- Alexander et al. [2015] Alexander, L., Jiang, S., Murga, M., González, M.C.: Origin–destination trips by purpose and time of day inferred from mobile phone data. Transportation research part c: emerging technologies 58, 240–250 (2015)
- Jiang et al. [2017] Jiang, S., Ferreira, J., Gonzalez, M.C.: Activity-based human mobility patterns inferred from mobile phone data: A case study of singapore. IEEE Transactions on Big Data 3(2), 208–219 (2017)
- Aleta et al. [2020] Aleta, A., Martin-Corral, D., Piontti, A., Ajelli, M., Litvinova, M., Chinazzi, M., Dean, N.E., Halloran, M.E., Longini Jr, I.M., Merler, S., et al.: Modelling the impact of testing, contact tracing and household quarantine on second waves of covid-19. Nature Human Behaviour 4(9), 964–971 (2020)
- Yabe et al. [2022] Yabe, T., Jones, N.K., Rao, P.S.C., Gonzalez, M.C., Ukkusuri, S.V.: Mobile phone location data for disasters: A review from natural hazards and epidemics. Computers, Environment and Urban Systems 94, 101777 (2022)
- Aleta et al. [2022] Aleta, A., Martin-Corral, D., Bakker, M.A., Piontti, A., Ajelli, M., Litvinova, M., Chinazzi, M., Dean, N.E., Halloran, M.E., Longini Jr, I.M., et al.: Quantifying the importance and location of sars-cov-2 transmission events in large metropolitan areas. Proceedings of the National Academy of Sciences 119(26) (2022)
- Pangallo et al. [2022] Pangallo, M., Aleta, A., Chanona, R., Pichler, A., Martin-Corral, D., Chinazzi, M., Lafond, F., Ajelli, M., Moro, E., Moreno, Y., et al.: The unequal effects of the health-economy tradeoff during the covid-19 pandemic. arXiv preprint arXiv:2212.03567 -(-) (2022)
- Jia et al. [2020] Jia, J.S., Lu, X., Yuan, Y., Xu, G., Jia, J., Christakis, N.A.: Population flow drives spatio-temporal distribution of covid-19 in china. Nature 582(7812), 389–394 (2020) https://doi.org/10.1038/s41586-020-2284-y
- Grantz et al. [2020] Grantz, K.H., Meredith, H.R., Cummings, D.A., Metcalf, C.J.E., Grenfell, B.T., Giles, J.R., Mehta, S., Solomon, S., Labrique, A., Kishore, N., et al.: The use of mobile phone data to inform analysis of covid-19 pandemic epidemiology. Nature communications 11(1), 1–8 (2020)
- Bonaccorsi et al. [2020] Bonaccorsi, G., Pierri, F., Cinelli, M., Flori, A., Galeazzi, A., Porcelli, F., Schmidt, A.L., Valensise, C.M., Scala, A., Quattrociocchi, W., Pammolli, F.: Economic and social consequences of human mobility restrictions under covid-19. Proceedings of the National Academy of Sciences 117(27), 15530–15535 (2020)
- Serajuddin and Hamadeh [2020] Serajuddin, U., Hamadeh, N.: New World Bank country classifications by income level: 2020-2021. Accessed on 2021-08-28 (2020). https://blogs.worldbank.org/opendata/new-world-bank-country-classifications-income-level-2020-2021 Accessed 2021-08-28
- Paul et al. [2021] Paul, A., Englert, P., Varga, M.: Socio-economic disparities and covid-19 in the usa. Journal of Physics: Complexity 1(1), 00 (2021)
- Jay et al. [2020] Jay, J., Bor, J., Nsoesie, E.O., Lipson, S.K., Jones, D.K., Galea, S., Raifman, J.: Neighbourhood income and physical distancing during the covid-19 pandemic in the united states. Nature human behaviour 4(12), 1294–1302 (2020)
- Gauvin et al. [2021] Gauvin, L., Bajardi, P., Pepe, E., Lake, B., Privitera, F., Tizzoni, M.: Socio-economic determinants of mobility responses during the first wave of covid-19 in italy: from provinces to neighbourhoods. Journal of the Royal Society Interface 18(181) (2021)
- Blundell et al. [2020] Blundell, R., Costa Dias, M., Joyce, R., Xu, X.: Covid-19 and inequalities. Fiscal studies 41(2), 291–319 (2020)
- Bambra et al. [2020] Bambra, C., Riordan, R., Ford, J., Matthews, F.: The covid-19 pandemic and health inequalities. J Epidemiol Community Health 74(11), 964–968 (2020)
- Dorn et al. [2020] Dorn, A.v., Cooney, R.E., Sabin, M.L.: Covid-19 exacerbating inequalities in the us. Lancet 395(10232), 1243–1244 (2020)
- Abedi et al. [2021] Abedi, V., Olulana, O., Avula, V., Chaudhary, D., Khan, A., Shahjouei, S., Li, J., Zand, R.: Racial, economic, and health inequality and covid-19 infection in the united states. J. Racial and Ethnic Health Disparities 8, 732–742 (2021)
- Maloney and Taskin [2020] Maloney, W.F., Taskin, T.: Determinants of social distancing and economic activity during covid-19: A global view. World Bank Policy Research Working Paper 1(9242), 00 (2020)
- Kephart et al. [2021] Kephart, J.L., Delclòs-Alió, X., Rodríguez, D.A., Sarmiento, O.L., Barrientos-Gutiérrez, T., Ramirez-Zea, M., Quistberg, D.A., Bilal, U., Roux, A.V.D.: The effect of population mobility on covid-19 incidence in 314 latin american cities: a longitudinal ecological study with mobile phone location data. The Lancet Digital Health 1(1), 00 (2021)
- Gozzi et al. [2021] Gozzi, N., Tizzoni, M., Chinazzi, M., Ferres, L., Vespignani, A., Perra, N.: Estimating the effect of social inequalities on the mitigation of covid-19 across communities in santiago de chile. Nature Communications 12(1), 1–9 (2021)
- Heroy et al. [2021] Heroy, S., Loaiza, I., Pentland, A., O’Clery, N.: Covid-19 policy analysis: labour structure dictates lockdown mobility behaviour. Journal of the Royal Society Interface 18(176), 20201035 (2021)
- Mena et al. [2021] Mena, G.E., Martinez, P.P., Mahmud, A.S., Marquet, P.A., Buckee, C.O., Santillana, M.: Socioeconomic status determines covid-19 incidence and related mortality in santiago, chile. Science 372(6545) (2021)
- Garrote Sanchez et al. [2021] Garrote Sanchez, D., Gomez Parra, N., Ozden, C., Rijkers, B., Viollaz, M., Winkler, H.: Who on earth can work from home? The World Bank Research Observer 36(1), 67–100 (2021)
- Dingel and Neiman [2020] Dingel, J.I., Neiman, B.: How many jobs can be done at home? Journal of Public Economics 189, 104235 (2020)
- [37] Veraset: Veraset Movement Data – Veraset. Accessed on 2021-02-17. https://www.veraset.com/products/movement/ Accessed 2021-02-17
- McKenzie [2005] McKenzie, D.J.: Measuring inequality with asset indicators. Journal of population economics 18(2), 229–260 (2005)
- Coven et al. [2022] Coven, J., Gupta, A., Yao, I.: Jue insight: Urban flight seeded the covid-19 pandemic across the united states. Journal of urban economics -, 103489 (2022) https://doi.org/10.1016/j.jue.2022.103489
- Chetty et al. [2020] Chetty, R., Friedman, J.N., Hendren, N., Stepner, M., et al.: The economic impacts of covid-19: Evidence from a new public database built using private sector data. Technical report, national Bureau of economic research (2020)
- Mongey et al. [2021] Mongey, S., Pilossoph, L., Weinberg, A.: Which workers bear the burden of social distancing? The Journal of Economic Inequality 19, 509–526 (2021)
- [42] Data, O.W.I.: Our World in Data - COVID-19 Public Data. github. Accessed on 2023-02-01. https://github.com/owid/covid-19-data/tree/master/public/data Accessed 2023-02-01
- Hale et al. [2020] Hale, T., Webster, S., Anna, P., Toby, P., Beatriz, K.: Oxford covid-19 government response tracker. Blavatnik school of government working paper 31, 2020–11 (2020)
- Bank [2021] Bank, T.W.: World Development Report 2021: Data for Better Lives. The World Bank, 1818 H Street, N.W. Washington, DC 20433 USA (2021)
- Fraiberger et al. [2020] Fraiberger, S.P., Astudillo, P., Candeago, L., Chunet, A., Jones, N.K.W., Khan, M.F., Lepri, B., Gracia, N.L., Lucchini, L., Massaro, E., Montfort, A.: Uncovering socioeconomic gaps in mobility reduction during the COVID-19 pandemic using location data (2020)
- Vyass and Kumaranayake [2006] Vyass, S., Kumaranayake, L.: Constructing socioeconomic status indexes: how to use principal component analysis. Health Policy Plan 21(6), 459–68 (2006)
- Csáji et al. [2013] Csáji, B.C., Browet, A., Traag, V.A., Delvenne, J.-C., Huens, E., Van Dooren, P., Smoreda, Z., Blondel, V.D.: Exploring the mobility of mobile phone users. Physica A: statistical mechanics and its applications 392(6), 1459–1473 (2013)
- Çolak et al. [2015] Çolak, S., Alexander, L.P., Alvim, B.G., Mehndiratta, S.R., González, M.C.: Analyzing cell phone location data for urban travel: current methods, limitations, and opportunities. Transportation Research Record 2526(1), 126–135 (2015)
- Pappalardo et al. [2020] Pappalardo, L., Ferres, L., Sacasa, M., Cattuto, C., Bravo, L.: An individual-level ground truth dataset for home location detection. arXiv preprint arXiv:2010.08814 2010(08814), 1–20 (2020)
- Song et al. [2010] Song, C., Koren, T., Wang, P., Barabási, A.-L.: Modelling the scaling properties of human mobility. Nature physics 6(10), 818–823 (2010)
- Barbosa et al. [2015] Barbosa, H., Lima-Neto, F.B., Evsukoff, A., Menezes, R.: The effect of recency to human mobility. EPJ Data Science 4(1), 1–14 (2015)
- Oliver et al. [2020] Oliver, N., Lepri, B., Sterly, H., Lambiotte, R., Deletaille, S., De Nadai, M., Letouzé, E., Salah, A.A., Benjamins, R., Cattuto, C., et al.: Mobile phone data for informing public health actions across the covid-19 pandemic life cycle. Science Advances 6(23), 0764 (2020)
- Wesolowski et al. [2016] Wesolowski, A., Buckee, C.O., Engø-Monsen, K., Metcalf, C.J.E.: Connecting mobility to infectious diseases: the promise and limits of mobile phone data. The Journal of infectious diseases 214(suppl_4), 414–420 (2016)
See pages - of WB_Mobility_response_to_covid19_pandemic_and_wealth-4