Nanomechanical Photothermal Near Infrared Spectromicroscopy of Individual Nanorods
Abstract
Understanding light-matter interaction at the nanoscale requires probing the optical properties of matter at the individual nano-absorber level. To this end, we have developed a nanomechanical photothermal sensing platform that can be used as a full spectromicroscopy tool for single molecule and single particle analysis. As a demonstration, the absorption cross-section of individual gold nanorods is resolved from the spectroscopic and polarization standpoint. By exploiting the capabilities of nanomechanical photothermal spectromicroscopy, the longitudinal localized surface plasmon resonance (LSPR) in the NIR range is unravelled and quantitatively characterized. The polarization features of the transversal surface plasmon resonance (TSPR) in the VIS range are also analyzed. The measurements are compared with the finite element method (FEM), elucidating the role played by electron-surface and bulk scattering in these plasmonic nanostructures, as well as the interaction between the nano-absorber and the nanoresonator, ultimately resulting in absorption strength modulation. Finally, a comprehensive comparison is conducted, evaluating the signal-to-noise ratio of nanomechanical photothermal spectromicroscopy against other cutting-edge single molecule and particle spectroscopy techniques. This analysis highlights the remarkable potential of nanomechanical photothermal spectromicroscopy due to its exceptional sensitivity.
keywords:
nanomechanics, photothermal microscopy, absorption spectroscopy, polarization-resolved absorption, single molecule spectroscopyTU Wien] Institute of Sensor and Actuator Systems, TU Wien, Gusshausstrasse 27-29, 1040 Vienna, Austria. \abbreviationsNEMS, NIR, FEM, SPR
1 Introduction
The advent and development of optical single-molecule and single-particle measurement techniques have had a tremendous impact on the scientific research for the past 30 years 1. The detection of single objects at the nanoscale level affords us a unique perspective on the interactions occurring between these tiny entities and their local environment, revealing their heterogeneity without relying on ensemble average information. Due to its high signal-to-noise ratio (SNR), optical fluorescence-based detection approaches have rapidly evolved, being nowadays routinely employed in a huge variety of scientific fields, from biology to condensed matter, to the design and engineering of novel materials. However, the fluorescent label can photobleach or quench as well as alter the system under study. For this reason, the scientific community has pushed toward the development of label-free single-molecule detection schemes 2, such as iSCAT 3, 4, ground-state depletion microscopy 5 and photothermal microscopy 6, 7, among others. All these approaches rely on the absorption rather than scattering of the nano-object upon illumination of a probing light. The rationale behind this choice lies in the fact that, while the optical scattering cross-section scales quadratically with the target volume ( ), the optical absorption cross-section scales linearly with it ( ) 8, 9. In other words, the smaller the target size is, the more effectively its absorption properties can be interrogated. More specifically, this central aspect shows also the advantage of nanomechanical absorption spectroscopy over other fully-optical single-molecule spectroscopic methods, such as surface-enhanced Raman scattering (SERS) 10 or tip-enhanced Raman spectroscopy (TERS) 11. The former approach uses the strong near-field enhancement at the nanoscale on the surface of plasmonic nanoparticles or nanostructures (so-called hotspots) to increase the SNR of the Stokes-shift Raman scattering. However, the plasmonic nanostructure fabrication and control of the placement of the particles/molecules in the sites of interest increase the overall complexity of the measurement procedure. The latter approach uses a nanoscopic probe to scan an area where the molecules of interest are fixed, which requires a very good control in the tip fabrication. In contrast, nanomechanical absorption spectroscopy overcomes all this complexity as it measures directly the non-radiative energy losses of the illuminated molecule, not limited to any specific sample preparation. In other words, the molecule itself becomes part of the detector, due to the interplay between its absorption properties and the light excitation used. The reduced analyte-detector distance results also in a reduction of noise and unwanted external interference. Based on this consideration, it has been possible to detect and image single molecules by nanomechanical photothermal sensing.7 This work has been made possible by the previous research, which showed the ability of nanomechanical resonators to detect and quantify the absorption of single plasmonic 12, 13, 14 and polymer 15 nanoparticles via photothermal heating. It is worth noting that this photothermal spectromicroscopy approach is not based on the thermo-optical effect as in photothermal contrast microscopy 16, 17, 18, 19, 6, where the absorber is detected due to the temperature dependence of the surrounding embedding medium refractive index (glycerol, thermotropic liquid crystal, near-critical or ) 6, 20 via modulation of the scattering of a second probing laser. In nanomechanical photothermal spectromicroscopy, this thermal effect consists instead in a stress reduction in the nanomechanical resonator, detuning its resonance frequency upon illumination of the nano-absorber.
Here, this work pushes further the boundaries of single-molecule nanomechanical photothermal sensing toward a full NIR spectro- and polarization-microscopy technique. With a silicon nitride nano-optomechanical drum resonator as a sensitive thermometer, individual gold nanorods are localized and their spectra and polarization features fully characterized, additionally shedding light on their interaction with the nanoresonator itself. Among the huge variety of nanoparticle shapes and materials, gold nanorods occupy a relevant position in gas- and liquid-phase chemical detection, so as sensing platform for biomolecules 21, 22, or as photothermal heating sources 23. In this work, the plasmonic properties of such nano-objects are analyzed and their corresponding plasmonic damping mechanisms unravelled, showing also a good agreement with finite element method (FEM) simulation results. The performance of our approach is then compared with the other state-of-the-art single molecule and particle techniques in terms of normalized SNR, showing the capabilities offered by nanomechanical photothermal spectromicroscopy with its superior SNR.
2 Experimental methods
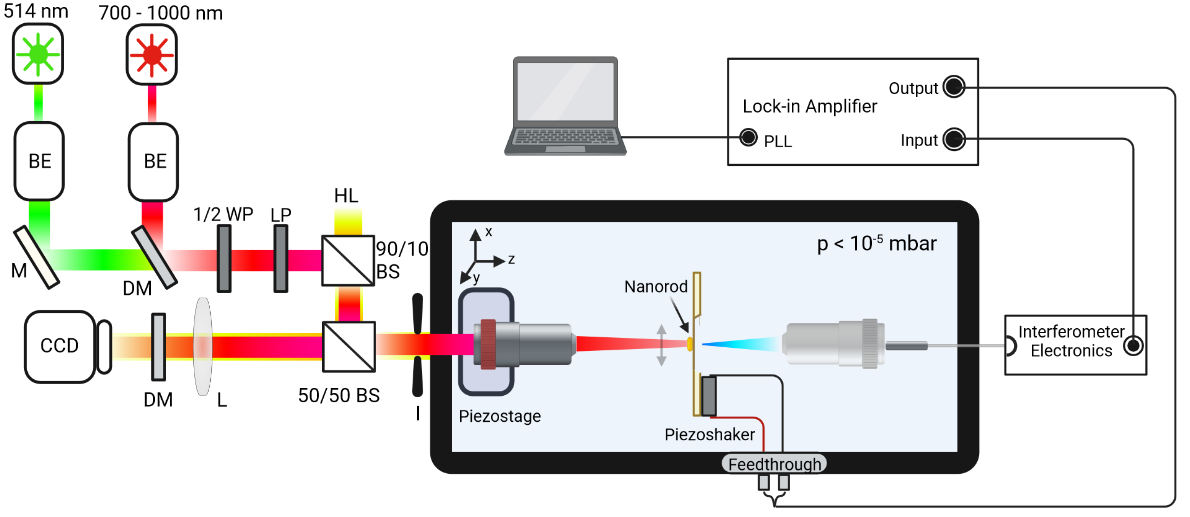
The 50 nm thick nano-optomechanical drum resonator is operated at room temperature under high vacuum conditions ( < mbar) in order to reduce air damping and eliminate heat dissipation by convection 7. It is actuated by a piezo-electric element placed underneath the sample holder. The nanoresonator’s displacement is measured with a Fabry-Perot interferometer (Attocube IDS3010) 24, 25 (see Fig. 1). The mechanical resonance frequency is recorded with a phase-locked loop (PLL) tracking scheme (HF2LI, Zurich Instrument).
The operating set-up is equipped with a green laser at 513 nm (Toptica TopMode) and a Ti:Sapphire laser (M Square SolsTiS) with a tunable wavelength in the range of 700-1000 nm, used as probe beams to photothermally excite both the longitudinal (LSPR) and transverse plasmonic resonances (TSPR) of each nanorod. In fact, every time one of the two lasers is scanned across the central area of the drum and hits the sample, the corresponding light absorption results in a local heating, reducing the stress of the nanoresonator and ultimately resulting in a detectable resonance frequency detuning 7, 12, 15.
For the scanning laser probes, long working distance 50x objectives are used (N.A. = 0.42, M Plan Apo NIR, Mitutoyo in the NIR range, N.A. = 0.55, M Plan Apo, Mitutoyo in the VIS range). The lasers’ polarization angle is controlled by means of a linear polarizer in the optical beam path. Raster scanning is made possible by a closed-loop piezoelectric nanopositioning stage (PiMars, Physikinstrumente). The analyte sampling is performed by spin-casting onto the resonator a drop of diluted solution containing the nanorods, after being filtered with 200 nm pore size PTFE membrane syringe filters (Acrodisc, Sigma-Aldrich) to avoid particle aggregation. As already shown 7, NEMS-based photothermal sensing enables the measurement of pure optical absorption of the sample, resulting in the full characterization of its absorption cross-section
| (1) |
with being the peak irradiance of a gaussian laser beam and the absorbed power by the sample. The former is a function of the input laser power
| (2) |
with being the beam radius, which is always characterized by knife-edge method before each measurement 26, 27. The latter can be calculated from the measured resonance frequency shifts, assuming a full thermalization, as
| (3) |
being the resonance frequency, the frequency shift, and the relative power responsivity ().
3 Results and discussion
The nanorods analyzed here have lengths in the range of ca. 38-48 nm, radial diameters in the range of 9.5-11.5 nm and silica coating with a thickness in the range of 18-22 nm (Sigma-Aldrich silica coated gold nanorods) (Fig. 2a, inset - the majority of the nanorods have been SEM imaged by deposition of 10 nm thick gold layer on top of them to reduce any possible charging effect). Their optical properties in the visible and near-infrared range are characterized by surface plasmon resonances (SPR), i.e. the electromagnetic coupling between an impinging light and the collective motion of the conduction band electrons 8, 28. The main interest in gold nanorods lies in their large SPR amplitudes and broad spectral tunability 29, 30, 31, 32, 33, 34, 35, 36, 37, 38. In the specific case where a coating is present, depending on its thickness, SPR features will be more or less affected by the environment. Indeed, the plasmonic response is sensitive to the surrounding on the spatial range of the order of the nanorod diameter, the region where the field enhancement takes place 33, 39, 40, 41 (Supporting Information Fig. S1). In the present study, a silica coating of roughly 20 nm is thin enough for the SPR to remain sensitive to both the coating and the surrounding medium, but within a reduced magnitude 40.
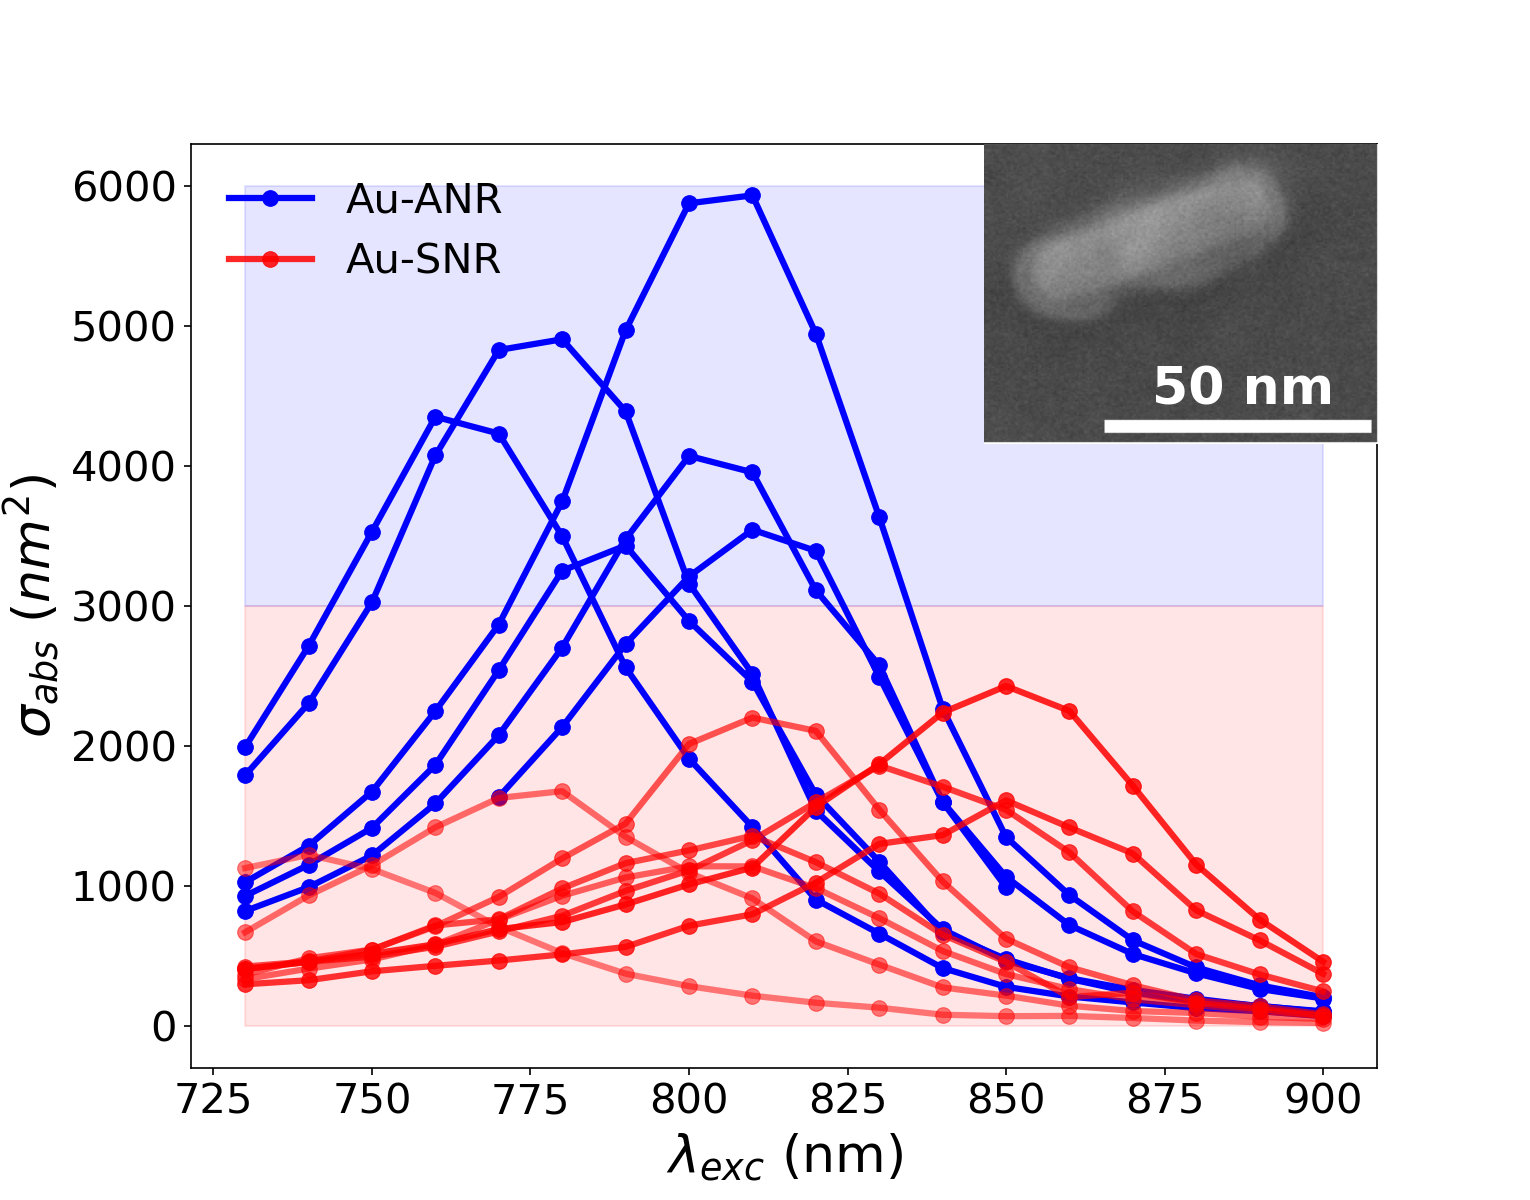
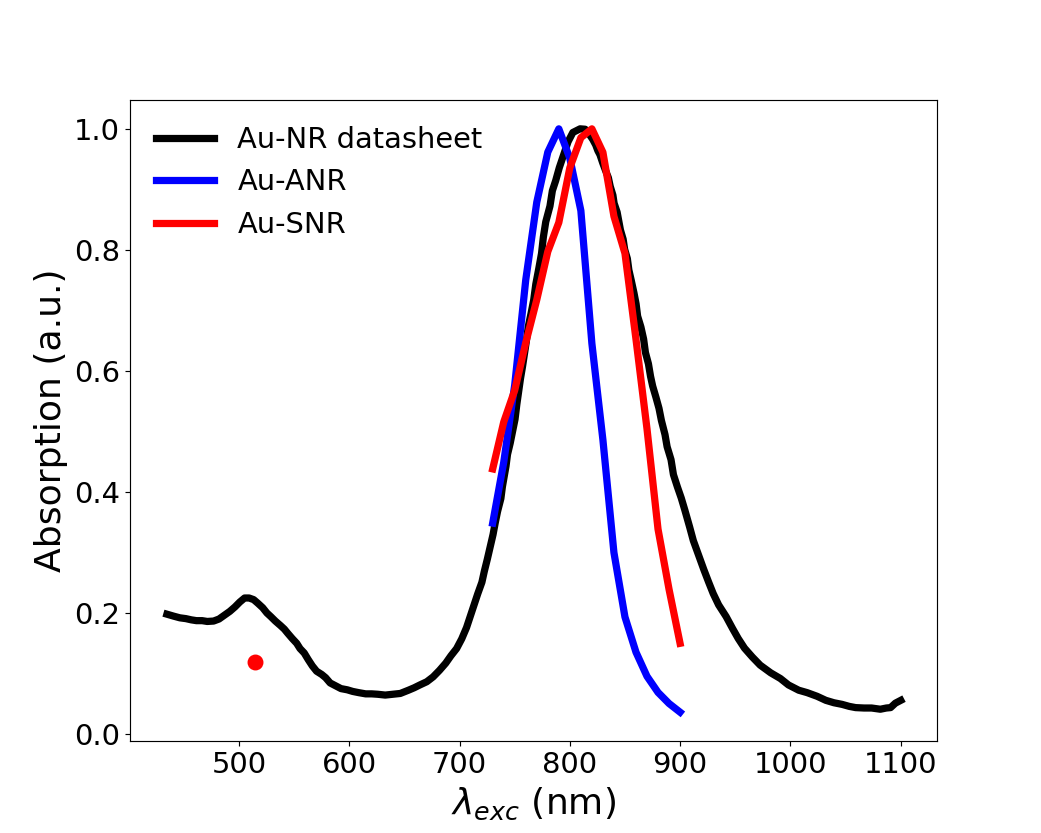
Fig. 2a shows the measured absorption spectra of different, individual silica-coated gold nanorods (Au-SNR) indicated by the red curves, together with some aggregations of few units (Au-ANR) indicated by the blue curves. Differentiating these two photothermal responses is aided by FEM electromagnetic simulations (for an overview on how aggregations can be differentiate from individual nanorods, see Supporting Information). For each spectrum, the polarization of the probe beam (here Ti:Sapphire laser) was set to maximize the absorption in the wavelength range of 700-900 nm. In fact, the nanorods analyzed here present maximum absorption in the range of ca. 790-830 nm (see Fig.2b, black solid curve), due to LSPR excitation whenever the laser polarization is parallel to their long axis. With the nanomechanical photothermal technique, nanoparticle heterogeneity can be investigated, revealing more than the information obtained in ensemble average measurements. Here, the heterogeneity is mainly due to the size dispersion of the particles, as stated by the vendor 42, and it relates both to the LSPR spectral position and the absorption cross-section amplitude . Moreover, the latter has a strong dependence on the substrate, specifically on its thickness and optical properties (see Fig. 3; further details in the Supporting Information).
The red solid line in Fig. 2b indicates the corresponding renormalized sum of the responses from individual nanorods (Au-SNR in Fig. 2a), showing a very good match with the reference spectrum given in the datasheet (black solid line), recovering a typical ensemble average absorption spectrum 29, 31. The ensemble Au-SNR wavelength is measured to be 809 nm, which is close to the nominal value of 808 nm 42. Fig. 2b also shows the renormalized spectrum considering only responses from nanorod aggregations (Au-ANR, blue solid line). For this spectrum, an Au-ANR wavelength of 786 nm is extracted, corresponding to a blue-shift of the 2.8 from the Au-SNR wavelength. As shown by Jain et al. 43, such a blue-shift occurs in nanorod aggregations of two or more units assembled in a side-by-side orientation, for a polarization parallel to their long axis. As the authors reported, the strength of this shift depends on the interdistance between the nanorods involved, on their aspect ratios, the relative orientational angle and on the number of units considered. For the spectral distributions seen in Fig. 2 (blue curves), we expect these signals to originate from side-by-side assembled nanorod aggregations.
The individual nanorods have also been measured with a wavelength of 513 nm, to excite the TSPR (red dot in Fig. 2b). As expected, the absorption at this wavelength is roughly one order of magnitude smaller than LSPR, due to the overlap between the transverse localized plasmonic resonance and the electronic interband transitions, which start to arise at 2.4 eV ca. in gold 44, 45, 46, ultimately resulting in enhanced plasmonic damping.


Fig. 3a focuses the attention on the nanomechanical photothermal spectrum of a individual nanorod (red dots). This specific sample has maximum absorption at nm with a cross-section of , close to what it is reported in literature 34, 32, 33. The measurements are compared with FEM simulations (black and blue dots, Fig. 3a), showing a good agreement with data (black dots). Indeed, FEM approaches offer the possibility to evaluate the absorption and scattering cross-sections of an arbitrarily shaped particle 47, 48, 49, 50, 51, 52, 53. For this individual nanorod, a linewidth of ca. 132 meV is measured in terms of full-width-at-half-maximum (FWHM), two time higher than expected for electron-bulk scattering alone (72 meV, see Supporting Information). Intrinsic size effects for the gold core have to be taken into account, such as electron-surface scattering and radiative damping (Supporting Information Eq. S3). The former affects the gold nanorods’ LSPR linewidth stronger than the latter due to their reduced volume, in contrast to what has been observed in spherical gold nanoparticles 46. Similar FWHM values are found for the other nanorods, corroborating the evidence that electron-surface scattering is a major source of damping in these plasmonic-assisted nano-absorbers (Supporting Information Fig. S3b).
Fig. 3a also clearly shows how the presence of the silicon nitride resonator affects ultimately the absorption cross-section of the nanorod under study. The FEM analysis in the presence of the substrate (black dots) reproduces well the measured absorption spectrum, where the FEM analysis conducted in free space in the absence of the slab does not (blue dots). More precisely, at the LSPR wavelength (840 nm), the absorption cross-section results are roughly half of the free space case ( in the presence of the slab and in air). In contrast, the LSPR wavelength and FWHM are weakly affected by the presence of the substrate ( 1 difference for both quantities). In general, a dielectric substrate underneath a metal nanoparticle screens the electromagnetic restoring force acting on the plasmon oscillations. This screening can be modelled qualitatively as a nanoparticle image with a reduced number of charges, whose electromagnetic strength is determined by the nanoparticle-substrate interdistance and the slab dielectric permittivity 52. The interdistance of 20 nm (silica coating thickness) and the relatively small refractive index of low-stress silicon nitride (whose spectral distribution has been taken from Ref. 54) give reason for this weak effect 40, 52. To better understand the role played by the silicon nitride slab, FEM simulations have been performed at a single wavelength (800 nm) for different thicknesses .
In Fig. 3b the absorption cross-section follows a period pattern for an increasing substrate thickness. This modulation follows perfectly the variation in intensity at the interface air-silicon nitride in the vicinity of the nanorod. In fact, the electromagnetic losses due to absorption are directly proportional to the intensity of the electric field, (Supporting Information Eq. S1). This intensity modulation is due to the interference occurring between the input electric field and the reflected light from the slab, whose magnitude depends on the thickness and refractive index. The intensity value calculated here is an average over its spatial distribution in the proximity of the nanorod, but without it, in the presence of the substrate only (Supporting Information Fig. S4). For the thickness used in this study (50 nm) along with the considered wavelengths (730-900 nm) and the refractive index of silicon nitride 54, no interference inside the slab is present as it is the case in Ref. 55. There, 1 thick silicon cantilevers worked as optical cavity for specific wavelengths in the VIS range, modulating the scattering of deposited 100 nm gold nanoparticles. In this study, however, the most relevant interference occurs at the interface between the free space and the substrate. Therefore, by controlling the substrate refractive index and thickness, it is possible to tailor the absorption spectrum of individual nano-absorbers.
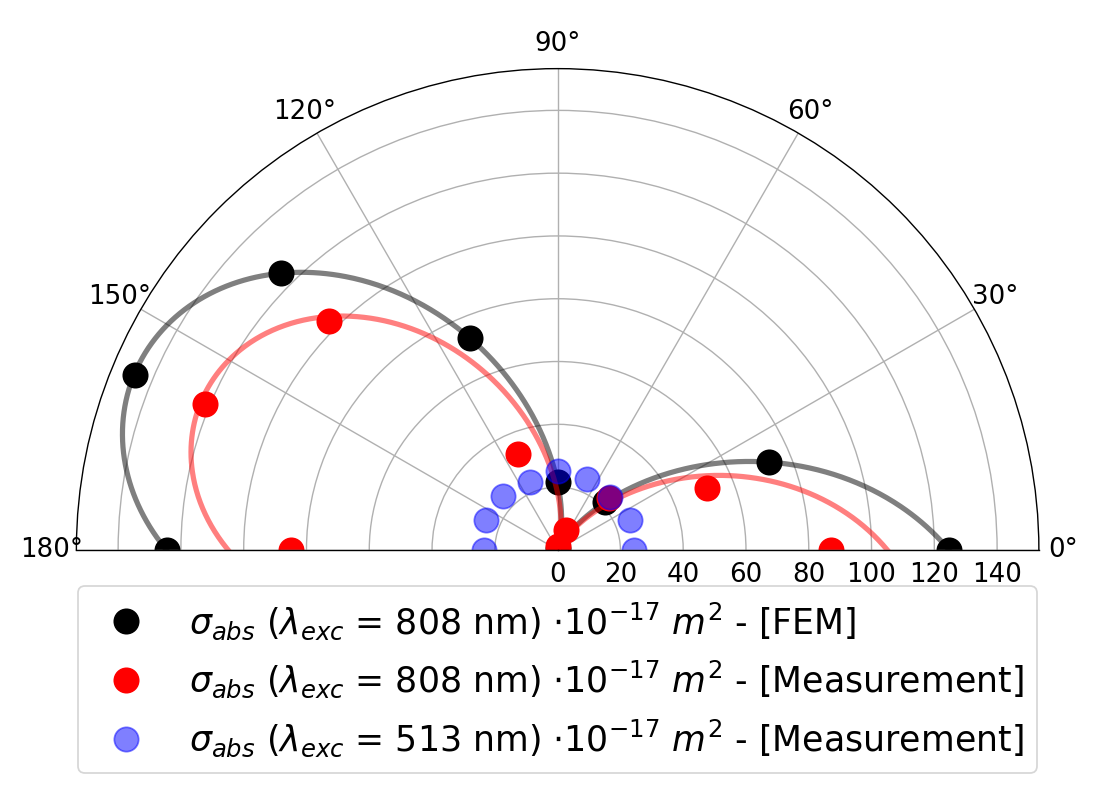
For these non-spherical nanoparticles, absorption is strongly polarization dependent, as clearly seen in Fig. 4&5. Fig. 4 shows how the absorption cross-section varies with the laser polarization angle for a individual nanorod, with the red dots representing the nanomechanical photothermal measurements close to its LSPR ( nm). Each point is acquired by changing the polarization of the scanning laser probe with steps of 22.5° by means of a half-waveplate (HWP) and a linear polarizer, while maintaining the same laser input power. The ratio between the absorption cross-section for a polarization parallel to the nanorod long-axis (°) and perpendicular to it (°) is roughly:
| (4) |
This high polarization contrast gives us therefore an insight into the absorption efficiency achievable in this nano-absorber upon control of the incident laser polarization. The absorption efficiency for the parallel case is , while for the perpendicular case (the area of the nanorod being , whose calculation is based on the sizes extracted from FEM simulations). The measurements have been compared also to the FEM simulations (black dots), showing a good match. It is worth noting how the measurements follow the typical pattern expected for perfect dipoles 56, 29, 36.
For comparison, Fig. 4 shows also the nanomechanical photothermal signal at = 513 nm (the blue dots). The TSPR shows almost no polarization contrast since it starts to overlap with polarization-independent electronic transitions in gold 44. For this reason, the plasmonic damping increases, resulting in an transverse plasmonic resonant absorption strength smaller than the longitudinal one.
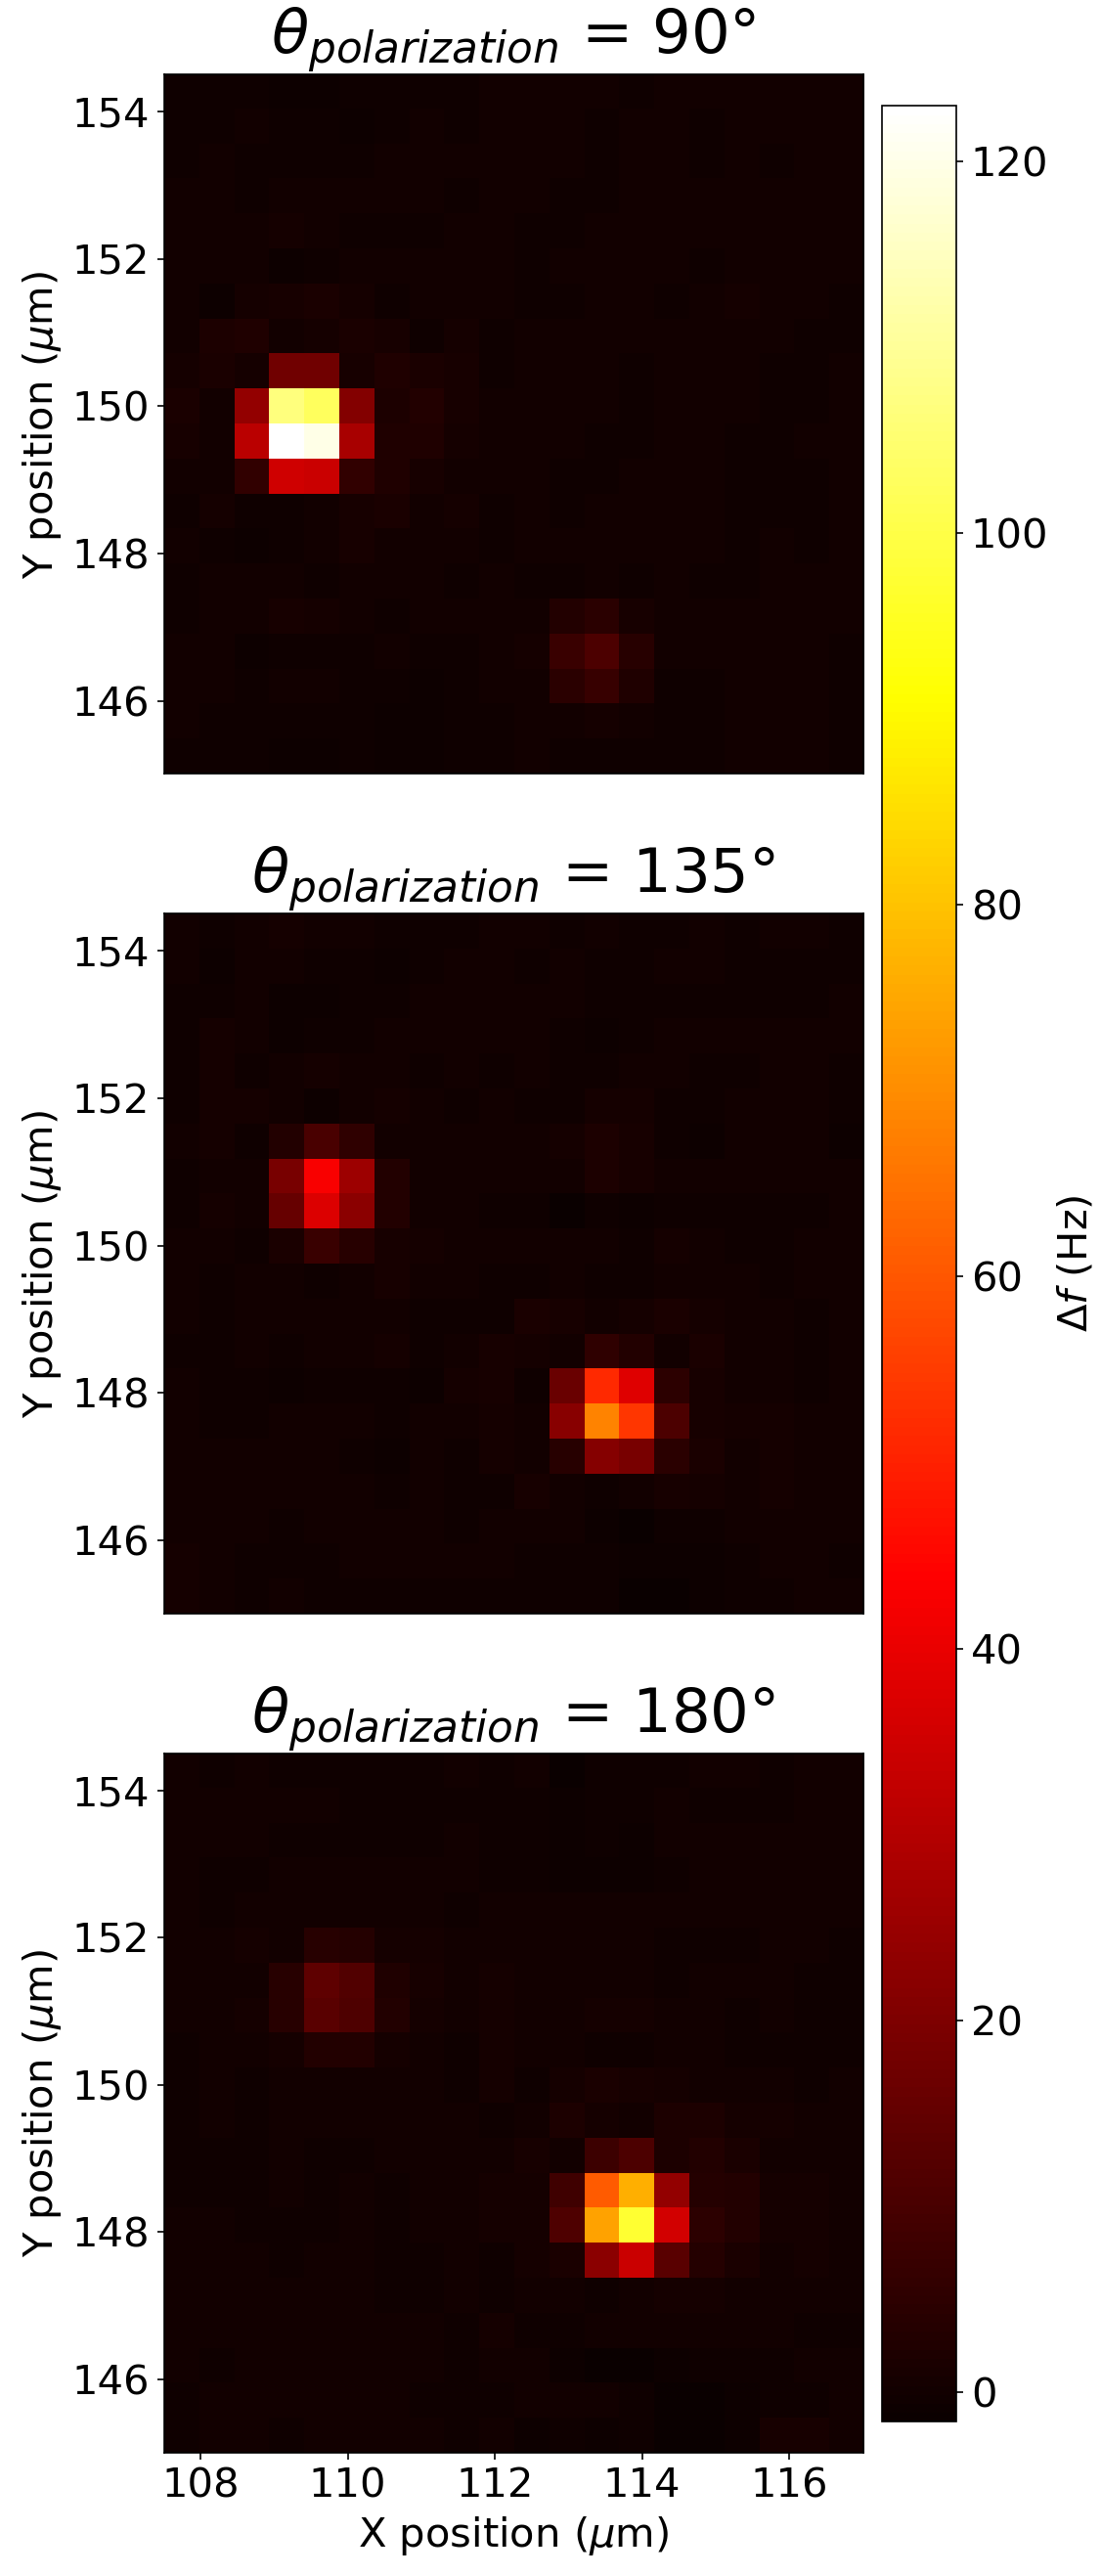
Nanomechanical photothermal spectromicroscopy also allows the precise determination of the orientation on the substrate of different nano-absorbers, as seen in Fig. 5. 2D maps of the same region on the drum resonator for three different polarization angles (90°, 135°, 180°) are acquired at nm. The two responses are from two individual nanorods, whose absorption amplitude varies as a function of the laser polarization. Focusing the attention on the two perpendicular polarizations, 90° and 180°, the two absorbers behave in an opposite way, meaning that they are almost perpendicular to one another, while absorbing almost the same amount of light for the central scenario (°). Nanomechanical photothermal spectromicroscopy can be therefore employed in the analysis of the more complex optical features, for nanorods and more exotic structures, like plamon-assisted optical chirality in metallic nanoparticles 57, 58, 37.
Finally, to further stress the advantages offered by nanomechanical photothermal spectromicroscopy compared to other label-free single-particle and molecule spectromicroscopy techniques, a comparison between SNR of different approaches is carried out in the following way59:
| (5) |
For the sake of completeness, Eq. 5 takes into account, together with the SNR itself, also the power absorbed by the sample under study and the time constant of the experiment . The reference values of the three quantities used for normalization (labelled with the subscript ) corresponds to the value obtained for the individual nanorod of Fig. 3&4. The calculations are plotted in Fig. 6, for which the experimental values extracted from the listed references are used (for the used values, see SI) 56, 60, 3, 31, 17, 18, 19, 36, 61, 7.
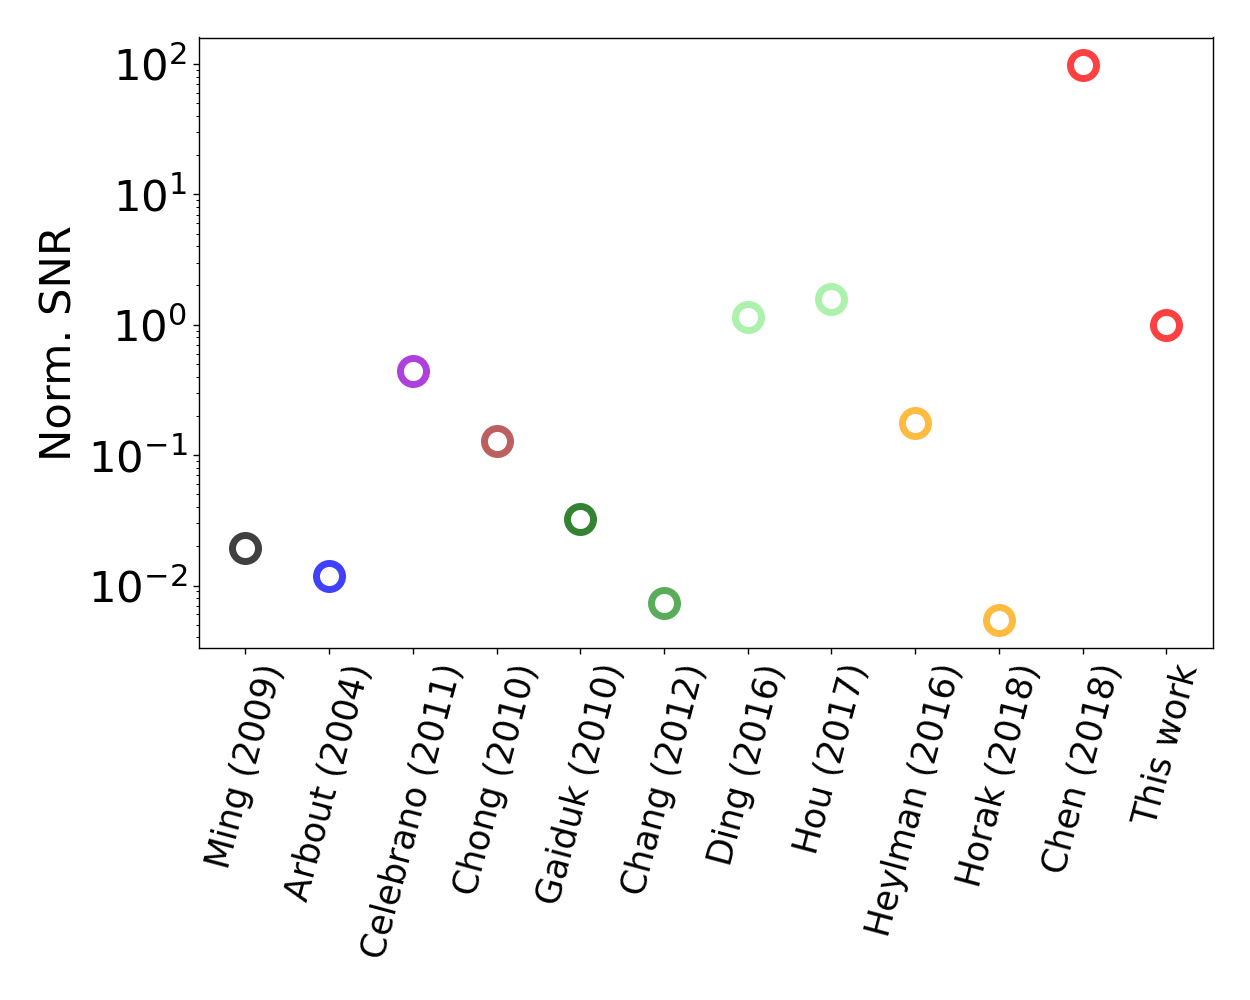
The different colors correspond to different techniques (see caption). It is worth noting that the nanomechanical photothermal approach of Ref. 7 (first red empty dot) presents the highest SNR, followed by photothermal contrast microscopy with near-critical Xe 18, 19 and this work. More precisely, the difference of two orders of magnitude between this work and Ref. 7 lies in the different prestress of the nano-optomechanical resonator. There, oxygen plasma treatment is exploited to reduce the stress of the resonator, with the aim to improve its relative power responsivity to detect single Atto 633 molecules. Here, there has been no need to further reduce the stress due to the already high sensitivity of the resonator used for the nanorods detection. Still, this work shows the superior capabilities of nanomechanical photothermal spectromicroscopy over a huge range of label-free absorption techniques.
4 Conclusions
In conclusion, the optical absorption cross-section of individual silica-coated gold nanorods in the NIR range has been measured and quantitatively characterized using nanomechanical photothermal spectroscopy and microscopy, likewise elucidating their polarization features. With this approach, where the substrate acts as a temperature sensor, it is possible to shed light on the variations in nano-absorbers’ properties to investigate concealed heterogeneity, as expected for these complex systems, as well as their reciprocal intercoupling, which opens up a wealth field of research by its own. It has also been shown that these nanorods present, on one hand, a pronounced plasmonic electron-surface scattering, broadening their LSPR in conjunction with bulk scattering. On the other hand, a strong polarization contrast of the order of few hundreds has been observed. The interaction between the silicon nitride slab and the nanorod has been also investigated, consisting in a modulation of its absorption strength over the whole considered spectrum, while weakly affecting the plasmonic resonant energy and its broadening. This result underlines the importance of taking into account the interaction of the substrate in all the experiments where a support is used for spectroscopic measurements.
Primarily, this work demonstrates the capabilities of nanomechanical photothermal NIR spectromicroscopy for localizing individual nanoparticles, obtaining their plasmon spectra, and resolving their polarization features, pushing further our understanding of light-matter interaction at the nanoscale level. A comparison conducted among the different label-free single-molecule techniques shows that nanomechanical photothermal sensing presents a superior signal-to-noise ratio within a less complex experimental setup and measurement procedure.
The following files are available free of charge.
-
•
Supporting Information: FEM simulations details (computational approach, gold dielectric function model), LSPR linewidth (measurements and modeling), FEM substrate analysis, table with all the parameters used for the SNR comparison (PDF)
The authors are thankful to Sophia Ewert and Patrick Meyer for the device fabrication, and for the assistance of Sophia Ewert with scanning electron microscopy. The authors thank also Hendrik Kähler and Andreas Kainz for the fruitful discussions on finite element method. Furthermore, the authors thank Johannes Hiesberger, Paolo Martini and Niklas Luhmann for useful discussions on the set-up. Finally, K.K. thanks BioRender for their illustration software. This work is supported by the European Research Council under the European Unions Horizon 2020 research and innovation program (Grant Agreement No. 716087-PLASMECS).
References
- Moerner 2020 Moerner, W. E. Viewpoint: Single Molecules at 31: What’s Next? Nano Letters 2020, 20, 8427–8429
- Arroyo and Kukura 2016 Arroyo, J. O.; Kukura, P. Non-fluorescent schemes for single-molecule detection, imaging and spectroscopy. Nature Photonics 2016, 10, 11–17
- Celebrano et al. 2011 Celebrano, M.; Kukura, P.; Renn, A.; Sandoghdar, V. Single-molecule imaging by optical absorption. Nature Photonics 2011, 5, 95–98
- Priest et al. 2021 Priest, L.; Peters, J. S.; Kukura, P. Scattering-based Light Microscopy: From Metal Nanoparticles to Single Proteins. Chemical Reviews 2021, 121, 11937–11970
- Chong et al. 2010 Chong, S.; Min, W.; Xie, X. S. Ground-state depletion microscopy: Detection sensitivity of single-molecule optical absorption at room temperature. Journal of Physical Chemistry Letters 2010, 1, 3316–3322
- Adhikari et al. 2020 Adhikari, S.; Spaeth, P.; Kar, A.; Baaske, M. D.; Khatua, S.; Orrit, M. Photothermal Microscopy: Imaging the Optical Absorption of Single Nanoparticles and Single Molecules. ACS Nano 2020, 14, 16414–16445
- Chien et al. 2018 Chien, M. H.; Brameshuber, M.; Rossboth, B. K.; Schütz, G. J.; Schmid, S. Single-molecule optical absorption imaging by nanomechanical photothermal sensing. Proceedings of the National Academy of Sciences of the United States of America 2018, 115, 11150–11155
- Bohren and Huffman 1983 Bohren, C. F.; Huffman, D. R. Absorption and scattering of light by small particles; Wiley, 1983; p 530
- Baffou and Quidant 2013 Baffou, G.; Quidant, R. Thermo-plasmonics: Using metallic nanostructures as nano-sources of heat. Laser and Photonics Reviews 2013, 7, 171–187
- Langer et al. 2020 Langer, J. et al. Present and future of surface-enhanced Raman scattering. ACS Nano 2020, 14, 28–117
- Pienpinijtham et al. 2022 Pienpinijtham, P.; Kitahama, Y.; Ozaki, Y. Progress of tip-enhanced Raman scattering for the last two decades and its challenges in very recent years. Nanoscale 2022, 14, 5265–5288
- Schmid et al. 2014 Schmid, S.; Wu, K.; Larsen, P. E.; Rindzevicius, T.; Boisen, A. Low-power photothermal probing of single plasmonic nanostructures with nanomechanical string resonators. Nano Letters 2014, 14, 2318–2321
- Ramos et al. 2018 Ramos, D.; Malvar, O.; Davis, Z. J.; Tamayo, J.; Calleja, M. Nanomechanical Plasmon Spectroscopy of Single Gold Nanoparticles. Nano Letters 2018, 18, 7165–7170
- Chien et al. 2021 Chien, M.-H.; Shawrav, M. M.; Hingerl, K.; Taus, P.; Schinnerl, M.; Wanzenboeck, H. D.; Schmid, S. Analysis of carbon content in direct-write plasmonic Au structures by nanomechanical scanning absorption microscopy. Journal of Applied Physics 2021, 129, 063105
- Larsen et al. 2013 Larsen, T.; Schmid, S.; Villanueva, L. G.; Boisen, A. Photothermal analysis of individual nanoparticulate samples using micromechanical resonators. ACS Nano 2013, 7, 6188–6193
- Gaiduk et al. 2010 Gaiduk, A.; Yorulmaz, M.; Ruijgrok, P.; Orrit, M. Room-Temperature Detection of a Single Molecule’s Absorption by Photothermal Contrast. Science 2010, 330, 353–356
- Chang and Link 2012 Chang, W. S.; Link, S. Enhancing the sensitivity of single-particle photothermal imaging with thermotropic liquid crystals. Journal of Physical Chemistry Letters 2012, 3, 1393–1399
- Ding et al. 2016 Ding, T. X.; Hou, L.; Meer, H. V. D.; Alivisatos, A. P.; Orrit, M. Hundreds-fold Sensitivity Enhancement of Photothermal Microscopy in Near-Critical Xenon. Journal of Physical Chemistry Letters 2016, 7, 2524–2529
- Hou et al. 2017 Hou, L.; Adhikari, S.; Tian, Y.; Scheblykin, I. G.; Orrit, M. Absorption and Quantum Yield of Single Conjugated Polymer Poly[2-methoxy-5-(2-ethylhexyloxy)-1,4-phenylenevinylene] (MEH-PPV) Molecules. Nano Letters 2017, 17, 1575–1581
- Wang et al. 2023 Wang, Y.; Adhikari, S.; van der Meer, H.; Liu, J.; Orrit, M. Thousand-Fold Enhancement of Photothermal Signals in Near-Critical CO 2. The Journal of Physical Chemistry C 2023, 127, 3619–3625
- Cao et al. 2014 Cao, J.; Sun, T.; Grattan, K. T. Gold nanorod-based localized surface plasmon resonance biosensors: A review. Sensors and Actuators, B: Chemical 2014, 195, 332–351
- Nooteboom et al. 2022 Nooteboom, S. W.; Wang, Y.; Dey, S.; Zijlstra, P. Real-Time Interfacial Nanothermometry Using DNA-PAINT Microscopy. Small 2022, 18
- Shukla et al. 2020 Shukla, N.; Singh, B.; Kim, H. J.; Park, M. H.; Kim, K. Combinational Chemotherapy and Photothermal Therapy Using a Gold Nanorod Platform for Cancer Treatment. Particle and Particle Systems Characterization 2020, 37
- Thurner et al. 2013 Thurner, K.; Braun, P. F.; Karrai, K. Fabry-Pérot interferometry for long range displacement sensing. Review of Scientific Instruments 2013, 84
- Thurner et al. 2015 Thurner, K.; Quacquarelli, F. P.; Braun, P.-F.; Savio, C. D.; Karrai, K. Fiber-based distance sensing interferometry. Applied Optics 2015, 54, 3051
- Khosrofian and Garetz 1983 Khosrofian, J. M.; Garetz, B. A. Measurement of a Gaussian laser beam diameter through the direct inversion of knife-edge data. Applied Optics 1983, 22, 3406–3410
- Marshall 2010 Marshall, W. J. Two methods for measuring laser beam diameter. Journal of Laser Applications 2010, 22, 132–136
- Maier 2007 Maier, S. A. Plasmonics : fundamentals and applications; Springer, 2007; p 223
- Muskens et al. 2008 Muskens, O. L.; Bachelier, G.; Fatti, N. D.; Vallée, F.; Brioude, A.; Jiang, X.; Pileni, M. P. Quantitative absorption spectroscopy of a single gold nanorod. Journal of Physical Chemistry C 2008, 112, 8917–8921
- Myroshnychenko et al. 2008 Myroshnychenko, V.; Rodríguez-Fernández, J.; Pastoriza-Santos, I.; Funston, A. M.; Novo, C.; Mulvaney, P.; Liz-Marzán, L. M.; de Abajo, F. J. G. Modelling the optical response of gold nanoparticles. Chemical Society Reviews 2008, 37, 1792–1805
- Chang et al. 2010 Chang, W. S.; Ha, J. W.; Slaughter, L. S.; Link, S. Plasmonic nanorod absorbers as orientation sensors. Proceedings of the National Academy of Sciences of the United States of America 2010, 107, 2781–2786
- Chen et al. 2011 Chen, Y. S.; Frey, W.; Kim, S.; Kruizinga, P.; Homan, K.; Emelianov, S. Silica-coated gold nanorods as photoacoustic signal nanoamplifiers. Nano Letters 2011, 11, 348–354
- Davletshin et al. 2012 Davletshin, Y. R.; Lombardi, A.; Cardinal, M. F.; Juvé, V.; Crut, A.; Maioli, P.; Liz-Marzán, L. M.; Vallée, F.; Fatti, N. D.; Kumaradas, J. C. A quantitative study of the environmental effects on the optical response of gold nanorods. ACS Nano 2012, 6, 8183–8193
- Crut et al. 2014 Crut, A.; Maioli, P.; Fatti, N. D.; Vallée, F. Optical absorption and scattering spectroscopies of single nano-objects. Chemical Society Reviews 2014, 43, 3921–3956
- Zilli et al. 2019 Zilli, A.; Langbein, W.; Borri, P. Quantitative Measurement of the Optical Cross Sections of Single Nano-objects by Correlative Transmission and Scattering Microspectroscopy. ACS Photonics 2019, 6, 2149–2160
- Heylman et al. 2016 Heylman, K. D.; Thakkar, N.; Horak, E. H.; Quillin, S. C.; Cherqui, C.; Knapper, K. A.; Masiello, D. J.; Goldsmith, R. H. Optical microresonators as single-particle absorption spectrometers. Nature Photonics 2016, 10, 788–795
- Rangacharya et al. 2020 Rangacharya, V. P.; Wu, K.; Larsen, P. E.; Thamdrup, L. H. E.; Ilchenko, O.; Hwu, E. T.; Rindzevicius, T.; Boisen, A. Quantifying Optical Absorption of Single Plasmonic Nanoparticles and Nanoparticle Dimers Using Microstring Resonators. ACS Sensors 2020, 5, 2067–2075
- Brioude et al. 2005 Brioude, A.; Jiang, X. C.; Pileni, M. P. Optical properties of gold nanorods: DDA simulations supported by experiments. Journal of Physical Chemistry B 2005, 109, 13138–13142
- Liz-Marzán et al. 2008 Liz-Marzán, L. M.; Pérez-Juste, J.; Pastoriza-Santos, I. Plasmonics of Gold Nanorods. Considerations for Biosensing. Nanomaterials for Application in Medicine and Biology. Dordrecht, 2008; pp 103–111
- Lioi et al. 2022 Lioi, D. B.; Izor, S. N.; Varshney, V.; DeJarnette, H. M.; Derosa, P. A.; Kennedy, W. J. Effective medium approximation for the dielectric environment of coated gold nanorods. Optical Materials Express 2022, 12, 3577
- Tian et al. 2012 Tian, L.; Chen, E.; Gandra, N.; Abbas, A.; Singamaneni, S. Gold nanorods as plasmonic nanotransducers: Distance-dependent refractive index sensitivity. Langmuir 2012, 28, 17435–17442
- 42 Gold nanorods - 10 nm diameter, silica coated, absorption/808 nm, dispersion in H2O. Sigma-Aldrich, PRD.0.ZQ5.10000047270
- Jain et al. 2006 Jain, P. K.; Eustis, S.; El-Sayed, M. A. Plasmon coupling in nanorod assemblies: Optical absorption, discrete dipole approximation simulation, and exciton-coupling model. Journal of Physical Chemistry B 2006, 110, 18243–18253
- Johnson and Christy 1972 Johnson, P.; Christy, R. Optical-Constants Of Noble-Metals Phys. Rev. B 6(12), 4370–4379 (1972). Physical Review B 1972, 1318, 4370–4379
- Kolwas and Derkachova 2020 Kolwas, K.; Derkachova, A. Impact of the interband transitions in gold and silver on the dynamics of propagating and localized surface plasmons. Nanomaterials 2020, 10, 1–27
- Sönnichsen et al. 2002 Sönnichsen, C.; Franzl, T.; Wilk, T.; von Plessen, G.; Feldmann, J.; Wilson, O.; Mulvaney, P. Drastic reduction of plasmon damping in gold nanorods. Physical Review Letters 2002, 88, 774021–774024
- Parsons et al. 2010 Parsons, J.; Burrows, C. P.; Sambles, J. R.; Barnes, W. L. A comparison of techniques used to simulate the scattering of electromagnetic radiation by metallic nanostructures. Journal of Modern Optics 2010, 57, 356–365
- Loke et al. 2014 Loke, V. L.; Huda, G. M.; Donev, E. U.; Schmidt, V.; Hastings, J. T.; Mengüç, M. P.; Wriedt, T. Comparison between discrete dipole approximation and other modelling methods for the plasmonic response of gold nanospheres. Applied Physics B: Lasers and Optics 2014, 115, 237–246
- Nima et al. 2017 Nima, Z. A.; Davletshin, Y. R.; Watanabe, F.; Alghazali, K. M.; Kumaradas, J. C.; Biris, A. S. Bimetallic gold core-silver shell nanorod performance for surface enhanced Raman spectroscopy. RSC Advances 2017, 7, 53164–53171
- Grand and Ru 2020 Grand, J.; Ru, E. C. L. Practical Implementation of Accurate Finite-Element Calculations for Electromagnetic Scattering by Nanoparticles. Plasmonics 2020, 15, 109–121
- Núñez-Leyva et al. 2021 Núñez-Leyva, J. M.; Kolosovas-Machuca, E. S.; Sánchez, J.; Guevara, E.; Cuadrado, A.; Alda, J.; González, F. J. Computational and experimental analysis of gold nanorods in terms of their morphology: Spectral absorption and local field enhancement. Nanomaterials 2021, 11
- Knight et al. 2009 Knight, M. W.; Wu, Y.; Lassiter, J. B.; Nordlander, P.; Halas, N. J. Substrates matter: influence of an adjacent dielectric on an individual plasmonic nanoparticle. Nano Letters 2009, 9, 2188–2192
- 53 \urlhttps://www.comsol.com/model/scatterer-on-substrate-14699
- Philipp 1973 Philipp, H. R. Optical Properties of Silicon Nitride. Journal of The Electrochemical Society 1973, 120, 295
- Kosaka et al. 2014 Kosaka, P. M.; Pini, V.; Ruz, J. J.; Silva, R. A. D.; González, M. U.; Ramos, D.; Calleja, M.; Tamayo, J. Detection of cancer biomarkers in serum using a hybrid mechanical and optoplasmonic nanosensor. Nature Nanotechnology 2014, 9, 1047–1053
- Ming et al. 2009 Ming, T.; Zhao, L.; Yang, Z.; Chen, H.; Sun, L.; Wang, J.; Yan, C. Strong polarization dependence of plasmon-enhanced fluorescence on single gold nanorods. Nano Letters 2009, 9, 3896–3903
- Spaeth et al. 2019 Spaeth, P.; Adhikari, S.; Le, L.; Jollans, T.; Pud, S.; Albrecht, W.; Bauer, T.; Caldarola, M.; Kuipers, L.; Orrit, M. Circular Dichroism Measurement of Single Metal Nanoparticles Using Photothermal Imaging. Nano Letters 2019, 19, 8934–8940
- Spaeth et al. 2022 Spaeth, P.; Adhikari, S.; Heyvaert, W.; Zhuo, X.; García, I.; Liz-Marzán, L. M.; Bals, S.; Orrit, M.; Albrecht, W. Photothermal Circular Dichroism Measurements of Single Chiral Gold Nanoparticles Correlated with Electron Tomography. ACS Photonics 2022, 9, 3995–4004
- 59 Goldsmith R., Optical Microresonators as Single-Molecule Spectrometers. \urlhttps://home.uni-leipzig.de/ physik/sites/photothermal-webinar/randall-goldsmith/
- Arbouet et al. 2004 Arbouet, A.; Christofilos, D.; Fatti, N. D.; Vallée, F.; Huntzinger, J. R.; Arnaud, L.; Billaud, P.; Broyer, M. Direct measurement of the single-metal-cluster optical absorption. Physical Review Letters 2004, 93
- Horak et al. 2018 Horak, E. H.; Rea, M. T.; Heylman, K. D.; Gelbwaser-Klimovsky, D.; Saikin, S. K.; Thompson, B. J.; Kohler, D. D.; Knapper, K. A.; Wei, W.; Pan, F.; Gopalan, P.; Wright, J. C.; Aspuru-Guzik, A.; Goldsmith, R. H. Exploring Electronic Structure and Order in Polymers via Single-Particle Microresonator Spectroscopy. Nano Letters 2018, 18, 1600–1607