More relaxed intracluster gas than galaxies in clusters in quasi-equilibrium
Abstract
During cluster mergers, the intracluster gas and member galaxies undergo dynamic evolution, but at different timescales and reach different states. We collect 24 galaxy clusters in quasi-equilibrium state as indicated by the X-ray image, and calculate the cluster orientations and three kinds of dynamical parameters, i.e., the normalized centroid offset, the sphere index and the ellipticity, for these clusters from the distributions of member galaxies and also the intracluster gas. We find consistent alignments for the orientations estimated from the two components. However, the three kinds of dynamical parameters indicated by member galaxies are systematically larger than those derived from the gas component, suggesting that the gas component is more relaxed than member galaxies. Differences of dynamical features between the intracluster gas and member galaxies are independent of cluster mass and concentration. We conclude that the intracluster gas reaches the dynamic equilibrium state earlier than the almost collisionless member galaxies.
keywords:
galaxies: clusters: general — galaxies: clusters: intracluster medium1 Introduction
Galaxy clusters have been idealized to have spherically symmetric structures in many studies, such as those on cluster mass estimation (e.g., Arnaud et al., 2010; Piffaretti et al., 2011). Observations, however, indicate that most clusters of galaxies have elliptical or irregular morphologies (e.g., Mann & Ebeling, 2012). In the hierarchical structure formation scenario, galaxy clusters grow through mergers of smaller subclusters or groups and the accretion of material (e.g., Berrier et al., 2009; McGee et al., 2009). In the early stage of merging, violent dynamic interactions occur between subclusters, matter in the cluster is generally stretched along the merging axis, the cluster therefore shows a bimodal or elongated morphology (e.g., Roettiger et al., 1993, 1996, 1997). After the fast and violent merging stage, matter in the cluster roughly follows a 3-dimensional Gaussian distribution and the cluster shows an elliptical morphology (e.g., Lynden-Bell, 1967). After evolving further for several Giga-years, the merged clusters will approach a state of virial and hydrostatic equilibrium, and have almost spherically symmetric structures (see simulations, e.g., Poole et al., 2006).
During cluster merging, the intracluster medium (ICM) evolves differently from the member galaxies and dark matter mainly because the former is viscous while the latter are almost collisionless. Observationally, the Bullet cluster (1E 0657–56, e.g., Markevitch et al., 2002) is a textbook example: the distribution of the ICM shows a large discrepancy to that of member galaxies and dark matter (Clowe et al., 2004, 2006). Simulations have shown that the dark matter of merging clusters generally exhibits a more elongated morphology (McDonald et al., 2022) and requires a longer time to reach the equilibrium state than the ICM (see figure 15 and 16 in Poole et al., 2006). After reaching the virilization state, relaxed clusters recover a good spatial matching between the ICM, member galaxies and dark matter (e.g., Clowe & Schneider, 2002; Donnarumma et al., 2011). Due to continuous radiative cooling of ICM, relaxed clusters are often highly concentrated in X-ray with a very bright cool-core in the cluster center (see Fabian, 2012, as a review).
Many efforts have been made to quantify the dynamical state of galaxy clusters with optical or X-ray data (e.g., Ramella et al., 2007; Santos et al., 2008; Wen & Han, 2013; Yuan et al., 2022). The ellipticity has been widely used to describe the global morphology of galaxy clusters. In the optical, the cluster ellipticity can be estimated from the projected distribution of member galaxies (e.g., Carter & Metcalfe, 1980; de Theije et al., 1995; Splinter et al., 1997). In X-rays, one can directly obtain the cluster ellipticity by fitting the brightness image with a two-dimensional -model (e.g., Yuan & Han, 2020; Yuan & Wen, 2022). Buote & Canizares (1992) studied five Abell clusters and found that the ellipticities derived from the ICM are smaller than those calculated by Carter & Metcalfe (1980) with member galaxies. Struble & Ftaclas (1994) reported that more massive clusters tend to have a rounder morphology. The cluster ellipticity has weak or no redshift evolution (e.g., Plionis, 2002).
Theories and simulations predict that the dynamic relaxation for the almost-collisionless dark matter and member galaxies differs from that of the diffuse ICM (e.g., Poole et al., 2006). Observational differences between member galaxies and ICM have been established in clusters in early stages of merging, such as in the Bullet cluster. However, does this difference persist in clusters in later stages of dynamic evolution? In this work, we report on systematical differences in dynamic features between the distributions of member galaxies in the optical band and the ICM expressed by the X-ray image. Recently, we processed the X-ray images homogeneously for 1844 clusters with the archival data of the Chandra and XMM-Newton satellites (Yuan & Han, 2020; Yuan et al., 2022), and therefore have a dataset available. In optical, a large number of clusters have been identified with well-recognized member galaxies (e.g., Wen et al., 2012; Wen & Han, 2015). Therefore, it is now feasible to study the distributions of member galaxies and the ICM for a large sample of clusters. The distributions of the two components could be very complex and vary among galaxy clusters in different dynamical states. As the first step, in this paper we compare the dynamic features of member galaxies and ICM only for clusters in a quasi-equilibrium state.
The paper is structured as follows. In Section 2, we describe the methods we used to select the cluster sample and derive the parameters. In Section 3, we discuss the dynamic features of member galaxies and ICM. A brief summary is given in Section 4. Throughout this paper, a flat CDM cosmology is adopted with km s-1 Mpc-1, and .
2 Cluster sample and parameters
By processing the archival data of the Chandra and XMM-Newton satellites, we obtained X-ray images for 1844 galaxy clusters and calculated four kinds of dynamical parameters for them (Yuan & Han, 2020; Yuan et al., 2022). The clusters are collected from both targeted and serendipitous observations. The data of the two satellites are processed with similar strategies: only photons in 0.5–5 keV are used; the point sources are carefully identified and replaced by the brightness of their ambient regions; the images are exposure corrected and background subtracted; the X-ray images are smoothed to a physical scale of 30 kpc to avoid an observational bias that the pixel size indicates different physical scale for clusters at different redshifts. Detailed information on data processing can be found in the Section 2 of Yuan & Han (2020) and Yuan et al. (2022).
The optical data for member galaxies of clusters are taken from the Sloan Digital Sky Survey (SDSS) following Wen & Han (2015). Galaxies are recognized as cluster members when their -band evolution-corrected absolute magnitude are brighter than -20.0 mag and their velocity differences from the cluster are less than 2500 km s-1 if spectroscopic redshifts are available or the redshift differences are less than if only photometric redshifts are available (Wen & Han, 2015). Wen et al. (2009) showed that using only photometric redshifts yields a completeness about 90% and a contamination rate of about 20% for member galaxies when .
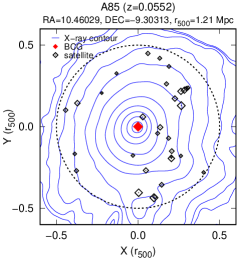
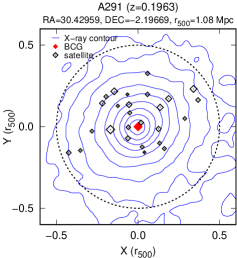
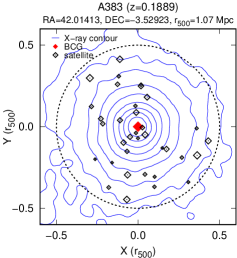
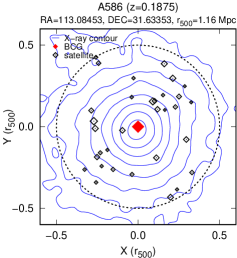
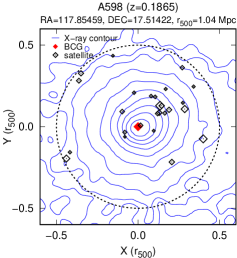
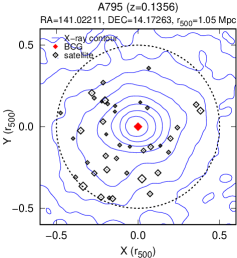
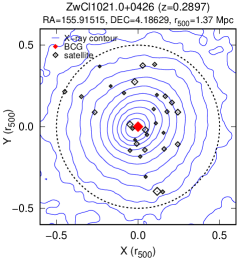
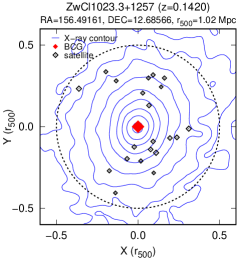
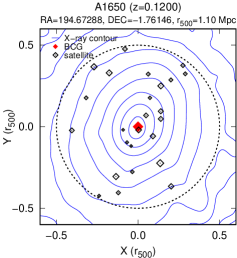
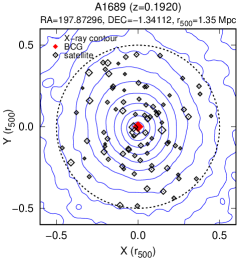
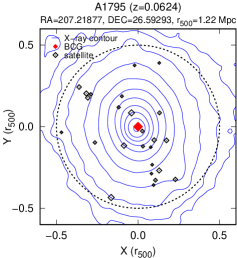
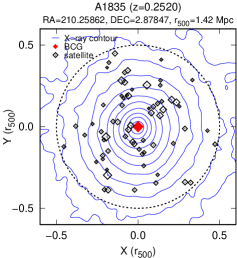
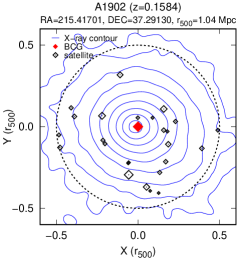
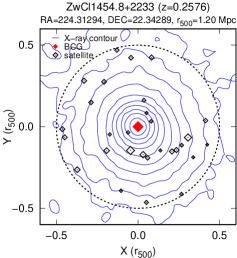
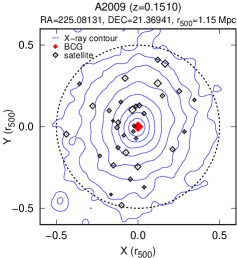
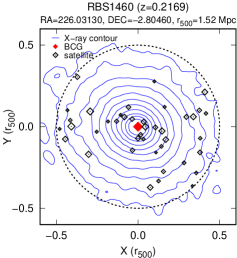
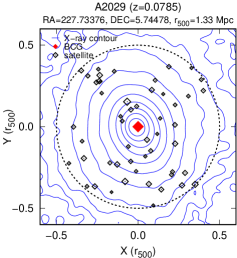
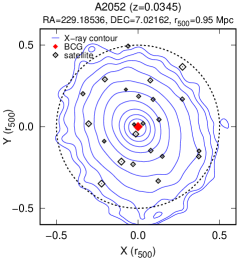
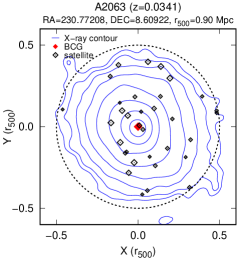
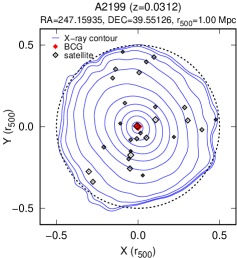
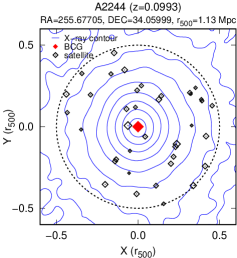
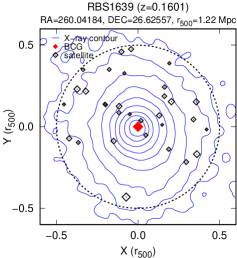
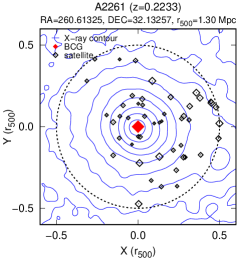
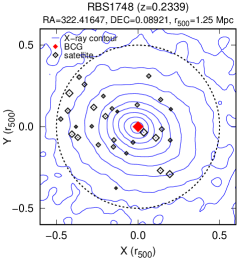
We select a sample of galaxy clusters for this work with the following four criteria. (1) The cluster is in quasi-equilibrium when , where is the concentration index. Here we use the concentration index instead of the morphology index because the latter is defined from the cluster ellipticity (Yuan & Han, 2020). (2) The X-ray image of the cluster has a good quality within 0.5, i.e., the region encircled by 0.5 is well covered by the 3 contour of the X-ray image. Here is the radius in which the mean matter density of the cluster is 500 times of the local critical density. (3) The cluster redshift should be lower than 0.3 to ensure that member galaxies with -band absolute magnitude brighter than -20.0 mag are highly complete (). We visually checked the optical images of these clusters to avoid contamination of foreground stars. (4) The number of satellite galaxies in 0.5, , is larger than 20 to ensure that the calculated parameters are reliable. Finally, we get 24 clusters satisfying all the above criteria, see Table 1. The X-ray images with superimposed distribution of member galaxies for the 24 clusters are shown in Fig. 1.
We collect various parameters of the clusters from literature. The coordinate and redshift of the BCG measured from the SDSS data, see Wen et al. (2012) for details, are regarded as that of their host clusters. Clusters with are not contained in the catalogue of Wen & Han (2015), we thus identify the BCG and other member galaxies with the same method for A2052 (), A2063 () and A2199 (). The concentration indices are taken from Yuan et al. (2022). The cluster radius and mass come from the catalogue compiled by Piffaretti et al. (2011).
Virialized galaxy clusters generally show a small offset between the brightness peak and the flux-weighted centroid, but the offset could be large for disturbed clusters. We define a vector named the normalized centroid offset as
| (1) |
where
| (2) |
The denotes the weighted brightness for the hot gas or member galaxies at the th pixel, here is the relative coordinate of the th pixel to the cluster center. For the 24 quasi-equilibrium clusters in our sample, we separately take the X-ray brightness peak as the center for the ICM and the position of BCG as the center for member galaxies, though the deviations between the X-ray peak and the BCG are small for these quasi-equilibrium clusters, see Fig. 1. Briefly speaking, the for member galaxies indicates the normalized offset between the BCG and the optical flux-weighted centroid, while the means the departure from the X-ray brightness peak to the X-ray flux-weighted centroid.
| Name | RA | DEC | log | ||||||||||||||
|---|---|---|---|---|---|---|---|---|---|---|---|---|---|---|---|---|---|
| (J2000) | (J2000) | (Mpc) | () | (X-axis, ) | (Y-axis, ) | () | (∘) | (X-axis, ) | (Y-axis, ) | () | (∘) | ||||||
| (1) | (2) | (3) | (4) | (5) | (6) | (7) | (8) | (9) | (10) | (11) | (12) | (13) | (14) | (15) | (16) | (17) | (18) |
| A85 | 10.46029 | -9.30313 | 0.0552 | -0.420.01 | 1.21 | 5.32 | 31 | 0.720.20 | -1.360.23 | 29.38.0 | 0.070.01 | 170.70.3 | 10.264.24 | -5.386.97 | 48.37.7 | 0.210.01 | 174.35.9 |
| A291 | 30.42959 | -2.19669 | 0.1963 | -0.310.01 | 1.08 | 4.31 | 26 | -0.330.20 | 0.090.20 | 26.37.4 | 0.030.01 | 140.30.3 | -1.174.91 | 7.383.00 | 45.25.9 | 0.370.01 | 112.80.4 |
| A383 | 42.01413 | -3.52923 | 0.1889 | -0.290.01 | 1.07 | 4.25 | 35 | 1.100.19 | -0.160.20 | 26.58.4 | 0.010.01 | 13.41.1 | 0.654.62 | -2.225.08 | 43.29.0 | 0.340.06 | 33.20.6 |
| A586 | 113.08453 | 31.63353 | 0.1875 | -0.490.02 | 1.16 | 5.20 | 32 | 0.740.21 | 0.670.21 | 24.56.6 | 0.020.01 | 131.70.3 | 0.284.41 | 2.614.43 | 33.14.5 | 0.120.01 | 153.22.3 |
| A598 | 117.85459 | 17.51422 | 0.1865 | -0.300.01 | 1.04 | 3.82 | 26 | 1.120.20 | 1.910.19 | 25.45.4 | 0.030.01 | 103.60.1 | 8.407.57 | 6.633.70 | 36.65.6 | 0.390.01 | 99.70.3 |
| A795 | 141.02211 | 14.17263 | 0.1356 | -0.420.01 | 1.05 | 3.81 | 40 | 0.590.23 | -1.120.21 | 27.28.2 | 0.070.01 | 113.20.1 | -9.894.86 | -13.245.59 | 60.77.0 | 0.300.01 | 141.60.8 |
| ZwCl1021.0+0426 | 155.91515 | 4.18629 | 0.2897 | -0.290.01 | 1.37 | 9.17 | 31 | 1.790.18 | 1.400.19 | 24.44.8 | 0.030.01 | 146.00.3 | 3.793.07 | -0.396.65 | 44.15.8 | 0.410.05 | 19.00.6 |
| ZwCl1023.3+1257 | 156.49161 | 12.68566 | 0.1420 | -0.370.01 | 1.02 | 3.48 | 21 | 0.060.20 | 1.030.22 | 25.35.6 | 0.060.01 | 158.00.2 | 3.214.11 | 1.084.58 | 42.28.2 | 0.230.03 | 12.91.7 |
| A1650 | 194.67288 | -1.76146 | 0.1200 | -0.440.01 | 1.10 | 4.12 | 25 | 0.810.21 | 1.400.23 | 24.15.1 | 0.060.01 | 159.80.2 | -0.284.01 | 3.636.09 | 47.39.2 | 0.330.02 | 5.41.0 |
| A1689 | 197.87296 | -1.34112 | 0.1920 | -0.430.01 | 1.35 | 8.39 | 85 | -0.400.19 | 1.420.20 | 28.16.6 | 0.040.01 | 14.60.2 | -2.432.13 | -0.212.52 | 34.66.4 | 0.210.02 | 15.70.4 |
| A1795 | 207.21877 | 26.59293 | 0.0624 | -0.320.01 | 1.22 | 5.53 | 25 | 0.530.19 | 1.200.21 | 26.86.8 | 0.060.01 | 15.20.1 | -5.914.03 | -5.665.65 | 49.66.8 | 0.300.05 | 26.90.4 |
| A1835 | 210.25862 | 2.87847 | 0.2520 | -0.300.01 | 1.42 | 10.50 | 66 | 0.430.18 | 0.020.19 | 25.97.6 | 0.030.01 | 168.80.5 | -1.542.59 | 1.833.40 | 33.54.7 | 0.210.01 | 164.01.5 |
| A1902 | 215.41701 | 37.29130 | 0.1584 | -0.390.01 | 1.04 | 3.80 | 25 | 2.540.21 | 0.150.20 | 28.98.7 | 0.050.01 | 67.70.1 | -2.624.38 | -10.127.15 | 50.75.7 | 0.070.02 | 49.81.1 |
| ZwCl1454.8+2233 | 224.31294 | 22.34289 | 0.2576 | -0.260.01 | 1.20 | 6.32 | 29 | 0.020.18 | -0.390.19 | 27.08.6 | 0.040.01 | 27.00.3 | -2.523.13 | 4.535.01 | 35.39.0 | 0.150.02 | 59.60.8 |
| A2009 | 225.08131 | 21.36941 | 0.1510 | -0.380.01 | 1.15 | 5.06 | 34 | 0.580.20 | 0.140.22 | 26.37.2 | 0.050.01 | 163.10.3 | -0.895.30 | -1.932.39 | 42.36.2 | 0.370.01 | 158.80.9 |
| RBS1460 | 226.03130 | -2.80461 | 0.2169 | -0.210.01 | 1.52 | 12.48 | 41 | -0.520.18 | -0.330.17 | 27.68.0 | 0.050.01 | 58.80.1 | -0.903.35 | -3.444.09 | 45.67.3 | 0.470.02 | 85.40.1 |
| A2029 | 227.73376 | 5.74478 | 0.0785 | -0.350.01 | 1.33 | 7.27 | 51 | 0.680.19 | -0.630.21 | 28.18.9 | 0.050.01 | 11.70.2 | -0.074.95 | 0.286.47 | 45.19.6 | 0.210.02 | 22.50.8 |
| A2052 | 229.18536 | 7.02162 | 0.0345 | -0.280.01 | 0.95 | 2.49 | 23 | -0.100.21 | -0.680.22 | 27.68.6 | 0.050.01 | 33.10.2 | 3.852.87 | 3.484.48 | 36.06.0 | 0.270.01 | 156.11.7 |
| A2063 | 230.77208 | 8.60922 | 0.0341 | -0.460.01 | 0.90 | 2.16 | 33 | -0.160.23 | 0.970.23 | 27.07.5 | 0.020.01 | 44.20.4 | 0.763.33 | -0.214.07 | 37.64.2 | 0.230.01 | 172.52.7 |
| A2199 | 247.15935 | 39.55126 | 0.0312 | -0.310.01 | 1.00 | 2.96 | 28 | -0.410.20 | 0.720.21 | 27.77.6 | 0.040.01 | 34.50.3 | 5.704.31 | -0.994.16 | 40.46.4 | 0.310.01 | 152.00.7 |
| A2244 | 255.67705 | 34.05999 | 0.0993 | -0.450.01 | 1.13 | 4.49 | 38 | 0.230.20 | -0.370.21 | 26.48.1 | 0.020.01 | 170.50.6 | 8.354.26 | -8.694.01 | 40.18.8 | 0.260.04 | 49.50.5 |
| RBS1639 | 260.04184 | 26.62557 | 0.1604 | -0.300.01 | 1.22 | 6.01 | 31 | -0.090.19 | -0.040.21 | 26.48.1 | 0.050.01 | 17.80.2 | -1.215.12 | 4.016.63 | 37.87.5 | 0.150.03 | 40.90.7 |
| A2261 | 260.61325 | 32.13257 | 0.2233 | -0.430.01 | 1.30 | 7.88 | 48 | 1.430.21 | -0.270.20 | 27.79.2 | 0.040.01 | 75.50.1 | 17.164.46 | 1.083.74 | 51.77.0 | 0.260.02 | 98.90.2 |
| RBS1748 | 322.41647 | 0.08921 | 0.2339 | -0.360.01 | 1.25 | 7.04 | 30 | 1.640.21 | -0.670.19 | 29.49.7 | 0.060.01 | 69.00.1 | -12.575.40 | -0.293.72 | 67.111.5 | 0.490.05 | 68.10.2 |
Notes: Columns: (1) cluster name; (2 - 4) right ascension, declination and redshift of the BCG measured from the SDSS data; (5) the concentration index of the cluster, taken from Yuan et al. (2022); (6 - 7) the radius and mass of the cluster, from Piffaretti et al. (2011); (8) the number of member galaxies brighter than –20.0 mag in ; (9 - 10) the normalized offset between the brightness peak and the estimated centroid from the cluster X-ray image, values in the X-axis and Y-axis are presented separately; (11 - 13) the sphere index, the ellipticity and the position angle calculated from the X-ray image; (14 - 15) the normalized offset between the BCG and the centroid estimated from member galxies in X-axis and Y-axis; (16 - 18) the sphere index, the ellipticity and position angle estimated from the distribution of member galaxies.
The dynamical state of member galaxies and hot gas could be compared with the derived mass distribution, rather than their brightness distribution. In optical, the mass of galaxies is approximately proportional to their luminosity (e.g., Faber & Jackson, 1976). In X-ray, the brightness of hot gas is broadly proportional to the square of the in-situ mass (e.g., Piffaretti & Valdarnini, 2008). We calculate the dynamical parameters using the weighted brightness , which is defined as
| (3) |
where is the pixel value of X-ray images or the luminosity of member galaxies.
Ideally, a relaxed galaxy cluster shows a spherically symmetric morphology, thus the radial profiles of the matter distribution should be similar in any directions. We define the sphere index to quantify the degree of spherical symmetry of the ICM and member galaxies in clusters. First, we define a frame from the cluster center with an arbitrary position angle , and the two perpendicular axes of the frame divide the image into four quadrants. Second, we calculate the parameter as the sum of all pixels in the th quadrant as
| (4) |
the is the distance from the th pixel to the cluster center, and . Then, the is defined as
| (5) |
where is the maximum (minimum) among the . Last, we search for the , that yields a maximum value for , and the sphere index is defined as
| (6) |
In short, the indicates the largest difference in matter distribution between any two quadrants. More relaxed clusters are expected to have a smaller .
The ellipticity and orientation of galaxy clusters has been calculated with different methods (e.g., Carter & Metcalfe, 1980; Niederste-Ostholt et al., 2010; Huang et al., 2016; Yuan & Wen, 2022). To avoid a possible bias caused by different methods, here cluster ellipticities and orientations from optical and X-ray data are calculated in the same way. We choose the moments method, which has been widely used for optical data, but adopt the new weight of brightness rather than the traditional weight of (e.g., Niederste-Ostholt et al., 2010; Huang et al., 2016) to make the method also applicable to diffuse X-ray images. The second-order moments are defined as
| (7) |
The major and minor axes of the cluster, and , can be computed through the following equation (e.g., Carter & Metcalfe, 1980)
| (8) |
The cluster ellipticity is defined as
| (9) |
The position angle of the cluster is calculated with
| (10) |
here the is from the north through the east. The deviation between position angles measured from the distributions of member galaxies () and ICM () is denoted as
| (11) |
Here is in the range of .
Considering the possible ellipticity changes at different cluster radii (e.g., Splinter et al., 1997) and also biases for other parameters, we calculate the normalized centroid offsets, sphere indices, ellipticities and position angles from optical and X-ray images in the same region encircled by 0.5, see the large dotted circles in Fig. 1.
3 Different relaxed state for member galaxies and ICM
The exact dynamical state should be derived from the 3 dimensional velocities of all kinds of matter in a cluster. However, the velocities of dark matter and intracluster gas are not available. For galaxies, only the velocity along the line of sight can be well measured by the spectroscopic redshifts, which are available only for a small fraction of members. Therefore, in this paper, we only consider the mass distribution in the sky plane for the intracluster gas and member galaxies. Clear displacements between the ICM and member galaxies have been observed in many merging clusters (e.g., Maurogordato et al., 2008; Dawson et al., 2012; Jee et al., 2014; Golovich et al., 2016, 2017), as member galaxies, similar to the dark matter, move almost collisionless during the cluster merger, while the intracluster gas evolves under dynamic pressures (e.g., Powell et al., 2009). The simulation made by Poole et al. (2006) indicates that the dark matter generally takes longer time to reach the virialization state than the gaseous component, especially for mergers between subclusters with large mass difference (e.g., ). Considering that both member galaxies and the dark matter are almost collisionless, it is natural to expect the relaxation time for member galaxies is also longer than that of the ICM. In the following, we show the different relaxed state of member galaxies and ICM in the 24 quasi-equilibrium clusters.
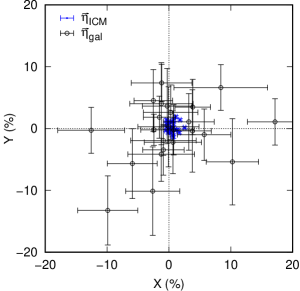
The departure of the flux-weighted centroid from the brightness peak is generally very small for symmetric distributions, but could be large for disturbed systems. In Fig. 2, the distribution of normalized centroid offsets is shown for the ICM (, dots) and member galaxies (, circles). It is clear that the offsets calculated from member galaxies () are more scattered than those from the ICM ().


Observationally, galaxy clusters in dynamical equilibrium state usually show a roundish morphology with a small difference in any direction. In Fig. 3, we compare the sphere indices (upper panel) and ellipticities (lower panel) of clusters measured from distributions of member galaxies and ICM. The upper panel shows that all the 24 clusters exhibit larger non-spherical symmetry for member galaxies than for the ICM. The lower panel indicates that all clusters show larger , suggesting that the distribution of member galaxies is more elongated than that of the diffuse ICM. If we take galaxies as the tracer of dark matter, our result is consistent with the simulations made by McDonald et al. (2022), which show that 90% clusters display a more elongated dark matter morphology when compared to the gaseous component.
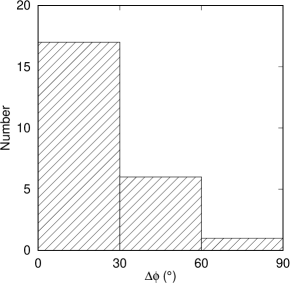
In Fig. 4, we show the distribution of , the deviation angle between cluster orientations estimated from member galaxies and the ICM, for the 24 clusters. It is clear that the cluster orientations indicated by member galaxies tend to align with those measured from the ICM, which is consistent with our recent work (Yuan & Wen, 2022). The orientation uncertainties are generally very small, see Table 1, so the alignment will not be significantly weakened by data uncertainties. The spatial orientation is the reflection of cluster angular momentum, which is further linked to the direction(s) of the post merger(s). The orientation alignment shown in Fig. 4 indicates that the information of post mergers is stored simultaneously in the distributions of member galaxies and ICM, though the structures of the two components differ in detail.
The large discrepancy between the ICM and member galaxies in clusters, like in the Bullet cluster, indicates that they evolve differently in the early stages of merging. The results presented in this paper describe the picture of dynamic evolution in later stages. The angular momentum accompanied by the post-merger is stored in or transformed into the ICM and member galaxies simultaneously, therefore the cluster orientations indicated by the two matter components are consistent with each other. The diffuse ICM evolves under non-negligible viscosity, causing the angular momentum of the ICM introduced by the merger to dissipate quickly into other directions. As a result, the distribution of the ICM tends to be isotropic, giving the ICM a roundish morphology with small centroid offset and asymmetry. However, collisions between member galaxies are rare, so the relaxation timescale of member galaxies is larger than that of the ICM. Such cases have been simulated by Poole et al. (2006). For two clusters with a mass ratio of 1:1, the relaxation timescale for the whole system is about Gyr. The gaseous component generally reaches the virialization state about 0.5 Gyr eariler than the dark matter. For the 10:1 mergers, the virialization timescale of the gaseous components is about 6.4 – 7.4 Gyr, while the dark matter needs much longer time ( Gyr) to reach the virialization criteria in .

In Fig. 5, we explore if the difference of dynamic features between member galaxies and the ICM is related to other properties of clusters, i.e., the concentration index (upper panels) and the cluster mass (lower panels). The significance of the Spearman rank-order correlation (see definition in p. 640 of Press et al., 1992) is used to assess weak but intrinsic correlations, with a zero value for a robust correlation and a non-zero value for no correlations. All four panels show a clear non-zero , which indicates that the difference in dynamical features for member galaxies and the ICM is independent of cluster mass and concentration index.
4 Summary
Earlier studies have shown that member galaxies and the ICM in galaxy clusters may exhibit different dynamically relaxed states, especially in the early stages of a cluster merger (e.g., Bradač et al., 2008). Simulations suggest that the almost collisionless dark matter and member galaxies generally shows more elongated distribution (McDonald et al., 2022) and take longer time to reach the dynamical equilibrium state (e.g., Poole et al., 2006) than the diffuse gaseous component. In this study, we focus on 24 massive clusters that are in quasi-equilibrium state as indicated by their X-ray images. The cluster orientations and three kinds of dynamical parameters, i.e., the normalized centroid offset , the sphere index and the ellipticity , for the distributions of member galaxies and ICM are calculated through the same method in the same region. While the cluster orientations indicated by the two matter components are well aligned, the dynamical parameters derived from member galaxies are systematically larger than those obtained from the diffuse ICM. This suggests that the diffuse gaseous component reaches a more relaxed state than collisionless member galaxies after cluster mergers. We find that the difference in dynamical features between member galaxies and the ICM is not related to cluster mass and center concentration.
Acknowledgements
We thank the anonymous referee for insightful comments which helped us to improve the paper. This work is partially supported by the National Natural Science Foundation of China (No. 11988101, 12073036, 11833009), the science research grants from the China Manned Space Project (No. CMS-CSST-2021-A01, CMS-CSST-2021-B01) and the National SKA Program of China (Grant No. 2022SKA0120103). HB obtains support from the Deutsche Forschungsgemeinschaft through the Excellence Cluster Origins and GC is supported by the Deutsches Zentrum für Luft- und Raumfahrt through project 50 OR 2204. This work is based on observations obtained with XMM-Newton, an ESA science mission with instruments and contributions directly funded by ESA Member States and NASA. Funding for the Sloan Digital Sky Survey IV has been provided by the Alfred P. Sloan Foundation, the U.S. Department of Energy Office of Science, and the Participating Institutions. SDSS acknowledges support and resources from the Center for High-Performance Computing at the University of Utah. The SDSS web site is www.sdss.org.
Data availability
The data underlying this article will be shared on reasonable request to the first author. More optical and X-ray data on large samples of galaxy clusters can be found at the webpage: http://zmtt.bao.ac.cn/galaxy_clusters/.
References
- Arnaud et al. (2010) Arnaud M., Pratt G. W., Piffaretti R., Böhringer H., Croston J. H., Pointecouteau E., 2010, A&A, 517, A92
- Berrier et al. (2009) Berrier J. C., Stewart K. R., Bullock J. S., Purcell C. W., Barton E. J., Wechsler R. H., 2009, ApJ, 690, 1292
- Bradač et al. (2008) Bradač M., Allen S. W., Treu T., Ebeling H., Massey R., Morris R. G., von der Linden A., Applegate D., 2008, ApJ, 687, 959
- Buote & Canizares (1992) Buote D. A., Canizares C. R., 1992, ApJ, 400, 385
- Carter & Metcalfe (1980) Carter D., Metcalfe N., 1980, MNRAS, 191, 325
- Clowe & Schneider (2002) Clowe D., Schneider P., 2002, A&A, 395, 385
- Clowe et al. (2004) Clowe D., Gonzalez A., Markevitch M., 2004, ApJ, 604, 596
- Clowe et al. (2006) Clowe D., Bradač M., Gonzalez A. H., Markevitch M., Randall S. W., Jones C., Zaritsky D., 2006, ApJ, 648, L109
- Dawson et al. (2012) Dawson W. A., et al., 2012, ApJ, 747, L42
- Donnarumma et al. (2011) Donnarumma A., et al., 2011, A&A, 528, A73
- Faber & Jackson (1976) Faber S. M., Jackson R. E., 1976, ApJ, 204, 668
- Fabian (2012) Fabian A. C., 2012, ARA&A, 50, 455
- Golovich et al. (2016) Golovich N., Dawson W. A., Wittman D., Ogrean G., van Weeren R., Bonafede A., 2016, ApJ, 831, 110
- Golovich et al. (2017) Golovich N., van Weeren R. J., Dawson W. A., Jee M. J., Wittman D., 2017, ApJ, 838, 110
- Huang et al. (2016) Huang H.-J., Mandelbaum R., Freeman P. E., Chen Y.-C., Rozo E., Rykoff E., Baxter E. J., 2016, MNRAS, 463, 222
- Jee et al. (2014) Jee M. J., Hughes J. P., Menanteau F., Sifón C., Mandelbaum R., Barrientos L. F., Infante L., Ng K. Y., 2014, ApJ, 785, 20
- Lynden-Bell (1967) Lynden-Bell D., 1967, MNRAS, 136, 101
- Mann & Ebeling (2012) Mann A. W., Ebeling H., 2012, MNRAS, 420, 2120
- Markevitch et al. (2002) Markevitch M., Gonzalez A. H., David L., Vikhlinin A., Murray S., Forman W., Jones C., Tucker W., 2002, ApJ, 567, L27
- Maurogordato et al. (2008) Maurogordato S., et al., 2008, A&A, 481, 593
- McDonald et al. (2022) McDonald W., Obreschkow D., Garratt-Smithson L., 2022, MNRAS, 516, 5289
- McGee et al. (2009) McGee S. L., Balogh M. L., Bower R. G., Font A. S., McCarthy I. G., 2009, MNRAS, 400, 937
- Niederste-Ostholt et al. (2010) Niederste-Ostholt M., Strauss M. A., Dong F., Koester B. P., McKay T. A., 2010, MNRAS, 405, 2023
- Piffaretti & Valdarnini (2008) Piffaretti R., Valdarnini R., 2008, A&A, 491, 71
- Piffaretti et al. (2011) Piffaretti R., Arnaud M., Pratt G. W., Pointecouteau E., Melin J. B., 2011, A&A, 534, A109
- Plionis (2002) Plionis M., 2002, ApJ, 572, L67
- Poole et al. (2006) Poole G. B., Fardal M. A., Babul A., McCarthy I. G., Quinn T., Wadsley J., 2006, MNRAS, 373, 881
- Powell et al. (2009) Powell L. C., Kay S. T., Babul A., 2009, MNRAS, 400, 705
- Press et al. (1992) Press W. H., Teukolsky S. A., Vetterling W. T., Flannery B. P., 1992, Numerical recipes in FORTRAN. The art of scientific computing
- Ramella et al. (2007) Ramella M., et al., 2007, A&A, 470, 39
- Roettiger et al. (1993) Roettiger K., Burns J., Loken C., 1993, ApJ, 407, L53
- Roettiger et al. (1996) Roettiger K., Burns J. O., Loken C., 1996, ApJ, 473, 651
- Roettiger et al. (1997) Roettiger K., Loken C., Burns J. O., 1997, ApJS, 109, 307
- Santos et al. (2008) Santos J. S., Rosati P., Tozzi P., Böhringer H., Ettori S., Bignamini A., 2008, A&A, 483, 35
- Splinter et al. (1997) Splinter R. J., Melott A. L., Linn A. M., Buck C., Tinker J., 1997, ApJ, 479, 632
- Struble & Ftaclas (1994) Struble M. F., Ftaclas C., 1994, AJ, 108, 1
- Wen & Han (2013) Wen Z. L., Han J. L., 2013, MNRAS, 436, 275
- Wen & Han (2015) Wen Z. L., Han J. L., 2015, ApJ, 807, 178
- Wen et al. (2009) Wen Z. L., Han J. L., Liu F. S., 2009, ApJS, 183, 197
- Wen et al. (2012) Wen Z. L., Han J. L., Liu F. S., 2012, ApJS, 199, 34
- Yuan & Han (2020) Yuan Z. S., Han J. L., 2020, MNRAS, 497, 5485
- Yuan & Wen (2022) Yuan Z. S., Wen Z. L., 2022, MNRAS, 516, 3159
- Yuan et al. (2022) Yuan Z. S., Han J. L., Wen Z. L., 2022, MNRAS, 513, 3013
- de Theije et al. (1995) de Theije P. A. M., Katgert P., van Kampen E., 1995, MNRAS, 273, 30