High-redshift metallicity calibrations for JWST spectra: insights from line emission in cosmological simulations
Abstract
Optical emission-line ratios are traditionally used to estimate gas metallicities from observed galaxy spectra. While such estimators have been calibrated primarily at low redshift, they are commonly used to study high-redshift galaxies, where their applicability may be questioned. We use comprehensive emission-line catalogues of galaxies from the IllustrisTNG simulation including ionization by stars, active nuclei and shocks to reassess the calibrations of both optical and ultraviolet metallicity estimators at redshifts . For present-day galaxies, the predicted optical-line calibrations are consistent with previously published ones, while we find different ultraviolet-line ratios, such as He ii /C iii] , to provide powerful metallicity diagnostics. At fixed metallicity, most emission-line ratios are predicted to strongly increase or decrease with redshift (with the notable exception of N2O2=[N ii]/[O ii] ), primarily because of a change in ionization parameter. The predicted dependence of R3=[O iii]/H and R23=([O ii] +[O iii])/H, and to a slightly lesser extent R2=[O ii] /H and O32=[O iii]/[O ii] , on O abundance for galaxies at agrees remarkably well with -based measurements in 14 galaxies observed with JWST. This success leads us to provide new calibrations of optical and ultraviolet metallicity estimators specifically designed for galaxies at , to guide interpretations of future, high-redshift spectroscopic surveys. We further demonstrate that applying classical calibrations to high-redshift galaxies can bias O-abundance estimates downward by up to 1 dex, leading to the conclusion of a stronger evolution of the mass-metallicity relation than the actual one.
keywords:
galaxies: abundances; galaxies: formation; galaxies: evolution; galaxies: general; methods: numerical1 Introduction
Shedding light on the metal enrichment history of galaxies is an essential step toward understanding galaxy formation and evolution. Specifically, gas-phase metallicity has been observed to strongly correlate with galaxy stellar mass in the nearby universe (Lequeux et al., 1979; Kinman & Davidson, 1981; Vila-Costas & Edmunds, 1992; Baldry et al., 2002; Tremonti et al., 2004). This “mass-metallicity” relation is thought to be shaped by a balance between gas accretion from the circumgalactic and intergalactic media and gas outflows driven by different physical processes, such as feedback from massive stars and supernovae, and active galactic nuclei (AGN; see, e.g., the model predictions of Hirschmann et al., 2013; Hirschmann et al., 2016; Davé et al., 2017; Torrey et al., 2019; De Lucia et al., 2020, and the review by Maiolino & Mannucci, 2019). In fact, state-of-the-art cosmological simulations adopting different prescriptions for these processes have been shown to diverge greatly in their predictions of the mass-metallicity relation, especially at high redshift (Somerville & Davé, 2015; Naab & Ostriker, 2016). Reliable measurements of the mass-metallicity relation at different cosmic epochs are essential to better constrain these uncertain physical processes in galaxy-formation simulations.
Observationally, the gas-phase metallicity of a star-forming galaxy can be estimated from a wide variety of nebular emission lines at ultraviolet (UV) to infrared (IR) wavelengths. There are four main approaches to this, which rely on: (i) metal-recombination lines; (ii) collisionally-excited lines combined with estimates of the electronic temperature and density (the ‘direct-’ approach); (iii) empirical calibrations of line-intensity ratios as a function of metallicity; and (iv) theoretical calibrations of line-intensity ratios as a function of metallicity. The recombination-line approach, which provides the most accurate metallicity estimates, can be used in practice only in nearby H ii regions, where weak metal-recombination lines, such as [C ii]4267 and [O ii]4650, are measurable (e.g., Esteban et al., 2014). The direct- method relies on measurements of -sensitive auroral-line intensities, such as [O iii] and [N ii], which also tend to be weak, except in metal-poor galaxies (Kewley et al., 2019, and references therein). For these reasons, various authors have proposed ‘empirical’ relations to estimate gas-phase metallicity (oxygen abundance) from intensity ratios of strong, easily-measurable emission lines, such as [O ii] , H and [O iii], which are calibrated using samples of H ii regions and galaxies for which auroral-line measurements are also available (e.g. Pagel et al., 1980; Pettini & Pagel, 2004; Pilyugin & Grebel, 2016; Marino et al., 2016). More recently, Curti et al. (2020) proposed an updated set of empirical relations including a comprehensive set of optical emission lines, calibrated using a large sample of galaxies from the Sloan Digital Sky Survey (SDSS, Abazajian et al., 2009). Yet, the direct- metallicity measurements on which these calibrations rely have known caveats, as they depend for example indirectly on models to correct for unobserved states of ionization and exist primarily for low-redshift galaxies (e.g., Gutkin et al., 2016; Kewley et al., 2019; Cameron et al., 2022).
An alternative to the above empirical approach is to appeal to photoionization models to relate observable intensity ratios of strong emission lines to gas metallicity. This has been explored by different groups using the public photoionization codes cloudy (Ferland et al., 2017) and mappings (Sutherland & Dopita, 2017), for various assumptions about the nature of the ionizing sources (stars, AGN, radiative shocks; e.g., Charlot & Longhetti, 2001; Kewley & Dopita, 2002; Kobulnicky & Kewley, 2004; Nagao et al., 2011; Gutkin et al., 2016; Feltre et al., 2016; Byler et al., 2018). While this approach allows one to fully investigate the influence of the many adjustable model parameters on predicted emission-line intensities, the wide ranges of theoretically allowed parameters and degeneracy of solutions generally imply large uncertainties on the estimated quantities (e.g., Chevallard & Charlot, 2016; Vidal-García et al., 2022). Hence, the four approaches described above to estimate gas-phase metallicities in galaxies each have their own strengths and weaknesses. Unfortunately, estimates based on different empirical and model metallicity calibrations can be significantly discrepant (e.g., Kewley & Ellison, 2008; Stasińska, 2005; Peimbert et al., 2017; Kewley et al., 2019), implying large uncertainties in the derived mass-metallicity relation of nearby galaxies.
Over the past fifteen years, major efforts have been devoted to the exploration of the gas-phase metallicities of galaxies at higher redshift, mainly by means of near-infrared (IR) spectroscopic surveys (e.g. Maiolino et al., 2008; Troncoso et al., 2014; Zahid, 2014; Erb et al., 2016; Shapley et al., 2017; Maiolino & Mannucci, 2019). Such studies often rely on metallicities estimated from observed line ratios using calibrations derived at . These studies generally find that a mass-metallicity relation was already in place at and evolved down to such that the average gas-phase metallicity at a fixed stellar mass decreased with time (Zahid et al., 2013; Maiolino et al., 2008; Kobulnicky & Kewley, 2004), in a way qualitatively consistent with expectations from various models and simulations (e.g., Hirschmann et al., 2016; Davé et al., 2017; Torrey et al., 2019).
Despite this achievement, the robustness of metallicity estimates of high-redshift galaxies obtained using calibrations derived at remains debated, mainly because of the potentially very different conditions in the interstellar medium (ISM) of such galaxies relative to their low-redshift counterparts (Kewley et al., 2019; Maiolino & Mannucci, 2019). In fact, Bian et al. (2018) find that metallicities derived using the direct- method in local SDSS analogues of galaxies are discrepant from those derived using standard metallicity calibrations. Another complication is that metallicity and ionization parameter can have similar effects on strong-line luminosity ratios, which some methods have been developed to overcome (e.g., Poetrodjojo et al., 2018; Izotov et al., 2019; Kewley et al., 2019). Nevertheless, to date, no robust metallicity calibrations could be derived for large samples of high-redshift galaxies, for the following main two reasons: (i) auroral lines are typically too faint to be detected in high-redshift spectra, preventing direct- metallicity estimates, although small samples are starting to be gathered out to (e.g. Patrício et al., 2018; Sanders et al., 2023; Curti et al., 2023); and (ii) predictions from photoionization models span wide ranges of adjustable parameters, which are unconstrained outside any cosmological context.
The newly commissioned James Webb Space Telescope (JWST) and its near-IR spectrograph NIRSpec (Jakobsen et al., 2022; Ferruit et al., 2022) provide a revolutionary means of exploring the rest-frame UV- and optical-line properties of galaxies out to very high redshift. For example, the faint [O iii] auroral line has already been detected out to by, e.g., Curti et al. (2023) and Sanders et al. (2023). Both studies find that the metallicities derived using the direct- method in high-redshift galaxies differ from those that would be derived from strong emission-line luminosities using typical calibrations. This implies that a reassessment of metallicity calibrations at high redshift is required. Together with the results from other studies based on the direct- method and/or empirical calibrations (e.g. Langeroodi et al., 2022; Heintz et al., 2022; Schaerer et al., 2022; Trump et al., 2023), these first high-redshift data from JWST suggest that galaxies at –9 have metallicities either consistent with the extrapolation of the mass-metallicity relation at z2–3, or below this relation.
In the case of very distant galaxies, the strong rest-frame optical lines are shifted outside the window of JWST/NIRSpec. This occurs at for H and [N ii] and at for H and [O iii]. In such cases, rest-frame UV emission lines can be observed (e.g. Bunker et al., 2023) and provide valuable diagnostics of the physical conditions in the ISM (e.g. Stark et al., 2014). Still, the capability of UV-line ratios to trace metallicities is less well explored and understood than that of optical-line ratios, despite important efforts in photoinization modelling (e.g., Gutkin et al., 2016; Byler et al., 2018; Kewley et al., 2019).
A promising new alternative to classical calibrations of metallicity estimators at high redshift is offered by simulations of nebular-line emission of galaxy populations in a full cosmological context (e.g., Orsi et al., 2014; Hirschmann et al., 2017; Hirschmann et al., 2019; Hirschmann et al., 2022). This approach overcomes the simplifying assumptions inherent in the direct- method and reduces the wide range of adjustable parameters (such as SFR, ionization parameter, gas density, gas metallicity and C/O abundance ratio) spanned by grids of photoionization models to physically motivated combinations. Yet, despite the increasing number of theoretical studies in this field over the last few years (e.g. Orsi et al., 2014; Shimizu et al., 2016; Hirschmann et al., 2017; Hirschmann et al., 2019; Shen et al., 2020; Wilkins et al., 2020; Baugh et al., 2022; Garg et al., 2022), so far, none has focused on the calibration of strong-line emission to derive metallicities from high-redshift galaxy spectra.
In this paper, we fill this gap by appealing to the same methodology as in our previous work (Hirschmann et al., 2017; Hirschmann et al., 2019; Hirschmann et al., 2022) to model in a self-consistent way the emission-line properties of galaxy populations from the IllustrisTNG simulations; we incorporate the contribution to nebular emission from young star clusters, AGN, post-asymptotic-giant-branch (PAGB) stellar populations and fast radiative shocks. We achieve this by coupling photoionization models for young stars (Gutkin et al., 2016), AGN (Feltre et al., 2016), PAGB stars (Hirschmann et al., 2017) and fast, radiative shocks (Alarie & Morisset, 2019) with the IllustrisTNG cosmological hydrodynamic simulations. Our methodology offers a unique way to address important questions about the derivation of interstellar metallicities from optical- and UV-line ratios of galaxies at different cosmic epochs:
-
•
Are the relations between optical-line ratios and metallicity predicted by IllustrisTNG simulations for present-day galaxy populations consistent with published calibrations?
-
•
How do the relations between strong-line ratios and metallicity predicted by IllustrisTNG simulations evolve from to ? Is the application of metallicity calibrations derived at at high-redshift appropriate?
-
•
Can UV-line ratios enable a robust derivation of gas-phase metallicities for galaxy populations observable at redshifts in ongoing and planned JWST/NIRSpec surveys?
Answers to these questions will provide valuable insights into the chemical enrichment of galaxy populations observed out to cosmic dawn with JWST, and hence, into the cosmic evolution of the mass-metallicity relation.
The paper is structured as follows. We start by briefly describing the theoretical framework of our study in Section 2, including the IllustrisTNG simulation set, the photoionization models and the coupling methodology between simulations and emission-line models. Section 3.1 presents our main findings about the relations between strong optical-line ratios and interstellar metallicity in present-day simulated galaxies, and how these relations compare with observationally derived relations/calibrations. In Section 3.2, we explore the cosmic evolution of the relations between optical-line ratios and metallicity for IllustrisTNG galaxies out to and provide fitting functions for calibrations applicable to galaxies. Finally, in Section 3.3, we explore different UV-line ratios as tracers of interstellar metallicity in high-redshift galaxies, as guidance for future JWST observations. We address possible caveats of the usage of line-ratio calibrations to derive metallicities and discuss advantages and caveats of our approach in Section 4. Section 5 summarizes our main results.
2 Theoretical framework
In this paper, we take advantage of the modelled optical and UV emission lines of galaxy populations in a wide redshift range, as described in Hirschmann et al. (2022), using the IllustrisTNG100 and IllustrisTNG50 simulation suite (TNG100 and TNG50 hereafter, Pillepich et al., 2018; Springel et al., 2018; Nelson et al., 2018; Naiman et al., 2018; Marinacci et al., 2018; Nelson et al., 2019; Pillepich et al., 2019). In the following paragraphs, we briefly summarize the simulation details (Section 2.1), the emission-line models and coupling methodology (Section 2.2, Gutkin et al., 2016; Feltre et al., 2016; Hirschmann et al., 2017; Hirschmann et al., 2019; Alarie & Morisset, 2019; Hirschmann et al., 2022), referring the reader to the original studies for more details.
2.1 IllustrisTNG
IllustrisTNG is a suite of publicly available, large volume, cosmological, gravo-magnetohydrodynamical simulations, run with the moving-mesh code Arepo (Springel, 2010), and composed of three simulations with different volumes and resolutions: TNG300, TNG100 and TNG50, assuming the currently favoured Planck cosmology. In this work, we consider only the TNG100 and TNG50 simulations due to their higher resolution. The IllustrisTNG simulations include a comprehensive model for galaxy formation physics (Weinberger et al., 2017; Pillepich et al., 2018), which has been tuned to match observational constraints on the galaxy stellar-mass function and stellar-to-halo mass relation, the total gas-mass content within the virial radius of massive galaxy groups, the stellar-mass/stellar-size relation and the relation between black-hole (BH) mass and galaxy mass at . In an IllustrisTNG simulation, the properties of galaxies, galaxy groups, subhaloes and haloes (identified using the FoF and Subfind substructure-identification algorithms, see Davis et al., 1985 and Springel et al., 2001, respectively), are computed ‘on the fly’ and saved for each snapshot. In addition, an on-the-fly cosmic shock finder coupled to the code (Schaal & Springel, 2015) uses a ray-tracing method to identify shock surfaces and measure their properties. The IllustrisTNG simulations have been shown in various studies to provide a fairly realistic representation of the properties of galaxies evolving across cosmic time (e.g., Torrey et al., 2019). For more details on the simulations, we refer the reader to the original studies above.
2.2 Emission-line models and their coupling with simulated galaxies
We use the same methodology as in Hirschmann et al. (2017); Hirschmann et al. (2019); Hirschmann et al. (2022) to compute nebular-line emission of galaxies from the post-processing of the TNG50 and TNG100 simulations. For the entire analysis, we consider only well-resolved galaxies containing at least star particles, corresponding to stellar masses greater than and in the TNG50 and TNG100 simulations, respectively. For all these galaxies and their progenitors at , nebular emission from young star clusters (Gutkin et al., 2016), narrow-line regions (NLR) of AGN (Feltre et al., 2016) and PAGB stars (Hirschmann et al., 2017) is computed using version c13.03 of the photoionization code Cloudy (Ferland et al., 2013), while the emission from fast radiative shocks (Alarie & Morisset, 2019) is computed using Mappings V (Sutherland & Dopita, 2017). All photoionization calculations considered in this work were performed adopting a common set of element abundances down to metallicities of a few per cent of Solar (from Gutkin et al., 2016). For more details on the employed libraries of nebular-emission models, parameterised in terms of different stellar and ISM parameters, we refer the reader to Hirschmann et al. (2022).
We combine the IllustrisTNG simulations of galaxy populations described in Section 2.1 with these photoionization models by associating, at each time step, each simulated galaxy with the appropriate H ii-region, AGN-NLR, PAGB and radiative-shock models, which, taken together, constitute the total nebular emission of the galaxy. We achieve this using the procedure described in Hirschmann et al. (2017); Hirschmann et al. (2019); Hirschmann et al. (2022), by self-consistently matching the model parameters available from the simulations with those of the emission-line models. The ISM and stellar parameters of simulated galaxies are evaluated by considering all ‘bound’ gas cells and star particles (as identified by the Subfind algorithm; Section 2.1) for the coupling with the H ii-region and PAGB models, and within 1 kpc around the BH for the coupling with the AGN-NLR models. Since the simulations do not allow us to distinguish between metals in the dust and gas phases, we gather all metals under the term “interstellar metallicity” in the remainder of this paper.
A few photoionization model parameters cannot be defined from the simulation, such as the slope of the AGN ionizing spectrum (), the hydrogen gas density in individual ionized regions (), the dust-to-metal mass ratio () and the pre-shock density (). For these parameters we adopt the same values as in Hirschmann et al. (2022), which were shown in that work to reproduce many observational diagnostics of emission lines as summarized below.
2.3 Total emission-line luminosities, line ratios and equivalent widths of IllustrisTNG galaxies
The procedure described above allows us to compute the contributions of young stars, an AGN, PAGB stars and fast radiative shocks to the luminosities of various emission lines (such as , , , etc.) in a simulated galaxy. The total emission-line luminosities of the galaxy can then be calculated by summing these four contributions. For line luminosity ratios, we adopt for simplicity the notation . In this study, we focus on exploring line ratios built from five optical lines, H, [O iii], [O iii],111Note that with [O iii], we will always refer to [O iii] unless specified differently. H, [N ii] and [S ii] and nine UV lines, C iv (hereafter simply C iv ), He ii , O iii] (hereafter simply O iii] ), N iii] (multiplet), Si ii] , [Si iii]+Si iii] (hereafter simply Si iii] ), [C iii]+C iii] (hereafter simply C iii] ), C ii] and [O ii] (hereafter simply [O ii] ).
Hirschmann et al. (2022) have shown that the predicted basic properties of the emission lines of TNG galaxies are consistent with those observed, such as local optical line-ratio diagnostic diagrams, the evolution of the [O iii]/H ratio and the evolution of the optical line-luminosity functions. We note that in the present paper, unless otherwise stated, we do not consider attenuation by dust outside H ii regions and compare our predictions with observed emission-line ratios corrected for this effect.

3 Results
3.1 Optical emission-line ratios as tracers of interstellar metallicity in present-day galaxies
In this section, we start by exploring the relations between interstellar gas phase metallicity and strong optical-line ratios, often used as metallicity indicators, predicted for present-day galaxies in the IllustrisTNG simulations. We consider in particular: [N ii]/[O ii] (hereafter N2O2), [N ii]/[S ii] (N2S2), [N ii]/H (N2), [O ii]/H (R2), [O iii]/H/([N ii]/H) (O3N2), [O iii]/[O ii] (O32), [O iii]/H/([S ii]/H) (O3S2), [O iii]/H (R3), ([O iii]+[O ii])/H (here [O iii] is sum of [O iii] and [O iii] as in literature; R23), [O iii]/H+ [S ii]/H (RS23) and [S ii]/H (S2; note that the abbrevations of these line-ratios specified in the brackets will be used for the remainder of the paper). We also investigate how these relations differ for galaxies dominated by different ionizing sources. Following Hirschmann et al. (2022), we distinguish between five galaxy types, based on the predicted ratio of BH accretion rate (BHAR) to star formation rate (SFR) and the H-line luminosity. Specifically, SF-dominated, composite, AGN-dominated, PAGB-dominated and shock-dominated galaxies are defined as follows:
-
•
SF-dominated galaxies: BHAR/SFR and H H + H;
-
•
Composite galaxies: BHAR/SFR and H H + H;
-
•
AGN-dominated galaxies: BHAR/SFR and H H + H;
-
•
PAGB-dominated galaxies: H + H H;
-
•
Shock-dominated galaxies: H + H H.
We also investigate how the predicted relations between interstellar metallicity and observable line ratios compare with various empirical (Pettini & Pagel, 2004; Nagao et al., 2006; Maiolino et al., 2008; Bresolin, 2008; Pérez-Montero & Contini, 2009; Marino et al., 2013; Jones et al., 2015; Sanders et al., 2018; Curti et al., 2020) and theoretical (Kewley & Dopita, 2002; Kobulnicky & Kewley, 2004; Tremonti et al., 2004; Pérez-Montero & Amorín, 2017) calibrations.
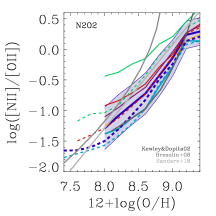
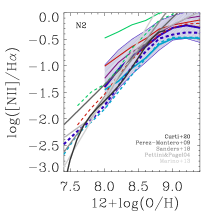
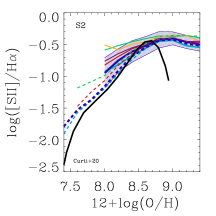
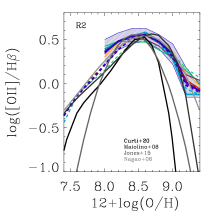
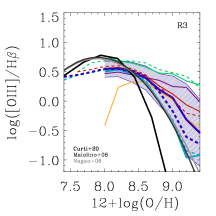
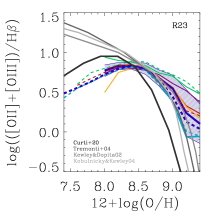
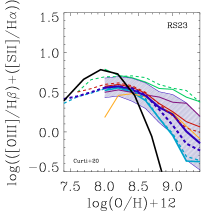
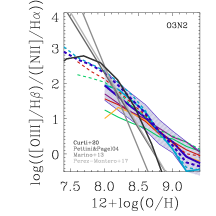
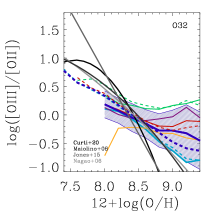
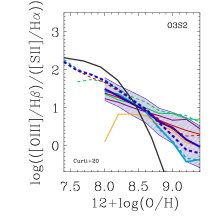
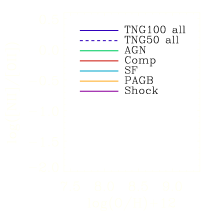
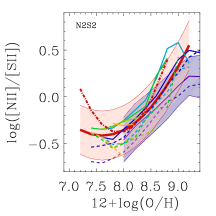
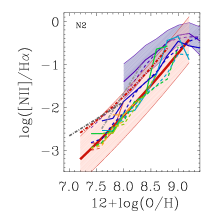
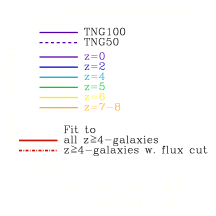
Fig. 1 shows the median N2O2, N2S2, N2, S2, R2, R3, R23, RS23, O3N2, O32 and O3S2 ratios (panels from top left to bottom right) against interstellar oxygen abundance, , for the TNG50 (dashed lavender line in each panel) and TNG100 (solid lavender line) galaxy populations, together with the 1 scatter about the TNG100 relations (shaded area). Also shown in each panel are the separate relations for SF-dominated (blue), composite (red), AGN- (green), PAGB- (orange) and shock-dominated (purple) galaxies.
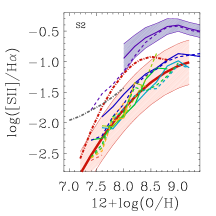
Irrespective of galaxy type, the N2O2, N2S2, N2 and S2 ratios (first row in Fig. 1) strongly increase with increasing oxygen abundance, mainly as a consequence of secondary nitrogen production and increasing sulfur abundance toward higher metallicity (the simulation follows the differential enrichment in several chemical elements; see Hirschmann et al., 2022). While the relations for SF-dominated galaxies are close to those for all galaxies, composite and AGN-dominated galaxies exhibit progressively higher line ratios at fixed oxygen abundance, reflecting the sensitivity of [N ii] and [S ii] to the hard ionizing radiation from the central accreting BH. Similarly, the hot ionizing radiation of PAGB- and shock-dominated galaxies produces slightly higher N2O2, N2 and S2 ratios.
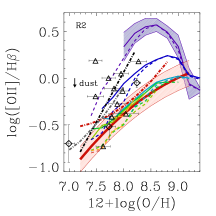
The R2, R3, R23 and RS23 ratios (middle row of Fig. 1) exhibit a more complex dependence on oxygen abundance: for metallicities lower than , these line ratios increase with increasing O/H because of the rising abundance of oxygen; instead, for higher metallicities, the line ratios drop because oxygen, which is a major gas coolant through infrared fine-structure transitions, causes to drop, resulting in fewer collisional excitations of optical transitions. R2 hardly changes among different galaxy types, since O and H have similar ionization energies ( eV). In contrast, since the production of O2+ requires energies in excess of 35.1 eV, R3, R23 and RS23 increase from SF- to PAGB- and shock-dominated, composite and AGN-dominated galaxies (the drop in these ratios for PAGB-dominated galaxies at low metallicities is caused by a shortening of the lifetime of hot PAGB stars).
The behaviour of the O3N2, O32 and O3S2 ratios (bottom row of Fig. 1) follows directly from the arguments above: as increases, the rise in [N ii] and [S ii] conspires with the drop in [O iii] to make O3N2, O32 and O3S2 decrease steeply. SF-dominated galaxies have properties similar to the median of the population (so do PAGB-dominated galaxies at high metallicities), while composite, AGN- and shock-dominated galaxies show comparatively elevated ratios (via enhanced O2+/O+) at fixed oxygen abundance.
Overall, a noteworthy conclusion from Fig. 1 is that the relations between oxygen abundance and optical-line ratios often used as metallicity indicators are predicted to depend significantly on galaxy type at . This implies that calibrations of metallicity estimators using restricted samples of H ii regions and star-forming galaxies do not apply to every galaxy. In fact, specific calibrations have been proposed for AGN narrow-line regions (Dors et al., 2017; Dors et al., 2021; Carvalho et al., 2020). Yet, since only a minor fraction ( per cent) of all galaxies host AGN, in practice, calibrations of metallicity estimators including all galaxy types are close to those for SF-dominated galaxies (as illustrated by Fig. 1).
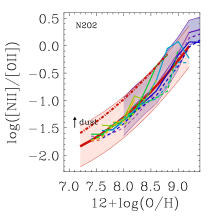
In the various panels of Fig. 1, we compare the relations predicted by the IllustrisTNG simulations with different calibrations derived from photoionization models (Kewley & Dopita, 2002; Kobulnicky & Kewley, 2004) and the direct- method (grey and black solid lines from Pettini & Pagel, 2004; Maiolino et al., 2008; Pérez-Montero & Contini, 2009; Marino et al., 2013; Sanders et al., 2018; Curti et al., 2020). We note that, in our models, the quantity includes oxygen in both the gas and dust phases (Section 2.2), while observational determinations pertain in general to purely gas-phase oxygen abundances. Since the gas-phase oxygen abundance is about 0.05–0.25 dex lower than the total interstellar O abundance (depending on metallicity and dust-to-metal ratio; see table 2 of Gutkin et al., 2016), we indicate by a horizontal arrow in the top-left panel of Fig. 1 the typical small amount, , by which the predicted relations should be shifted for a more accurate comparison with observational relations.
On the whole, there is good general agreement between published calibrations and those predicted for SF-dominated IllustrisTNG galaxies (and population medians), confirming that our modelling approach provides a valuable means of investigating the optical emission-line properties of present-day galaxies (see also Hirschmann et al., 2022). However, some tensions exist, particularly with the -based calibrations of Curti et al. (2020, black solid line) for metal-rich galaxies with . In this metallicity regime, the simulated R2, O3N2, O32, O3S2, R3, R23 and RS23 ratios are higher than expected from the calibration. A possible explanation for this discrepancy may be the well-known tendency for the direct- method to underestimate O/H in metal-rich galaxies (e.g., Kewley et al., 2019; Cameron et al., 2022). Another discrepancy in Fig. 1 is that our models predict R3, R23 and RS23 ratios 0.2–0.3 dex lower than literature calibrations (based on both the direct- method and photoionization-models) in metal-poor galaxies with . This may arise from: (i) different assumptions in the photoionization modelling; (ii) caveats in the derivation of low metallicities with the direct- method; and (iii) caveats in our modelling approach (see Section 4 for a more detailed discussion).
3.2 Cosmic evolution of the relations between optical-line ratios and metallicity
In the previous Section, we have seen that the relations between interstellar metallicity and strong optical-line ratios used as metallicity indicators predicted for IllustrisTNG galaxies at are qualitatively consistent with published calibrations. In this Section, we investigate how these relations are predicted to evolve out to redshifts . We compare our predictions with first measurements of based on the direct- method using JWST/NIRSpec observations of galaxies at (Curti et al., 2023; Sanders et al., 2023).
| Line ratio | ||||
|---|---|---|---|---|
| N2O2 | 5.246 | 0.206 | 1.230 | |
| N2S2 | 21.482 | 0.379 | 1.049 | |
| N2 | 0.096 | 2.175 | ||
| R2 | 3.120 | 0.275 | ||
| O3N2 | 2.759 | 1.082 | ||
| O32 | 0.521 | 0.4008 | 0.110 | |
| O3S2 | 17.638 | 0.143 | 0.523 | |
| R3 | 3.521 | 0.154 | ||
| R23 | 3.412 | 0.150 | ||
| RS23 | 3.527 | 0.154 | ||
| S2 | 6.521 | 0.728 |
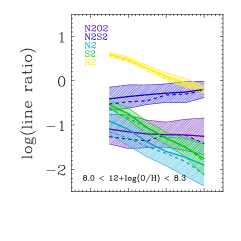
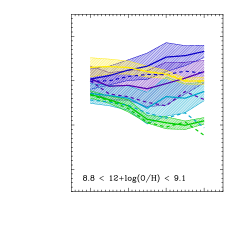
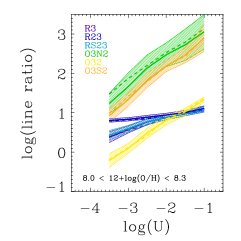
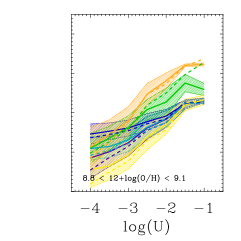
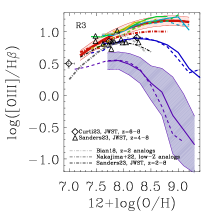
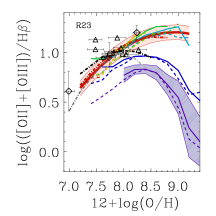
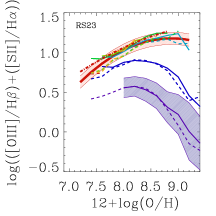
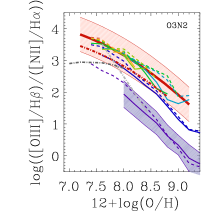
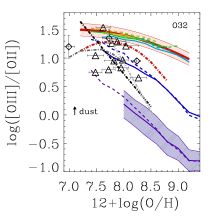
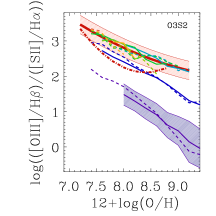
Fig. 2 shows the analogue of Fig. 1, but now only for the global TNG50 (dashed lines) and TNG100 galaxy populations (solid lines) and at different redshifts (lilac: , dark blue: , light blue: , turquoise: , green: , orange: –8). Where available, we report -based measurements of for local SDSS analogues of galaxies from Bian et al. (2018, light-grey, dashed-dotted lines in the O3N2, O32, R3 and R23 panels) and for local extremely metal-poor galaxies in the Subaru EMPRESS survey from Nakajima et al. (2022, dark-grey, dashed-dotted lines in the R2, R3, R23, O3N2 and O32 panels). Also shown are the results inferred from JWST/NIRSpec spectroscopy for three galaxies at 6–8 from Curti et al. (2023, black diamonds with error bars in the R2, O32, R3 and R23 panels) and 11 galaxies at –9 from Sanders et al. (2023, black triangles with error bars in the R2, O32, R3 and R23 panels), who also proposed new calibrations of the R2, R3, R23 and O32 metallicity estimators at redshifts –9 (black dashed-dotted lines).
Fig. 2 shows that, with the exception of N2O2 and N2S2, the dependence of optical metallicity estimators on is predicted to evolve strongly between to . At fixed oxygen abundance, N2, R2 and S2 are up to 1 dex smaller at than at the present day, while in contrast, R3, R23, RS23, O3N2, O32 and O3S2 increase, also by up to 1 dex, over the same redshift interval. The reason for this predicted redshift evolution can be traced back to the larger ionization parameter of simulated high-redshift galaxies relative to the present-day population, driven by higher SFRs and higher gas densities (see Hirschmann et al., 2022).
Fig. 3 illustrates the dependence of optical-line ratios on ionization parameter, for N2O2, N2S2, N2, S2 and R2 (different coloured lines) in the top row and R3, R23, RS23, O3N2, O32 and O3S2 in the bottom row, for IllustrisTNG galaxies in two narrow bins of oxygen abundances, (left column) and (right column). At fixed , N2O2 and N2S2 depend only weakly on because of the roughly similar ionization energies of N versus N+ (14.5 and 29.6 eV), O versus O+ (13.6 and 35.1 eV) and S versus S+ (10.4 and 23.3 eV), explaining the lack of evolution in the corresponding calibrations in Fig. 2. In contrast, N2, S2 and R2 drop and O3N2, O32, O3S2, R3, R23 and RS32 rise as increases because of the increasing abundance of N2+, S2+ and O2+ to the detriment of N+, S+ and O+.
Fig. 2 further shows that, beyond , the dependence of optical metallicity estimators on does not evolve much toward earlier cosmic epochs (light blue, green, yellow and orange lines). We provide fits to the predicted relations (thick red line in each panel of Fig. 2 with the fitted error shown by the red shaded area) of the form of , where and is the line ratio under consideration. The fit parameters , and as well as the goodness of the fit are listed in Table 1. These may be used as more physically motivated and potentially more robust metallicity calibrations for high redshift galaxies.
So far, we have not considered attenuation of emission lines by dust, while galaxies may contain significant amounts of dust, even at early cosmic epochs (e.g., Schneider et al., 2004; Zavala et al., 2022; Witstok et al., 2023). We estimate the impact of attenuation by dust on line ratios in Fig. 2, by adopting for simplicity the dust attenuation curve of Calzetti et al. (2000) with a V-band attenuation of AV = 0.5 mag. Under these assumptions, only line ratios including the [O ii] line, i.e., N2O2, R2 and O32, slightly increase or decrease (by –0.2 dex) because of dust attenuation, as quantitatively indicated by the black arrow in each of the three panels. Dust attenuation may, instead, have a negligible impact ( dex) on line ratios and their fitting curves not including [O ii] . We note that the adoption of a fixed attenuation curve might not be a very realistic approximation, and also that AV may depend strongly on both galaxy mass and redshift. To account for these effects, a more sophisticated modelling of dust attenuation would be required, which is beyond the scope of this study.
The predicted dependence of R23 on for galaxies at –8 in Fig. 2 agrees remarkably well with -based measurements in three galaxies at –8.5 by Curti et al. (2023) and 11 galaxies at –9 by Sanders et al. (2023). It is also consistent with the relation found by Nakajima et al. (2022) for local extremely metal-poor galaxies. As expected, the relation found by Bian et al., 2018 for local analogues of galaxies is more consistent with the predicted relation at . The agreement between observed and predicted relations is also very good for the R3 estimator, at least at metallicities below , while even the most distant metal-rich galaxies appear to fall closer to the predicted relation (but still in strong disagreement with the relation). The effect is more pronounced for the R2 and O32 estimators, for which, from low to high metallicities, the observed relations deviate progressively from the predicted ones, by up to dex above and dex below, respectively.
To investigate whether this bias may be caused by observational selection effects, we compute the relations obtained when requiring that all line fluxes associated with a simulated metallicity estimator exceed a given detection limit. For the purpose of illustration, we choose a limit of erg s-1 cm-2.222We note that this limit is a few times higher than the typical line fluxes of galaxies in the Curti et al. (2023) and Sanders et al. (2023) samples. We checked that similar results would be obtained by adopting a much lower detection limit of erg s-1 cm-2 when considering only SF-dominated galaxies – more representative of these two observational samples – to compute the IllustrisTNG calibrations in Fig. 2. This is because AGN-dominated and composite galaxies are generally brighter than SF-dominated ones at fixed stellar mass. Interestingly, the fit to the resulting flux-limited galaxy sample at –8 (thick dashed-dotted red line in Fig. 2) is roughly the same as for the full sample in the case of R23 (retaining good agreement with JWST data), slightly improved at high metallicities for R3, and significantly improved for R2 and O32, thus reducing (while not completely alleviating) the tension between predicted and observed calibrations. This behaviour arises from the faintness of the [O ii] line relative to H and [O iii], which preferentially selects out galaxies with low R2 and high O32, together with the fact that fainter galaxies tend to have higher , and hence higher R3.
Given the small number statistics of the Curti et al. (2023) and Sanders et al. (2023) samples and the purely theoretical nature of the model predictions (which have not calibrated against any high-redshift galaxy properties), we interpret the level of agreement between model and observations in Fig. 2 as an encouraging illustration of the success of our approach. This result emphasizes the importance of accounting for the redshift evolution of the calibration of optical-line ratios as metallicity estimators, together with the potential bias of empirical metallicity calibrations caused by flux-detection limits.

| Line ratio | ||||
|---|---|---|---|---|
| C3O3 | 1.632 | 0.064 | 0.106 | |
| C4O3 | 32.852 | 0.575 | 0.324 | |
| C4C3-O32 | 34.485 | 0.639 | 0.534 | |
| N3O3 | 4.361 | 0.195 | 0.854 | |
| Si2C2 | 4.770 | 0.089 | ||
| C3Si2 | 0.369 | 0.099 | 0.100 | |
| C2Si3 | 1.990 | 0.105 | 0.252 | |
| Si3O3 | 1.248 | 0.067 | 0.096 | |
| He2C3 | 6.569 | 0.220 | 1.182 | |
| He2C23 | 5.764 | 0.206 | 1.171 | |
| He2O3 | 8.185 | 0.284 | 1.557 | |
| He2Si3 | 6.938 | 0.216 | 1.764 |
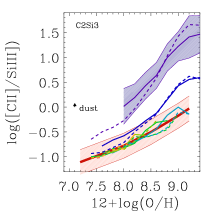
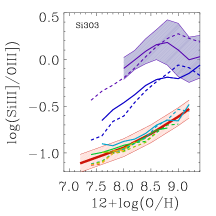
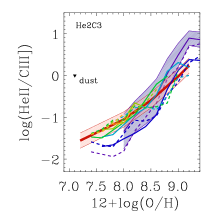
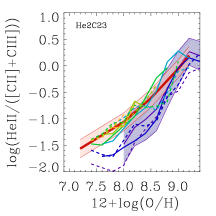
3.3 UV-line ratios as tracers of interstellar metallicity at different cosmic epochs
In Sections 3.1 and 3.2, we saw how optical-line ratios may be used to trace interstellar metallicity in simulated galaxies at both low and high redshift. The predicted relations between strong-line ratios and oxygen abundance are qualitatively consistent with published calibrations at and evolve strongly at higher redshift. In this Section, we investigate which UV-line ratios may provide alternative metallicity tracers in high-redshift galaxies, particularly when standard optical lines are redshifted outside the spectral window accessible to near-IR spectrographs, such as JWST/NIRSpec.
For this analysis, we consider the following UV-line ratios, motivated
both by recent review articles (Kewley et al., 2019; Maiolino &
Mannucci, 2019) and
predictions of photoionization models (Gutkin
et al., 2016; Byler et al., 2018):
– C iii] /O iii] (hereafter simply C3O3)
– C iv /O iii] (C4O3)
– C4O3 C3O3 (C4C3-O32)
– N iii] /O iii] (N3O3)
– Si ii] /C ii] (Si2C2)
– Si iii] /C iii] (Si3C3)
– C ii] /Si iii] (C2Si3)
– [Si iii]+Si iii]/O iii] (Si3O3)
– He ii /C iii] (He2C3)
– He ii /(C iii] +C ii] ) (He2C23)
– He ii /O iii] (He2O3)
– He ii /[Si iii]+Si iii] (He2Si3)
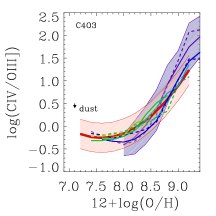
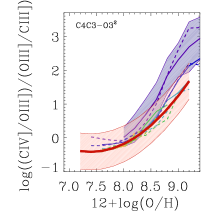
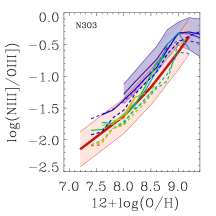
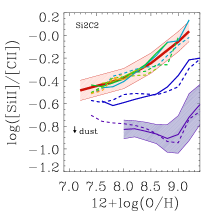
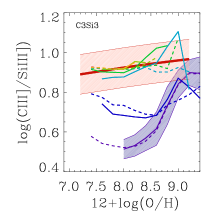
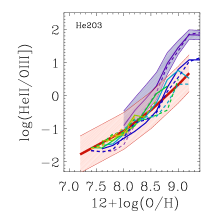
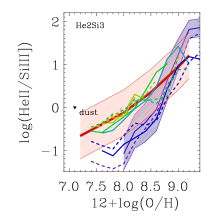
By analogy with Fig. 2, we show in Fig. 4 the evolution with redshift of the relations between these UV-line ratios and oxygen abundance, as predicted for the TNG50 and TNG100 galaxy populations. At , all relations show an increase in ratio strength with increasing metallicity, except for Si2C2 and Si3O3. As in the case of optical metallicity estimators, the relation for each UV-line ratio results from an interplay between relative enrichment in the involved elements, ionization energies required and sensitivity of the involved transitions to the drop in as more coolants are added to the ISM. Again, the change in the relations as increases can be traced back to the larger ionization parameter of simulated high-redshift galaxies relative to present-day ones (Section 3.2). From to , C4O3, C4C3-O32, N3O3, He2C3, HeC23 and He2O3 hardly change at fixed oxygen abundance, because of the similar ionization energies of the species involved in each ratio (see fig. 1 in Feltre et al., 2016). Instead, C3O3, Si2C2, C2Si3 and Si3O3 decrease, and Si2C2, C3Si3 and He2Si3 increase over the same redshift interval, as the different ionization energies of the involved species are more sensitive to changes in .
Beyond , the relations in Fig. 4 all have positive slopes and evolve very little out to earlier epochs. As in the case of optical metallicity estimators, we exploit this behaviour to provide fitting functions of the relations between UV-line ratios and oxygen abundance at of the form of , where and is the UV-line ratio under consideration (thick red line in each panel of Fig. 4). The fit parameters , and are listed in Table 2.
The above calibrations of UV metallicity estimators of high-redshift galaxies are only mildly (if at all) affected by dust attenuation: applying a Calzetti et al. (2000) attenuation curve with AV = 0.5 mag as in Section 3.2 implies changes of C4C3-O32, N3O3, C3Si3, Si3O3, He2C23 and He2O3 by less than 0.01 dex, while C2Si3 and C3O3 can increase by up to 0.08 dex and C4O3, He2C3, Si2C2 and He2Si3 decrease by up to 0.1 dex (as illustrated by the black arrow in the corresponding panels of Fig. 4).
The results of Fig. 4 suggest that the most promising UV metallicity estimators are N3O3, He2C3, He2C23 and He2O3, down to oxygen abundances as low as . These UV-line ratios exhibit the least scatter combined with a strong dependence on metallicity over nearly two orders of magnitude, . A limiting factor may be the observability of He ii , which tends to be weak in SF-dominated galaxies (see fig. 15 of Hirschmann et al., 2022).
Classical metallicity tracer
Metallicity tracer of this work

Classical Z-tracer
Metallicity tracer of this work

It is worth noting that the trends followed by C3O3, C4O3, N3O3, Si2C2, C2Si3, C3Si3 and He2C3 in Fig. 4, obtained by combining the models of Gutkin et al. (2016) and Feltre et al. (2016) with IllustrisTNG simulations, are largely consistent with those shown by Byler et al. (2018) and Kewley et al. (2019), with perhaps two notable exceptions: (i) Byler et al. (2018) find a strong dependence of C3Si3 on metallicity with a small scatter, whereas our models show that at high redshift, the relation flattens dramatically; (ii) while Byler et al. (2018) suggest that Si2C2 is a strong metallicity tracer, our models predict only a weak dependence on metallicity, with a change by less than 0.4 dex over the whole range . As noted by Kewley et al. (2019), metallicity tracers including a silicon line should be used with caution, because this element can be heavily depleted onto dust grains (for example, Gutkin et al. 2016 assume 90 per cent depletion; see their table 1). Since the amount of depletion may vary from galaxy to galaxy at different redshifts (and Si can be returned to the gas phase via dust destruction), the use of Si diagnostics requires depletion to be known and the appropriate value to be used in the photoionization modelling. Thus, differences in the dust treatment are likely to be at least in part responsible for the discrepancy between our results and those of Byler et al. (2018) for Si-based metallicity estimators.
3.4 Evolution of the mass-metallicity relation using different metallicity calibrations
An important outcome of Section 3.2 is that classical calibrations of optical-line ratios as metallicity estimators are predicted to evolve with redshift. In this section, we discuss the biases introduced by the adoption of calibrations at higher redshifts and the implications for the derived cosmic evolution of the mass-metallicity relation.
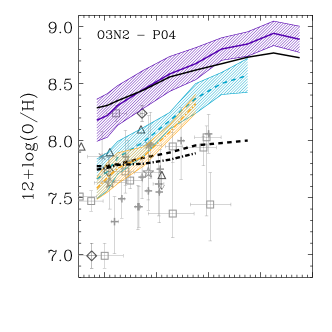
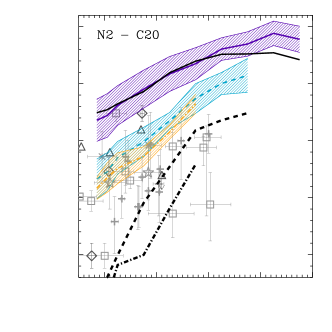
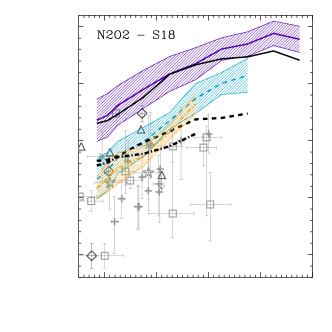
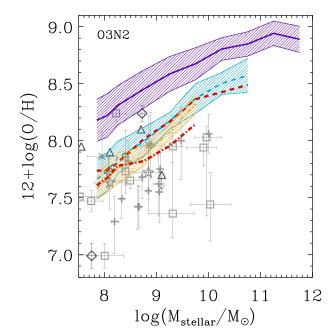
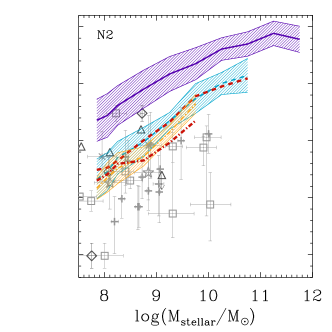
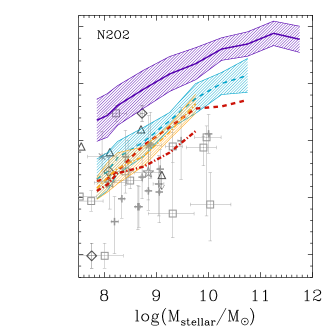
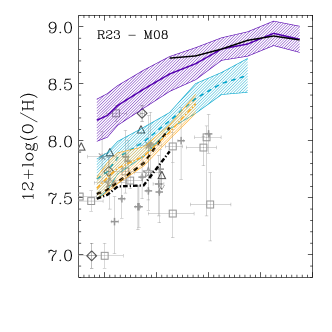
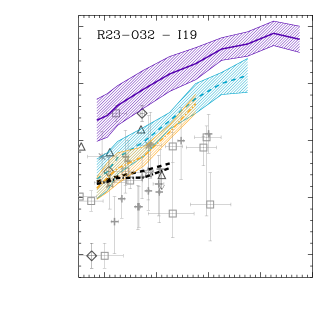
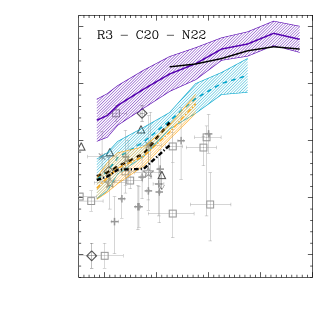
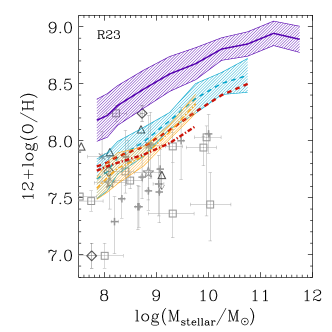
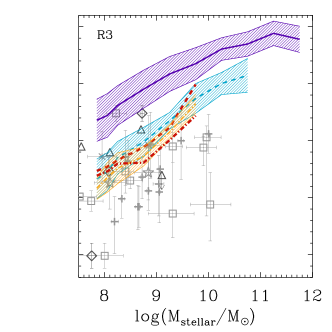
The evolution of the mass-metallicity relation predicted by the IllustrisTNG simulations has been presented, discussed and shown to be in broad general agreement with observations in Torrey et al. (2019).333We find that the mass-metallicity relations derived from the TNG50 and TNG100 simulations are largely consistent with one another and with Torrey et al. (2019). Heintz et al. (2022), who make different assumptions on computing metallicities of TNG galaxies, obtain different O abundances. In Figs 5 and 6, we show the corresponding dependence of on stellar mass predicted for TNG galaxies444Given the similarity of the mass-metallicity relations of TNG50 and TNG100 galaxies, both samples were merged to define a unique mass-metallicity relation of TNG galaxies and improve the clarity of Figs. 5 and 6. at three redshifts: (solid lavender line and shaded 1-scatter), (dashed light-blue line and scatter) and –8 (dashed-dotted orange line and scatter). This ‘intrinsic’ mass-metallicity relation of simulated galaxies (repeated in all panels) exhibits little evolution at . The different panels in both figures correspond to a selection of different optical-line ratios used in the literature to estimate metallicity: O3N2, N2, N2O2 in Fig. 5, and R23, R23-O32 (a new diagnostic defined as by Izotov et al., 2019) and R3 (with a specific calibration for local analogues of metal-poor galaxies from Nakajima et al., 2022) in Fig. 6. Also shown in all panels of both Figs 5 and 6 are data for the same –8 galaxies observed with JWST as in Fig. 2, with -based metallicity estimates from Curti et al. (2023, diamonds) and Trump et al. (2023, triangles). These are scattered around the predicted –8 relation.
We also report the JWST results of Langeroodi et al. (2022), Heintz et al. (2022) and Curti et al. (2023), who used different line ratios to estimate O abundances of –10 galaxies (R23-O32 in Langeroodi et al., 2022 and mainly R3 in Heintz et al., 2022 and Curti et al., 2023). These empirical measurements exhibit a large scatter in metallicity at fixed stellar mass, probably because of the large uncertainties affecting estimates of both quantities. The derived O abundances are typically a few dex below those predicted for TNG galaxies at –8.
In addition to these observations and the intrinsic mass-metallicity relation of TNG galaxies at different redshifts, we show in each panel the relation between and stellar mass derived in two ways from the simulated optical-line ratios of TNG galaxies. Firstly, in the top panels of Figs. 5 and 6, we use published calibrations of the metallicity estimators O3N2 (Pettini & Pagel, 2004), N2 (Curti et al., 2020) and N2O2 (Sanders et al., 2018), as well as R23 (Maiolino et al., 2008), R23-O32 (Izotov et al., 2019) and R3 (Curti et al. 2020 for and Nakajima et al. 2022 for ), with results shown as black solid, dashed and dot-dashed lines for , 4 and 6–8.555We do not consider here the empirical calibrations of Curti et al. (2020) for O3N2 and R23, which were derived over restricted ranges of line ratios not overlapping with those of high-redshift TNG galaxies. Secondly, in the bottom panels of Figs. 5 and 6, we adopt the new, redshift-dependent calibrations proposed in Section 3.2 (Table 1), with results shown as red solid, dashed and dot-dashed lines for , 4 and 6–8, respectively.
Figs. 5 and 6 show that using classical calibrations to estimate O abundances from optical-line ratios broadly retrieves the intrinsic mass-metallicity relation at for stellar masses below . Instead, the abundances of more massive galaxies derived using O3N2, N2, N2O2 and R3 tend to be underestimated by up to dex. At redshifts , the O abundances derived using the calibrations of all estimators except N2O2, and to a lesser extent also R3 (employing the novel calibration of Nakajima et al., 2022 for metal-poor galaxies), are biased downward by up to dex, implying a much stronger evolution of the mass-metallicity relation than the actual intrinsic one. Such a bias results from the sensitivity of these line ratios (but not N2O2) to the cosmic evolution of the ionization parameter, as seen in Section 3.2.
Instead, the mass-metallicity relations derived when adopting the new, redshift-dependent calibrations of optical estimators proposed in Section 3.2 are in excellent agreement with the intrinsic relations in Figs. 5 and 6, suggesting that these novel calibrations represent a promising tool to interpret spectroscopic surveys of high-redshift galaxies.
It is important to note that the results of Figs. 5 and 6 show only examples (O3N2, N2, N2O2, R23 and R3) of the potential of our new calibrations of classical metallicity estimators to interpret high-redshift galaxy spectra. We checked that the predictions for the other line ratios investigated in Section 3.2 (N2S2, S2, R2, RS23, O32 and O3S2) yield qualitatively similar results in avoiding biases introduced by the use of standard calibrations. It is also worth mentioning that attempts have been made in the literature to account for the secondary dependence of optical-line ratios on ionization parameter (see, e.g., Poetrodjojo et al., 2018; Kewley et al., 2019, and references therein). While those refined methodologies may improve the accuracy of metallicities estimates in high-redshift galaxies, a more thorough exploration goes beyond the scope of the present paper.
4 Discussion
In Section 3.1, we showed that the dependence of optical-line ratios on interstellar metallicity derived from the IllustrisTNG simulations of galaxy populations at agree qualitatively with published calibrations. This led us, in Sections 3.2 and 3.3, to make predictions about the dependence of optical- and UV-line ratios on oxygen abundance in distant galaxies, out to , and propose associated diagnostics of interstellar metallicity to guide interpretations of new spectroscopic surveys at high redshift. In Section 3.4, we illustrated the biases introduced by the adoption of calibrations at higher redshifts and the implications for the derived cosmic evolution of the mass-metallicity relation. These results represent an important extension of our earlier work focused on the use of IllustrisTNG simulations to identify diagnostics of the dominant ionizing sources in galaxies and the census of emission-line galaxies over cosmic time (Hirschmann et al., 2022).
An important outcome of the present work is the derivation of new calibration of metallicity estimators for high-redshift galaxies, aimed at providing a refined alternative to classical methods. In this context, in Section 4.1 below, we briefly summarize known caveats of classical (empirical and theoretical) metallicity estimators and, in Section 4.2, the benefits and limitations our approach, to put into perspective some quantitative differences between our predictions and published work.
4.1 Caveats of empirical and theoretical metallicity calibrations
The different methods used to derive metallicities from galaxy spectra, whether ‘empirical’ (i.e., based on the direct- method) or ‘theoretical’ (based on photoionization models), each suffer from their own known limitations, which are likely the origin of discrepancies between the different calibrations of metallicity estimators (Fig. 3.1). We briefly review these here.
Empirical metallicity calibrations and direct- method: the direct- method combines an estimate of the electron temperature from ratios of auroral to nebular forbidden-line intensities (e.g. [OIII]4363/5007) with an estimate of the electron density from ratios of nebular forbidden-line intensities (e.g. [OII]3729/3726). In general, the ions used to estimate and trace different ionized zones (e.g. O2+ versus O+), which forces the appeal to photoionization models to compute the contributions of all ionic species (O0, O+, O2+, etc.) to the total abundance of an element (O), based on the observed line luminosities (e.g., [O i], [O ii] , [O iii], etc.). Such models are typically calibrated on local H ii regions, whose properties may differ from those of chemically young galaxies at high redshift (see section 5.1 of Gutkin et al., 2016).
Even in the Milky Way and nearby extragalactic H ii regions, the direct- method appears to yield consistently lower abundances than those derived from metal-recombination lines, often considered as the ‘gold standard’ (Peimbert et al., 2017) of metallicity estimators (e.g. Peimbert et al., 1993; Mathis & Liu, 1999; Tsamis et al., 2003). This mismatch of typically dex (which can reach dex in some cases) is commonly referred to as the ‘abundance discrepancy factor’ (ADF; e.g., García-Rojas et al., 2005; Esteban et al., 2009; Tsamis et al., 2008; Mesa-Delgado & Esteban, 2010). While a number of factors may potentially cause this discrepancy (e.g., temperature fluctuations, departures from thermal equilibrium), its actual origin remains unknown (see Kewley et al., 2019; Maiolino & Mannucci, 2019 for further details).
Another complication of the direct- method (perhaps less relevant in the context of young high-redshift galaxies) is that auroral lines are rarely seen in galaxies with O abundances greater than and are sensitive to temperature gradients, which could lead to systematic underestimates of metallicity (by up to dex) in more metal-rich environments (see e.g. Stasińska, 2005; Kewley et al., 2019; Katz et al., 2023).
These various limitations can potentially bias metallicities estimated using strong-line ratios calibrated via the direct- method, especially for metal-rich galaxies. In fact, while modern spectrographs have enabled the assembly of -based metallicity estimates for large galaxy samples (e.g., Marino et al., 2013; Curti et al., 2020), different calibrations based on fits to such metallicities still exhibit large scatter (Fig. 1 above and figure 8 of Kewley et al., 2019).
Theoretical metallicity calibrations: originally, purely theoretical calibrations of metallicity estimators were developed using photoionization models to overcome discrepancies between different empirical calibrations. The main drawbacks of theoretical calibrations are the dependence on model assumptions (e.g., simplified 1D geometry, population synthesis modelling, ionization- versus density-bounded H ii regions, dependence on current atomic data, simplified density structure) and the incorporation of additional components (e.g., interstellar absorption, contribution by diffuse ionized gas). As a result, theoretical metallicity calibrations exhibit significant dispersion, just like empirical calibrations. The many adjustable parameters involved, which have competing effects on line ratios, hamper precise theoretical metallicity calibrations tailored to galaxies with unknown physical parameters at different cosmic epochs.
These difficulties can be partially overcome by using a Bayesian approach, in combination with large model libraries sampling the full space of adjustable parameters, to constrain metallicity from the simultaneous fitting of multiple emission lines (e.g., BEAGLE: Chevallard & Charlot, 2016; Vidal-García et al., 2022; NEBULARBAYES: Thomas et al., 2018; and BAGPIPES: Carnall et al., 2019). While this approach provides statistical constraints on metallicity, these may end up being quite broad when the number of emission lines detected with high signal-to-noise ratio is limited.
4.2 Caveats of our modelling approach
Our approach in this paper to identify metallicity diagnostics for high-redshift galaxy populations using IllustrisTNG simulations alleviates some of the drawbacks of the direct- method and the large photoionization-model grids described in Section 4.1. Yet, this approach has its own caveats and limitations.
Firstly, although it allows a drastic reduction of the parameter space of photoionization models by using the constraints from cosmological evolution, it still suffers from the intrinsic limitations of photoionization models (Section 4.1).
Secondly, large-scale cosmological simulations (such as IllustrisTNG) cannot directly resolve the multi-phase ISM nor many of the relevant processes such as stellar and AGN feedback. This forces the adoption of simplified and ad-hoc sub-resolution models to describe baryonic processes, which are typically different for different simulations. Even if the IllustrisTNG simulation suite has been extensively tested and validated for low-redshift studies (Section 2.1, and references therein), predictions for galaxies at redshifts greater than remain uncertain and can vary for different simulations and models (in particular the mass-metallicity relation; see, e.g., Somerville & Davé, 2015; Hirschmann et al., 2016; Heintz et al., 2022). Different prescriptions of baryonic processes or in the coupling of simulations with photoionization models might lead to differences in the predicted ionization parameter, which strongly influences emission-line ratios.
In fact, limitations arise from the approximations entailed in the coupling with photoionization models. For example, the lack of resolution of the ionized-gas component forces the adoption of approximate, galaxy-wide values of the hydrogen density, metallicity and dust-to-metal mass ratio (Section 2.2). Moreover, in our approach, the ionization parameter is controlled by the star formation rate, consistently with empirical relations linking , metallicity and specific SFR (see section 2.3.1 of Hirschmann et al., 2017, and also the recent correlation between and SFR surface density found by Reddy et al. 2023). A weaker correlation between and SFR would soften the predicted increase in from low to high redshift for IllustrisTNG galaxies.
Despite these limitations, as shown in Section 3.1 above and in Hirschmann et al. (2022), we have carefully and successfully validated our methodology against numerous observational emission-line properties of galaxies at redshifts –2, putting the current analysis and the predicted metallicity diagnostics for high-redshift galaxies on firm grounds.
5 Summary
Taking advantage of the multi-component emission-line catalogues of IllustrisTNG galaxy populations presented in Hirschmann et al. (2022), we have investigated different optical and UV emission-line diagnostics to estimate O abundances from observed spectra for both present-day and high-redshift galaxies. The emission-line catalogues have been constructed using the IllustrisTNG cosmological simulations and self-consistently connecting them to modern, state-of-the-art photoionization models (Gutkin et al., 2016; Feltre et al., 2016; Hirschmann et al., 2017; Alarie & Morisset, 2019) based on the methodology of Hirschmann et al. (2017); Hirschmann et al. (2019); Hirschmann et al. (2022). This allows us to compute the line emission from multiple components: young star clusters, AGN NLR, PAGB stellar populations and fast radiative shocks. We can summarize our main results as follows:
-
•
For present-day IllustrisTNG galaxies, the optical-line ratios [N ii]/[O ii] (N2O2), [N ii]/[S ii] (N2S2), [N ii]/H (N2), [S ii]/H (S2), [O iii]/H/([N ii]/H) (O3N2), [O iii]/[O ii] (O32), [O iii]/H/([S ii]/H) (O3S2), [O ii]/H (R2), [O iii]/H (R3), ([O iii]+[O ii])/H (with [O iii]=[O iii]+[O iii], R23) and [O iii]/H+[S ii]/H (RS23) are closely related to metallicity, in good agreement with empirical and theoretical metallicity calibrations of SF galaxies published in the literature. Instead, for AGN-dominated, composite, shock- and PAGB-dominated galaxies, the relations between optical-line ratios and metallicity can deviate from that for SF-dominated galaxies, and thus, should not be used as metallicity tracers for galaxy types other than SF.
-
•
From to , most considered optical-line ratios are predicted to strongly increase or decrease (except for N2O2 and N2S2) at fixed oxygen abundance. This mainly results from an evolution of the ionization parameter, which increases for higher-redshift galaxies due to their higher sSFR and gas density.
-
•
Also, several UV-line ratios, such as He ii /C iii] (He2C3), He ii /O iii] (He2O3) and N iii] /[O iii] (N3O3), appear to strongly correlate with the O abundance of simulated galaxies at different cosmic epochs, suggesting that these provide powerful metallicity diagnostics for distant metal-poor galaxies.
-
•
At , the calibrations of both optical and UV metallicity estimators exhibit almost no evolution with redshift. We find fairly good agreement between the predicted R2, R3, R23 and O32 calibrations and those observationally estimated using the direct- method for the –8 galaxies presented in Curti et al. (2023) and Sanders et al. (2023), in particular when accounting for observational-selection effects. We interpret the level of agreement between models and observations as an encouraging illustration of the success of our approach. This motivated us to propose novel diagnostics for the interstellar metallicity in distant galaxies out to , to guide interpretations of new spectroscopic surveys at high redshift.
-
•
The last points entail an important consequence for the evolution of the mass-metallicity relation at high redshift: when metallicities of observed, high-redshift galaxies are estimated from calibrations, they can be biased downward by up to 1 dex at a given galaxy stellar mass. This can lead to a much stronger evolution of the observed mass-metallicity relation than the actual one, hampering a meaningful comparison between models and observations.
Overall, the multi-component optical and UV emission-line galaxy catalogues provide useful insights into different optical and UV metallicity diagnostics for high-redshift galaxies. Specifically, the provided metallicity calibrations for high-redshift galaxies may guide the interpretation of different near- and far-future emission-line surveys not only with JWST/NIRSpec, but also with for example, VLT/MOONs and ELT/Mosaic. Our results may contribute to obtain robust insights into the chemical enrichment of galaxies out to cosmic dawn and, thus, provide accurate constraints to validate/invalidate uncertain models (e.g., stellar feedback) adopted in state-of-the-art cosmological simulations.
Data Availability
The data underlying this article are partly available in the article, will be also shared on reasonable request to the corresponding author.
Acknowledgements
The authors would like to thank Anna Feltre for providing us with the AGN photo-ionisaiton models, and the BEAGLE team for fruitful discussions. MH acknowledges funding from the Swiss National Science Foundation (SNF) via a PRIMA Grant PR00P2 193577 “From cosmic dawn to high noon: the role of black holes for young galaxies”. RSS is supported by the Simons Foundation.
References
- Abazajian et al. (2009) Abazajian K. N., et al., 2009, ApJS, 182, 543
- Alarie & Morisset (2019) Alarie A., Morisset C., 2019, Rev. Mex. Astron. Astrofis., 55, 377
- Baldry et al. (2002) Baldry I. K., et al., 2002, ApJ, 569, 582
- Baugh et al. (2022) Baugh C. M., Lacey C. G., Gonzalez-Perez V., Manzoni G., 2022, MNRAS, 510, 1880
- Bian et al. (2018) Bian F., Kewley L. J., Dopita M. A., 2018, ApJ, 859, 175
- Bresolin (2008) Bresolin F., 2008, in Israelian G., Meynet G., eds, The Metal-Rich Universe. p. 155 (arXiv:astro-ph/0608410)
- Bunker et al. (2023) Bunker A. J., et al., 2023, arXiv e-prints, p. arXiv:2302.07256
- Byler et al. (2018) Byler N., Dalcanton J. J., Conroy C., Johnson B. D., Levesque E. M., Berg D. A., 2018, ApJ, 863, 14
- Calzetti et al. (2000) Calzetti D., Armus L., Bohlin R. C., Kinney A. L., Koornneef J., Storchi-Bergmann T., 2000, ApJ, 533, 682
- Cameron et al. (2022) Cameron A. J., Katz H., Rey M. P., 2022, arXiv e-prints, p. arXiv:2210.14234
- Carnall et al. (2019) Carnall A. C., et al., 2019, MNRAS, 490, 417
- Carvalho et al. (2020) Carvalho S. P., et al., 2020, MNRAS, 492, 5675
- Charlot & Longhetti (2001) Charlot S., Longhetti M., 2001, MNRAS, 323, 887
- Chevallard & Charlot (2016) Chevallard J., Charlot S., 2016, MNRAS, 462, 1415
- Curti et al. (2020) Curti M., Mannucci F., Cresci G., Maiolino R., 2020, MNRAS, 491, 944
- Curti et al. (2023) Curti M., et al., 2023, MNRAS, 518, 425
- Davé et al. (2017) Davé R., Rafieferantsoa M. H., Thompson R. J., Hopkins P. F., 2017, MNRAS, 467, 115
- Davis et al. (1985) Davis M., Efstathiou G., Frenk C. S., White S. D. M., 1985, ApJ, 292, 371
- De Lucia et al. (2020) De Lucia G., Xie L., Fontanot F., Hirschmann M., 2020, MNRAS, 498, 3215
- Dors et al. (2017) Dors O. L. J., Arellano-Córdova K. Z., Cardaci M. V., Hägele G. F., 2017, MNRAS, 468, L113
- Dors et al. (2021) Dors O. L., Contini M., Riffel R. A., Pérez-Montero E., Krabbe A. C., Cardaci M. V., Hägele G. F., 2021, MNRAS, 501, 1370
- Erb et al. (2016) Erb D. K., Pettini M., Steidel C. C., Strom A. L., Rudie G. C., Trainor R. F., Shapley A. E., Reddy N. A., 2016, ApJ, 830, 52
- Esteban et al. (2009) Esteban C., Bresolin F., Peimbert M., García-Rojas J., Peimbert A., Mesa-Delgado A., 2009, ApJ, 700, 654
- Esteban et al. (2014) Esteban C., García-Rojas J., Carigi L., Peimbert M., Bresolin F., López-Sánchez A. R., Mesa-Delgado A., 2014, MNRAS, 443, 624
- Feltre et al. (2016) Feltre A., Charlot S., Gutkin J., 2016, MNRAS, 456, 3354
- Ferland et al. (2013) Ferland G. J., et al., 2013, rmxaa, 49, 137
- Ferland et al. (2017) Ferland G. J., et al., 2017, Rev. Mex. Astron. Astrofis., 53, 385
- Ferruit et al. (2022) Ferruit P., et al., 2022, A&A, 661, A81
- García-Rojas et al. (2005) García-Rojas J., Esteban C., Peimbert A., Peimbert M., Rodríguez M., Ruiz M. T., 2005, MNRAS, 362, 301
- Garg et al. (2022) Garg P., et al., 2022, ApJ, 926, 80
- Gutkin et al. (2016) Gutkin J., Charlot S., Bruzual G., 2016, MNRAS, 462, 1757
- Heintz et al. (2022) Heintz K. E., et al., 2022, arXiv e-prints, p. arXiv:2212.02890
- Hirschmann et al. (2013) Hirschmann M., et al., 2013, MNRAS, 436, 2929
- Hirschmann et al. (2016) Hirschmann M., De Lucia G., Fontanot F., 2016, MNRAS, 461, 1760
- Hirschmann et al. (2017) Hirschmann M., Charlot S., Feltre A., Naab T., Choi E., Ostriker J. P., Somerville R. S., 2017, MNRAS, 472, 2468
- Hirschmann et al. (2019) Hirschmann M., Charlot S., Feltre A., Naab T., Somerville R. S., Choi E., 2019, MNRAS, 487, 333
- Hirschmann et al. (2022) Hirschmann M., et al., 2022, arXiv e-prints, p. arXiv:2212.02522
- Izotov et al. (2019) Izotov Y. I., Guseva N. G., Fricke K. J., Henkel C., 2019, A&A, 623, A40
- Jakobsen et al. (2022) Jakobsen P., et al., 2022, A&A, 661, A80
- Jones et al. (2015) Jones T., Martin C., Cooper M. C., 2015, ApJ, 813, 126
- Katz et al. (2023) Katz H., et al., 2023, MNRAS, 518, 592
- Kewley & Dopita (2002) Kewley L. J., Dopita M. A., 2002, ApJS, 142, 35
- Kewley & Ellison (2008) Kewley L. J., Ellison S. L., 2008, ApJ, 681, 1183
- Kewley et al. (2019) Kewley L. J., Nicholls D. C., Sutherland R. S., 2019, ARA&A, 57, 511
- Kinman & Davidson (1981) Kinman T. D., Davidson K., 1981, ApJ, 243, 127
- Kobulnicky & Kewley (2004) Kobulnicky H. A., Kewley L. J., 2004, ApJ, 617, 240
- Langeroodi et al. (2022) Langeroodi D., et al., 2022, arXiv e-prints, p. arXiv:2212.02491
- Lequeux et al. (1979) Lequeux J., Peimbert M., Rayo J. F., Serrano A., Torres-Peimbert S., 1979, A&A, 80, 155
- Maiolino & Mannucci (2019) Maiolino R., Mannucci F., 2019, A&A Rev., 27, 3
- Maiolino et al. (2008) Maiolino R., et al., 2008, A&A, 488, 463
- Marinacci et al. (2018) Marinacci F., et al., 2018, MNRAS, 480, 5113
- Marino et al. (2013) Marino R. A., et al., 2013, A&A, 559, A114
- Marino et al. (2016) Marino R. A., et al., 2016, A&A, 585, A47
- Mathis & Liu (1999) Mathis J. S., Liu X. W., 1999, ApJ, 521, 212
- Mesa-Delgado & Esteban (2010) Mesa-Delgado A., Esteban C., 2010, MNRAS, 405, 2651
- Naab & Ostriker (2016) Naab T., Ostriker J. P., 2016, ArXiv:1612.06891,
- Nagao et al. (2006) Nagao T., Maiolino R., Marconi A., 2006, A&A, 459, 85
- Nagao et al. (2011) Nagao T., Maiolino R., Marconi A., Matsuhara H., 2011, A&A, 526, A149
- Naiman et al. (2018) Naiman J. P., et al., 2018, MNRAS, 477, 1206
- Nakajima et al. (2022) Nakajima K., et al., 2022, ApJS, 262, 3
- Nelson et al. (2018) Nelson D., et al., 2018, MNRAS, 475, 624
- Nelson et al. (2019) Nelson D., et al., 2019, MNRAS, 490, 3234
- Orsi et al. (2014) Orsi Á., Padilla N., Groves B., Cora S., Tecce T., Gargiulo I., Ruiz A., 2014, MNRAS, 443, 799
- Pagel et al. (1980) Pagel B. E. J., Edmunds M. G., Smith G., 1980, MNRAS, 193, 219
- Patrício et al. (2018) Patrício V., Christensen L., Rhodin H., Cañameras R., Lara-López M. A., 2018, MNRAS, 481, 3520
- Peimbert et al. (1993) Peimbert M., Storey P. J., Torres-Peimbert S., 1993, ApJ, 414, 626
- Peimbert et al. (2017) Peimbert M., Peimbert A., Delgado-Inglada G., 2017, PASP, 129, 082001
- Pérez-Montero & Amorín (2017) Pérez-Montero E., Amorín R., 2017, MNRAS, 467, 1287
- Pérez-Montero & Contini (2009) Pérez-Montero E., Contini T., 2009, MNRAS, 398, 949
- Pettini & Pagel (2004) Pettini M., Pagel B. E. J., 2004, MNRAS, 348, L59
- Pillepich et al. (2018) Pillepich A., et al., 2018, MNRAS, 473, 4077
- Pillepich et al. (2019) Pillepich A., et al., 2019, MNRAS, 490, 3196
- Pilyugin & Grebel (2016) Pilyugin L. S., Grebel E. K., 2016, MNRAS, 457, 3678
- Poetrodjojo et al. (2018) Poetrodjojo H., et al., 2018, MNRAS, 479, 5235
- Reddy et al. (2023) Reddy N. A., Topping M. W., Sanders R. L., Shapley A. E., Brammer G., 2023, arXiv e-prints, p. arXiv:2303.11397
- Sanders et al. (2018) Sanders R. L., et al., 2018, ApJ, 858, 99
- Sanders et al. (2023) Sanders R. L., Shapley A. E., Topping M. W., Reddy N. A., Brammer G. B., 2023, arXiv e-prints, p. arXiv:2303.08149
- Schaal & Springel (2015) Schaal K., Springel V., 2015, MNRAS, 446, 3992
- Schaerer et al. (2022) Schaerer D., Marques-Chaves R., Barrufet L., Oesch P., Izotov Y. I., Naidu R., Guseva N. G., Brammer G., 2022, A&A, 665, L4
- Schneider et al. (2004) Schneider R., Ferrara A., Salvaterra R., 2004, MNRAS, 351, 1379
- Shapley et al. (2017) Shapley A. E., et al., 2017, ApJ, 846, L30
- Shen et al. (2020) Shen X., et al., 2020, MNRAS, 495, 4747
- Shimizu et al. (2016) Shimizu I., Inoue A. K., Okamoto T., Yoshida N., 2016, MNRAS, 461, 3563
- Somerville & Davé (2015) Somerville R. S., Davé R., 2015, ARA&A, 53, 51
- Springel (2010) Springel V., 2010, MNRAS, 401, 791
- Springel et al. (2001) Springel V., White S. D. M., Tormen G., Kauffmann G., 2001, MNRAS, 328, 726
- Springel et al. (2018) Springel V., et al., 2018, MNRAS, 475, 676
- Stark et al. (2014) Stark D. P., et al., 2014, MNRAS, 445, 3200
- Stasińska (2005) Stasińska G., 2005, A&A, 434, 507
- Sutherland & Dopita (2017) Sutherland R. S., Dopita M. A., 2017, ApJS, 229, 34
- Thomas et al. (2018) Thomas A. D., Dopita M. A., Kewley L. J., Groves B. A., Sutherland R. S., Hopkins A. M., Blanc G. A., 2018, ApJ, 856, 89
- Torrey et al. (2019) Torrey P., et al., 2019, MNRAS, 484, 5587
- Tremonti et al. (2004) Tremonti C. A., et al., 2004, ApJ, 613, 898
- Troncoso et al. (2014) Troncoso P., et al., 2014, A&A, 563, A58
- Trump et al. (2023) Trump J. R., et al., 2023, ApJ, 945, 35
- Tsamis et al. (2003) Tsamis Y. G., Barlow M. J., Liu X. W., Danziger I. J., Storey P. J., 2003, MNRAS, 338, 687
- Tsamis et al. (2008) Tsamis Y. G., Walsh J. R., Péquignot D., Barlow M. J., Danziger I. J., Liu X. W., 2008, MNRAS, 386, 22
- Vidal-García et al. (2022) Vidal-García A., Plat A., Curtis-Lake E., Feltre A., Hirschmann M., Chevallard J., Charlot S., 2022, arXiv e-prints, p. arXiv:2211.13648
- Vila-Costas & Edmunds (1992) Vila-Costas M. B., Edmunds M. G., 1992, MNRAS, 259, 121
- Weinberger et al. (2017) Weinberger R., et al., 2017, MNRAS, 465, 3291
- Wilkins et al. (2020) Wilkins S. M., et al., 2020, MNRAS, 493, 6079
- Witstok et al. (2023) Witstok J., et al., 2023, arXiv e-prints, p. arXiv:2302.05468
- Zahid (2014) Zahid H. J. e. a., 2014, ApJ, 792, 75
- Zahid et al. (2013) Zahid H. J., Geller M. J., Kewley L. J., Hwang H. S., Fabricant D. G., Kurtz M. J., 2013, ApJ, 771, L19
- Zavala et al. (2022) Zavala J. A., et al., 2022, arXiv e-prints, p. arXiv:2208.01816