The isotropic center of NGC 5419 - A core in formation?
Abstract
With its cored surface brightness profile, the elliptical galaxy NGC 5419 appears as a typical high-mass early-type galaxy (ETG). However, the galaxy hosts two distinct nuclei in its center.
We use high-signal MUSE (Multi-Unit Spectroscopic Explorer111Based on observations collected at the European Organisation
for Astronomical Research in the Southern Hemisphere under ESO
program 099.B-0193(A).) spectral observations and novel triaxial dynamical orbit models to reveal a surprisingly isotropic central orbit distribution in NGC 5419.
Recent collisionless simulations of merging massive ETGs suggest a two-phase core formation model, in which the low-density stellar core forms rapidly by supermassive black holes (SMBHs) sinking into the center due to dynamical friction. Only afterwards the SMBHs form a hard binary and the black hole scouring process slowly changes the central orbit distribution from isotropic to tangential.
The observed cored density profile, the double nucleus and the isotropic center of NGC 5419 together thus point to an intermediate evolutionary state where the first phase of the core formation has taken place, yet the scouring process is only beginning. This implies that the double nucleus is a SMBH binary.
Our triaxial dynamical models indicate a total mass of the two SMBHs in the center of NGC 5419 of .
Moreover, we find that NGC 5419’s complex kinematically distinct core (KDC) can be explained by a coherent flip of the orbital rotation direction of stars on tube orbits at kpc distance from the galaxy center together with projection effects. This is also in agreement with merger simulations hosting SMBHs in the same mass regime.
1 Introduction
NGC 5419 is the dominant galaxy of the poor cluster Abell S753 observable in the Centaurus constellation. With a brightness of , NGC 5419 belongs to the class of massive early type galaxies (ETGs), which are thought to undergo gas-poor galaxy merging processes at least at late evolutionary phases (see e.g. Bender 1988; Bender et al. 1992; Kormendy & Bender 1996; Moster et al. 2018). As a result of this, ETGs at the high-mass end characteristically show a central cored surface brightness (SB) profile (Nieto et al., 1991a, b; Faber et al., 1997; Lauer et al., 2005, 2007) that indicates a light-deficit (Kormendy & Bender, 2009; Kormendy & Ho, 2013). Such cores naturally form in gas-poor mergers with supermassive black holes (SMBHs) (e.g. Begelman et al. 1980; Hills & Fullerton 1980; Ebisuzaki et al. 1991; Milosavljević & Merritt 2001; Merritt 2006; Rantala et al. 2018; Nasim et al. 2021). By using high resolution galaxy merger simulations with SMBHs Rantala et al. (2018) and Frigo et al. (2021) recently revealed that the core formation actually happens in two phases: First, dynamical friction causes the two SMBHs of the progenitor galaxies to sink to the centre of the merger remnant. This causes the surrounding stars to move to larger radii, happens rapidly (some tens of Myrs) and is the main driver of the formation of the shallow central stellar density core. At the time when the two SMBHs form a tightly bound (hard) binary, most of the stellar density core structure is already in place. Afterwards, in a second and slower phase, slingshot interactions with the formed SMBH binary kick out stars, which are predominantly on radial orbits and get close enough to the binary. The result is a characteristic tangentially-biased central orbit structure. This second, slower evolutionary phase (several 100 Myrs to up to 1 Gyr) flattens the SB profile only slightly. Inner tangential anisotropy is common in ETGs (e.g. Gebhardt et al. 2003; McConnell et al. 2012). The most massive ETGs, in particular, have a very uniform anisotropy structure near their cores that matches very well with the predictions of the SMBH binary model (Thomas et al., 2014; Rantala et al., 2018; Mehrgan et al., 2019).
While NGC 5419 with its central SB core appears as a typical ETG at first glance, this galaxy is clearly distinct from other elliptical core galaxies as Hubble Space Telescope (HST) as well as SINFONI observations reveal a double nucleus in its center (Lauer et al. 2005; Capetti et al. 2005; Lena et al. 2014; Mazzalay et al. 2016). Besides a low-luminosity active galactic nucleus at the center of the galaxy (Goss et al. 1987; Subrahmanyan et al. 2003; Balmaverde et al. 2006), NGC 5419 hosts a second nucleus about arcsec away from the AGN (Lauer et al. 2005; Capetti et al. 2005; Lena et al. 2014; Mazzalay et al. 2016). Assuming a distance of Mpc for NGC 5419 (Mazzalay et al., 2016), this corresponds to a separation of pc. High-resolution SINFONI spectra reveal a high stellar velocity dispersion around both nuclei and between them, suggesting that each nucleus carries a SMBH and their masses are almost equal (Mazzalay et al., 2016). Axisymmetric dynamical models indicate a combined SMBH mass of (Mazzalay et al., 2016). Together with the observed radial separation of the two nuclei this implies that if the double nucleus is indeed a SMBH binary, then it is just about to become a hard binary.
With this, NGC 5419 could be the first ETG observed just at the transition between the two core formation phases described above: The rapid formation of the shallow density core through dynamical friction appears to have already taken place. However, the observed double nucleus suggests that the slower BH scouring process causing the characteristic tangentially biased central orbit distribution, might have just begun.
The key to reveal the evolutionary stage of NGC 5419 is therefore to get precise measurements of NGC 5419’s anisotropy profile. In this paper, we provide a new dynamical analysis of NGC 5419 that extends the previous models by Mazzalay et al. (2016) in several respects: we use additional 2D stellar kinematics based on MUSE observations (Mehrgan et al., 2019). We use non-parametric line-of-sight velocity distributions (LOSVDs) derived with a novel non-parametric spectral fitting code called WINGFIT (Thomas et al., in prep). Our new dynamical models are triaxial rather than axisymmetric. They are based on a newly developed non-parametric deprojection routine SHAPE3D (de Nicola et al., 2020) and the new triaxial Schwarzschild code SMART (Neureiter et al., 2021). The current version of SMART uses a recently developed model selection framework (Lipka & Thomas, 2021; Thomas & Lipka, 2022) that avoids potential biases in -based models.
This Letter is organized as follows: In Section 2 we briefly present the observations. In Section 3 we explain the used triaxial deprojection and dynamical modeling machinery. In Section 4 we present our findings and results, which we discuss and summarize in Sections 5 and 6.
2 Observations
2.1 Surface Brightness
For our current study we use the SB data and analysis as described in Mazzalay et al. (2016), which is based on archived HST/WFPC2 F555W and Spitzer IRAC1 images. After masking the two central nuclei and matching the HST and Spitzer data (for a more detailed description we refer to Mazzalay et al. 2016), the elliptical isophotes were determined by using the IRAF task ELLIPSE (Jedrzejewski, 1987). The corresponding surface brightness, ellipticity and position angle profiles are discussed in more detail in Section 4.2.
2.2 Non-parametric Stellar Kinematics
The stellar kinematical data for the dynamical modelling is based on spectroscopic observations for NGC 5419 using MUSE at the Very Large Telescope (VLT). NGC 5419 is part of a larger sample222ESO program 099.B-0193(A), P.I. J. Thomas of massive ETGs for which we obtained MUSE spectra with high signal-to-noise ratio (SNR). The data analysis and stellar kinematical measurements for the whole program are described in detail in Mehrgan et al. (2023).
Our kinematic analysis is identical to what is explained in that paper only that we bin for a SNR that is roughly twice as high (to reduce the number of kinematic bins by a factor of two). The resulting spatial resolution is sufficiently high in order to produce robust and reliable results (see Sections 4.3 and 4.4) and it allows for an optimized usage of computational resources.
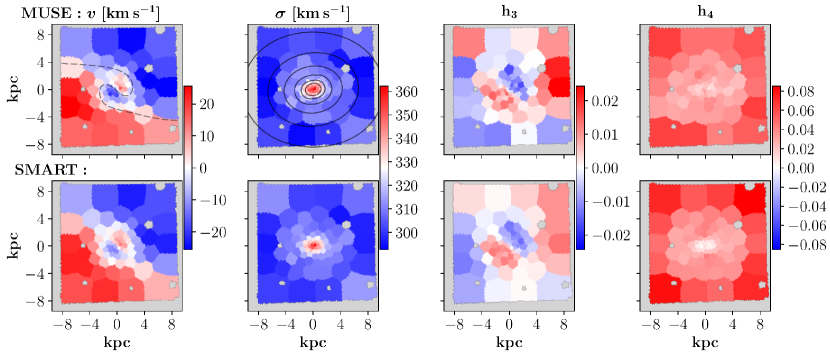
To extract non-parametric LOSVDs for the dynamical models we use the non-parametric modelling code WINGFIT. For illustration, we show maps of the velocity, dispersion and Gauss-Hermite coefficients (Gerhard, 1993; van der Marel & Franx, 1993) derived from the non-parametric LOSVDs of NGC 5419 in Figure 1. More details about the kinematics and plots with the entire LOSVDs can be found in Mehrgan et al. (2023).
To test higher spatial resolution in the center, we performed an additional modeling analysis of a combined data-set of the MUSE kinematics together with central adaptive-optics (AO) assisted near-infrared observations from the SINFONI integral field spectrograph at the VLT. We use the non-parametric LOSVDs derived from the SINFONI data by Mazzalay et al. (2016). The FOV of these data covers arcsec and the AO operation enabled a spatial resolution of arcsec. Similar to the study in Mazzalay et al. (2016) we exclude the innermost Voronoi bins with arcsec, where the galaxy hosts its double nucleus.
3 Triaxial Dynamical Modeling
NGC 5419 is the first galaxy which we analyse with our new triaxial codes SHAPE3D for the deprojection and SMART for the Schwarzschild orbit models. The two codes are described in detail in de Nicola et al. (2020) and Neureiter et al. (2021). The Schwarzschild models (Schwarzschild, 1979) employ a new model selection framework extension, in which a generalised information criterion rather than the usual gets minimized (Lipka & Thomas, 2021; Thomas & Lipka, 2022). By taking the individual model’s degrees of freedom into account, bias in the evaluation of different mass models gets avoided. In Neureiter et al. (2023) and de Nicola et al. (2022a) we show that our triaxial models are able to recover the correct dynamical structure and mass composition of a realistic simulated ETG merger remnant with an accuracy at the 5%-10% level.
SMART uses the density output from SHAPE3D to compute the corresponding stellar part of the gravitational potential by expansion into spherical harmonics. SMART launches stellar orbits, including near-Keplerian orbits in the center, from a 5-dimensional orbit starting space. It can use the entire information contained in the non-parametric LOSVDs.
When modeling NGC 5419 with SMART we focus on recovering its stellar orbit distribution, in particular its anisotropy distribution. We furthermore want to obtain updated measurements of the stellar mass-to-light ratio and black hole mass of NGC 5419.
For the modelling we assume that the central region of NGC 5419 can be described by the potential of a single BH. We furthermore assume a constant mass-to-light ratio in our dynamical models and ignore possible initial mass function gradients.
We set up a parameter grid covering 10 stellar mass-to-light ratio values within with a corresponding grid size of and 10 tested black hole mass values within with .
We furthermore vary the viewing angles , and in our models in correspondence with the SB density candidates, which are provided by SHAPE3D.
SHAPE3D is able to constrain the range of possible orientations of a triaxial galaxy based on photometric information alone by discarding deprojections where the radial profiles of the flattenings and (with being the semi major, the semi intermediate and the semi minor axis of a triaxial galaxy) are not smooth (de Nicola et al., 2020, 2022b). When deprojecting the observed SB of NGC 5419 we apply an rms cutoff for the maximum discrepancy between the observed and modelled surface brightness. We furthermore discard all deprojections, where and deviate by more than 0.1 from their expected values due to radial changes in the order of the principal axes. With this, SHAPE3D provides 25 candidate orientations and respective luminosity profiles, which we probe with the dynamical models.
We assume a DM profile similar to a spherical NFW halo (Navarro et al., 1996), yet with an inner density slope . We vary the density normalisation at kpc () and use a fixed scale radius kpc.
Following triaxial symmetry we can separate the kinematic input data of NGC 5419 along the galaxy’s apparent minor axis (cf. Figure 1) in order to model two equivalent data-sets without loss of information. This provides us with an estimate of the statistical error of our modeling results (cf. Neureiter et al. 2023).
4 Results
4.1 Kinematic recovery
Figure 1 shows the MUSE kinematic maps in the top row and the best-fit model by SMART in the bottom row. The kinematic structure of NGC 5419 can be well explained by the triaxial models (averaged over both sides we get ). As already visible in the SALT stellar kinematics (Mazzalay et al., 2016) but much more clearly revealed by the MUSE observations (Mehrgan et al., 2023), the velocity map of NGC 5419 points to a kinematically distinct core (KDC).
We will come back to the KDC in Section 4.5.
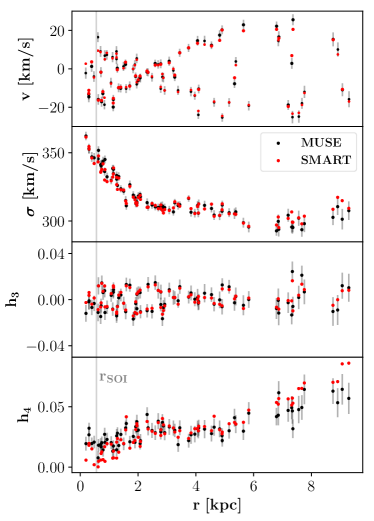
Figure 2 shows the quality of the triaxial dynamical modeling fit illustrated by a comparison between the Gauss-Hermite parameterizations of the observed MUSE data (black data-points) and modelled fit (red data-points).
We note that all the main features of NGC 5419, in particular its specific velocity pattern including the KDC, can be explained in our equilibrium triaxial model. This suggests that the galaxy is observed at an evolutionary state, which is relaxed enough such that the dynamical modelling results are robust.
4.2 Shape recovery
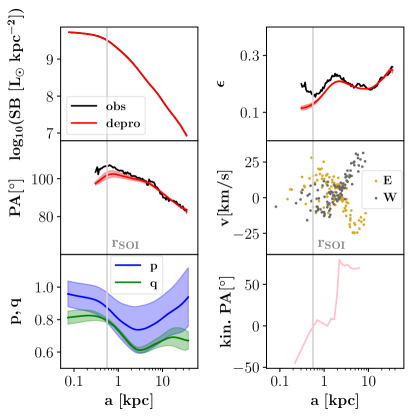
Figure 3 shows profiles of the observed surface brightness (), ellipticity () and position angle () (colored black) as well as the best-fit deprojection (colored red).
The red shaded line is bounded by the two best-fit deprojections from modeling the two sides of the kinematic observational data (cf. Section 3) and we also show their mean (red solid line).
The data suggest that the line-of-sight is between the galaxy’s long and short axes with best-fit viewing angles333For a detailed explanation of the viewing angles, see Neureiter et al. (2021). of .
At this orientation both the SB profile and the kinematics of the triaxial model match very well with the observations at all radii. The observed position angle shows a twist of , such that the galaxy cannot be axisymmetric. The relatively large twist combined with the observed ellipticity, which shows bumps of the order of , are consistent with the findings described in the following Sections 4.4, 4.5 and 5.2 pointing to a late but presumably not fully completed merging phase of the galaxy.
The deprojected - and -profiles match the observed ones particularly well outside the sphere-of-influence (grey vertical line, c.f. Section 4.3).
The radii, where the ellipticity profile features bumps, appear to match with the radii at which the rotation velocity along the galaxy’s photometric major axis (aligned along , see Figure 1) changes direction (see lower right panel in Figure 3 with the Eastern side of the kinematic data colored brown and the Western side colored grey). These radial changes in the rotation direction can also be seen in the velocity map in Figure 1 and their origin will be explained in Section 4.5.
The bottom left panel in Figure 3 shows the - and -profiles of the best-fit deprojections of NGC 5419, where one can see that this galaxy becomes oblate both in its center and its outskirts while it is triaxial at intermediate radii.
The bottom right panel quantifies the variation of NGC 5419’s kinematic position angle (determined with the Kinemetry Code of Krajnović et al. 2006). The total amplitude of the variation is , in accordance with the visual impression that the centre of the galaxy ’almost’ counter rotates with respect to the outer parts (Fig. 1).
Altoghether, the i) photometric twist, ii) variation in and iii) the change of the kinematic are typical for a triaxial galaxy.
4.3 Mass recovery
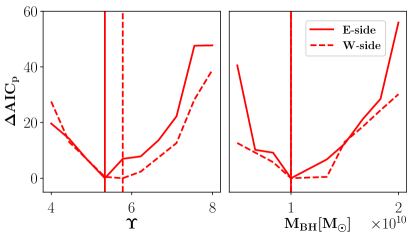
Figure 4 shows the minimum-subtracted curves (cf. Section 3)
plotted against the stellar mass-to-light ratio (left panel) and black hole mass (right panel). The solid line corresponds to the models covering the Eastern side and the dashed line corresponds to the models covering the Western side of the kinematic MUSE data. The vertical lines mark the mass parameters of the best-fit model, which is determined as the one with the minimum of all -values.
As Figure 4 shows, we obtain well-determined best-fit mass parameters.
Averaged over the two sides we measure and .
With this, we determine a sphere of influence444We use the definition of the sphere of influence as the radius within which the total stellar mass equals the black hole mass. of kpc, i.e. arcsec, for NGC 5419.
We find that our best-fit BH mass well fits into the --correlation found by Rusli et al. (2013) based on 20 analysed core galaxies with dynamical measurements, confirming our results (we here use the core radius measurement arcsec from Mazzalay et al. 2016; also the similar core radius measurement of arcsec from Dullo & Graham (2014) aligns with the --correlation by Rusli et al. (2013) within its uncertainties). The DM density normalization is recovered as .
With a PSF-radius of arcsec for the MUSE data alone the sphere of influence of arcsec is marginally resolved. The constraints on are significant (the difference between the two modelled sides is very small), probably due to the high SNR ( per spectral bin in the optical region in each of about 220 Voronoi bins distributed over the whole FOV) in the MUSE data, which allows to extract LOSVDs with a high level of detail.
To test the robustness of our measurement, we performed an additional modeling analysis including the central AO assisted SINFONI data. While the focus of this cross-check is the recovery of NGC 5419’s central orbit distribution, which is of particular interest for our current study (see Sections 4.4 and 5.2), we also try to again recover and using this combined data-set.
Assuming that the SINFONI FOV coverage is too small to significantly affect the DM halo recovery, we remodelled a 2D grid with mass variations of the black hole and stellar mass-to-light ratio and set the gNFW parameters to the best-fit DM halo parameters from modelling the MUSE kinematics only.
With this simplified analysis, SMART finds a best-fit stellar mass-to-light ratio of and black hole mass of with an average kinematic deviation of only . With this, the so found BH mass deviates by % and the stellar mass-to-light ratio slightly deviates by % in comparison to the modeling results based on the MUSE data alone. More crucial, however, is the fact that the anisotropy profile stays unaffected by the used data-set and corresponding best-fit mass parameters (see Section 4.4).
4.4 Anisotropy recovery
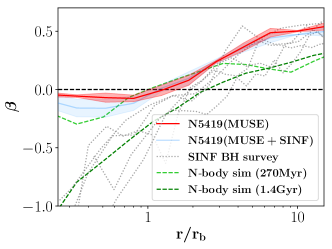
Figure 5 shows the mean anisotropy profile of the best-fit models of the two sides when modeling the MUSE data with SMART, plotted against the radius scaled by the core radius arcsec (Mazzalay et al., 2016). The red shaded region is bounded by the two respective best-fit models.
The anisotropy parameter (e.g. Binney & Tremaine 2008) consists of the velocity dispersions along the radial () and tangential directions () and describes whether a galaxy’s orbit distribution is radially anisotropic for or tangentially anisotropic for .
Our triaxial models reveal an isotropic, i.e. , central orbit distribution for NGC 5419. Such an isotropic central -profile is highly unusual for cored ETGs and we will discuss its implication further in Section 5.2.
The central isotropy remains when we model the combined data set MUSE+SINFONI (even though the best-fit models for this run are weakly tangential in the very center; cf. blue line in Figure 5).
As another robustness check we modified the smoothing parameter of the central deprojection. As visible in Figure 3, our best-fit deprojections used for the dynamical models show minor deviations in the - and -profiles within . By reducing the smoothing in SHAPE3D (for a detailed description see de Nicola et al. 2020), we obtained additional deprojections that better fit the central changes in and . As expected, however, remodelling the galaxy with these deprojections (in our best-fit MUSE mass distribution) had no impact on the central anisotropy structure.
4.5 Origin of the kinematically distinct core (KDC)
As already shown in Figure 1 and briefly described in Section 4.1, NGC 5419 shows a KDC. In general, KDCs together with isophote twists are frequently observed in massive ellipticals with depleted stellar cores like NGC 5419 (e.g. Efstathiou et al. 1982; Bender 1988; Franx & Illingworth 1988; Emsellem et al. 2004; Hau & Forbes 2006; McDermid et al. 2006; Krajnović et al. 2011; Ene et al. 2018).
The early standard model for KDCs in ETGs was early merging with dissipative formation of the KDC (see e.g. Bender 1996; Davies et al. 2001). This is a still valid formation scenario for some ellipticals, like NGC 5322 (Bender, 1988; Dullo et al., 2018) or IC 1459 (Franx & Illingworth, 1988; Cappellari et al., 2002), which show a fast rotating core with stars that counter-rotate in a disk on orbits that are close to circular and slow outer parts rotating in the opposite direction.
Several observations suggest that the stellar populations of KDCs in some slowly rotating ETGs show little or no difference to the stellar populations of the surrounding host galaxies (Davies et al. 2001; McDermid et al. 2006; Nedelchev et al. 2019; Kuntschner et al. 2010).
Recent high-resolution gas-free numerical merger simulations hosting SMBHs (Rantala et al. 2019; Frigo et al. 2021) provide another possible explanation for the origin of kinematically distinct velocity structures in such ETGs.
These simulations consist of collisionless dark matter halos, collisionless stellar components and SMBHs and they accurately compute the collisional interactions of the stars with the SMBHs with a regularized integration scheme (Rantala et al. 2017, 2018).
In these simulations, the formation of counter-rotating cores is explained by
the infall of the SMBHs with the bound stellar nuclei, which experience angular momentum reversals of their orbits after pericenter passages. The gravitational torque effects resulting in the reversals can be caused by deflections between the bulge and the halo due to the merger process (Barnes, 2016) or ”dynamical self-friction”, in which tidally expelled material exerts a force on the merger subhalo (van den Bosch & Ogiya, 2018).
The specific velocity pattern of NGC 5419 visible in Figure 1, however, not only shows a counter-rotating core but, more generally, a kinematically misaligned core in the sense that the inner velocity structure shows a slight misalignment in comparison to the direction of the outermost velocity structure. Moreover, the 2D velocity pattern resembles a kind of ’yin-yang symbol’ on the sky caused by an apparent connection between the velocity pattern of the KDC and its surrounding large-scale velocity field. The connections between the red and blue inner and outer velocity structures, which cause the similarity to a yin-yang symbol, become even more apparent with the finer bins of Mehrgan et al. (2023).
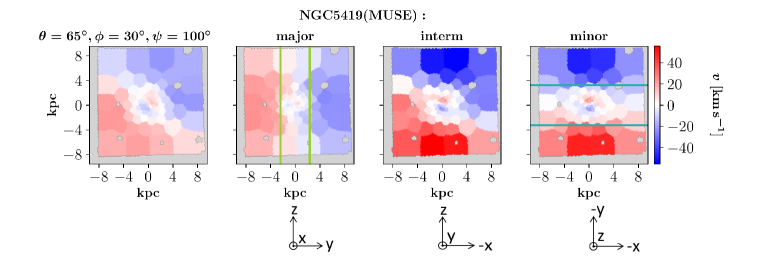
Figure 6 shows rotation maps of the best-fit model of the MUSE kinematics (when modeling the whole kinematic data with the best-fit parameters from the models for the Eastern side) projected along different line of sights: along the best-fit orientation of the galaxy (left panel), as well as along its three principal axes (labelled major, interm and minor). Our projected velocity maps reveal that the origin of such complex and misaligned KDCs as in NGC 5419 can be simply explained by an overlay of orbits rotating around two different axes in an equilibrium triaxial model. These orbits are z-tubes, e.g. visible in the major axis projection, and x-tubes, e.g. visible in the minor axis projection (cf. Figure 6, second and fourth panel).
As one can see in Figure 6, the z-tubes within kpc (marked as green vertical lines) and the x-tubes within kpc (marked as blue horizontal lines) rotate in the opposite direction as their respective counterparts at large radii.
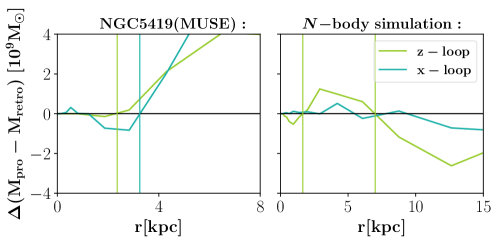
The left panel in Figure 7 demonstrates this behaviour in another way by showing the radial mass difference between prograde and retrograde z- and x-tube orbits, which is computed within radial shells.
The orbit classification in our triaxial dynamical models is thereby done by checking the sign conservation of the angular momentum components along the three principal axes during the surfaces of section (SOS) crossings (for a more detailed explanation see Neureiter et al. 2021).
Outside the flip-radius kpc of the x-tubes, the prograde component dominates and inside this radius the retrograde component dominates (we here define prograde orbits as the ones with and retrograde orbits as the ones with according to the coordinate systems shown in Figure 6). This is in agreement with the prominent central counter-rotation signal of the x-tubes visible in the minor-axis projection of our model of NGC 5419 (cf. Figure 6, fourth panel).
Outside of kpc, the prograde component of the z-tubes dominates clearly over the retrograde component and within kpc, the components are almost equal with a slight overabdundance of retrograde z-tubes. This corresponds to the weak central counter-rotation signal of the z-tubes visible in the major-axis projection of our model of NGC 5419 (cf. Figure 6, first row, second panel).
In order to understand whether the properties of NGC 5419’s KDC can be explained by the black-hole spin-flip scenario outlined above, we now compare it to the numerical -body simulation by Rantala et al. (2019) for which the counter-rotating core was shown to result from the rotation flips.
This ETG major merger simulation includes two equal-mass SMBHs with a total black hole mass of and the two progenitor galaxies are set up by using a spherically symmetric Dehnen density-potential (Dehnen, 1993) with an initial inner stellar density slope of .
In a series of recent papers (Neureiter et al. 2021; de Nicola et al. 2022a; Neureiter et al. 2023) we have modelled this simulation in great detail in order to test our triaxial modelling code. This -body simulation was designed to explain another core galaxy (NGC 1600) which is only slightly different from NGC 5419 in terms of its stellar and black-hole mass.
As shown in Rantala et al. (2019), the velocity amplitude of the KDC signal is qualitatively similar to the one observed in NGC 5419. Different to NGC 5419, this simulation has undergone a second reversal of the SMBH angular momentum.
As one can see in Figure 7, right panel, the rotation flip in the simulation is mainly caused by an overpopulation of retrograde z-loops within kpc, an overpopulation of prograde z-loops within kpc and an overpopulation of retrograde z-loops in the outskirts . The -body simulation’s outer flip-radius kpc thereby is qualitatively similar to NGC 5419’s single flip-radius.
With this, we find that in both cases, in NGC 5419 as well as in the -body simulation, the KDC can be explained by the mass excess of counter-/corotating tube orbits inside/outside the respective flip radii.
While the number of rotation flips and the type of affected tube orbits can be expected to depend on the merger’s specific initial conditions, like the orbit geometry and impact parameter, the spatial scale and velocity amplitude of NGC 5419’s KDC is notably similar to what can be found in the gas-free numerical merger simulation.
Alltogether this strongly suggests that the KDC in NGC 5419 formed as a result of orbital angular momentum flips of the BHs during a merging process.
5 Discussion
5.1 Comparison to other KDC studies
Other studies from the literature, which analysed KDCs with Schwarzschild models (Cappellari et al. 2002; van den Bosch et al. 2008; Krajnović et al. 2015; den Brok et al. 2021) suggested that their examined KDCs are not actually decoupled in the sense that counter-rotating orbits are not exclusively localized in the central region but present everywhere. This is in agreement with our analysis from Section 4.5, where we show that NGC 5419’s KDC results from an excess of tube orbits rotating in the contrary direction compared to the outskirts. A smooth excess mass profile as shown in Figure 7 is less likely for dissipationally formed KDCs in massive ETGs, such as in the already mentioned examples of NGC 5322 or IC 1459 (see Section 4.5), where the counter-rotating stars on a central disk have a more prominent separation in phase space. In this respect, the slow inner KDCs of some of the most massive galaxies might also be different from the ones in less massive galaxies, which are faster and probably also have a dissipative origin (McDermid et al., 2006). The stellar populations in KDCs of less massive galaxies are often distinct from the rest of the galaxy (Hau et al. 1999; McDermid et al. 2006; Nedelchev et al. 2019). The term kinematically decoupled core might be misleading when used for both cases. For most massive galaxies, the term kinematically decoupled core does neither infer an abrupt depletion of co-rotating orbits inside the KDC nor a distinct stellar population in the KDC. Nevertheless, the orbital properties inside the KDC are in some sense ’distinct’ from the rest of the galaxy. The specific properties of the KDC likely depend on the specific dynamics that take place in the centre of a merger remnant and are somewhat local and detached from the global properties of the remnant. A probably more intuitive description of a ”KDC” in slow rotating ETGs, as it is described in this study, might be a kinematically distinct or misaligned core (where a counter-rotating core would be a particular form of kinematical misalignment observed under certain viewing angles).
5.2 A core in formation?
NGC 5419’s isotropic central orbit distribution (Figure 5 and Section 4.4) differs significantly from the strong tangential anisotropy observed in other core galaxies with high-resolution SINFONI data (Thomas et al. 2014; grey lines in Figure 5). The orbital structure of these other core galaxies and in particular their central tangential anisotropy, however, is remarkably similar to the orbital structure in ETG merger simulations. The dark-green dashed line plotted in Figure 5 shows the -profile of the -body simulation by Rantala et al. (2018), which is observed Gyr after the merger has happened (we use kpc; Rantala et al. 2019).
Why is the core of NGC 5419 isotropic?
As already explained in the Introduction, the core formation happens in two phases: First, the formation of a shallow central stellar density profile happens very rapidly within a time scale of some ten million years around the first passage of the two galaxies. This is followed by the much slower BH slingshot process that changes the central orbital structure from being isotropic to becoming tangential on a timescale of some 100 million years up to a Gyr.
According to this, the ETG merger simulation snapshot Gyr after the merger represents a galaxy where both formation phases have completed and the core region is strongly tangential. The cored ETGs in the sample of Thomas et al. (2014) are all consistent with being ETGs where both core phases have already taken place.
A simple explanation for the fact that NGC 5419 already has a flattened density profile but is still isotropic in its center would be that the galaxy is just between the two phases: the rapid dynamical-friction driven formation of the shallow density core has already passed yet the scouring process is just to begin.
In fact, we analysed the same merger simulation (Rantala et al., 2018) at an earlier stage, Myr after the merger has happened, which is about the time when the BHs form a hard binary (Frigo et al. (2021); light green dashed line in Figure 5; we use ). As one can see, at this earlier evolutionary stage, the center of the ETG merger simulation is indeed still isotropic (as already described in Rantala et al. 2018 and Frigo et al. 2021). The similarity between the orbital structure of NGC 5419 and the early ETG merger simulation snapshot supports the idea that core scouring is just at the beginning in NGC 5419.
In principle, repeated minor mergers can also lead to a weaker central tangential anisotropy as compared to a single major merger (Rantala et al., 2019), which can stay almost isotropic over time. However, the KDC in NGC 5419 is characteristic for the orbital reversals of the progenitor SMBHs that only happen in major mergers with massive SMBHs (Rantala et al., 2019). Another scenario presented in Rantala et al. (2019), which results in an only mildly tangentially biased central orbit distribution and velocity structure similar to NGC 5419, would be a major merger of two core galaxies.
Here, violent relaxation processes and the infall of SMBHs can weaken the tangential anisotropy of the progenitor galaxies in the remnant. While in such a scenario the central orbit distribution can stay almost isotropic even after the BHs have merged (Rantala et al., 2019), a fully evolved core-core merger scenario does not provide a direct explanation for the observed double nucleus.
In conclusion, the most plausible scenario is that while the galaxy merger, that forms NGC5419, is almost completed, the core formation process is at an earlier state. This approach is able to simultaneously explain all observed and measured features:
-
•
The central isotropic orbit distribution
-
•
The double nucleus visible in the HST image surrounded by a region of enhanced stellar velocity dispersion
-
•
The already evolved cored SB profile and
-
•
The galaxy’s KDC, which probably reflects orbital reversals of the progenitor SMBHs that only happen in major mergers with massive SMBHs.
Finally, we note that the observed wiggles in the galaxy’s ellipticity profile and their correlation with the flips in the rotation direction of the stars may further indicate that the galaxy is in an earlier phase of the core-formation process. Nevertheless, the evolutionary state of NGC 5419 appears to already be relaxed enough in order to gain robust dynamical equilibrium models. This is supported by the plausible mass results and anisotropy profiles, which are similar for both modeled data-sets (Eastern and Western side of the kinematics), as well as by the fact that all specific velocity features can be well fitted with an averaged deviation of only .
5.3 Mass recovery comparison to other studies
By modeling SINFONI data and optical long-slit SALT spectra assuming axisymmetry Mazzalay et al. (2016) determined a best-fit stellar mass-to-light ratio of and black hole mass of . Within the error bars, their determined mass parameters agree with our best-fit values determined when modeling the MUSE data alone as well as with our best-fit parameters when modeling the combined MUSE and SINFONI kinematics (cf. Section 4.3).
6 Conclusion
We present new triaxial dynamical models based on new spectroscopic MUSE data of the massive elliptical core galaxy NGC 5419 which hosts a double nucleus.
We focused on a precise recovery of the galaxy’s orbital structure. Our best-fit model shows a surprisingly isotropic central orbit distribution, which is in contrast to other core ETGs which typically show a tangentially biased central orbit distribution.
The observed double nucleus together with the isotropic central orbit distribution most likely suggest that NGC 5419 has undergone only the first phase of core formation so far: the dynamical friction associated with the sinking SMBHs in a gas-free merger causes a flattening of the central density profile. Such a depleted stellar density core is definitely in place in NGC 5419. However, the subsequent SMBH scouring process, which kicks out stars on radial orbits and slowly produces a tangentially biased orbit distribution has probably just begun. This supports the idea that the double nucleus at the center of the galaxy is in fact a SMBH binary (Mazzalay et al., 2016).
We find a best-fit stellar mass-to-light ratio of and best-fit black hole mass of for the MUSE data-set.
We find a slightly smaller best-fit BH mass when adding high-resolution AO-assisted SINFONI data.
The recovery of the anisotropy profile, however, is unaffected by this and in particular the central orbit distribution stays isotropic independent of which data is fitted.
NGC 5419 has a prominent yin-yang like KDC and is a particularly interesting case to study the formation of kinematic misalignements. When projecting our best-fit triaxial model along the galaxy’s principal axes, we find rotation flips in the tube orbits around kpc. These flips together with projection effects are sufficient to produce the observed complex rotation field. Recent ETG merger simulations have shown that during gas-free major mergers, SMBHs (in the mass range implied by our models for NGC 5419) and the bound stellar nuclei can experience one or more reversals of their orbits (Rantala et al., 2019). Similar to what can be found in our models of NGC 5419, the traces of these orbital reversals in the -body simulations appear as excess mass of counter-/corotating tube orbits inside/outside the effective flip radii. The fact that the spatial scale and velocity amplitude of NGC 5419’s KDC is qualitatively similar to what can be found in the -body simulation hints to a similar formation process of the KDC.
Acknowledgements
This research was supported by the Excellence Cluster ORIGINS which is funded by the Deutsche Forschungsgemeinschaft (DFG, German Research Foundation) under Germany’s Excellence Strategy - EXC-2094-390783311. We used the computing facilities of the Computational Center for Particle and Astrophysics (C2PAP). Computations were performed on the HPC systems Raven and Cobra at the Max Planck Computing and Data Facility.
References
- Balmaverde et al. (2006) Balmaverde, B., Capetti, A., & Grandi, P. 2006, A&A, 451, 35
- Barnes (2016) Barnes, J. E. 2016, MNRAS, 455, 1957
- Begelman et al. (1980) Begelman, M. C., Blandford, R. D., & Rees, M. J. 1980, Nature, 287, 307
- Bender (1988) Bender, R. 1988, A&A, 202, L5
- Bender (1996) Bender, R. 1996, in New Light on Galaxy Evolution, ed. R. Bender & R. L. Davies, Vol. 171, 181
- Bender et al. (1992) Bender, R., Burstein, D., & Faber, S. M. 1992, ApJ, 399, 462
- Binney & Tremaine (2008) Binney, J., & Tremaine, S. 2008, Galactic Dynamics, 2nd edn. (Princeton Univers. Press), 263
- Capetti et al. (2005) Capetti, A., Verdoes Kleijn, G., & Chiaberge, M. 2005, A&A, 439, 935
- Cappellari et al. (2002) Cappellari, M., Verolme, E. K., van der Marel, R. P., et al. 2002, ApJ, 578, 787
- Davies et al. (2001) Davies, R. L., Kuntschner, H., Emsellem, E., et al. 2001, ApJ, 548, L33
- de Nicola et al. (2022a) de Nicola, S., Neureiter, B., Thomas, J., Saglia, R. P., & Bender, R. 2022a, MNRAS, 517, 3445
- de Nicola et al. (2020) de Nicola, S., Saglia, R. P., Thomas, J., Dehnen, W., & Bender, R. 2020, MNRAS, 496, 3076
- de Nicola et al. (2022b) de Nicola, S., Saglia, R. P., Thomas, J., et al. 2022b, ApJ, 933, 215
- Dehnen (1993) Dehnen, W. 1993, MNRAS, 265, 250
- den Brok et al. (2021) den Brok, M., Krajnović, D., Emsellem, E., Brinchmann, J., & Maseda, M. 2021, MNRAS, 508, 4786
- Dullo & Graham (2014) Dullo, B. T., & Graham, A. W. 2014, MNRAS, 444, 2700
- Dullo et al. (2018) Dullo, B. T., Knapen, J. H., Williams, D. R. A., et al. 2018, MNRAS, 475, 4670
- Ebisuzaki et al. (1991) Ebisuzaki, T., Makino, J., & Okumura, S. K. 1991, Nature, 354, 212
- Efstathiou et al. (1982) Efstathiou, G., Ellis, R. S., & Carter, D. 1982, MNRAS, 201, 975
- Emsellem et al. (2004) Emsellem, E., Cappellari, M., Peletier, R. F., et al. 2004, MNRAS, 352, 721
- Ene et al. (2018) Ene, I., Ma, C.-P., Veale, M., et al. 2018, MNRAS, 479, 2810
- Faber et al. (1997) Faber, S. M., Tremaine, S., Ajhar, E. A., et al. 1997, AJ, 114, 1771
- Franx & Illingworth (1988) Franx, M., & Illingworth, G. D. 1988, ApJ, 327, L55
- Frigo et al. (2021) Frigo, M., Naab, T., Rantala, A., et al. 2021, MNRAS, 508, 4610
- Gebhardt et al. (2003) Gebhardt, K., Richstone, D., Tremaine, S., et al. 2003, ApJ, 583, 92
- Gerhard (1993) Gerhard, O. E. 1993, MNRAS, 265, 213
- Goss et al. (1987) Goss, W. M., McAdam, W. B., Wellington, K. J., & Ekers, R. D. 1987, MNRAS, 226, 979
- Hau et al. (1999) Hau, G. K. T., Carter, D., & Balcells, M. 1999, MNRAS, 306, 437
- Hau & Forbes (2006) Hau, G. K. T., & Forbes, D. A. 2006, MNRAS, 371, 633
- Hills & Fullerton (1980) Hills, J. G., & Fullerton, L. W. 1980, AJ, 85, 1281
- Jedrzejewski (1987) Jedrzejewski, R. I. 1987, MNRAS, 226, 747
- Kormendy & Bender (1996) Kormendy, J., & Bender, R. 1996, ApJ, 464, L119
- Kormendy & Bender (2009) —. 2009, ApJ, 691, L142
- Kormendy & Ho (2013) Kormendy, J., & Ho, L. C. 2013, ARA&A, 51, 511
- Krajnović et al. (2006) Krajnović, D., Cappellari, M., de Zeeuw, P. T., & Copin, Y. 2006, MNRAS, 366, 787
- Krajnović et al. (2011) Krajnović, D., Emsellem, E., Cappellari, M., et al. 2011, MNRAS, 414, 2923
- Krajnović et al. (2015) Krajnović, D., Weilbacher, P. M., Urrutia, T., et al. 2015, MNRAS, 452, 2
- Kuntschner et al. (2010) Kuntschner, H., Emsellem, E., Bacon, R., et al. 2010, MNRAS, 408, 97
- Lauer et al. (2005) Lauer, T. R., Faber, S. M., Gebhardt, K., et al. 2005, AJ, 129, 2138
- Lauer et al. (2007) Lauer, T. R., Gebhardt, K., Faber, S. M., et al. 2007, ApJ, 664, 226
- Lena et al. (2014) Lena, D., Robinson, A., Marconi, A., et al. 2014, ApJ, 795, 146
- Lipka & Thomas (2021) Lipka, M., & Thomas, J. 2021, MNRAS, 504, 4599
- Mazzalay et al. (2016) Mazzalay, X., Thomas, J., Saglia, R. P., et al. 2016, MNRAS, 462, 2847
- McConnell et al. (2012) McConnell, N. J., Ma, C.-P., Murphy, J. D., et al. 2012, ApJ, 756, 179
- McDermid et al. (2006) McDermid, R. M., Emsellem, E., Shapiro, K. L., et al. 2006, MNRAS, 373, 906
- Mehrgan et al. (2019) Mehrgan, K., Thomas, J., Saglia, R., et al. 2019, ApJ, 887, 195
- Mehrgan et al. (2023) Mehrgan, K., Thomas, J., Saglia, R., Parikh, T., & Bender, R. 2023, arXiv e-prints, arXiv:2303.01495
- Merritt (2006) Merritt, D. 2006, ApJ, 648, 976
- Milosavljević & Merritt (2001) Milosavljević, M., & Merritt, D. 2001, ApJ, 563, 34
- Moster et al. (2018) Moster, B. P., Naab, T., & White, S. D. M. 2018, MNRAS, 477, 1822
- Nasim et al. (2021) Nasim, I. T., Gualandris, A., Read, J. I., et al. 2021, MNRAS, 502, 4794
- Navarro et al. (1996) Navarro, J. F., Frenk, C. S., & White, S. D. M. 1996, ApJ, 462, 563
- Nedelchev et al. (2019) Nedelchev, B., Coccato, L., Corsini, E. M., et al. 2019, A&A, 623, A87
- Neureiter et al. (2023) Neureiter, B., de Nicola, S., Thomas, J., et al. 2023, MNRAS, 519, 2004
- Neureiter et al. (2021) Neureiter, B., Thomas, J., Saglia, R., et al. 2021, MNRAS, 500, 1437
- Nieto et al. (1991a) Nieto, J. L., Bender, R., Arnaud, J., & Surma, P. 1991a, A&A, 244, L25
- Nieto et al. (1991b) Nieto, J.-L., Bender, R., & Surma, P. 1991b, A&A, 244, L37
- Rantala et al. (2018) Rantala, A., Johansson, P. H., Naab, T., Thomas, J., & Frigo, M. 2018, ApJ, 864, 113
- Rantala et al. (2019) —. 2019, ApJ, 872, L17
- Rantala et al. (2017) Rantala, A., Pihajoki, P., Johansson, P. H., et al. 2017, ApJ, 840, 53
- Rusli et al. (2013) Rusli, S. P., Erwin, P., Saglia, R. P., et al. 2013, AJ, 146, 160
- Schwarzschild (1979) Schwarzschild, M. 1979, ApJ, 232, 236
- Subrahmanyan et al. (2003) Subrahmanyan, R., Beasley, A. J., Goss, W. M., Golap, K., & Hunstead, R. W. 2003, AJ, 125, 1095
- Thomas & Lipka (2022) Thomas, J., & Lipka, M. 2022, MNRAS, 514, 6203
- Thomas et al. (2014) Thomas, J., Saglia, R. P., Bender, R., Erwin, P., & Fabricius, M. 2014, ApJ, 782, 39
- van den Bosch & Ogiya (2018) van den Bosch, F. C., & Ogiya, G. 2018, MNRAS, 475, 4066
- van den Bosch et al. (2008) van den Bosch, R. C. E., van de Ven, G., Verolme, E. K., Cappellari, M., & de Zeeuw, P. T. 2008, MNRAS, 385, 647
- van der Marel & Franx (1993) van der Marel, R. P., & Franx, M. 1993, ApJ, 407, 525