On the generation of ultra-bright and low energy spread electron beams in laser wakefield acceleration in a uniform plasma
Abstract
The quality of electron beams produced from plasma-based accelerators, i.e., normalized brightness and energy spread, has made transformative progress in the past several decades in both simulation and experiment. Recently, full-scale particle-in-cell (PIC) simulations have shown that electron beams with unprecedented brightness () and energy spread can be produced through controlled injection in a slowly expanding bubble that arises when a particle beam or laser pulse propagates in density gradient, or when a particle beam self-focuses in uniform plasma or has a superluminal flying focus. However, in previous simulations of work on self-injection triggered by an evolving laser driver in a uniform plasma, the resulting beams did not exhibit comparable brightnesses and energy spreads. Here, we demonstrate through the use of large-scale high-fidelity PIC simulations that a slowly expanding bubble driven by a laser pulse in a uniform plasma can indeed produce self-injected electron beams with similar brightnesses and energy spreads as for an evolving bubble driven by an electron beam driver. We consider laser spot sizes roughly equal to the matched spot sizes in a uniform plasma and find that the evolution of the bubble occurs naturally through the evolution of the laser. The effects of the electron beam quality on the choice of physical as well as numerical parameters, e.g. grid sizes and field solvers used in the PIC simulations are presented. It is found that this original and simplest injection scheme can produce electron beams with beam quality exceeding that of the more recent concepts.
pacs:
I I. Introduction
Critical metrics for accessing the capability of a particle accelerator are related to the quality of the beams they can deliver. Several macro or ensemble averaged quantities of importance to quantify the beams include the energy , energy spread , current , normalized emittance , duration and repetition rate . As a promising novel acceleration method, plasma-based acceleration (PBA) driven by an intense laser pulse or particle beam can sustain ultrahigh acceleration gradients () within the acceleration medium - a fully ionized plasma Tajima and Dawson (1979); Chen et al. (1985); Esarey et al. (2009); Joshi et al. (2020). Generation of high-quality electron beams from PBA is critical for its development as such beams could transform applications, such as X-ray free-electron lasers (XFELs) Pellegrini et al. (2016); Kim et al. (2017) and TeV-class colliders Benedetti et al. (2022). Both of these applications have stringent requirements for the beam quality. Although high acceleration gradients were demonstrated experimentally in the early stages of PBA research Clayton et al. (1993); Everett et al. (1994); Modena et al. (1995), the generated electron beams were characterized by large divergences and emittances, and Maxwellian energy distributions, i.e., energy spread Modena et al. (1995); Umstadter et al. (1996a); Wagner et al. (1997); Malka et al. (2002). In 2004, three groups Mangles et al. (2004); Geddes et al. (2004); Faure et al. (2004) produced monoenergetic 100 MeV beams with a few percent energy spread and several mrad divergence by shooting a ultrashort () laser pulse with joule energy into a plasma with density. However, the beam qualities had large shot-to-shot fluctuations due to the variation of the laser and plasma parameters when operating at the relatively high plasma densities.
In order to improve the stability and reproducibility of the beams produced from PBA, a number of controllable injection schemes have been proposed during the last two decades. These schemes utilize a variety of physical mechanisms, such as additional lasers Umstadter et al. (1996b); Esarey et al. (1997a); Hemker et al. (1998); Fubiani et al. (2004); Kotaki et al. (2004); Faure et al. (2006); Davoine et al. (2009); Lehe et al. (2013); Chen et al. (2022), an external magnetic field Vieira et al. (2011), a plasma density gradient Bulanov et al. (1998); Suk et al. (2001); Geddes et al. (2008); Gonsalves et al. (2011); Buck et al. (2013); Li et al. (2013a), or the vast difference in the ionization potentials of electrons between different shells of atoms Moore et al. (1999); Chen et al. (2006); Oz et al. (2007); Rowlands-Rees et al. (2008); Pak et al. (2010); McGuffey et al. (2010); Clayton et al. (2010); Liu et al. (2011); Pollock et al. (2011); Maier et al. (2020).
To date, the representative mechanisms which have produced the best experimental and simulation results are ionization injection and density downramp injection in the nonlinear blowout regime. In ionization injection, electrons with high ionization potentials are released inside the wake and these electrons are more easily trapped (injected) than background electrons. In density downramp injection, a negative plasma density gradient is used to reduce the phase velocity of the wake by gradually increasing the wavelength of the wake and trigger injection of energetic plasma sheath electrons. The phase space dynamics of the injected electrons in these two schemes have been thoroughly investigated Xu et al. (2014a, 2017) and many variations have been proposed to further improve the generated beam quality Xu et al. (2017); Hidding et al. (2012); Li et al. (2013b); Bourgeois et al. (2013); Martinez de la Ossa et al. (2013); Yu et al. (2014a); Xu et al. (2014b); Zeng et al. (2015); Xu et al. (2016a); Tooley et al. (2017); Deng et al. (2019); Dalichaouch et al. (2020); Xu et al. (2022a); Li et al. (2022); Xu et al. (2022b); Wang et al. (2022).
Recent full-scale high-fidelity particle-in-cell (PIC) simulations have shown that downramp injection and other schemes that gradually increase the wavelength in the nonlinear blowout regime Xu et al. (2017); Dalichaouch et al. (2020); Li et al. (2022) can produce beams with unprecedented brightness ( and ) and low slice energy spreads of . The large energy chirp formed during the injection process can be compensated by the chirp of the acceleration gradient of the nonlinear wake Lu et al. (2006); Tzoufras et al. (2008) during the subsequent acceleration process Kalmykov et al. (2009, 2011); Zhang et al. (2016); Xu et al. (2017); Manahan et al. (2017); Kirchen et al. (2021). As a result, the beams can achieve or even smaller relative projected energy spreads after they are boosted to GeV-class or higher energies Manahan et al. (2017); Pousa et al. (2019); Dalichaouch et al. (2020); Ke et al. (2021).
Beside these controllable injection schemes, self-injection induced by the evolution of an intense laser driver Pukhov and Meyer-ter Vehn (2002); Tsung et al. (2004); Xu et al. (2005); Lu et al. (2007); Kalmykov et al. (2009); Kostyukov et al. (2009); Kalmykov et al. (2011); Martins et al. (2010) in a uniform plasma with density around has been commonly used in experiments to generate GeV-class electrons due to its simplicity Leemans et al. (2006); Kneip et al. (2009); Froula et al. (2009); Hafz et al. (2008); Wang et al. (2013); Kim et al. (2013); Leemans et al. (2014); Gonsalves et al. (2019); Miao et al. (2022); Aniculaesei et al. (2022). Notably, this self-injection mechanism was used to generate beams with energies above the GeV barrier Leemans et al. (2006) and, more recently, up to 8 GeV Gonsalves et al. (2019). However, these beams were characterized by relatively poor quality, i.e., large energy spreads () and large emittance (), in both PIC simulations and experiments Tsung et al. (2004); Leemans et al. (2006); Kneip et al. (2009); Froula et al. (2009); Hafz et al. (2008); Kalmykov et al. (2009); Kostyukov et al. (2009); Martins et al. (2010); Kalmykov et al. (2011); Wang et al. (2013); Kim et al. (2013); Leemans et al. (2014); Gonsalves et al. (2019); Corde et al. (2013); Davidson et al. (2018).
In this paper, we demonstrate using large-scale high-fidelity PIC simulations and theoretical analysis that the dynamics of self-injection induced by the evolution of a short pulse laser are fundamentally the same as those observed in downramp injection. Thus, the self-injected electrons can achieve similar beam quality as from downramp injection, i.e., brightness, sub-MeV slice energy spread, and relative projected energy spread after the beam is boosted to GeV-class energies. In Sec. II, we compare simulation results for both a uniform plasma and a plasma with a density downramp to show the similarity between these two regimes. A GeV-class beam with and relative projected energy spread is produced in the example. In Sec. III, we explore the potential of self-injection in a uniform plasma. We find that for diffraction-limited laser beams and perfectly uniform plasmas this simple scheme can generate beams with ultrahigh brightness () and ultrahigh current () by operating at plasma densities. Possible physical factors which prevent the generation of such high-quality beams in experiments are briefly discussed in Sec. IV and a summary of our findings is given in Sec. V. The effects of numerical resolution and the choice of the electromagnetic field solver on the injected beams’ quality are studied in the Appendix A.
II II. Common dynamics of self injection in uniform plasma and density downramps
We model the self-injection of plasma electrons in a laser wakefield accelerator using the quasi-three-dimensional (Q3D) version Davidson et al. (2015) of the PIC code OSIRIS Fonseca et al. (2002) with recently developed high-fidelity Maxwell solvers Li et al. (2017); Xu et al. (2020). A plasma column with density and isotropic electron temperature is initialized at the beginning of the simulation. An 800 nm, 4.3 J laser pulse with a peak power and a full-width half maximum (FWHM) pulse duration is incident on the fully ionized plasma, where is the plasma frequency, and are the electron mass and charge, and is the vacuum permittivity. The laser has a diffraction-limited Gaussian transverse profile and is focused at the start of the plasma () with a spot size (the field profile at focus is ), where is the plasma wavenumber and is the speed of light in vacuum. The normalized vector potential of the laser is at its focus, where is the laser frequency, is the peak vector potential, and is its peak electric field. The spot size used in the simulations is slightly larger than the matched spot size () suggested by the nonlinear plasma wave wake theory Lu et al. (2006, 2007), where is the radius of the blowout wake. The laser is linearly polarized along the -direction. The grid sizes are chosen as to resolve the subtle physics involved in the injection process and the acceleration of the strongly focused injected electrons. Details of the simulation parameters can be found in Appendix B.
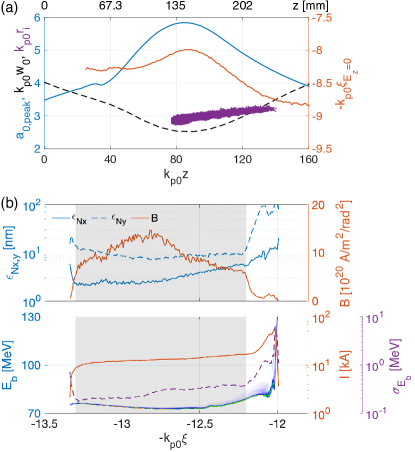
As shown in Fig 1, we consider the self-injection for two cases: a linear plasma density downramp with normalized density gradient and a uniform plasma with , where is the density drop across the ramp and is the ramp length. When an intense laser pulse propagates inside a plasma (from left to right), the electrons are pushed outwards and forward from the pulse center. The ions then pull these electrons back causing them to form a narrow sheath that surrounds an ion column [Fig. 1(a)]. In general, when the laser’s peak power exceeds the self-focusing critical power Esarey et al. (1997b), the plasma’s refractive index is self-consistently modified to focus and guide the laser Mori (1997). In the simulations conducted here, the peak power of the laser (155 ) is much higher than the critical power for self-focusing in the plasma for the density in the plateau. Thus, the laser is self-focused and its peak field (projected spot size) increases (decreases) as shown in Fig 1(c). Despite the differences in the plasma density profiles, the evolution of the lasers are similar in these two cases.
The wavelength of a laser-driven 3D nonlinear plasma wake depends on the spot size and the peak intensity of the laser driver in a complicated way, particularly when the beam is not well matched. In general, the wavelength tends to increase with both spot size and laser intensity. However, for the parameters studied here, the projected spot size decreases while the intensity increases through self-focusing in the ion channel. In this case, the increase in the intensity dominates, leading to a slow expansion of the wake size (wavelength). Previous simulations have also shown the wake expands as the laser diffracts for an initially tightly focused beam Xu et al. (2005). Since it is difficult to locate the precise end of the wake which is occupied by the self-injected electrons, we measure the axial position in the first wave bucket where to quantify the expansion of the wake [red lines in Fig 1(c)]. Note the position where is roughly the center of the wake and the rear of the wake expands with approximately twice this velocity. In the uniform plasma case, the self-focusing of the laser driver causes an expansion of the wake with a velocity, , of between and . The wake expands with a faster velocity of in the case with a density downramp which indicates the downramp speeds up the wake expansion.
In a nonlinear wake, plasma electrons originating from form the high-density sheath surrounding the ion channel Xu et al. (2017) and gain large forward velocities when they move to the back of the wake, where is the initial radial position of the electron and is a value between and 1 which depends on the driver. If their forward velocities are faster than the phase velocity of the end of the wake, these sheath electrons would remain just inside at the end of the wake where they would then be accelerated continuously. The trajectory of a sample injected electron is superimposed on the wake shape as shown in Fig. 1(a).
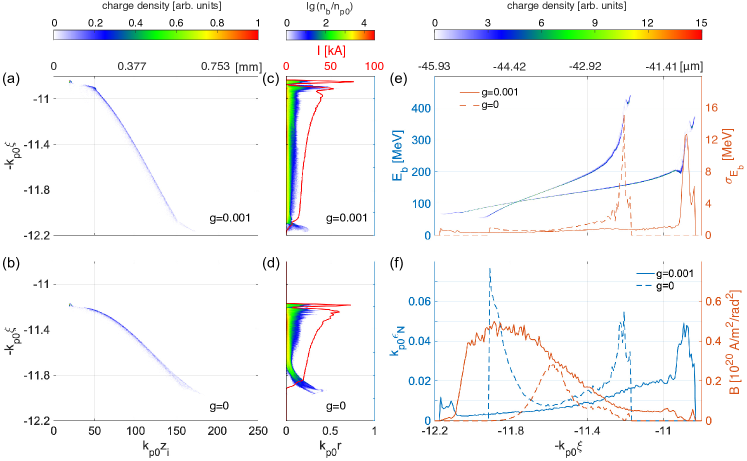
Since the electrons are always injected at the rear of the continuously expanding wake, there is a mapping between the initial positions () of the electrons and their axial positions inside the wake after injection () Kalmykov et al. (2009); Kostyukov et al. (2009); Kalmykov et al. (2011); Xu et al. (2017) which can be seen in Figs. 2(a) and (b). The duration of the beam is roughly equal to the difference of the wake wavelength at the start and the end of the injection. The injected beam from a plasma downramp has a longer duration since the wake is smaller at the start of the injection where the plasma density is . The compression factor thus scales as Xu et al. (2017); Tooley et al. (2017), where . Thus, there is a significant compression of the beams’ duration during the injection, i.e., for these simulations the electrons initially distributed with a length of and are compressed and form a beam with a duration of . This enables the generation of beam currents of 10s of kA. As shown in Figs. 1(c) and (d), the current of the core of the beams are . Here the core of the beams is defined as part with brightness , which is for the case and for the case. The charge of the beam core is 180 for and 76 for . We note that in addition to the continuous injection during the expansion of the wake, there is an isolated injection near the end of the upramp () Li et al. (2013a). This injection forms an attosecond peak with current at the head of the beams in both cases Li et al. (2013a).
Based on analyzing numerous PIC simulations of downramp injection and its variants by the authors and others Grebenyuk et al. (2014); Xu et al. (2017); Dalichaouch et al. (2020); Li et al. (2022), we have inferred that the current of the core of the beam scales as for a beam-driven nonlinear wake and for a laser-driven case (with a nearly matched spot size), where , is the peak current of the beam driver and is the non-relativistic Alfven current. While we currently do not have simple arguments for obtaining these scaling laws, they may arise due to a fine balance between the initial injection and a subsequent quenching via self-beam loading, i.e., the injected electrons can modify the shape of the wake which reduces the forward velocity of the sheath electrons and hinders injection Dalichaouch et al. (2021). This observed scaling suggests that beams with hundreds of kA current and nanocoulombs of charge can be injected into a wake driven by an intense laser driver with .
The mapping between the initial positions of the electrons and their axial positions after injection leads to two consequences of the beams’ energy distribution. The first is a low slice energy spread since the electrons in one axial slice originate from similar longitudinal locations and experience the same acceleration gradient after injection. Fig. 2(e) shows that the beams have a slice energy spread of except for near their heads. The second is a roughly linear energy chirp along the beam since the electrons at the beam head are injected earlier and accelerated over a longer distance. As shown in Fig. 2(e), the chirps at are for and for .
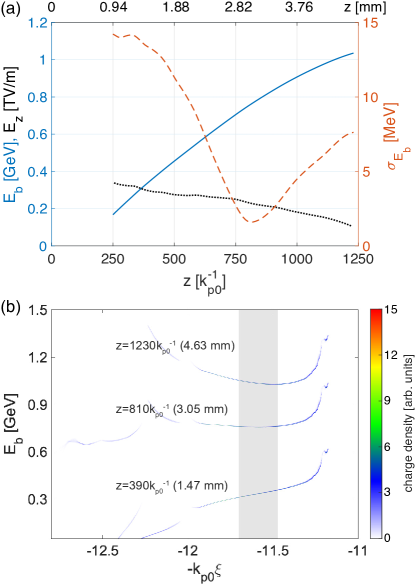
These positive chirps can be compensated by the chirp of the acceleration gradient during the subsequent acceleration. The beam loaded wake has a lower gradient at the head and higher gradient at the rear. Thus there is an optimized acceleration distance where the beam can achieve a projected energy spread on the order of MeV Xu et al. (2017); Ke et al. (2021). Due to the constant evolution of the laser driver, the acceleration gradient and its chirp change and we rely on simulations to find this optimized distance. We present the evolution of the average energy, the projected energy spread of the beam core () for and the acceleration gradient in Fig. 3(a). The optimized acceleration distance occurs at where the core of the beam achieves a projected energy spread (red dashed line) as low as 1.6 MeV while its average energy (blue solid line) is 0.76 GeV. The energy of the beam can still be boosted since there is energy left in the laser pulse. We continue the simulation to where the core of the beam has 1.04 GeV energy and the laser pulse contains of its initial energy. The average acceleration gradient drops from at to at . A simulation with lower resolution () shows the beam energy reaches its maximum 1.40 GeV at and then starts to lose energy. The longitudinal phase space of the injected beam at three acceleration distances are shown in Fig. 3(b) where the evolution of the energy chirp can be seen. Secondary and tertiary phases of injection occur around and which are characterized by low current, large emittance and large slice energy spreads. The aforementioned analysis and simulation results show that the injection mechanism and the longitudinal mapping are similar in a downramp and a uniform plasma.
As shown in Ref. Xu et al. (2017), sheath electrons experience a transverse defocusing force from the nonlinear wake at the very rear of the channel prior to injection Dalichaouch et al. (2021). This transverse defocusing force reduces the transverse momentum of these electrons as they approach the axis leading to a beam with ultra-low emittance. The same dynamics occur for electrons injected from an elongating wake in a uniform plasma. The emittance of the beams along the laser polarization direction () are shown in Fig. 2(f) where the middle of the beams can achieve an emittance as low as while the head and the tail are characterized by a larger emittance of . The relatively large emittance at the beam tail is due to the lack of symmetry of the injected electrons at the end of the injection process, i.e., the initial angular distribution of the injected electrons is asymmetric as shown in the Appendix C. The emittance along the other transverse direction has a similar profile. The peak brightness of the beams is for and for .
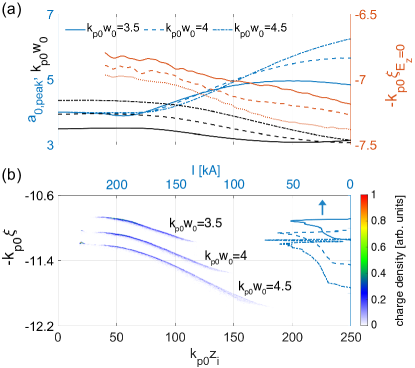
In principle, the injection of ultrahigh quality electrons in uniform plasmas can be controlled by the initial parameters of the laser pulse driver (the intensity, the spot size, the vacuum focal plane and the pulse duration) and the plasma density. However, it is challenging to derive an analytical expression to describe with good accuracy how the injection depends on these parameters. In instead we rely on simulations to show how the injection varies when different laser spot sizes are used. In Fig. 4, we see that the plasma wake expands and injection occurs for three cases near the matched spot size, =3.5, 4 (matched) and 4.5, for fixed intensity () and thus different laser powers. When a laser pulse with a smaller spot size is used, the injection distance shrinks. The isolated injection that occurs at the end of the upramp around for and 4.5 is absent when . Note that the aforementioned injection of ultrahigh quality beams also occurs for laser pulse drivers with spot sizes far away from the matched spot size. We choose nearly matched laser spot sizes in this paper for the subsequent acceleration since a nearly matched laser pulse can be guided over many Rayleigh lengths of distance in plasma Lu et al. (2007).
The motion of plasma ions Rosenzweig et al. (2005); An et al. (2017) which becomes important when the parameter exceeds unity would modify the distribution of the acceleration and focusing fields inside the wake and degrade the beam quality. Here is the ion plasma frequency for the beam density, is the ion mass, and are the peak density and the duration of the injected beam. For the case, this value is even for the lightest hydrogen ions, so the ion motion is weak. Simulations performed with mobile hydrogen ions confirm that ion motion has little effect on the injected beam quality.
We emphasize that fine grid sizes and advanced field solvers are necessary to model the ultrahigh quality electron beams generation in the highly nonlinear plasma wakes. Due to their ultra-low emittance and the ultra-strong focusing fields inside the ion channel, the injected beams are tightly focused down to spot sizes of with peak densities as high as . Thus a fine grid size is needed to resolve them. When these high-density relativistic electrons propagate on the numerical grids, they can excite unphysical numerical fields since the grids can be viewed as a medium with a complicated dielectric tensor. Two important kinds of the unphysical effects are numerical Cherenkov radiation Godfrey (1974); Godfrey and Vay (2013); Xu et al. (2013) and numerical space-charge fields Xu et al. (2020). These unphysical fields can modify the beams’ evolution and degrade their qualities. Maxwell field solvers based on spectral solvers Yu et al. (2014b, 2015a, 2015b, 2016); Godfrey and Vay (2015) or with finite difference solvers with extended stencils Xu et al. (2020); Li et al. (2021) have recently been developed to suppress some or combinations of these numerical fields. In the aforementioned simulations, a combination of fine grid sizes () and the recently developed Xu solver Xu et al. (2020) are used to model the injected electrons with high-fidelity. For comparison, results with the Yee solver and/or coarse resolutions are presented in the Appendix A.
III III. Generation of ultrahigh brightness and ultrahigh current beams with hundreds of MeV
The properties of self-injected beams are determined by the plasma density and the evolution of the laser driver in the plasma in terms of both the and propagation distance variables. Thus, there is a large parameter space to explore and electron beams with different properties can be injected. In the previous section, a GeV-class high-quality beam with brightness is produced by focusing a 4.3 J laser pulse into a plasma with . We show two more representative cases in this section: one is the generation of MeV beams with and the other is generation of beams with current.
Each simulation corresponds to a family of physical instances where the normalized parameters remain fixed. Thus, the emittance of the injected beams in downramp injection and self-injection in a uniform plasma scales with the background plasma density as in beam driven plasma wakefield accelerators if the normalized dimensions of the beam drivers () and their normalized peak density () are assumed fixed Xu et al. (2017). This scaling for also holds for laser-driven wakes if laser parameters are also scaled, including the laser frequency. However, as high power lasers are presently available in a limited range of wavelengths, then as the density changes the frequency ratio () will not be scaled appropriately. At lower frequency ratios the laser evolves more rapidly and thus the scaling with with density will be approximate. This scaling thus indicates that ultra-bright beams can be produced using a high density plasma for lasers as well as particle beam drivers. To confirm this, results from a simulation with are shown in Fig. 5. An 800 nm laser pulse with duration and linear polarization in the direction is focused inside the plasma at [] with a focal spot size . The laser contains 0.35 J energy and its peak power is . Its normalized vector potential at the vacuum focal plane is . The spot size and the focal position Götzfried et al. (2020); Dickson et al. (2022) have a significant effect on the laser evolution and thus where the injection happens. These parameters are first scanned using simulations with low resolution to find optimal operating parameters.
As shown in Fig. 5(a), the laser is focused down even after its vacuum focal plane due to the self-focusing and starts to expand around . Injection starts at where the of the laser is focused to . The injection ceases at due to a combination of beam loading from the injected electrons and the decrease of the laser intensity. Compared with the case in Fig. 1, the wake expands with a faster velocity of which leads to a smaller energy chirp at the end of the injection [31.4 ]. This small chirp is compensated quickly by the slope of the acceleration gradient thus the energy at the optimized acceleration distance is much lower than for the case in Fig. 1.
Simulations show the core of the injected beam ( with ) achieves its minimum projected energy spread (1.6 MeV) at with an average energy 74.4 MeV. The slice energy spread is MeV and the current is 13 kA. The charge contained in the beam core is 81 pC. As shown in Fig. 5(b), the emittance of the beam core is 3 nm (), 9 nm () and its peak brightness reaches . The unequal emittance (and spot sizes) along the two transverse directions of the injected beam can be traced back to the fact that only electrons with initial azimuthal angles around are injected and the details are presented in Appendix C. The dephasing between the injected electrons and the laser driver sets a limit on the maximum energy gain of the injected beam as MeV in a plasma with density Lu et al. (2007). Injection and acceleration in such a high-density plasma can serve as an injector with 100 MeV-class ultra-bright electron beams.
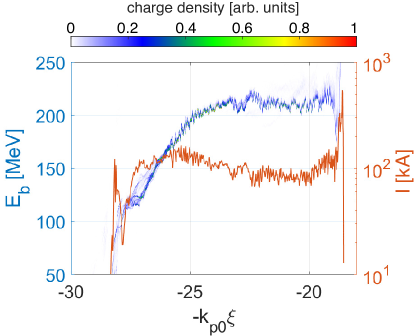
Based on the empirical relation between the current of the injected beams and the of the laser pulse drivers, beams with hundreds of kA are expected to be produced when using laser pulses with . We present simulation results in Fig. 6 for a case where a PW laser pulse and plasma density are used. An 800 nm, linearly polarized () laser pulse with duration is focused outside of the plasma [] with a focused spot size . The laser contains 33.4 J energy and its peak power is . Its normalized vector potential at its focal plane is .
Self-injection starts at and ends at . A beam with duration and 100 kA current is formed at . The total injected charge is which can be further improved if a plasma downramp is introduced to elongate the injection distance. Beams with 10s of MA current may be obtained by controlling the acceleration distance to form an energy chirp along this beam and compress it in a small chicane Emma et al. (2021). A high-fidelity simulation of the generation of this high current beam requires a resolution finer than . However, a resolution with is used in Fig. 6 due to the significant computational cost to model the large plasma wave wake, and this leads to a highly suspect emittance () and artificial ripples in the longitudinal phase space of the beam (see Fig. 6). Based on our experience for other cases where we are able to carry fully resolved simulations, we believe that these effects are numerical and not physical.
IV IV. Discussion on physical effects which would degrade the beam quality
The aforementioned results have demonstrated the ability to inject ultrahigh quality electron beams in the simplest configuration of laser wakefield accelerators. However, the beam quality reported in experiments (either based on a density downramp or the evolution of the laser pulse driver) are significantly worse than the predictions of PIC simulations. In this section we discuss the possible reasons behind this large gap.
The transverse deceleration process which results in injection of low-emittance beams depends on having a well defined sheath and the axial symmetry of the nonlinear wake. Thus, any factors that affect the sheath properties and the symmetry of the wake degrade the emittance and brightness of the injected beams. For instance: non diffraction-limited lasers, a finite temperature of the plasma electrons Xu et al. (2017); Zhang et al. (2019), an asymmetric driver (intensity and/or phase distortions) Glinec et al. (2008); Mangles et al. (2009); Popp et al. (2010); Beaurepaire et al. (2015), a finite transverse bulk velocity of a gas produced from a gas jet, transversely non-uniform plasma density distribution at spatial scales smaller or larger than plasma skin depth Stupakov (2017); Ma et al. (2018). These imperfections not only affect the injection process but also degrade the beam quality during the subsequent acceleration by modifying the linear focusing field and the transversely uniform acceleration field in an axisymmetrical nonlinear wake. However, it is not straightforward to study these effects in the Q3D geometry since significant effort is needed to understand how many modes are necessary to model these asymmetry wakes with high-fidelity. Meanwhile, the computational costs of full 3D simulations are currently unaffordable even using GPU based hardware. Therefore, we will focus on the effects of the plasma temperature in this section.
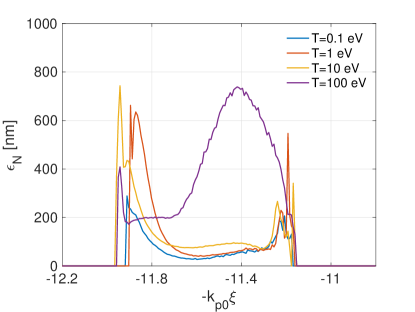
In practical experiments, the plasma is created in many ways, e.g., high-voltage discharge or optical ionization by a low energy laser pulse. Depending on the ionization process, the plasma electrons can will be distributed with different temperatures which may affect the quality of the injected electron beams. In the self-injection results shown in Sec. II, we assumed an initial plasma electron temperature of . In Fig. 7, we compare the emittance of the self-injected beams from plasmas with higher temperatures (, and ). While the emittance within the beam cores are similar for and , it grows by a factor of 2 for . The emittance increases dramatically and approaches when the plasma electron temperature is . This indicates that eV-level plasma temperatures are necessary for generation of high-quality beams with nanometer-scale emittances.
Even when these ultra-bright beams are produced in the plasma, the subsequent transport may also degrade the emittance due to the mismatch of the beams’ transverse phase space Mehrling et al. (2012); Antici et al. (2012); Migliorati et al. (2013); Floettmann (2014); Dornmair et al. (2015); Xu et al. (2016b); Zhao et al. (2020); Ariniello et al. (2019), especially when other macro parameters of the beams (e.g., energy, pointing angles and transverse positions) fluctuate from shot-to-shot Labat et al. (2018). Thus, carefully designed transport stages are additionally necessary for utilization of high-quality self-injected beams from PBA.
V V. Conclusions
We have shown that the dynamics of the self-injection in uniform plasmas is the same as that of density downramp injection Xu et al. (2017) and its variants Dalichaouch et al. (2020); Li et al. (2022), thus beams with and MeV slice energy spreads can be produced. Fine grid sizes and advanced field solvers are necessary to model this ultrahigh quality beams generation in PIC codes.
Due to its low emittance, the GeV beam described in Sec. II is focused tightly to a spot size as small as and reaches a peak density as high as . The generated beams with higher brightness or current in Sec. III may be focused to an even higher beam density if their energy is boosted to GeV-levels. These extremely dense beams can enable many novel applications, such as driving all-optical XFELs Xu et al. (2023), generating ultrabright -rays through a beam-plasma instability Benedetti et al. (2018) or beam-multifoil collisions Sampath et al. (2021), driving plasma wakefield accelerators with TeV/m acceleration gradient in a solid density plasma Sahai et al. (2020) and studying strong-field QED with beam-beam collisions Yakimenko et al. (2019) or beam-plasma collisions Matheron et al. (2022).
Using high-fidelity large-scale numerical simulations, we have shown that beams with extreme parameters can be produced when a laser pulse propagates and evolves in a uniform plasma. This approach can dramatically simplify the complexity of plasma-based accelerators. Our findings may also stimulate future research to study why current experiments can not deliver these ultrahigh quality beams and on what is needed to finally produce these beams in experiments to enable many novel plasma acceleration driven applications.
VI acknowledgments
This work was supported by the Fundamental Research Funds for the Central Universities, Peking University, the National Natural Science Foundation of China (NSFC) (No. 11921006) and the National Grand Instrument Project (No. 2019YFF01014400), the U.S. Department of Energy under Contracts No. DE-SC0010064, the U.S. National Science Foundation under Grants No. 2108970, and the DOE Scientific Discovery through Advanced Computing (SciDAC) program through a Fermi National Accelerator Laboratory (FNAL) subcontract No. 644405. The simulations were performed on the resources of the National Energy Research Scientific Computing Center (NERSC), a U.S. Department of Energy Office of Science User Facility located at Lawrence Berkeley National Laboratory.
Appendix A Appendix A: Comparison of the injected beams from simulations with different resolutions and solvers
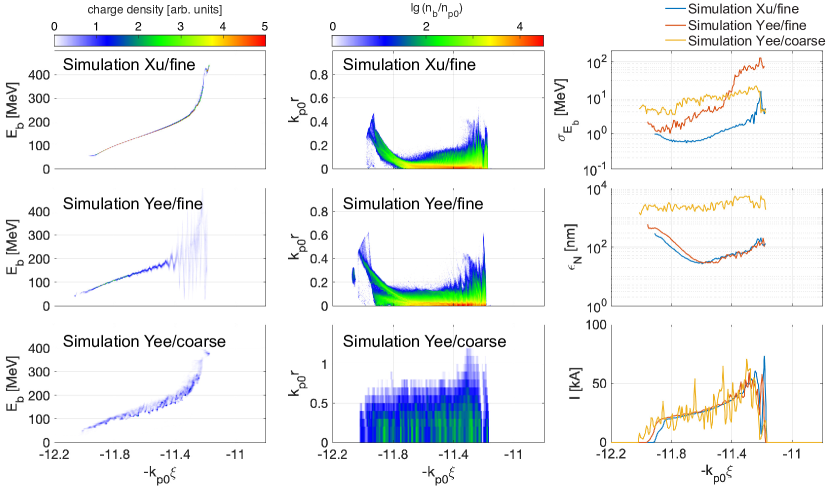
In Sec. II, we showed that the beam injected in a uniform plasma shares the same dynamics as in a plasma downramp and is characterized by ultrahigh brightness and low slice energy spread. However, the beam quality from simulations is closely related to the simulation setup, such as the grid sizes and the Maxwell field solver. In Sec. II, a combination of fine grid sizes () and the recently developed Xu solver Xu et al. (2020) are used to model the injected electrons with high-fidelity, which will be referred as ‘Simulation Xu/fine’ in the following discussions. In Fig. 8, we show that the qualities of the injected beams in simulations with coarse resolutions or the Yee solver are much worse than the results from Simulation Xu/fine.
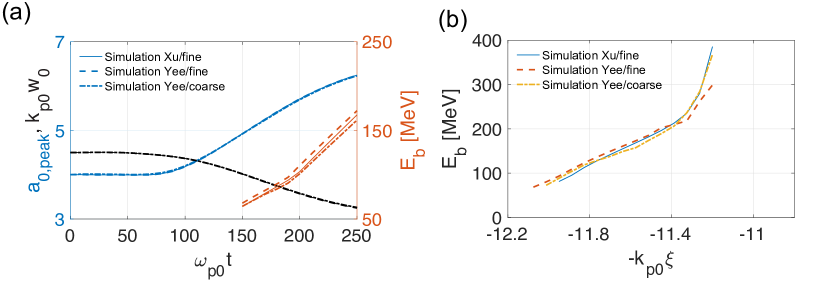
Simulation Yee/fine uses the same setup of Simulation Xu/fine except the Yee field solver Yee (1966) is used instead of the Xu solver. Simulation Yee/coarse uses a much coarser grid resolution () and the Yee solver with 128 macro-particles per cell to improve the statistics. The time step of is close the Courant limit. The longitudinal phase space and the real space distribution of the injected beams in these three simulations are compared in Fig. 8. In Simulation Yee/fine, the beam is focused to a similar real space distribution as in Simulation Xu/fine. However, these high-density electrons excite unphysical high-frequency electromagnetic fields with large amplitude Xu et al. (2020) when the Yee solver is used. These unphysical fields then modulate the longitudinal phase space of the beam and lead a much larger slice energy spread (several ). The beam in Simulation Yee/coarse has a large emittance () and thus a large spot size. Since the electrons are not tightly focused, their density is much lower than in Simulation Xu/fine and Yee/fine and they excite numerical fields with lower amplitude than in Simulation Yee/fine. Thus the energy modulation is not as severe as in Simulation Yee/fine and the slice energy spread is several . The total charge of the injected beams in all three simulation is very similar but the current profiles in Simulations Yee/fine and Yee/coarse are modulated as a result of the slippage between the electrons with unphysical energy modulation.
As shown in Fig. 8, the simulation resolution and field solver can significantly impact the quality of the injected beams due to the subtle self-interactions between the high density particles. However, we want to stress that quantities that depend on physics on larger spatial scales are not sensitive to the choices of the grid sizes and the solver, such as the evolution of the laser driver and the average energy of the injected beam as shown in Fig. 9(a). We also compare the slice mean energy of the injected beams in these simulations in Fig. 9(b). When the duration of the slice is chosen as which is longer than the wavelength () of the unphysical energy modulation, the slice mean energy has similar profiles in the three simulations. This indicates simulations with low resolutions and the Yee solver can be used to predict the coarse energy space of the injected beam, and they may be recommended in some situations due to the much lower computational cost. Machine learning algorithms may be combined with these low cost simulations to predict these properties for injected electrons.
Appendix B Appendix B: Simulation setup
For the simulations shown in Sec. II, we use a moving window propagating at speed of light in vacuum with a box size of and cells along the and directions, respectively. The grid sizes are chosen as to resolve the tightly focused injected electrons while the time step is to satisfy the CFL condition. To represent the plasma electrons, we use 8 macro-particles per cell (ppc) where they are distributed at one location and 8 different values of the azimuthal angle . All physical quantities in Q3D code Lifschitz et al. (2009); Davidson et al. (2015) are decomposed into azimuthal modes , where is the azimuthal angle. Two modes with and are included in the simulations shown here to describe the linearly polarized laser pulses. The Xu solver Xu et al. (2020) is used to eliminate the numerical Cherenkov radiation Godfrey (1974); Godfrey and Vay (2013); Xu et al. (2013) and the numerical space charge field Xu et al. (2020) from the high-density relativistic injected electrons and model the injection and acceleration with high-fidelity. The laser’s electric field has a symmetric temporal profile of , where while the radius of the plasma column is .
The simulation in Fig. 5 uses a moving window with a box size of whose grid sizes are . The time step is and 8 macro-particles per cell (distributed at 8 different values of at one location) are used to represent the plasma electrons. The simulation in Fig. 6 uses a larger moving window with a box size of to model the larger plasma wave wake excited by the more intense laser pulse. Limited by computational cost, a resolution with and a time step is used. We still use two modes with and 1 in the simulations and the Xu solver. We use 8 macro-particles per cell (distributed at 8 different values of at one location) for the plasma electrons. The plasma electrons in both simulations have an initial temperature. Note in Sec. II and in Sec. III.
Appendix C Appendix C: Initial azimuthal distribution of the injected electrons
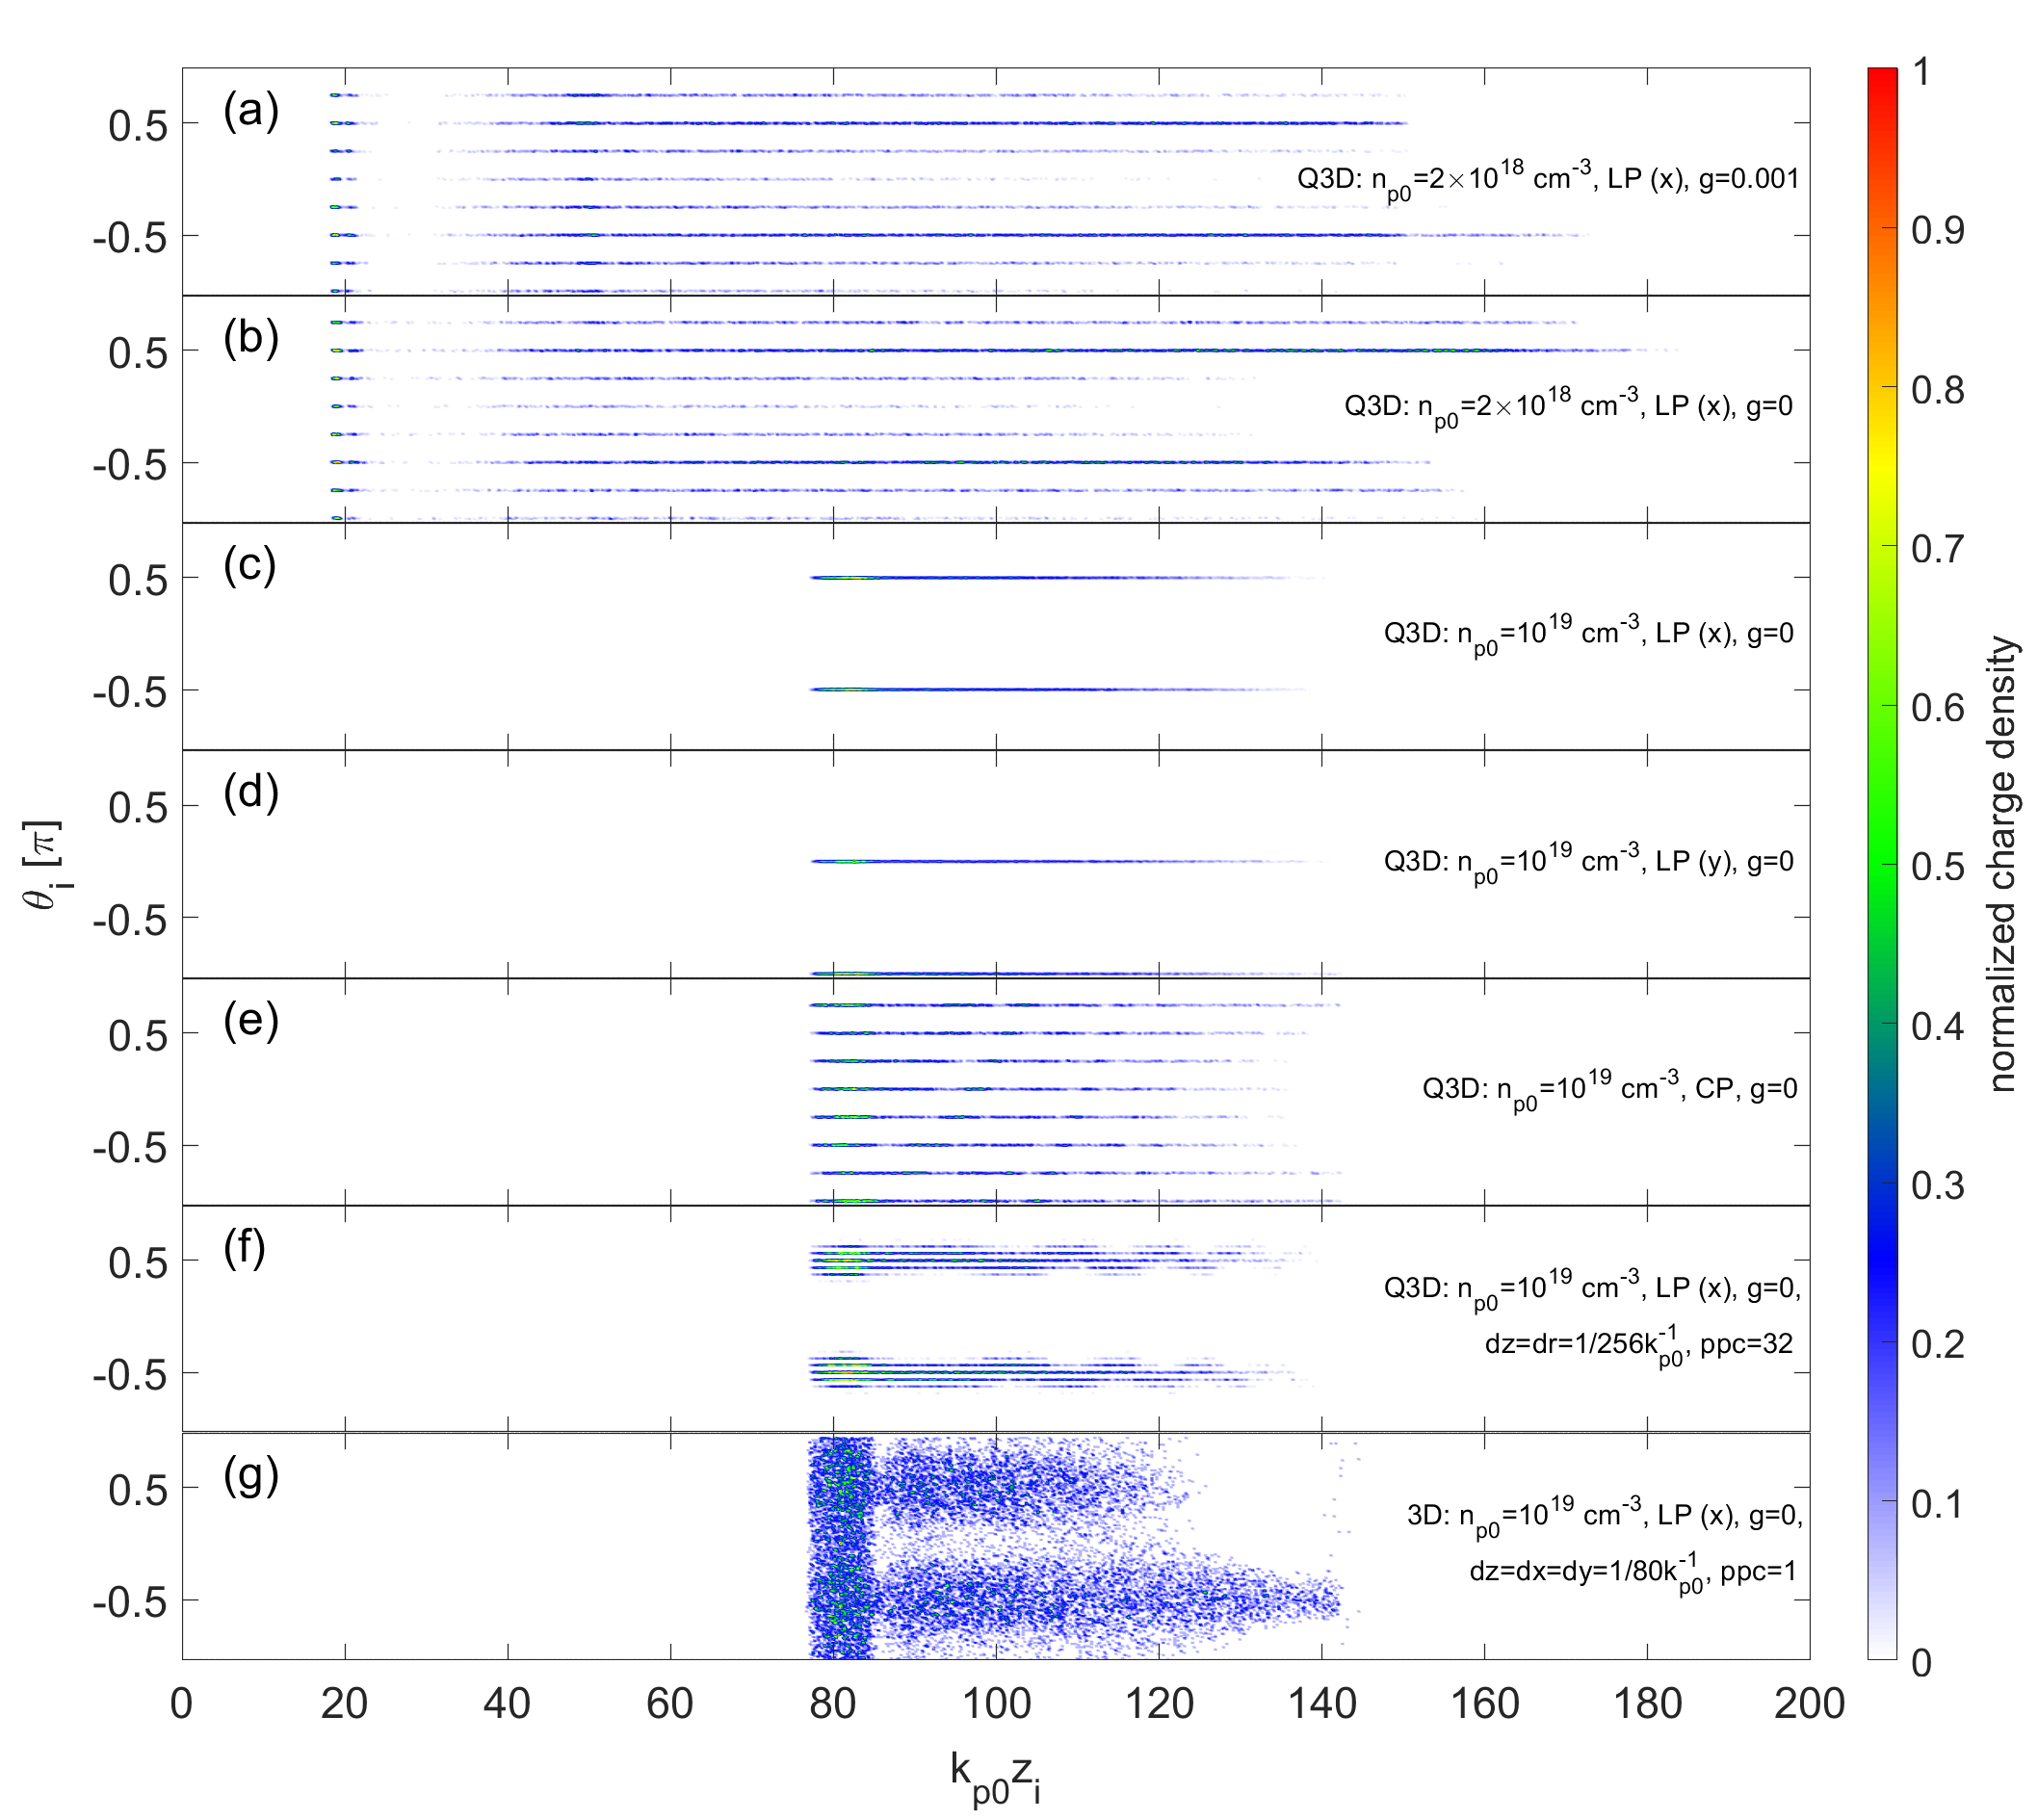
When the plasma density is much lower than the critical density of the laser driver and the laser pulse consists of many cycles, the ponderomotive approximation is valid and the plasma wake is nearly axisymmetric. As a result, the initial positions of the injected electrons are distributed uniformly along the azimuthal direction. As the plasma density increases, a shorter laser pulse driver is needed to excite the wake effectively, thus the oscillatory laser electric field starts to play a role and the injection becomes non-uniform azimuthally which leads to a transversely asymmetric beam, i.e., the beam has different spot sizes and emittance along the two transverse directions.
The initial azimuthal angle of the injected electrons for different cases are shown in Fig. 10. When , there are electrons injected from all angles for both the and cases. Although their distribution with the initial angle is not uniform, i.e., more electrons originate from [Fig. 10(a)-(b)], the distribution is approximately symmetric between and . At the end of the injection (), the angular distribution becomes asymmetric which leads to off-axis beam tails as shown in Fig. 2. The reason behind this asymmetric angular distribution has not been understood thoroughly. Note that 8 macro-particles are initialized azimuthally with angles in these Q3D simulations.
When and a laser pulse driver with fewer cycles is used, only electrons originating from two angles, , are injected as shown 10(c). Since the angular distribution is still symmetric about the and axes, the injected beam is characterized by a low emittance. The values of the injected angles depends on the polarization direction of the laser driver as shown in Fig. 10(c)-(d). When a circularly polarized laser is used, the augular distribution becomes much more uniform. This concentration on initial angles when a linearly polarized laser pulse is used is confirmed in a Q3D simulation with lower resolution () but more macro-particles per cell (f) and a full-3D simulation (g) with lower resolution ().
References
- Tajima and Dawson (1979) T. Tajima and J. M. Dawson, Phys. Rev. Lett. 43, 267 (1979).
- Chen et al. (1985) P. Chen, J. Dawson, R. W. Huff, and T. Katsouleas, Physical review letters 54, 693 (1985).
- Esarey et al. (2009) E. Esarey, C. Schroeder, and W. Leemans, Reviews of modern physics 81, 1229 (2009).
- Joshi et al. (2020) C. Joshi, S. Corde, and W. Mori, Physics of Plasmas 27, 070602 (2020).
- Pellegrini et al. (2016) C. Pellegrini, A. Marinelli, and S. Reiche, Reviews of Modern Physics 88, 015006 (2016).
- Kim et al. (2017) K.-J. Kim, Z. Huang, and R. Lindberg, Synchrotron radiation and free-electron lasers (Cambridge university press, 2017).
- Benedetti et al. (2022) C. Benedetti, S. Bulanov, E. Esarey, C. Geddes, A. Gonsalves, A. Huebl, R. Lehe, K. Nakamura, C. Schroeder, D. Terzani, et al., arXiv preprint arXiv:2203.08366 (2022).
- Clayton et al. (1993) C. Clayton, K. Marsh, A. Dyson, M. Everett, A. Lal, W. Leemans, R. Williams, and C. Joshi, Physical review letters 70, 37 (1993).
- Everett et al. (1994) M. Everett, A. Lal, D. Gordon, C. Clayton, K. Marsh, and C. Joshi, Nature 368, 527 (1994).
- Modena et al. (1995) A. Modena, Z. Najmudin, A. Dangor, C. Clayton, K. Marsh, C. Joshi, V. Malka, C. Darrow, C. Danson, D. Neely, et al., nature 377, 606 (1995).
- Umstadter et al. (1996a) D. Umstadter, S.-Y. Chen, A. Maksimchuk, G. Mourou, and R. Wagner, Science 273, 472 (1996a).
- Wagner et al. (1997) R. Wagner, S.-Y. Chen, A. Maksimchuk, and D. Umstadter, Physical Review Letters 78, 3125 (1997).
- Malka et al. (2002) V. Malka, S. Fritzler, E. Lefebvre, M.-M. Aleonard, F. Burgy, J.-P. Chambaret, J.-F. Chemin, K. Krushelnick, G. Malka, S. Mangles, et al., Science 298, 1596 (2002).
- Mangles et al. (2004) S. P. Mangles, C. Murphy, Z. Najmudin, A. G. R. Thomas, J. Collier, A. E. Dangor, E. Divall, P. Foster, J. Gallacher, C. Hooker, et al., Nature 431, 535 (2004).
- Geddes et al. (2004) C. Geddes, C. Toth, J. Van Tilborg, E. Esarey, C. Schroeder, D. Bruhwiler, C. Nieter, J. Cary, and W. Leemans, Nature 431, 538 (2004).
- Faure et al. (2004) J. Faure, Y. Glinec, A. Pukhov, S. Kiselev, S. Gordienko, E. Lefebvre, J.-P. Rousseau, F. Burgy, and V. Malka, Nature 431, 541 (2004).
- Umstadter et al. (1996b) D. Umstadter, J. Kim, and E. Dodd, Physical review letters 76, 2073 (1996b).
- Esarey et al. (1997a) E. Esarey, R. Hubbard, W. Leemans, A. Ting, and P. Sprangle, Physical Review Letters 79, 2682 (1997a).
- Hemker et al. (1998) R. Hemker, K.-C. Tzeng, W. Mori, C. Clayton, and T. Katsouleas, Physical Review E 57, 5920 (1998).
- Fubiani et al. (2004) G. Fubiani, E. Esarey, C. Schroeder, and W. Leemans, Physical Review E 70, 016402 (2004).
- Kotaki et al. (2004) H. Kotaki, S. Masuda, M. Kando, J. Koga, and K. Nakajima, Physics of Plasmas 11, 3296 (2004).
- Faure et al. (2006) J. Faure, C. Rechatin, A. Norlin, A. Lifschitz, Y. Glinec, and V. Malka, Nature 444, 737 (2006).
- Davoine et al. (2009) X. Davoine et al., Phys. Rev. Lett. 102, 065001 (2009).
- Lehe et al. (2013) R. Lehe, A. Lifschitz, X. Davoine, C. Thaury, and V. Malka, Physical review letters 111, 085005 (2013).
- Chen et al. (2022) Q. Chen, D. Maslarova, J. Wang, S. X. Lee, V. Horný, and D. Umstadter, Phys. Rev. Lett. 128, 164801 (2022), URL https://link.aps.org/doi/10.1103/PhysRevLett.128.164801.
- Vieira et al. (2011) J. Vieira, S. Martins, V. Pathak, R. Fonseca, W. Mori, and L. Silva, Physical review letters 106, 225001 (2011).
- Bulanov et al. (1998) S. Bulanov, N. Naumova, F. Pegoraro, and J. Sakai, Phys. Rev. E 58, R5257 (1998).
- Suk et al. (2001) H. Suk, N. Barov, J. B. Rosenzweig, and E. Esarey, Phys. Rev. Lett. 86, 1011 (2001).
- Geddes et al. (2008) C. G. R. Geddes et al., Phys. Rev. Lett. 100, 215004 (2008).
- Gonsalves et al. (2011) A. Gonsalves, K. Nakamura, C. Lin, D. Panasenko, S. Shiraishi, T. Sokollik, C. Benedetti, C. Schroeder, C. Geddes, J. Van Tilborg, et al., Nature Physics 7, 862 (2011).
- Buck et al. (2013) A. Buck, J. Wenz, J. Xu, K. Khrennikov, K. Schmid, M. Heigoldt, J. M. Mikhailova, M. Geissler, B. Shen, F. Krausz, et al., Phys. Rev. Lett. 110, 185006 (2013).
- Li et al. (2013a) F. Li, Z. Sheng, Y. Liu, J. Meyer-ter Vehn, W. Mori, W. Lu, and J. Zhang, Physical review letters 110, 135002 (2013a).
- Moore et al. (1999) C. I. Moore et al., Phys. Rev. Lett. 82, 1688 (1999).
- Chen et al. (2006) M. Chen, Z.-M. Sheng, Y.-Y. Ma, and J. Zhang, Journal of applied physics 99, 056109 (2006).
- Oz et al. (2007) E. Oz, S. Deng, T. Katsouleas, P. Muggli, C. D. Barnes, I. Blumenfeld, F. J. Decker, P. Emma, M. J. Hogan, R. Ischebeck, et al., Phys. Rev. Lett. 98, 084801 (2007).
- Rowlands-Rees et al. (2008) T. Rowlands-Rees, C. Kamperidis, S. Kneip, A. Gonsalves, S. Mangles, J. Gallacher, E. Brunetti, T. Ibbotson, C. Murphy, P. Foster, et al., Physical Review Letters 100, 105005 (2008).
- Pak et al. (2010) A. Pak, K. A. Marsh, S. F. Martins, W. Lu, W. B. Mori, and C. Joshi, Phys. Rev. Lett. 104, 025003 (2010).
- McGuffey et al. (2010) C. McGuffey, A. G. R. Thomas, W. Schumaker, T. Matsuoka, V. Chvykov, F. J. Dollar, G. Kalintchenko, V. Yanovsky, A. Maksimchuk, K. Krushelnick, et al., Phys. Rev. Lett. 104, 025004 (2010).
- Clayton et al. (2010) C. E. Clayton, J. E. Ralph, F. Albert, R. A. Fonseca, S. H. Glenzer, C. Joshi, W. Lu, K. A. Marsh, S. F. Martins, W. B. Mori, et al., Phys. Rev. Lett. 105, 105003 (2010).
- Liu et al. (2011) J. S. Liu, C. Q. Xia, W. T. Wang, H. Y. Lu, C. Wang, A. H. Deng, W. T. Li, H. Zhang, X. Y. Liang, Y. X. Leng, et al., Phys. Rev. Lett. 107, 035001 (2011).
- Pollock et al. (2011) B. B. Pollock, C. E. Clayton, J. E. Ralph, F. Albert, A. Davidson, L. Divol, C. Filip, S. H. Glenzer, K. Herpoldt, W. Lu, et al., Phys. Rev. Lett. 107, 045001 (2011).
- Maier et al. (2020) A. R. Maier, N. M. Delbos, T. Eichner, L. Hübner, S. Jalas, L. Jeppe, S. W. Jolly, M. Kirchen, V. Leroux, P. Messner, et al., Physical Review X 10, 031039 (2020).
- Xu et al. (2014a) X. L. Xu, J. F. Hua, F. Li, C. J. Zhang, L. X. Yan, Y. C. Du, W. H. Huang, H. B. Chen, C. X. Tang, W. Lu, et al., Phys. Rev. Lett. 112, 035003 (2014a).
- Xu et al. (2017) X. Xu, F. Li, W. An, T. Dalichaouch, P. Yu, W. Lu, C. Joshi, and W. Mori, Physical Review Accelerators and Beams 20, 111303 (2017).
- Hidding et al. (2012) B. Hidding, G. Pretzler, J. B. Rosenzweig, T. Königstein, D. Schiller, and D. L. Bruhwiler, Phys. Rev. Lett. 108, 035001 (2012).
- Li et al. (2013b) F. Li, J. F. Hua, X. L. Xu, C. J. Zhang, L. X. Yan, Y. C. Du, W. H. Huang, H. B. Chen, C. X. Tang, W. Lu, et al., Phys. Rev. Lett. 111, 015003 (2013b).
- Bourgeois et al. (2013) N. Bourgeois, J. Cowley, and S. M. Hooker, Phys. Rev. Lett. 111, 155004 (2013).
- Martinez de la Ossa et al. (2013) A. Martinez de la Ossa, J. Grebenyuk, T. Mehrling, L. Schaper, and J. Osterhoff, Phys. Rev. Lett. 111, 245003 (2013).
- Yu et al. (2014a) L.-L. Yu, E. Esarey, C. B. Schroeder, J.-L. Vay, C. Benedetti, C. G. R. Geddes, M. Chen, and W. P. Leemans, Phys. Rev. Lett. 112, 125001 (2014a).
- Xu et al. (2014b) X. L. Xu, Y. P. Wu, C. J. Zhang, F. Li, Y. Wan, J. F. Hua, C.-H. Pai, W. Lu, P. Yu, C. Joshi, et al., Phys. Rev. ST Accel. Beams 17, 061301 (2014b).
- Zeng et al. (2015) M. Zeng, M. Chen, L.-L. Yu, W. B. Mori, Z.-M. Sheng, B. Hidding, D. Jaroszynski, and J. Zhang, Physical review letters 114, 084801 (2015).
- Xu et al. (2016a) X. Xu, C.-H. Pai, C. Zhang, F. Li, Y. Wan, Y. Wu, J. Hua, W. Lu, W. An, P. Yu, et al., Physical review letters 117, 034801 (2016a).
- Tooley et al. (2017) M. Tooley, B. Ersfeld, S. Yoffe, A. Noble, E. Brunetti, Z. Sheng, M. Islam, and D. Jaroszynski, Physical review letters 119, 044801 (2017).
- Deng et al. (2019) A. Deng, O. Karger, T. Heinemann, A. Knetsch, P. Scherkl, G. G. Manahan, A. Beaton, D. Ullmann, G. Wittig, A. F. Habib, et al., Nature Physics 15, 1156 (2019).
- Dalichaouch et al. (2020) T. N. Dalichaouch, X. L. Xu, F. Li, A. Tableman, F. S. Tsung, W. An, and W. B. Mori, Phys. Rev. Accel. Beams 23, 021304 (2020).
- Xu et al. (2022a) X. Xu, J. Vieira, M. J. Hogan, C. Joshi, and W. B. Mori, Phys. Rev. Accel. Beams 25, 011302 (2022a), URL https://link.aps.org/doi/10.1103/PhysRevAccelBeams.25.011302.
- Li et al. (2022) F. Li, T. N. Dalichaouch, J. R. Pierce, X. Xu, F. S. Tsung, W. Lu, C. Joshi, and W. B. Mori, Phys. Rev. Lett. 128, 174803 (2022), URL https://link.aps.org/doi/10.1103/PhysRevLett.128.174803.
- Xu et al. (2022b) X. Xu, F. Li, F. S. Tsung, K. Miller, V. Yakimenko, M. J. Hogan, C. Joshi, and W. B. Mori, Nature communications 13, 1 (2022b).
- Wang et al. (2022) J. Wang, M. Zeng, D. Li, X. Wang, W. Lu, and J. Gao, Matter and Radiation at Extremes 7, 054001 (2022).
- Lu et al. (2006) W. Lu, C. Huang, M. Zhou, W. B. Mori, and T. Katsouleas, Phys. Rev. Lett. 96, 165002 (2006).
- Tzoufras et al. (2008) M. Tzoufras et al., Phys. Rev. Lett. 101, 145002 (2008).
- Kalmykov et al. (2009) S. Kalmykov, S. Yi, V. Khudik, and G. Shvets, Physical review letters 103, 135004 (2009).
- Kalmykov et al. (2011) S. Y. Kalmykov, A. Beck, S. Yi, V. Khudik, M. C. Downer, E. Lefebvre, B. A. Shadwick, and D. Umstadter, Physics of Plasmas 18, 056704 (2011).
- Zhang et al. (2016) Z. Zhang, W. Li, J. Liu, W. Wang, C. Yu, Y. Tian, K. Nakajima, A. Deng, R. Qi, C. Wang, et al., Physics of Plasmas 23, 053106 (2016).
- Manahan et al. (2017) G. G. Manahan, A. Habib, P. Scherkl, P. Delinikolas, A. Beaton, A. Knetsch, O. Karger, G. Wittig, T. Heinemann, Z. Sheng, et al., Nature communications 8, 1 (2017).
- Kirchen et al. (2021) M. Kirchen, S. Jalas, P. Messner, P. Winkler, T. Eichner, L. Hübner, T. Hülsenbusch, L. Jeppe, T. Parikh, M. Schnepp, et al., Physical review letters 126, 174801 (2021).
- Pousa et al. (2019) A. F. Pousa, A. M. De La Ossa, R. Brinkmann, and R. Assmann, Physical review letters 123, 054801 (2019).
- Ke et al. (2021) L. Ke, K. Feng, W. Wang, Z. Qin, C. Yu, Y. Wu, Y. Chen, R. Qi, Z. Zhang, Y. Xu, et al., Physical Review Letters 126, 214801 (2021).
- Pukhov and Meyer-ter Vehn (2002) A. Pukhov and J. Meyer-ter Vehn, Applied Physics B 74, 355 (2002).
- Tsung et al. (2004) F. S. Tsung, R. Narang, W. B. Mori, C. Joshi, R. Fonseca, and L. O. Silva, Physical review letters 93, 185002 (2004).
- Xu et al. (2005) H. Xu, W. Yu, P. Lu, V. Senecha, F. He, B. Shen, L. Qian, R. Li, and Z. Xu, Physics of plasmas 12, 013105 (2005).
- Lu et al. (2007) W. Lu et al., Phys. Rev. ST Accel. Beams 10, 061301 (2007).
- Kostyukov et al. (2009) I. Kostyukov, E. Nerush, A. Pukhov, and V. Seredov, Physical review letters 103, 175003 (2009).
- Martins et al. (2010) S. F. Martins, R. Fonseca, W. Lu, W. B. Mori, and L. Silva, Nature Physics 6, 311 (2010).
- Leemans et al. (2006) W. Leemans et al., Nature Phys. 2, 696 (2006).
- Kneip et al. (2009) S. Kneip et al., Phys. Rev. Lett. 103, 035002 (2009).
- Froula et al. (2009) D. H. Froula et al., Phys. Rev. Lett. 103, 215006 (2009).
- Hafz et al. (2008) N. A. Hafz, T. M. Jeong, I. W. Choi, S. K. Lee, K. H. Pae, V. V. Kulagin, J. H. Sung, T. J. Yu, K.-H. Hong, T. Hosokai, et al., Nature Photonics 2, 571 (2008).
- Wang et al. (2013) X. Wang et al., Nature communications 4, 1988 (2013).
- Kim et al. (2013) H. T. Kim et al., Phys. Rev. Lett. 111, 165002 (2013).
- Leemans et al. (2014) W. Leemans, A. Gonsalves, H.-S. Mao, K. Nakamura, C. Benedetti, C. Schroeder, C. Tóth, J. Daniels, D. Mittelberger, S. Bulanov, et al., Physical review letters 113, 245002 (2014).
- Gonsalves et al. (2019) A. J. Gonsalves, K. Nakamura, J. Daniels, C. Benedetti, C. Pieronek, T. C. H. de Raadt, S. Steinke, J. H. Bin, S. S. Bulanov, J. van Tilborg, et al., Phys. Rev. Lett. 122, 084801 (2019).
- Miao et al. (2022) B. Miao, J. Shrock, L. Feder, R. Hollinger, J. Morrison, R. Nedbailo, A. Picksley, H. Song, S. Wang, J. Rocca, et al., Physical Review X 12, 031038 (2022).
- Aniculaesei et al. (2022) C. Aniculaesei, T. Ha, S. Yoffe, E. McCary, M. M. Spinks, H. J. Quevedo, L. Labun, O. Z. Labun, R. Sain, A. Hannasch, et al., arXiv preprint arXiv:2207.11492 (2022).
- Corde et al. (2013) S. Corde, C. Thaury, A. Lifschitz, G. Lambert, K. T. Phuoc, X. Davoine, R. Lehe, D. Douillet, A. Rousse, and V. Malka, Nature communications 4, 1 (2013).
- Davidson et al. (2018) A. Davidson, A. Tableman, P. Yu, W. An, F. Tsung, W. Lu, R. Fonseca, and W. Mori, arXiv preprint arXiv:1805.08761 (2018).
- Davidson et al. (2015) A. Davidson, A. Tableman, W. An, F. S. Tsung, W. Lu, J. Vieira, R. A. Fonseca, L. O. Silva, and W. B. Mori, Journal of Computational Physics 281, 1063 (2015).
- Fonseca et al. (2002) R. Fonseca et al., Lecture notes in computer science 2331, 342 (2002).
- Li et al. (2017) F. Li, P. Yu, X. Xu, F. Fiuza, V. K. Decyk, T. Dalichaouch, A. Davidson, A. Tableman, W. An, F. S. Tsung, et al., Computer Physics Communications 214, 6 (2017).
- Xu et al. (2020) X. Xu, F. Li, F. S. Tsung, T. N. Dalichaouch, W. An, H. Wen, V. K. Decyk, R. A. Fonseca, M. J. Hogan, and W. B. Mori, Journal of Computational Physics p. 109451 (2020).
- Esarey et al. (1997b) E. Esarey, P. Sprangle, J. Krall, and A. Ting, IEEE journal of quantum electronics 33, 1879 (1997b).
- Mori (1997) W. Mori, IEEE Journal of Quantum Electronics 33, 1942 (1997).
- Grebenyuk et al. (2014) J. Grebenyuk, A. M. de la Ossa, T. Mehrling, and J. Osterhoff, Nuclear Instruments and Methods in Physics Research Section A: Accelerators, Spectrometers, Detectors and Associated Equipment 740, 246 (2014).
- Dalichaouch et al. (2021) T. N. Dalichaouch, X. L. Xu, A. Tableman, F. Li, F. S. Tsung, and W. B. Mori, Physics of Plasmas 28, 063103 (2021), eprint https://doi.org/10.1063/5.0051282, URL https://doi.org/10.1063/5.0051282.
- Rosenzweig et al. (2005) J. Rosenzweig, A. Cook, A. Scott, M. Thompson, and R. Yoder, Physical review letters 95, 195002 (2005).
- An et al. (2017) W. An, W. Lu, C. Huang, X. Xu, M. J. Hogan, C. Joshi, and W. B. Mori, Physical Review Letters 118, 244801 (2017).
- Godfrey (1974) B. B. Godfrey, Journal of Computational Physics 15, 504 (1974).
- Godfrey and Vay (2013) B. B. Godfrey and J.-L. Vay, Journal of Computational Physics 248, 33 (2013).
- Xu et al. (2013) X. Xu, P. Yu, S. F. Martins, F. S. Tsung, V. K. Decyk, J. Vieira, R. A. Fonseca, W. Lu, L. O. Silva, and W. B. Mori, Computer Physics Communications 184, 2503 (2013).
- Yu et al. (2014b) P. Yu, X. Xu, V. K. Decyk, W. An, J. Vieira, F. S. Tsung, R. A. Fonseca, W. Lu, L. O. Silva, and W. B. Mori, Journal of Computational Physics 266, 124 (2014b).
- Yu et al. (2015a) P. Yu, X. Xu, V. K. Decyk, F. Fiuza, J. Vieira, F. S. Tsung, R. A. Fonseca, W. Lu, L. O. Silva, and W. B. Mori, Computer Physics Communications 192, 32 (2015a).
- Yu et al. (2015b) P. Yu, X. Xu, A. Tableman, V. K. Decyk, F. S. Tsung, F. Fiuza, A. Davidson, J. Vieira, R. A. Fonseca, W. Lu, et al., Computer Physics Communications 197, 144 (2015b).
- Yu et al. (2016) P. Yu, X. Xu, A. Davidson, A. Tableman, T. Dalichaouch, F. Li, M. D. Meyers, W. An, F. S. Tsung, V. K. Decyk, et al., Journal of Computational Physics 316, 747 (2016).
- Godfrey and Vay (2015) B. B. Godfrey and J.-L. Vay, Computer Physics Communications 196, 221 (2015).
- Li et al. (2021) F. Li, K. G. Miller, X. Xu, F. S. Tsung, V. K. Decyk, W. An, R. A. Fonseca, and W. B. Mori, Computer Physics Communications 258, 107580 (2021).
- Götzfried et al. (2020) J. Götzfried, A. Döpp, M. F. Gilljohann, F. M. Foerster, H. Ding, S. Schindler, G. Schilling, A. Buck, L. Veisz, and S. Karsch, Phys. Rev. X 10, 041015 (2020), URL https://link.aps.org/doi/10.1103/PhysRevX.10.041015.
- Dickson et al. (2022) L. T. Dickson, C. I. D. Underwood, F. Filippi, R. J. Shalloo, J. B. Svensson, D. Guénot, K. Svendsen, I. Moulanier, S. D. Dufrénoy, C. D. Murphy, et al., Phys. Rev. Accel. Beams 25, 101301 (2022), URL https://link.aps.org/doi/10.1103/PhysRevAccelBeams.25.101301.
- Emma et al. (2021) C. Emma, X. Xu, A. Fisher, R. Robles, J. MacArthur, J. Cryan, M. Hogan, P. Musumeci, G. White, and A. Marinelli, APL Photonics 6, 076107 (2021).
- Zhang et al. (2019) C. Zhang, C.-K. Huang, K. A. Marsh, X. L. Xu, F. Li, M. Hogan, V. Yakimenko, S. Corde, W. B. Mori, and C. Joshi, Phys. Rev. Accel. Beams 22, 111301 (2019).
- Glinec et al. (2008) Y. Glinec, J. Faure, A. Lifschitz, J. M. Vieira, R. A. Fonseca, L. O. Silva, and V. Malka, Europhysics Letters 81, 64001 (2008), URL https://dx.doi.org/10.1209/0295-5075/81/64001.
- Mangles et al. (2009) S. P. D. Mangles, G. Genoud, S. Kneip, M. Burza, K. Cassou, B. Cros, N. P. Dover, C. Kamperidis, Z. Najmudin, A. Persson, et al., Applied Physics Letters 95, 181106 (2009), eprint https://doi.org/10.1063/1.3258022, URL https://doi.org/10.1063/1.3258022.
- Popp et al. (2010) A. Popp, J. Vieira, J. Osterhoff, Z. Major, R. Hörlein, M. Fuchs, R. Weingartner, T. P. Rowlands-Rees, M. Marti, R. A. Fonseca, et al., Phys. Rev. Lett. 105, 215001 (2010), URL https://link.aps.org/doi/10.1103/PhysRevLett.105.215001.
- Beaurepaire et al. (2015) B. Beaurepaire, A. Vernier, M. Bocoum, F. Böhle, A. Jullien, J.-P. Rousseau, T. Lefrou, D. Douillet, G. Iaquaniello, R. Lopez-Martens, et al., Phys. Rev. X 5, 031012 (2015), URL https://link.aps.org/doi/10.1103/PhysRevX.5.031012.
- Stupakov (2017) G. Stupakov, Physics of Plasmas 24, 113110 (2017), eprint https://doi.org/10.1063/1.4990048, URL https://doi.org/10.1063/1.4990048.
- Ma et al. (2018) Y. Ma, D. Seipt, S. J. D. Dann, M. J. V. Streeter, C. A. J. Palmer, L. Willingale, and A. G. R. Thomas, Physics of Plasmas 25, 113105 (2018), eprint https://doi.org/10.1063/1.5054807, URL https://doi.org/10.1063/1.5054807.
- Mehrling et al. (2012) T. Mehrling et al., Phys. Rev. ST Accel. Beams 15, 111303 (2012).
- Antici et al. (2012) P. Antici, A. Bacci, C. Benedetti, E. Chiadroni, M. Ferrario, A. R. Rossi, L. Lancia, M. Migliorati, A. Mostacci, L. Palumbo, et al., Journal of Applied Physics 112, 044902 (2012), URL http://scitation.aip.org/content/aip/journal/jap/112/4/10.1063/1.4740456.
- Migliorati et al. (2013) M. Migliorati et al., Phys. Rev. ST Accel. Beams 16, 011302 (2013).
- Floettmann (2014) K. Floettmann, Phys. Rev. ST Accel. Beams 17, 054402 (2014), URL https://link.aps.org/doi/10.1103/PhysRevSTAB.17.054402.
- Dornmair et al. (2015) I. Dornmair, K. Floettmann, and A. R. Maier, Phys. Rev. ST Accel. Beams 18, 041302 (2015), URL https://link.aps.org/doi/10.1103/PhysRevSTAB.18.041302.
- Xu et al. (2016b) X. L. Xu, J. F. Hua, Y. P. Wu, C. J. Zhang, F. Li, Y. Wan, C.-H. Pai, W. Lu, W. An, P. Yu, et al., Phys. Rev. Lett. 116, 124801 (2016b).
- Zhao et al. (2020) Y. Zhao, W. An, X. Xu, F. Li, L. Hildebrand, M. J. Hogan, V. Yakimenko, C. Joshi, and W. B. Mori, Phys. Rev. Accel. Beams 23, 011302 (2020), URL https://link.aps.org/doi/10.1103/PhysRevAccelBeams.23.011302.
- Ariniello et al. (2019) R. Ariniello, C. E. Doss, K. Hunt-Stone, J. R. Cary, and M. D. Litos, Phys. Rev. Accel. Beams 22, 041304 (2019), URL https://link.aps.org/doi/10.1103/PhysRevAccelBeams.22.041304.
- Labat et al. (2018) M. Labat, A. Loulergue, T. Andre, I. Andriyash, A. Ghaith, M. Khojoyan, F. Marteau, M. Valléau, F. Briquez, C. Benabderrahmane, et al., Physical Review Accelerators and Beams 21, 114802 (2018).
- Xu et al. (2023) X. Xu, J. Liu, T. Dalichaouch, F. S. Tsung, Z. Zhang, Z. Huang, M. J. Hogan, X. Yan, C. Joshi, and W. B. Mori, arXiv preprint arXiv:2302.08864 (2023).
- Benedetti et al. (2018) A. Benedetti, M. Tamburini, and C. H. Keitel, Nature Photonics 12, 319 (2018).
- Sampath et al. (2021) A. Sampath, X. Davoine, S. Corde, L. Gremillet, M. Gilljohann, M. Sangal, C. H. Keitel, R. Ariniello, J. Cary, H. Ekerfelt, et al., Phys. Rev. Lett. 126, 064801 (2021), URL https://link.aps.org/doi/10.1103/PhysRevLett.126.064801.
- Sahai et al. (2020) A. A. Sahai, T. Tajima, and V. D. Shiltsev, arXiv preprint arXiv:2004.09452 (2020).
- Yakimenko et al. (2019) V. Yakimenko, S. Meuren, F. Del Gaudio, C. Baumann, A. Fedotov, F. Fiuza, T. Grismayer, M. J. Hogan, A. Pukhov, L. O. Silva, et al., Phys. Rev. Lett. 122, 190404 (2019), URL https://link.aps.org/doi/10.1103/PhysRevLett.122.190404.
- Matheron et al. (2022) A. Matheron, P. Claveria, R. Ariniello, H. Ekerfelt, F. Fiuza, S. Gessner, M. Gilljohann, M. Hogan, C. Keitel, A. Knetsch, et al., arXiv preprint arXiv:2209.14280 (2022).
- Yee (1966) K. Yee, IEEE Transactions on antennas and propagation 14, 302 (1966).
- Lifschitz et al. (2009) A. F. Lifschitz, X. Davoine, E. Lefebvre, J. Faure, C. Rechatin, and V. Malka, Journal of Computational Physics 228, 1803 (2009).