Design Space Exploration and Optimization for Carbon-Efficient Extended Reality Systems
Abstract.
As computing hardware becomes more specialized, designing environmentally sustainable computing systems requires accounting for both hardware and software parameters. Our goal is to design low carbon computing systems while maintaining a competitive level of performance and operational efficiency. Despite previous carbon modeling efforts for computing systems, there is a distinct lack of holistic design strategies to simultaneously optimize for carbon, performance, power and energy. In this work, we take a data-driven approach to characterize the carbon impact (quantified in units of ) of various artificial intelligence (AI) and extended reality (XR) production-level hardware and application use-cases. We propose a holistic design exploration framework to optimize and design for carbon-efficient computing systems and hardware. Our frameworks identifies significant opportunities for carbon efficiency improvements in application-specific and general purpose hardware design and optimization. Using our framework, we demonstrate 10 carbon efficiency improvement for specialized AI and XR accelerators (quantified by a key metric, tCDP: the product of total and total application execution time), up to 21% total life cycle carbon savings for existing general-purpose hardware and applications due to hardware over-provisioning, and up to 7.86 carbon efficiency improvement using advanced 3D integration techniques for resource-constrained XR systems.
1. Introduction
The world’s push toward an environmentally sustainable society is highly dependent on the semiconductor industry, due to global-scale carbon footprints of sources such as electric vehicles to augmented and virtual reality (XR)111Augmented reality (AR), virtual reality (VR) and extended reality (XR) for the combination of both AR and VR. wearable devices. As computing technology and digital accessibility proliferate, the carbon footprint (quantified in units of ) of the Information and Communication Technology (ICT) sector is expected to exceed its current of global emissions (Andrae and Edler, 2015; Freitag et al., 2021). In 2022 alone, digital adoption increased with 192 million more users connected to the Internet, 85 million more unique mobile phone users, and 300 additional, newly-announced hyperscale datacenters expected to be in operation by 2024 (Keepios et al., 2022; Group, 2022). For the ICT sector to achieve an environmentally sustainable carbon footprint, computing system developers must optimize and low-carbon systems for key application use cases, such as AI and XR, across different layers of the computing stack.
Optimizing hardware for carbon efficiency leads to trade-offs from performance and energy optimizations. For many of today’s computing systems, the dominating source of carbon footprint has shifted from operational carbon: due to energy consumption during technology or application use, to embodied carbon: from hardware manufacturing and production (Gupta et al., 2021). The total life cycle carbon emissions of a computing system is the total of the system’s embodied and operational carbon. The growing shift from operational to embodied carbon is the result of decades of operational energy efficiency optimization from integrated circuits. In some cases, embodied carbon accounts for 50% of cloud computing’s carbon footprint, and over 70% of consumer electronics carbon footprint (Gupta et al., 2021).
Prior carbon accounting efforts quantify carbon emissions of computing systems from semiconductor manufacturing and hardware production to operational use and end-of-life processing (Teehan and Kandlikar, 2013; Boyd, 2011; Jones et al., 2013a, b). Carbon modeling tools, such as GreenChip (Kline et al., 2019) and the architectural carbon modeling tool ACT (Gupta et al., 2022), enable carbon-aware design exploration. ACT proposes carbon metrics such as embodied carbon-delay product (CDP) to optimize for embodied carbon and performance, and embodied carbon-energy product (CEP) to optimize for embodied carbon and energy. Additionally, recent work uses proxies to provide intuitions into systems’ carbon footprint in the absence of industry carbon databases at design time (Eeckhout, 2022). These efforts are a first step to model system hardware’s carbon footprint and explore carbon-aware systems.
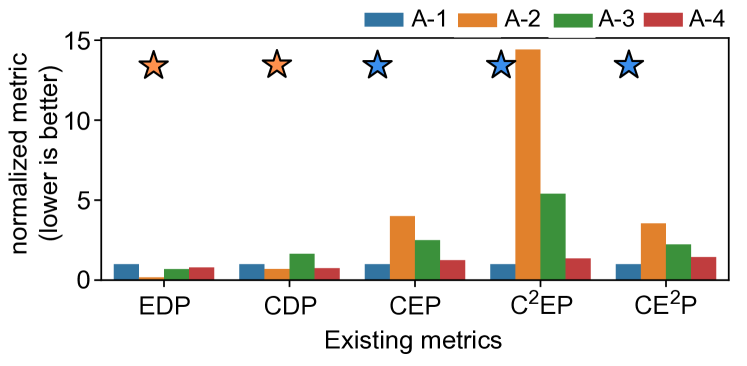
Figure 1 presents the results of EDP, CDP, CEP, C2EP, CE2P for four real-production hardware accelerators, A-1 to A-4. The optimal accelerator for the applications under study based on EDP and the state-of the-art sustainability metrics—CDP, CEP, CE2P, C2EP—differs. Accelerator A-2 is EDP and CDP optimal due to its higher compute and SRAM capacities, leading to higher performance and energy efficiency. Accelerator A-1 is CEP, CE2P, and C2EP optimal due to its low embodied carbon—approximately 4 times lower than A-2’s and 3 times lower than A-3’s embodied carbon.
Here Figure 1 highlights the importance of choosing the right metric during system design. Even in this simple example, choosing to optimize for CDP versus CEP results in an entirely different design choice (i.e., A-2 vs. A-1); in Section 3, we justify the effectiveness of a specific metric — tCDP (the product of total and total application execution time) — to guide designers toward making carbon-efficient design decisions.
In this paper, we aim to address three outstanding deficiencies in today’s carbon-aware system design:
-
•
Carbon modeling tools must consider the changing relative ratio between embodied and operational carbon based on application requirements, renewable energy availability, operational use and lifetime, and hardware design knobs.
-
•
Hardware design tools should enable computer architects and designers to assess the impact of varying hardware design on performance, power, energy, and total life cycle emissions, i.e. operational and embodied carbon.
-
•
Hardware design tools should consider the role of workloads and applications, leading to varying hardware utilization (such as thread-level parallelism). This is to provision hardware efficiently at the design phase and minimize unused hardware real estate incurring higher total life cycle carbon.
A holistic design and optimization framework for low-carbon system hardware spanning fabrication processes, to architectures, to applications, considering application-specific requirements and hardware provisioning is required.
To address these outstanding challenges, we propose a system design and optimization framework to co-design embodied and operational carbon—the overall life cycle carbon emissions—during the hardware development process. Our framework considers three key aspects of system design as inputs: embodied carbon parameters specific to commercial fabrication of system hardware; operational use parameters, such as non-operational idle time and use-phase carbon intensity measured in units of emitted per kWh of energy; and characteristics of application use cases, which system hardware is tailor-designed for. We formulate the design space of carbon-efficient systems as a multi-objective optimization problem, where we propose a new metric tCDP that minimizes for total life cycle carbon and delay subject to power, area and Quality-of-Service (QoS) design constraints. A key contribution of our work is the consideration of the intricate interplay between embodied and operational carbon as the carbon bottleneck shifts based on the use and lifetime of computing systems.
Our key contributions are:
-
(1)
Quantification of In-Production Systems using the
tCDP metric, which identifies significant opportunities for carbon efficiency improvements. We take a data-driven approach to demonstrate that carbon aware metrics need to capture total life cycle carbon based on retrospective CPU and SoC analysis. Using in-production VR systems, we characterize the degree of dark silicon (i.e. under-utilized or unused circuitry) in terms of unused embodied carbon (over 60%) for real-world VR applications, highlighting significant carbon optimization potential for future system hardware (Section 2). -
(2)
A Carbon-Efficient System Design Framework
Co-optimizing Embodied and Operational Carbon:. We propose a carbon efficiency optimization framework with a new metric, considering total life cycle carbon. Using the proposed carbon efficiency metric tCDP, we simultaneously optimize for total life cycle carbon and PPA, achieving 9 and 49 times carbon efficiency improvement over designs optimized using CDP and CEP, respectively, for future XR system hardware (Section 3 and Section 5.2). -
(3)
Case Studies in Designing Carbon Efficient Systems: Our framework demonstrates the carbon efficiency improvement potential of application-specific hardware. Designing system hardware for AI versus XR workload use cases achieves up to 7.3 times better carbon efficiency improvement compared to system hardware tailor-designed for the entire AI and XR kernel suite (Section 5.1). Designing for specific hardware operational lifetime yield accelerators with 2.3 times better carbon efficiency (Section 5.3). Leveraging hardware over-provisioning to optimize for carbon-efficient general-purpose hardware demonstrates up to 2 times embodied carbon savings and up to 21% improvement in total life cycle carbon (Section 5.4). Depending on operational lifetime and use of VR hardware, carbon-efficient optimal lifetimes vary between 5 years (20% carbon savings) and 2 years (50% carbon savings) (Section 5.5). For integrated circuits with stringent form factor requirements (as is the case for many XR applications), energy-intensive off-chip memory accesses, bandwidth limitations, advanced 3D-integration technologies achieve 1.1 to 7.86 times carbon efficiency improvements over 2D baseline (Section 5.6).
2. Motivation
To understand the design and optimization space of carbon-efficient systems, we characterize and present the carbon characteristics of a variety of high-performance server-class CPUs and mobile SoCs (Section 2.1). Taking a step further, we expand the carbon characterization study to VR applications—an emerging application domain with significant carbon improvement potential (Section 2.2). The data-driven insights motivate our framework for designing future carbon-efficient systems including systems for AI and XR.
2.1. Carbon-Aware Optimization Should Consider Total Life Cycle Carbon
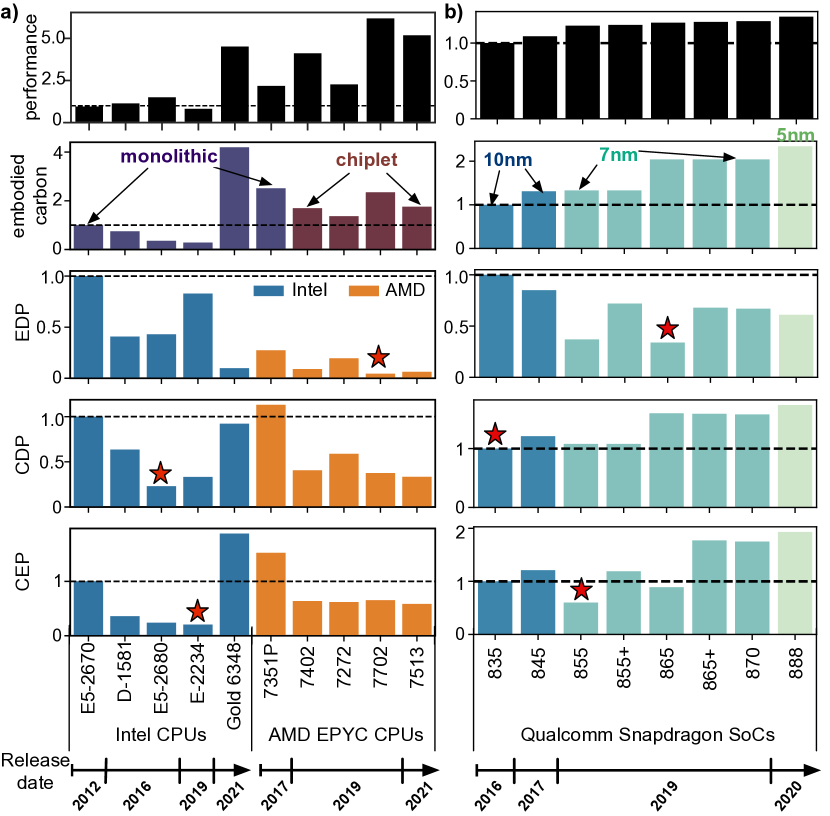
Existing carbon metrics do not capture desired design optimization objectives sufficiently for life cycle emissions of system hardware. Figure 2(a) presents the performance222CPU performance based on CPUMark benchmark suite (software, 2022). SoC performance based on CenturionMark benchmark suite (TechCenturion, 2020). Operational energy estimate is , where TDP is the thermal design power. and carbon analysis results over a variety of high-performance server-class CPUs (x-axis) released between 2012 and 2021(Wikichip, 2022; Anandtech, 2022a, b; Techpowerup, 2022; cpu world, 2022), using energy-delay product (EDP) and state-of-the-art carbon metrics (Gupta et al., 2022)—CDP and CEP.
Our analysis shows that the latest released CPUs and SoCs exhibit higher performance and lower operational energy. For Figure 2(a) embodied carbon, we assume a fixed 80% yield for monolithic CPUs (i.e. single die), and a higher yield for chiplet architectures (i.e. re-partitioning monolithic dies into multiple smaller dies) based on AMD’s 0.59 cost reduction for chiplet designs versus the monolithic approach (Naffziger et al., 2021). AMD chiplet CPUs exhibit embodied carbon benefits due to multiple smaller die areas with higher yield compared to AMD’s EPYC 7351P, which is a larger monolithic die architecture.
The estimation for fab carbon intensity assumes US grid for Intel CPUs (Gröger et al., 2021), and Taiwan grid for AMD CPUs based on location. Given that EDP optimizes for operational energy and performance, the EDP-optimal CPU—AMD EPYC 7702—does not account for the CPU’s embodied carbon or operational carbon intensity. The CDP-optimal CPU—Intel E5-2680—does not account for operational energy or carbon intensity of the datacenter’s electrical grid.
For mobile Qualcomm SoCs in Figure 2(b), there is an increasing embodied carbon trend as process technology advances over the years. Similar to the CPU analysis, EDP-optimal SoC—Snapdragon 865—does not account for embodied carbon or operational carbon intensity. CDP-optimal SoC—Snapdragon 835—does not account for operational energy or the used electrical grid carbon intensity.
A challenge faced when we attempt to analyze the carbon efficiency of commodity CPUs and mobile SoCs is the lack of relationship between embodied and operational carbon. As illustrated in Figure 2, metrics focused on embodied carbon only do not consider system hardware uses and therefore do not reflect carbon-efficient systems across the entire system product life cycle. This is because the metrics do not account for operational efficiency. For instance, while Intel E-2234 CPU is CEP-optimal (Figure 2(a)), it is CDP sub-optimal because of the lower performance. Similarly for mobile SoCs, while Snapdragon 855 is CEP-optimal (Figure 2(b)), it is CDP sub-optimal because of its higher embodied carbon. The existing metrics are insufficient to optimize for the hardware’s energy efficiency without accounting for operational carbon.
Using the retrospective analysis, we show that EDP does not account for total life cycle carbon, CEP is yet to capture the ratio between embodied and operational carbon of the system, and CDP is yet to capture the operational energy and the carbon intensity of operational use. Furthermore, carbon-aware metrics should capture the different design parameters of performance, operational energy efficiency, operational carbon and embodied carbon simultaneously. Designing system hardware with life-cycle emissions in mind leads to carbon-efficient systems.
Given the rise of new application use cases, we expand our carbon characterization study to consumer-focused XR devices. With the rising use of XR systems, we analyze real-production VR devices (i.e. Meta Quest 2) to identify carbon reduction opportunities for carbon-efficient design decisions. Sections 5.1 and 5.2 demonstrate carbon efficiency improvement for future XR systems when total life cycle carbon is a design parameter in the hardware optimization process. Designing environmentally-sustainable XR devices is particularly important as production volume of emerging XR systems is expected to multiply in the near future.
2.2. Hardware Over-Provisioning Presents Carbon Reduction Opportunities
The optimization objectives for battery-powered systems are dominated by runtime demands—low latency and extremely low power. This has led to the carbon breakdown for state-of-the-art smartphones and wearables to pivot from operational to embodied carbon. The operational carbon to embodied carbon ratios for iPhone-3 and iPhone-14 released by over a decade apart have shifted from 49% to 18%, respectively (Apple, 2009, 2022). While high-level operational and embodied carbon breakdown is available for a wide collection of Apple products, to our knowledge, there has not been prior work that quantifies the potential carbon saving available for emerging applications. Here, we take a data-driven approach to characterize VR applications in deployment, which we expect to see increasing relevance with the rise of VR devices. To harvest the at-scale impact over billions of VR systems in the years forward, it is crucial to understand their carbon optimization potential.
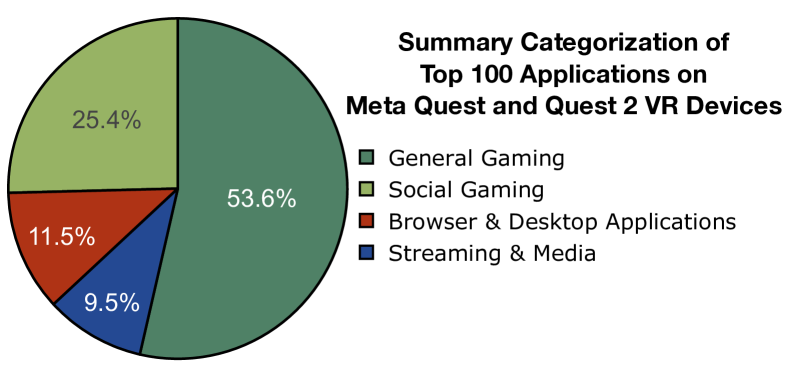
To design low-carbon system hardware for real-world VR applications, we analyze the top 100 applications running on real-production VR headsets based on the data collected from deployed VR devices running in the wild. We categorize the applications into four primary categories: general gaming (G), social gaming (SG), browser & virtual desktop (B), and streaming & media (M) as shown in Figure 3. The top 10 applications cover over of the overall compute cycle on all of the in-the-field VR devices.
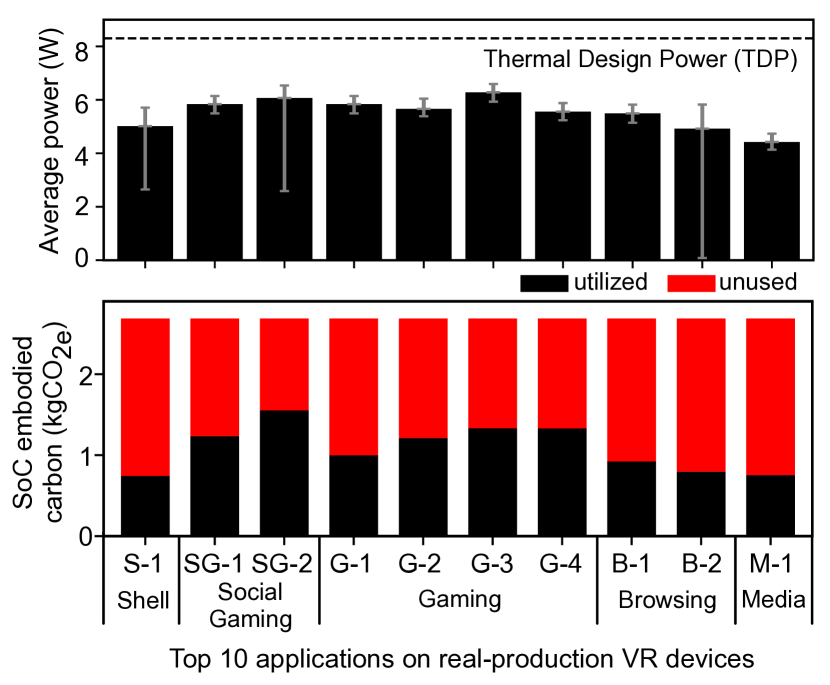
Based on the measurement data, Figure 4 (top) presents the average power consumption of the top 10 VR applications with respect to the Thermal Design Power (TDP) of the VR headset. The error bars represent the p5 and p95 power consumption of the VR devices under study. Operational carbon follows same trend as operational power. Additionally, Figure 4 presents the embodied (black and red bars) carbon for the top 10 VR applications. The carbon characterization is based on the assumption that a real-production VR headset is used for one hour daily for a total device lifetime of three years. The embodied carbon footprint considers the CPU and GPU on the VR headset. We take a step further to breakdown the overall embodied carbon into utilized and unused embodied carbon based on hardware utilization, where utilization is defined as the active time of the hardware over the total application runtime.
Our goal is to reduce the embodied carbon footprint of computing while maintaining a competitive level of performance and operational efficiency. While it is important to account for peak performance, in most usage scenarios, users do not utilize the hardware components sufficiently. Therefore, there is unused hardware real estate on devices, which results in embodied carbon inefficiencies. Hardware under-utilization is also observed at the datacenter scale (Barroso and Hölzle, 2007; Acun et al., 2022; Wu et al., 2022). Last but not least, current computations of embodied carbon do not account for hardware utilization of the SoC. In many cases, especially in consumer electronics, devices are over-provisioned with the majority of hardware sitting idle or in the sleep mode.
When the operational time includes both idle and non-idle runtime, possible embodied carbon reduction opportunities may be overlooked. With the ever-increasing need to design environmentally-sustainable computing systems, it is necessary to account for any under-utilized hardware real estate in future systems.
3. Carbon-efficient Optimization Framework
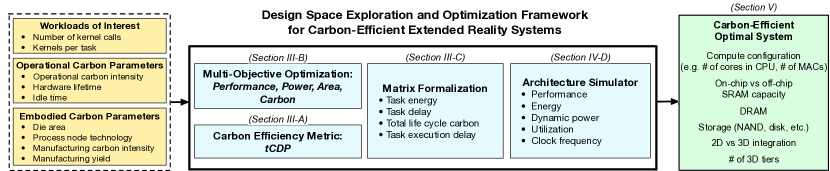
We propose a design space exploration and optimization framework to design carbon-efficient computing systems. It enables the consideration of the dynamic interplay between the operational and embodied carbon at the design phase. This unique, new feature allows architects and hardware designers to produce systems with improved carbon efficiency. Figure 5 provides an overview for the proposed closed-loop carbon-aware design and optimization framework.
The framework takes in three input categories: (1) Embodied carbon parameters for the hardware components and the manufacturing conditions; (2) Operational use parameters including use-phase carbon intensity and system idle time; (3) Workloads of interest including the number of kernel calls and kernels per task to enable multi-workload carbon-efficient optimization.
We formulate the design space of carbon-efficient systems as a multi-objective optimization problem. The input parameters are encoded into matrices and we solve the optimization objective subject to the design constraints by minimizing tCDP—total Carbon Delay Product, where C is the life cycle carbon of the system.
Section 3.1 introduces the new carbon efficiency metric: tCDPand Section 3.2 details the mathematical formulation of the carbon efficiency optimization problem. Lastly, Section 3.3 describes the matrix formalization of the carbon efficiency design optimization parameters.
| Parameter | Carbon-efficiency Equation | Design Use-case |
|---|---|---|
| clean fab & operational carbon dominant system | ||
| 100% renewable energy-grid | ||
| operational carbon dominance range | ||
| embodied carbon dominance range | ||
| embodied and operational carbon are in units and relation known at design phase |
3.1. tCDP: A Figure-of-Merit to Guide Carbon-Aware System Optimization
To effectively evaluate the carbon efficiency of new system hardware designs using our optimization framework, we propose a primary carbon efficiency figure-of-merit where:
tCDP optimizes for the total life cycle carbon footprint of the system (), i.e. operational and embodied, and simultaneously trade-off the conventional hardware optimization approaches of performance-power-area (PPA) and energy efficiency. tCDP is a combined optimization metric that gives additional information beyond the isolated metrics of carbon and delay. Specifically, tCDP quantifies how efficiently we are using the carbon of the systems we design. Lower tCDP indicates better carbon-efficient systems.
3.2. Optimization Framework
To optimize for low-carbon computing systems while achieving operational efficiency, the framework minimizes for embodied carbon, operational carbon, and delay. We describe the objectives of our optimization problem as follows:
where represents the hardware computing system, (x) for operational carbon, (x) for embodied carbon, and for the task execution delay of the system. Our goal is to minimize for operational carbon, embodied carbon and small task execution delay (i.e. small and small ). To address the challenge of not knowing the trade-offs due to carbon accounting uncertainties, we scalarize the multi-objective optimization problem into and minimize the weighted scalar sum objective. Without loss of generality, we can take and when forming the associated scalarized problem to optimize for carbon-efficient computing systems:
| subject to | |||||
Here represents the whole system consisting different logic and memory components. Parameters ai, qj, and pl are the area, quality of service (QoS), and power optimization constraints of the different components of the system, respectively.
is equal to 1 when and of a system are both in units of and their relative ratio is known to compute the total carbon of the system . In this case, exactly (refer tCDP Subsection 3.1). However, there are multiple reasons why the relation between embodied carbon and operational carbon of the system could be unknown. For instance, due to uncertainty in the quantification of carbon footprint data; lack of knowledge on conditions and period of operational use; or when the parameters to compute are challenging to identify their relative scale factors. Using we can sweep the pareto-optimal curve of versus based on the primary design constraints and trade-offs between the different design points. Therefore, when the relative scaling between embodied and operational carbon is challenging to quantify, we mathematically know the true carbon-efficient optimal point is somewhere on the pareto-optimal front. Table 1 defines the sweep ranges of .
Below we present a mathematical example of the optimization framework for real-production VR headsets:
| subject to | |||||
Where represents the VR headset system, the area constraints are based on data presented in Methodology Section 4.2 and Table 5, the QoS constraint is a target frame rate to ensure quality of user-experience (Huzaifa et al., 2021), and the power constraint is 8.3W which is the TDP previously shown in Figure 4. The corresponding carbon efficiency optimal results are discussed in Section 5.4.
| Parameter | Description |
|---|---|
| k | Kernels |
| N | Number of kernel calls |
| T | Task defined by number of kernel calls |
| D | Task delay |
| Hardware target system | |
| U | Hardware utilization ratio |
| E | Operational energy consumption |
| P | Leakage power |
| P | Dynamic power |
| P | Total power = P + P |
| Clock frequency | |
| CI | Use-phase carbon intensity |
| CI | Fab carbon intensity |
| EPA | Fab energy per area |
| MPA | Materials per area |
| GPA | Direct gases emitted per area |
| Y | Fab yield |
| A | Area of components in system |
| C | Operational carbon |
| C | Embodied carbon per component in system |
| C | Overall embodied carbon of a system |
| LT | Hardware lifetime |
| D | Idle time throughout the system’s lifetime |
| C | Amortized embodied carbon |
| tCDP | Carbon efficiency metric |
3.3. Matrix Formalization
Next, we formulate the key inputs and parameters of the design optimization in a matrix format. The matrix formalization enables designers to tune design knobs and identify hardware configurations that maximize carbon efficiency.
Table 2 presents the parameters of the matrix formalization. We define a task T as a set of k kernels. Where each task could be one kernel or more, depending on the number of kernel calls per task (). For example, a zero value would indicate that a kernel k is not part of the task T. This formulation allows us to optimize for multiple computation kernels and application tasks of interest, while meeting the latency performance requirements and hardware design constraints of the system.
Below we present a detailed breakdown of the four main computations in the matrix formalization:
3.3.1. Task energy
First, we compute the energy consumption per task (). Each kernel in a task consumes energy based on clock frequency, , hardware-dependent leakage power, , and dynamic power, . To get the energy consumption for all tasks, we multiply number of kernel calls per task () with the energy consumption () per kernel. We get task execution energy vector E:
3.3.2. Task delay
Second, to get the task delay per task (), we multiply the number of kernel calls per task () and the kernel execution time () on its respective hardware system. We get the task delay vector D:
3.3.3. Total life cycle carbon
We define the total life cycle carbon of executing a task on a hardware target to be the sum of both operational and embodied carbon footprint, where . Below we detail how we compute operational and embodied carbon:
-
•
Operational carbon
To compute the operational carbon () due to the energy consumption of the task operating on hardware, we multiply the use-phase carbon intensity (CI) with the norm of the task energy vector ():
The above equation is analogous to the scalar operational carbon equation presented in ACT333Architectural Carbon Modeling Tool used to quantify carbon footprint. (Gupta et al., 2022).
-
•
Embodied carbon
To compute the overall embodied carbon of a chip, we use ACT’s embodied carbon equation as follows (Gupta et al., 2022):
where stands for carbon intensity of the fab’s electrical grid, EPA is fab energy per die area, MPA is carbon footprint of procured materials used in manufacturing per area, GPA is direct fab gas emissions, A is die area, and Y is fab yield. These parameters are dependent on the fab vendor and the process technology node.
To compute the overall embodied carbon of hardware target , we multiply the embodied carbon hardware target vector (C) with a binary vector, indicating online (1) and offline (0) components in the hardware target system. The different components in the embodied carbon hardware target vector indicate different compute and memory configurations, such as number of CPU cores, number of Multiply-Accumulate (MAC) Arrays, GPUs, DRAM, on-chip versus off-chip SRAM, and DSPs.
where is the overall embodied carbon of the system throughout its lifetime. This formulation provides hardware provisioning as a design knob in our optimization framework. Therefore, designers can optimize for carbon efficiency presented by unused embodied carbon reduction opportunities. In Section 5.4, we showcase carbon efficiency improvements in real-production VR systems due to hardware provisioning design optimization.
Next, we amortize embodied carbon over the execution time and not the lifetime of the system in years. This is to ensure we do not underestimate and amortize the embodied carbon over idle time when the system is not in use. We define as the idle time throughout the system’s lifetime (LT). Where is the system’s operational lifetime. We take the norm of the task delay vector D to get the total task delay ().
Amortized embodied carbon () is as follows:
3.3.4. Task execution delay
To optimize for carbon-efficient systems, i.e. high performing and low-carbon systems, we minimize for the reciprocal of performance or the task execution delay. Task execution delay can be computed by taking the norm of the task delay vector (D) to get the total task delay (). It can also be computed as the reciprocal of another performance measurement relevant for the system optimization space, e.g. CPUMark, SPEC scores, frames-per-second.
4. Experimental Methodology
4.1. Workloads
| Task | Computation Kernel | Category | ||||
|---|---|---|---|---|---|---|
| Object classification |
|
AI | ||||
| Object detection | MobileNet-V2 (MN2) (Sandler et al., 2018) | AI | ||||
| Eye tracking | SegNet (ET) (Badrinarayanan et al., 2017) | XR | ||||
| Depth estimation | 3D Aggregation (3D-Agg) (Li et al., 2021) | XR | ||||
|
High-Res Net (HRN) (Sun et al., 2019) | XR | ||||
| Emotion detection | EmoFAN (E-FAN) (Toisoul et al., 2021) | XR | ||||
| Hand tracking | Joint Location Predictor (JLP) (Mueller et al., 2017) | XR | ||||
| Image denoising | UNet (Ronneberger et al., 2015) + Feature-Align (DN) (Young et al., 2022) | XR | ||||
| Super-resolution | Superres (SR) (Bhat et al., 2021) | XR |
| Cluster name | Kernels | ||
|---|---|---|---|
| 10 XR-dominant |
|
||
| 10 AI-dominant |
|
||
| 5 XR | 3D-Agg; HRN; DN; SR (512512); SR (10241024) | ||
| 5 AI | RN-18; RN-50; RN-152; GN; MN2 |
We characterize a variety of AI and XR workloads, shown in Table 3, using the hardware performance profiling tool specified in Section 4.4 below. For our design space exploration, we cluster the AI and XR workloads into five clusters; 10 XR-dominant, 10 AI-dominant, 5 XR, and 5 AI as specified in Table 4.
4.2. Carbon Measurement
To compute the embodied carbon footprint, we use ACT which is an architectural carbon footprint modeling tool based on industry environmental reports and detailed fab characterization (Gupta et al., 2022). We update ACT to include the most recent fab characterization data (Ragnarsson et al., 2022) and incorporated more die placement and yield models (de Vries, 2005; Murphy, 1964).
We compute the embodied carbon of the SoC used for real-production VR headsets based on the following assumptions. The Qualcomm Snapdragon SoC is manufactured in 7nm process technology node and has an Octa-core CPU. We approximate 20% of the SoC is devoted to each of the CPU, based on the annotated floorplan die photo of a Qualcomm Snapdragon 845 by TechInsights (AnandTech, 2018; TechInsights, 2018). We approximate the gold cores are of the CPU’s total area and silver cores are the remaining . We assume a fixed 85% die yield and assume coal-grid carbon intensity for the manufacturing electricity. The estimates are summarized in Table 5.
| Parameter | VR |
|---|---|
| Total die area (cm2) | 2.25 |
| CPU (cm2) | 0.45 |
| CPU gold (cm2) | 0.3 |
| CPU silver (cm2) | 0.15 |
| CPU gold embodied carbon (gCO2e) | 895.89 |
| CPU silver embodied carbon (gCO2e) | 447.94 |
4.3. Production-level VR System Hardware
We use the Android Debug Bridge (adb) software to connect to the unlocked VR device and profile applications in real-time. Using Simpleperf (Source, 2022), a native CPU profiling tool for Android, we collect the number of instructions and clock cycles for each core configuration to compute Instructions-per-cycle (IPC) per application. We also measure the frame rate (FPS), temperature, and GPU utilization% every 1s. Additionally, we use Perfetto UI (Google, 2022), an open-source system-wide profiling and application tracing software for Android, to profile the thread-level parallelism (TLP) of the top 10 applications running on VR.
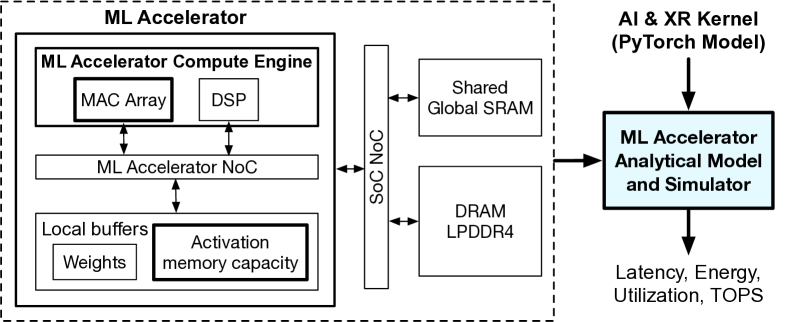
4.4. Performance and Power Simulation for Hardware Design
We use an accelerator simulator based on a scaled-up version of Simbal et al’s work (Sumbul et al., 2022). The simulator takes a neural network model as input, extracts the operators, and outputs Tera-Operations-per-Second (TOPS) performance, latency, utilization and energy consumption for specified hardware architecture configurations (Figure 6). We evaluate and present the performance and energy results for four distinct hardware accelerators based on production hardware targets.
5. Evaluation Results and Analysis
5.1. Result Overview for the Carbon-Efficient System Design Space Exploration
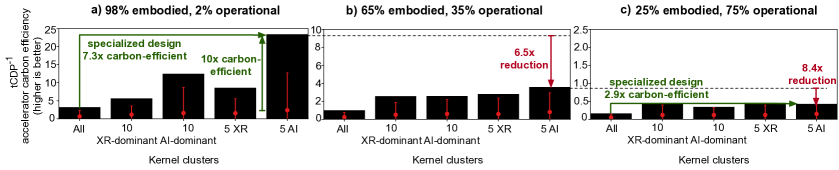
Figure 7 presents the carbon efficiency results (y-axis) of the hardware design space exploration. The x-axis represents the five application workload clusters444Table 3 summarizes the AI and XR kernels in each cluster. system hardware is tailor-designed for using our framework. The bars represent the carbon efficiency of the optimal hardware accelerator configurations using tCDP. Whereas the dots represent the average carbon efficiency results of the hardware accelerator across the hardware design space of the 121 Multiply-Accumulate (MAC) arrays and on-chip SRAM capacity configurations. The error bars show the p5 and p95 carbon-efficient design points. To demonstrate our carbon-efficient design optimization framework capturing the embodied and operational carbon trade-offs, we design for different workload capacities and operational lifetimes corresponding to 98%, 65%, and 25% embodied carbon to the total life cycle carbon.
Assuming same hardware lifetime and utilization, when embodied carbon is the dominating source of total life cycle carbon, specializing system hardware for applications of similar characteristics can lead to hardware with higher carbon efficiency. For example, the most carbon efficient hardware accelerator tailor-designed for the 5 AI kernel cluster is 7.3 times more carbon-efficient than the most carbon-efficient accelerator designed for All (Figure 7(a)). This also applies when operational carbon is the dominating source of the total life cycle carbon. For example, the most carbon-efficient accelerator designed for 5 AI is 2.9 times more carbon-efficient than the the most carbon-efficient accelerator designed for All (Figure 7(c)).
Furthermore, the room for carbon efficiency improvement is significant. Carbon efficiency quantified by tCDP can be 10 times higher for the most carbon efficient hardware accelerator configuration than the average accelerator (Figure 7(a) 5 AI kernel cluster).
When designing system hardware for longevity in mind with a lower embodied to life cycle carbon ratio (Figure 7(a) to (c)), the drastic carbon improvement potential is diminished. For example, for the 5 AI kernel cluster, the carbon efficiency improvement is reduced from 6.5 to 8.4 times when the embodied to total life cycle carbon ratios move from 98% to 25%. This demonstrates the importance of considering total life cycle carbon into the hardware design process—both embodied and operational carbon. Thus, we achieve 1.29 times carbon efficiency improvement over the two distinct product use longevity scenarios.
5.2. Carbon Efficiency of tCDP over Existing Metrics
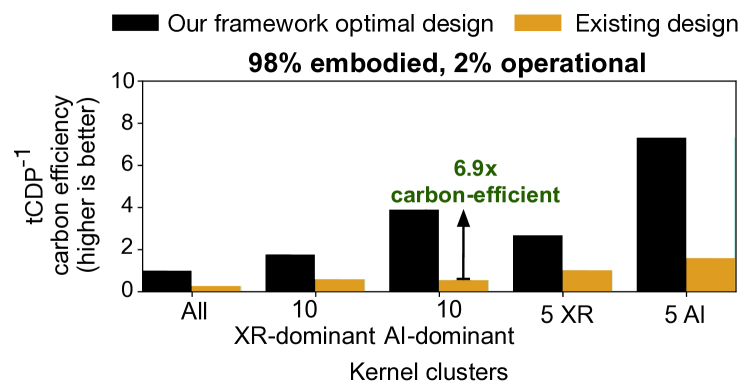
Based on our framework’s hardware design space exploration and optimization results, we compare the carbon efficiency results of the framework’s optimal accelerator designs using tCDP to the optimal accelerator designs using non-carbon aware optimization such as EDP. Figure 8 presents the carbon efficiency results normalized to All the kernels. Optimizing hardware design using our carbon-efficiency metric tCDP compared to the design optimized for carbon-oblivious metrics, such as EDP, yields between 1.2 to 6.9 times better carbon efficiency improvement.
5.3. Designing for Specific Hardware Operational Lifetimes Yields Different Accelerators with Varying Carbon Efficiency
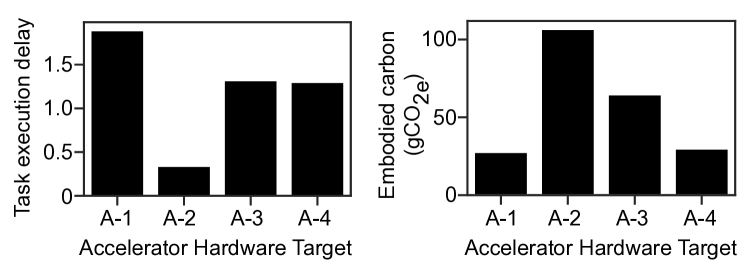
Based on our hardware design space exploration and optimization results for performance, power, area (PPA) and carbon, we produce four hardware accelerators—A-1 to A-4. Figure 9 illustrates the latency performance and embodied carbon for the four hardware accelerators. Accelerator A-2 performs approximately 4 times better than A-3 and A-4, and 5.5 times better than A-1 (Figure 9(a)). On the other hand, A-2 has the highest embodied carbon (Figure 9(b)).
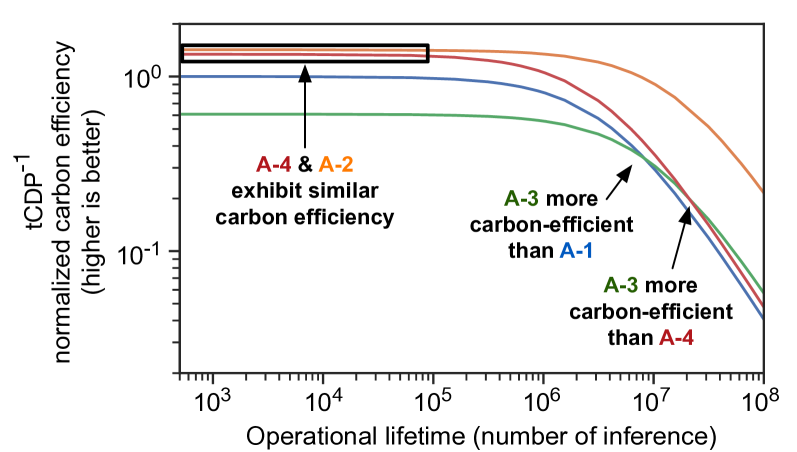
Figure 10 illustrates the carbon efficiency results for the four accelerators (y-axis) for different operational lifetimes specified in number of inference (x-axis). The carbon efficiency curves are normalized to A-1 designed for inference: A-1 (blue), A-2 (orange), A-3 (green), and A-4 (red).
Carbon efficiency optimal hardware varies depending on the use duration the hardware is designed for. Here, the operational lifetime in units of number of inference determines the ratio of embodied and operational carbon of the system hardware. Figure 10 shows, when shorter use phases are targeted at the hardware design time, i.e. number of inference below 105, accelerators A-2 and A-4 exhibit similar carbon efficiency results, despite accelerator A-4 having a significantly lower performance than A-2. This is because embodied carbon dominates operational carbon and accelerator A-4 has about 4 times lower embodied carbon. As operational exceeds embodied carbon, investing more embodied carbon in the hardware justifies the operational carbon efficiency and performance gains for accelerator A-2. Thus, as the operational lifetime of the hardware is prolonged from 105 to 108 inference, A-2 becomes significantly more carbon-efficient than A-4 due to A-2’s significant performance and operational efficiency benefits.
Similar carbon efficiency inflection point is observed for accelerators A-1 and A-3, as well as, A-3 and A-4, respectively. In the range between 106–107 inference, A-3 shifts from 20% operational carbon to 70% operational carbon dominance, while A-1 shifts from 36% to 85% operational carbon dominance. Accordingly, the carbon-efficient design point switches from the low embodied carbon A-1 accelerator to the higher embodied carbon but higher performing and lower operational carbon A-3 accelerator. We also observe a carbon efficiency cross-over between accelerators A-4 and A-3, which exhibit similar task performance (within 1% difference). As the usage of A-3 and A-4 become more operational carbon dominant, A-3 demonstrates higher carbon efficiency due to its lower operational energy outweighing A-4’s lower embodied carbon.
5.4. Optimizing Carbon Efficiency for General-Purpose System Hardware
In addition to designing low-carbon hardware, we demonstrate carbon efficiency optimization opportunities for real-production VR devices running realistic XR applications. By provisioning hardware for application-specific characteristics, embodied carbon can be amortized more effectively. Below we quantify the potential of hardware utilization improvement.
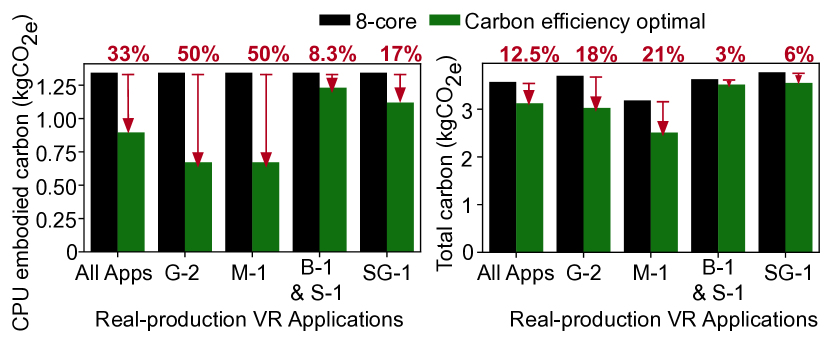
Figure 11 presents the embodied and life cycle carbon reduction results, leading to more carbon-efficient VR devices. Using our framework, we demonstrate up to 50% embodied carbon savings when the CPU core count configuration is tailor-optimized for G-2 or M-2 applications. For top VR applications, an average of 33% embodied carbon reduction can be realized by provisioning CPU core counts accordingly. Overall, the total life cycle carbon of presented VR systems can be improved by an average of 12.5%. This is expected because turning off CPU cores leads to less significant operational carbon reduction; whereas reducing number of CPU cores results in more meaningful overall carbon reduction.
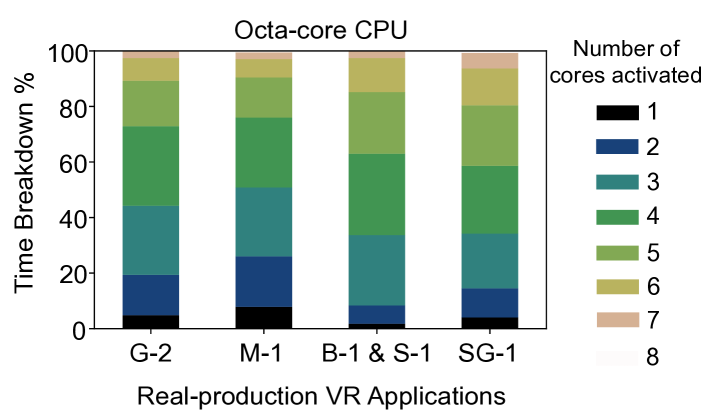
Taking a step further to illustrate the source of carbon efficiency improvement, Figure 12 quantifies the degree of thread-level parallelism (TLP)555TLP is the number of cores activated over the application execution time, such as: (Blake et al., 2010; Flautner et al., 2000). is the fraction of time in which i CPU cores are concurrently running and n is the total number of cores. for key real-production applications. The x-axis represents the four VR applications (G-2, M-1, B-1 and S-1, SG-1) deployed on the Octa-core CPU.
Whereas the y-axis presents the time breakdown for the various TLP levels. Over the four representative VR applications, TLP ranges from 3.52 to 4.15 for the Octa-core CPU.
Compared with desktop and smartphone use cases of 2 (Blake et al., 2010) and 1.46 (Pandiyan et al., 2013; Gao et al., 2015) average TLPs, modern VR applications exhibit higher hardware utilization parallelism with 3.9 average TLP. The core application kernels utilize three of the four gold cores on the Octa-core CPU. While auxiliary services, such as motion tracking, Inside-Out Tracking (IOT), and audio activities, utilize the four power-efficient silver cores. There are at least three unused cores at any point in time. The over-provisioned hardware presents embodied carbon reduction opportunities.
Across the top real-world VR applications, the TLP results indicate promising CPU core count reduction opportunities, leading to reduced embodied carbon with properly provisioned hardware and negligible performance penalty. While the room for per-device embodied carbon reduction may seem small, the impact over billions of VR devices deployed at scale can be significant. Our framework enables computer architects and designers to design and optimize for more carbon-efficient hardware provisioned systems.
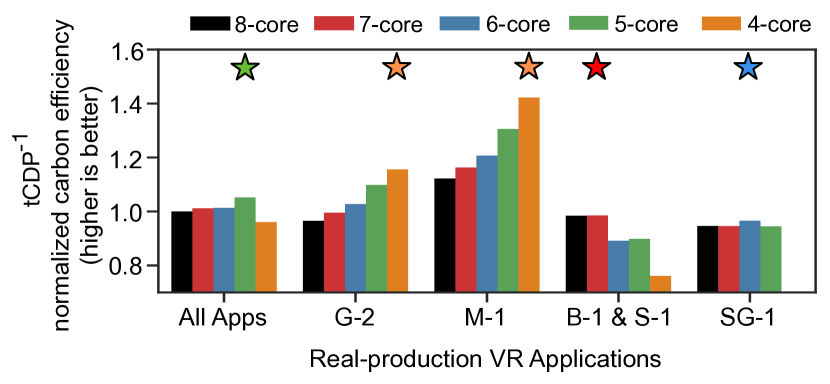
In Figure 13, using the matrix formalization, we present the carbon-efficient optimal core configuration for each of the VR application workloads (x-axis). The total task execution delay was computed as the reciprocal of the measured frame rate for each application using the different core configurations. The All Apps application workload indicates optimizing for the collective carbon efficiency of all applications–G-1, M-1, B-1 & S-1, SG-1. We identify optimal carbon-efficient 5-core CPU configuration for All Apps, 4-core for G-2 and M-1, 7-core for B-1 & S-1, and 6-core for SG-1.
5.5. Carbon-Efficient Hardware Replacement Frequency Varies with Operational Lifetime and Use
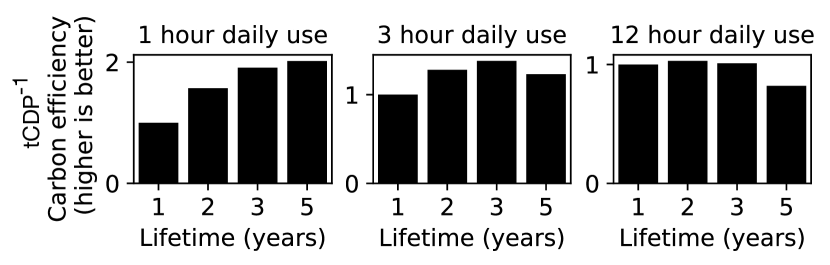
We investigate the impact of hardware replacement frequency on the carbon efficiency of a real-production VR headset. Figure 14 illustrate how the most carbon-efficient lifetime for a hardware system varies with operational lifetime and usage. On the horizontal axis we vary the hardware lifetime; where one year represents frequent hardware replacements and five years represents infrequent refreshes. From left to right, we vary the operational use from one-hour to three-hour to twelve-hour daily. Using our framework, we compute the operational carbon based on 1.21 average annual energy efficiency improvement due to hardware advancements (Gupta et al., 2022), and the TDP of Qualcomm Snapdragon SoC (refer to Figure 4) of a real-production VR headset.
We observe that extending hardware lifetime significantly depends on operational use and the resulting interplay between operational and embodied carbon. For instance, for one-hour daily use, the most carbon-efficient hardware lifetime to design for is 5 years. This is because embodied carbon dominates operational carbon of the system. However, as the user’s usage increases to three hours and twelve hours daily, the optimal carbon-efficient hardware lifetime shifts to 3 years and 2 years respectively. This is due to the increased device usage resulting in operational carbon dominance. Where frequent hardware replacements reap annual energy efficiency improvements, driving down the system’s total life cycle carbon. For the example system, the framework’s carbon savings are 50.5% between optimal 5-year and 1-year lifetimes for 1-hour daily use, 27.5% between optimal 3-year and 1-year lifetimes for 3-hour daily use, and 20.7% between optimal 2-year and 5-year lifetimes for 12-hour daily use. This emphasizes the importance of extending software-hardware compatibility based on the minimum expected hardware usage and operational lifetime to reap system carbon efficiency benefits.
5.6. Achieving Carbon Efficiency with Advanced 3D Integration Technologies
Finally, we explore the role of emerging circuit integration technologies on carbon efficiency for future XR systems with stringent form factor requirements. Because of the tight die area limitation and yield implication, it is challenging to scale 2D integrated circuits (ICs) further. Additionally, 2D off-chip memory interfaces are prohibitively energy intensive and bandwidth limited for XR devices (Yang et al., 2022).
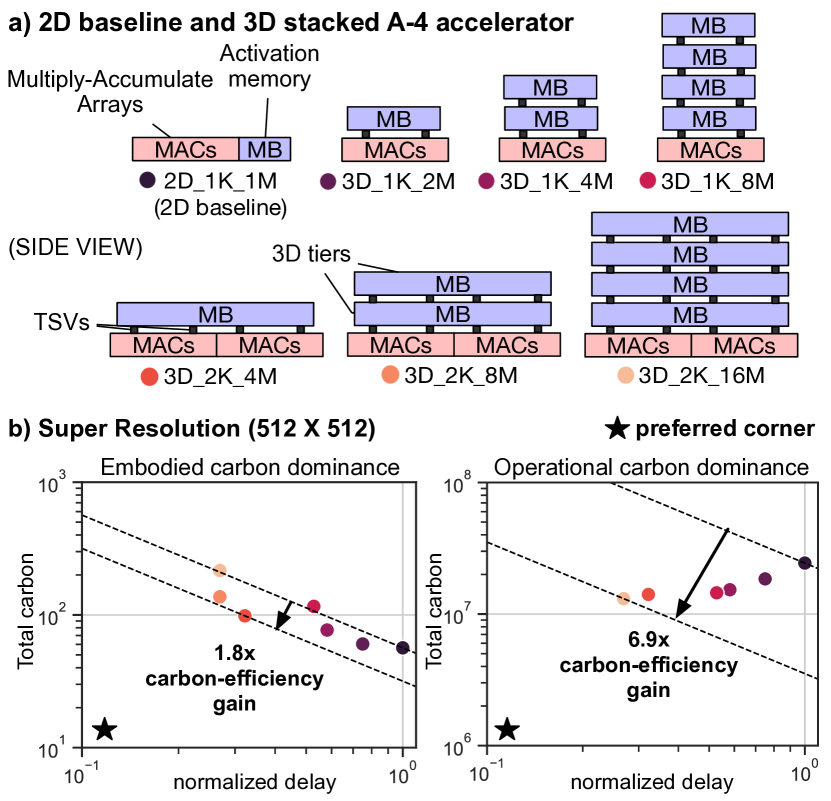
We evaluate the carbon efficiency of 3D stacking, using face-to-face (F2F) bonding with hybrid bumps, for hardware accelerator A-4 tailor-designed for select XR kernels in Table 3. Figure 15(a) shows the 2D baseline SoC memory disaggregation architecture compared to different 3D memory-stacked configurations, offering high-density vertical integration to local memory and compute. K and M represent number of MAC arrays and on-chip SRAM capacity respectively.
The embodied carbon computation for 3D stacking only takes into account the stacked dies. The carbon cost of the high-density 3D through-silicon-vias (TSVs) and the manufacturing process of stacking are not included due to lack of data. Figure 15(b) presents the carbon efficiency improvement of 3D accelerators designed for SR (512512) for 80% (left) and 6% (right) embodied carbon to total life cycle carbon. In embodied carbon dominance case, our framework achieves 1.8 times carbon efficiency improvement using 3D stacked 2K MACs and 4MB SRAM (3D_2K_4M). In operational carbon dominance case, our framework achieves 6.9 times carbon efficiency improvement using 3D stacked 2K MACs and 16MB SRAM (3D_2K_16M).
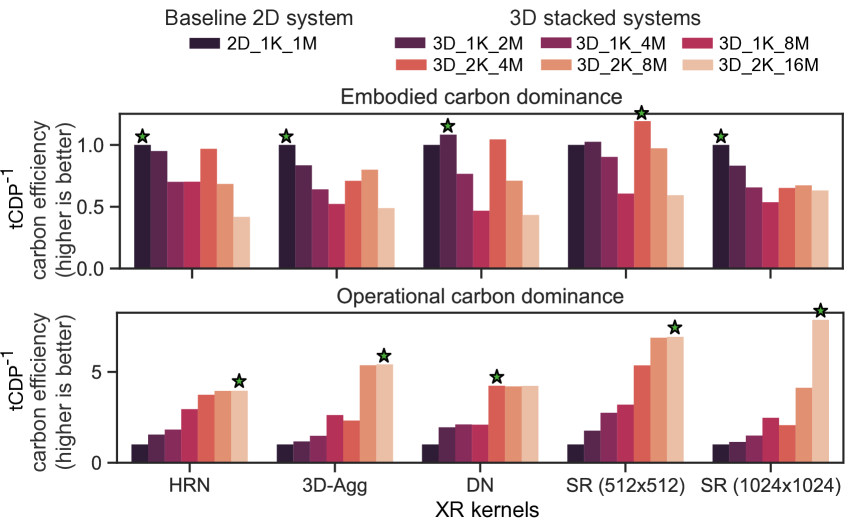
Figure 16 shows the carbon efficiency results of 3D stacked configurations normalized to the 2D baseline. In embodied carbon dominance case, 2D baseline is the most carbon-efficient configuration for HRN, 3D-Agg and SR (10241024). We observe limited carbon efficiency benefits for some 3D configurations; for SR (512512), 3D_2K_4M due to higher compute, and for DN, 3D_1K_4M due to higher SRAM. When operational carbon dominates use, the carbon-efficient optimal shifts towards 3D stacked ICs. 3D_2K_8M and 3D_2K_16M demonstrate similar carbon efficiency benefits of 4, 4.2, 6.9 times for HRN, 3D-Agg, and SR (512512), respectively. For compute and memory intensive SR (10241024), 3D_2K_16M improves carbon efficiency 7.86 times.
6. Related Work
Prior efforts have characterized and investigated the rising environmental impact of different computing systems (Gupta et al., 2021; Freitag et al., 2021; Garcia Bardon et al., 2020; Ragnarsson et al., 2022; Chang et al., 2012; Jain and Wullert, 2002). To tackle this growing problem, a variety of carbon modeling tools and methodologies have been proposed to quantify and evaluate computing systems’ carbon footprint (Kline et al., 2019; Gupta et al., 2022; Quisbert-Trujillo et al., 2020; Boyd, 2011). These models enable embodied and operational carbon accounting and consider sustainability as a first-order design metric. Across the proposed solutions, sustainability-aware carbon optimization yield distinct designs compared to optimizing for performance, power, and area. More recent work proposed a first-order model considering both embodied and operational carbon proxies to overcome current uncertainties in carbon data (Eeckhout, 2022). While these models provide early-stage insights into the environmental footprint of systems, they lack the framework and metrics to enable carbon-efficient system optimization and design. In this work, we demonstrate how to design and optimize carbon-efficient computing systems, accounting for performance, power, area, and total life cycle carbon simultaneously.
7. Conclusion
The primary goal of this work is to enable a path towards designing low carbon computing systems without sacrificing performance nor operational efficiency. First, we demonstrate that carbon-aware metrics should capture total life cycle carbon and characterize the degree of unused embodied carbon due to over-provisioning in existing hardware systems. Next, we propose a closed-loop cross-stack hardware optimization framework that yields carbon-efficient computing systems. We introduce carbon efficiency metric, tCDP, that captures the total life cycle carbon, including the changing relative ratio between embodied and operational carbon. Finally, we use our framework to design and optimize hardware accelerators and general purpose system hardware for a variety of XR workloads and applications. We hope this work lays the foundation for carbon-efficient design and optimization across the computing stack and paves the way for sustainable computing forward.
Acknowledgements
We would like to thank the colleagues at Meta: Jordan Tse, Noah VanGorder, Lita Yang, Edith Beigne for many valuable discussions and feedback on the work.
References
- (1)
- Acun et al. (2022) Bilge Acun, Benjamin Lee, Fiodar Kazhamiaka, Kiwan Maeng, Manoj Chakkaravarthy, Udit Gupta, David Brooks, and Carole-Jean Wu. 2022. Carbon Explorer: A Holistic Approach for Designing Carbon Aware Datacenters. (2022). https://doi.org/10.48550/ARXIV.2201.10036
- AnandTech (2018) AnandTech. 2018. The Snapdragon 845 - A Quick Recap. https://www.anandtech.com/show/12520/the-galaxy-s9-review/2
- Anandtech (2022a) Anandtech. 2022a. AMD Rome Second Generation EPYC Review: 2x 64-core Benchmarked. https://www.anandtech.com/show/14694/amd-rome-epyc-2nd-gen/4
- Anandtech (2022b) Anandtech. 2022b. The Intel Core i9-7980XE and Core i9-7960X CPU Review Part 1: Explaining the Jump to Using HCC Silicon. https://www.anandtech.com/show/11839/intel-core-i9-7980xe-and-core-i9-7960x-review/3
- Andrae and Edler (2015) Anders S. G. Andrae and Tomas Edler. 2015. On Global Electricity Usage of Communication Technology: Trends to 2030. Challenges 6, 1 (2015), 117–157. https://doi.org/10.3390/challe6010117
- Apple (2009) Apple. 2009. Apple iPhone 3G Environmental report. https://www.apple.com/environment/pdf/products/archive/2009/iPhone-3G-Environmental-Report.pdf
- Apple (2022) Apple. 2022. Apple iPhone 14 Environmental report. https://www.apple.com/environment/pdf/products/iphone/iPhone_14_PER_Sept2022.pdf
- Badrinarayanan et al. (2017) Vijay Badrinarayanan, Alex Kendall, and Roberto Cipolla. 2017. SegNet: A Deep Convolutional Encoder-Decoder Architecture for Image Segmentation. IEEE Transactions on Pattern Analysis and Machine Intelligence 39, 12 (2017), 2481–2495. https://doi.org/10.1109/TPAMI.2016.2644615
- Barroso and Hölzle (2007) Luiz André Barroso and Urs Hölzle. 2007. The Case for Energy-Proportional Computing. Computer 40, 12 (2007), 33–37. https://doi.org/10.1109/MC.2007.443
- Bhat et al. (2021) Goutam Bhat, Martin Danelljan, Luc Van Gool, and Radu Timofte. 2021. Deep Burst Super-Resolution. https://doi.org/10.48550/ARXIV.2101.10997
- Blake et al. (2010) Geoffrey Blake, Ronald G. Dreslinski, Trevor Mudge, and Krisztián Flautner. 2010. Evolution of Thread-Level Parallelism in Desktop Applications. In Proceedings of the 37th Annual International Symposium on Computer Architecture (Saint-Malo, France) (ISCA ’10). Association for Computing Machinery, New York, NY, USA, 302–313. https://doi.org/10.1145/1815961.1816000
- Boyd (2011) Sarah B Boyd. 2011. Life-cycle assessment of semiconductors. Springer Science & Business Media.
- Chang et al. (2012) Jichuan Chang, Justin Meza, Parthasarathy Ranganathan, Amip Shah, Rocky Shih, and Cullen Bash. 2012. Totally Green: Evaluating and Designing Servers for Lifecycle Environmental Impact. SIGPLAN Not. 47, 4 (mar 2012), 25–36. https://doi.org/10.1145/2248487.2150980
- cpu world (2022) cpu world. 2022. CPU World. https://www.cpu-world.com/index.html
- de Vries (2005) D.K. de Vries. 2005. Investigation of gross die per wafer formulas. IEEE Transactions on Semiconductor Manufacturing 18, 1 (2005), 136–139. https://doi.org/10.1109/TSM.2004.836656
- Eeckhout (2022) Lieven Eeckhout. 2022. A First-Order Model to Assess Computer Architecture Sustainability. IEEE Computer Architecture Letters (2022), 1–4. https://doi.org/10.1109/LCA.2022.3217366
- Flautner et al. (2000) Kristián Flautner, Rich Uhlig, Steve Reinhardt, and Trevor Mudge. 2000. Thread-Level Parallelism and Interactive Performance of Desktop Applications. In Proceedings of the Ninth International Conference on Architectural Support for Programming Languages and Operating Systems (Cambridge, Massachusetts, USA) (ASPLOS IX). Association for Computing Machinery, New York, NY, USA, 129–138. https://doi.org/10.1145/378993.379233
- Freitag et al. (2021) Charlotte Freitag, Mike Berners-Lee, Kelly Widdicks, Bran Knowles, Gordon Blair, and Adrian Friday. 2021. The climate impact of ICT: A review of estimates, trends and regulations. https://doi.org/10.48550/ARXIV.2102.02622
- Gao et al. (2015) Cao Gao, Anthony Gutierrez, Madhav Rajan, Ronald G. Dreslinski, Trevor Mudge, and Carole-Jean Wu. 2015. A study of mobile device utilization. In 2015 IEEE International Symposium on Performance Analysis of Systems and Software (ISPASS). 225–234. https://doi.org/10.1109/ISPASS.2015.7095808
- Garcia Bardon et al. (2020) M. Garcia Bardon, P. Wuytens, L.-Å. Ragnarsson, G. Mirabelli, D. Jang, G. Willems, A. Mallik, A. Spessot, J. Ryckaert, and B. Parvais. 2020. DTCO including Sustainability: Power-Performance-Area-Cost-Environmental score (PPACE) Analysis for Logic Technologies. In 2020 IEEE International Electron Devices Meeting (IEDM). 41.4.1–41.4.4. https://doi.org/10.1109/IEDM13553.2020.9372004
- Google (2022) Google. 2022. Perfetto. https://perfetto.dev/
- Group (2022) Synergy Research Group. 2022. Pipeline of Over 300 New Hyperscale Data Centers Drives Healthy Growth Forecasts. https://www.srgresearch.com/articles/pipeline-of-over-300-new-hyperscale-data-centers-drives-healthy-growth-forecasts
- Gröger et al. (2021) J. Gröger, R. Liu, L. Stobbe, J. Druschke, and N. Richter. 2021. Green Cloud Computing. Technical Report. https://www.umweltbundesamt.de/sites/default/files/medien/5750/publikationen/2021-06-17_texte_94-2021_green-cloud-computing.pdf
- Gupta et al. (2022) Udit Gupta, Mariam Elgamal, Gage Hills, Gu-Yeon Wei, Hsien-Hsin S. Lee, David Brooks, and Carole-Jean Wu. 2022. ACT: Designing Sustainable Computer Systems with an Architectural Carbon Modeling Tool. In Proceedings of the 49th Annual International Symposium on Computer Architecture. Association for Computing Machinery, New York, NY, USA. https://doi.org/10.1145/3470496.3527408
- Gupta et al. (2021) U. Gupta, Y. Kim, S. Lee, J. Tse, H. S. Lee, G. Wei, D. Brooks, and C. Wu. 2021. Chasing Carbon: The Elusive Environmental Footprint of Computing. In 2021 IEEE International Symposium on High-Performance Computer Architecture (HPCA). IEEE Computer Society, Los Alamitos, CA, USA, 854–867. https://doi.org/10.1109/HPCA51647.2021.00076
- He et al. (2015) Kaiming He, Xiangyu Zhang, Shaoqing Ren, and Jian Sun. 2015. Deep Residual Learning for Image Recognition. CoRR abs/1512.03385 (2015). arXiv:1512.03385 http://arxiv.org/abs/1512.03385
- Huzaifa et al. (2021) Muhammad Huzaifa, Rishi Desai, Samuel Grayson, Xutao Jiang, Ying Jing, Jae Lee, Fang Lu, Yihan Pang, Joseph Ravichandran, Finn Sinclair, Boyuan Tian, Hengzhi Yuan, Jeffrey Zhang, and Sarita V. Adve. 2021. Exploring Extended Reality with ILLIXR: A new Playground for Architecture Research. arXiv:2004.04643 [cs.DC]
- Jain and Wullert (2002) Ravi Jain and John Wullert. 2002. Challenges: Environmental Design for Pervasive Computing Systems. In Proceedings of the 8th Annual International Conference on Mobile Computing and Networking (Atlanta, Georgia, USA) (MobiCom ’02). Association for Computing Machinery, New York, NY, USA, 263–270. https://doi.org/10.1145/570645.570678
- Jones et al. (2013a) Alex K. Jones, Yiran Chen, William O. Collinge, Haifeng Xu, Laura A. Schaefer, Amy E. Landis, and Melissa M. Bilec. 2013a. Considering fabrication in sustainable computing. In 2013 IEEE/ACM International Conference on Computer-Aided Design (ICCAD). 206–210. https://doi.org/10.1109/ICCAD.2013.6691120
- Jones et al. (2013b) Alex K. Jones, Liang Liao, William O. Collinge, Haifeng Xu, Laura A. Schaefer, Amy E. Landis, and Melissa M. Bilec. 2013b. Green computing: A life cycle perspective. In 2013 International Green Computing Conference Proceedings. 1–6. https://doi.org/10.1109/IGCC.2013.6604497
- Keepios et al. (2022) Keepios, We Are Social, and HootSuite. 2022. DIGITAL 2022: GLOBAL OVERVIEW REPORT. https://www.slideshare.net/DataReportal/digital-2022-global-overview-report-january-2022-v05
- Kline et al. (2019) Donald Kline, Nikolas Parshook, Xiaoyu Ge, Erik Brunvand, Rami Melhem, Panos K. Chrysanthis, and Alex K. Jones. 2019. GreenChip: A tool for evaluating holistic sustainability of modern computing systems. Sustainable Computing: Informatics and Systems 22 (2019), 322–332. https://doi.org/10.1016/j.suscom.2017.10.001
- Li et al. (2021) Zhaoshuo Li, Wei Ye, Dilin Wang, Francis X. Creighton, Russell H. Taylor, Ganesh Venkatesh, and Mathias Unberath. 2021. Temporally Consistent Online Depth Estimation in Dynamic Scenes. https://doi.org/10.48550/ARXIV.2111.09337
- Mueller et al. (2017) Franziska Mueller, Dushyant Mehta, Oleksandr Sotnychenko, Srinath Sridhar, Dan Casas, and Christian Theobalt. 2017. Real-Time Hand Tracking under Occlusion from an Egocentric RGB-D Sensor. In 2017 IEEE International Conference on Computer Vision (ICCV). IEEE. https://doi.org/10.1109/iccv.2017.131
- Murphy (1964) B.T. Murphy. 1964. Cost-size optima of monolithic integrated circuits. Proc. IEEE 52, 12 (1964), 1537–1545. https://doi.org/10.1109/PROC.1964.3442
- Naffziger et al. (2021) Samuel Naffziger, Noah Beck, Thomas Burd, Kevin Lepak, Gabriel H. Loh, Mahesh Subramony, and Sean White. 2021. Pioneering Chiplet Technology and Design for the AMD EPYC™ and Ryzen™ Processor Families : Industrial Product. In 2021 ACM/IEEE 48th Annual International Symposium on Computer Architecture (ISCA). 57–70. https://doi.org/10.1109/ISCA52012.2021.00014
- Pandiyan et al. (2013) Dhinakaran Pandiyan, Shin-Ying Lee, and Carole-Jean Wu. 2013. Performance, energy characterizations and architectural implications of an emerging mobile platform benchmark suite - MobileBench. In 2013 IEEE International Symposium on Workload Characterization (IISWC). 133–142. https://doi.org/10.1109/IISWC.2013.6704679
- Quisbert-Trujillo et al. (2020) Ernesto Quisbert-Trujillo, Thomas Ernst, Karine Evrard Samuel, Emmanuelle Cor, and Elise Monnier. 2020. Lifecycle modeling for the eco design of the Internet of Things. Procedia CIRP 90 (2020), 97–101. https://doi.org/10.1016/j.procir.2020.02.120 27th CIRP Life Cycle Engineering Conference (LCE2020)Advancing Life Cycle Engineering : from technological eco-efficiency to technology that supports a world that meets the development goals and the absolute sustainability.
- Ragnarsson et al. (2022) L-Å Ragnarsson, M. Garcia Bardon, P. Wuytens, G. Mirabelli, D. Jang, G. Willems, A. Mallik, A. Spessot, J. Ryckaert, and B. Parvais. 2022. Environmental Impact of CMOS Logic Technologies. In 2022 6th IEEE Electron Devices Technology & Manufacturing Conference (EDTM). 82–84. https://doi.org/10.1109/EDTM53872.2022.9798208
- Ronneberger et al. (2015) Olaf Ronneberger, Philipp Fischer, and Thomas Brox. 2015. U-Net: Convolutional Networks for Biomedical Image Segmentation. https://doi.org/10.48550/ARXIV.1505.04597
- Sandler et al. (2018) Mark Sandler, Andrew Howard, Menglong Zhu, Andrey Zhmoginov, and Liang-Chieh Chen. 2018. MobileNetV2: Inverted Residuals and Linear Bottlenecks. In 2018 IEEE/CVF Conference on Computer Vision and Pattern Recognition. 4510–4520. https://doi.org/10.1109/CVPR.2018.00474
- software (2022) Passmark software. 2022. CPU Benchmarks. https://www.cpubenchmark.net/cpu_list.php
- Source (2022) Android Google Source. 2022. Simpleperf. https://android.googlesource.com/platform/system/extras/+/master/simpleperf/doc/README.md
- Sumbul et al. (2022) H. Ekin Sumbul, Tony F. Wu, Yuecheng Li, Syed Shakib Sarwar, William Koven, Eli Murphy-Trotzky, Xingxing Cai, Elnaz Ansari, Daniel H. Morris, Huichu Liu, Doyun Kim, Edith Beigne, Reality Labs, and Meta. 2022. System-Level Design and Integration of a Prototype AR/VR Hardware Featuring a Custom Low-Power DNN Accelerator Chip in 7nm Technology for Codec Avatars. In 2022 IEEE Custom Integrated Circuits Conference (CICC). 01–08. https://doi.org/10.1109/CICC53496.2022.9772810
- Sun et al. (2019) Ke Sun, Bin Xiao, Dong Liu, and Jingdong Wang. 2019. Deep High-Resolution Representation Learning for Human Pose Estimation. In 2019 IEEE/CVF Conference on Computer Vision and Pattern Recognition (CVPR). 5686–5696. https://doi.org/10.1109/CVPR.2019.00584
- Szegedy et al. (2015) Christian Szegedy, Wei Liu, Yangqing Jia, Pierre Sermanet, Scott Reed, Dragomir Anguelov, Dumitru Erhan, Vincent Vanhoucke, and Andrew Rabinovich. 2015. Going deeper with convolutions. In 2015 IEEE Conference on Computer Vision and Pattern Recognition (CVPR). 1–9. https://doi.org/10.1109/CVPR.2015.7298594
- TechCenturion (2020) TechCenturion. 2020. Snapdragon Processors Ranking & Full List. https://www.techcenturion.com/snapdragon-processors-ranking-and-list
- TechInsights (2018) TechInsights. 2018. Samsung Galaxy S9 Teardown. https://www.techinsights.com/blog/samsung-galaxy-s9-teardown
- Techpowerup (2022) Techpowerup. 2022. CPU Specs Database. https://www.techpowerup.com/cpu-specs/
- Teehan and Kandlikar (2013) Paul Teehan and Milind Kandlikar. 2013. Comparing Embodied Greenhouse Gas Emissions of Modern Computing and Electronics Products. Environmental Science & Technology 47, 9 (2013), 3997–4003. https://doi.org/10.1021/es303012r
- Toisoul et al. (2021) Antoine Toisoul, Jean Kossaifi, Adrian Bulat, Georgios Tzimiropoulos, and Maja Pantic. 2021. Estimation of continuous valence and arousal levels from faces in naturalistic conditions. In Nature Machine Intelligence. https://doi.org/10.1038/s42256-020-00280-0
- Wikichip (2022) Wikichip. 2022. WikiChip Semicconductor & Computer Engineering. https://en.wikichip.org/wiki/WikiChip
- Wu et al. (2022) Carole-Jean Wu, Ramya Raghavendra, Udit Gupta, Bilge Acun, Newsha Ardalani, Kiwan Maeng, Gloria Chang, Fiona Aga, Jinshi Huang, Charles Bai, Michael Gschwind, Anurag Gupta, Myle Ott, Anastasia Melnikov, Salvatore Candido, David Brooks, Geeta Chauhan, Benjamin Lee, Hsien-Hsin Lee, Bugra Akyildiz, Maximilian Balandat, Joe Spisak, Ravi Jain, Mike Rabbat, and Kim Hazelwood. 2022. Sustainable AI: Environmental Implications, Challenges and Opportunities. In Proceedings of Machine Learning and Systems, Vol. 4. 795–813.
- Yang et al. (2022) Lita Yang, Robert M. Radway, Yu-Hsin Chen, Tony F. Wu, Huichu Liu, Elnaz Ansari, Vikas Chandra, Subhasish Mitra, and Edith Beigné. 2022. Three-Dimensional Stacked Neural Network Accelerator Architectures for AR/VR Applications. IEEE Micro 42, 6 (2022), 116–124. https://doi.org/10.1109/MM.2022.3202254
- Young et al. (2022) Lucas D. Young, Fitsum A. Reda, Rakesh Ranjan, Jon Morton, Jun Hu, Yazhu Ling, Xiaoyu Xiang, David Liu, and Vikas Chandra. 2022. Feature-Align Network with Knowledge Distillation for Efficient Denoising. In 2022 IEEE/CVF Winter Conference on Applications of Computer Vision Workshops (WACVW). 709–718. https://doi.org/10.1109/WACVW54805.2022.00078