Spatial dynamics of synergistic coinfection in rock-paper-scissors models
Abstract
We investigate the spatial dynamics of two disease epidemics reaching a three-species cyclic model. Regardless of their species, all individuals are susceptible to being infected with two different pathogens, which spread through person-to-person contact. The occurrence of coinfection leads to a synergistic increase in the risk of hosts dying due to complications from either disease. Our stochastic simulations show that departed areas inhabited by hosts of a single pathogen arise from random initial conditions. The single-disease spatial domains are bordered by interfaces of coinfected hosts whose dynamics are curvature-driven. Our findings show that the coarsening dynamics of the interface network are controlled by the fluctuations of coinfection waves invading the single-disease territories. As the coinfection mortality grows, the dynamics of the interface network attain the scaling regime. We discover that organisms’ infection risk is maximised if the coinfection increases the death due to disease in , and minimised as the network dynamics reach the scaling regime, with species populations being maximum. Our conclusions may help ecologists understand the dynamics of epidemics and their impact on the stability of ecosystems.
1 Introduction
Spatial species distribution has been shown to be responsible for ecosystem formation and stability [1]. Because of this, much attention has been dedicated to understanding how the organisms’ spatial interactions affect biodiversity. For example, researchers have discovered that species coexistence may become possible if organisms’ competition happens locally, leading to the formation of departed spatial domains [2, 3]. This has been observed, for example, in experiments with three strains of Escherichia coli, whose cyclic dominance - described by the rock-paper-scissors game rules - is not sufficient to ensure the species’ persistence [4]. The same phenomenon has also been observed in other biological systems, like Californian coral reef invertebrates and lizards in the inner Coast Range of California, thus revealing the vital role space plays in promoting biodiversity [5, 6, 7].
Scientists have shown that behavioural strategies can minimise the individual risk of being contaminated by a viral disease transmitted person-to-person [8, 9, 10, 11]. For example, social distancing rules have been implemented worldwide, with individual and collective gains [12, 13, 14]. Furthermore, mobility restrictions have been shown efficient in decreasing the number of infected organisms and, consequently, minimising the social impact of epidemics on communities [15, 16, 17, 18]. However, to guarantee the maximum efficiency of these measures in protecting against disease contamination, they are subject to adjustments if mutation alters the predominant pathogen causing the epidemics [19]. The spatial organisation plasticity resulting from controlling the organisms’ dispersal may be fundamental to the improve the efficiency of mitigation strategies against the disease with changing transmissibility and mortality [20, 21, 22, 23, 24].
In recent years, there has been a growing interest in studying the impact of epidemic spreading on individual fitness and species extinction risk [25, 26]. The ongoing COVID-19 pandemic has prompted researchers from various fields to explore how self-preservation strategies employed by different species can inform human social interactions [27, 28]. Multiple studies have demonstrated that organisms can reduce their infection risk during local epidemic outbreaks by adopting specific behavioural strategies [8, 9, 10, 11]. These findings have inspired the implementation of mitigation tactics such as social distancing and mobility restrictions worldwide, aimed at protecting individuals and communities during the COVID-19 pandemic [12, 13, 14, 15, 16, 17, 18]. Such strategies have also proven effective in reducing the infection risk of organisms in spatial games featuring cyclic dominance [29, 30]. Furthermore, social distancing and mobility restrictions have also effectively reduced organisms’ infection risk in spatial games with a cyclic dominance [29, 30]. Maximised benefits are obtained when organisms are apt to adjust the strategies when the disease mortality and transmission are changed by an eventual pathogen mutation [31, 32].
Here, we study a cyclic model of three species whose dominance follows the rock-paper-scissors game rules, where organisms face two simultaneous disease epidemics. All individuals are susceptible to being infected with one of the pathogens or being coinfected - the diseases propagate person-to-person. Considering a synergistic increase in the mortality rate of the coinfected hosts, we explore the impact on pathogens’ coexistence and the effects on population dynamics [33, 34, 35, 36, 37, 38, 39, 40]. Our main goal is to decipher the complexity of the diseases’ spatial distribution and understand how synergistic coinfection mortality may lead to the extinction of pathogens. We aim to answer the questions: i) how do the pathogens are distributed in space?; ii) what are the conditions for both viruses to coexist?; iii) how do the viruses’ spatial dynamics affect organisms’ infection risk?; iv) how do the viruses’ spatial interactions impact the species populations?
The outline of this paper is as follows: in Sec. 2, we introduce our stochastic model and describe the simulations. The spatial patterns are investigated in Sec. 3. The theoretical prediction for the scaling exponent of the coarsening dynamics is demonstrated in Sec. 4. In Sec. 5, we address the role of coinfection-catalysed mortality in disease coexistence. Also, in Sec. 6, we study the effects of the diseases’ spatial distribution on organisms’ infection risk and species densities. Finally, our conclusions and discussions are highlighted in Sec. 7.
2 The stochastic model
We investigate the stochastic rock-paper-scissors model, where three species outcompete, obeying the rules: scissors cut paper, paper wraps rock, and rock crushes scissors. The species are denoted by , with , and the indentification , where is an integer. We simulate the occurrence of two simultaneous epidemics whose pathogens responsible for the diseases are transmissible person-to-person. Organisms of every species are equally susceptible to contamination with both pathogens independently, with coinfection being possible at any time. Once infected, an individual becomes sick, which may cause death; in the case of the organism’s health recovery, there is no immunity against reinfection. In the case of coinfection, the hosts’ debilitation is accelerated, with a synergistic mortality rate increase.
2.1 Simulations
We create stochastic simulations to investigate the effects of the spreading of two distinct disease epidemics in a cyclic spatial game. Our algorithm follows the May-Leonard implementation, which does not consider a conservation law for the total number of individuals [41]. The realisations run in square lattices with periodic boundary conditions; the maximum number of organisms is , the total number of grid points - at most, one individual is present at each grid site.
We define the density of individuals of species , , with , as the fraction of the lattice occupied by individuals of the species at time :
| (1) |
where is the total number of organisms of species at time .
To begin the simulation, we prepare random initial conditions by allocating each organism at a randomly chosen grid point. We assume that the initial density is the same for every species: , with ; the initial number of individuals is the maximum integer number that fits on the lattice, , with - the remaining grid sites are left empty in the initial state. Furthermore, for every species, the initial ratio of individuals contaminated by each pathogen is .
The notation specifies healthy individuals of species , with . Sick organisms with pathogens or are represented by and, respectively; indicates coinfected individuals. The notation stands for all individuals, irrespective of illness or health. Using this notation, we describe the stochastic interactions as:
-
1.
Selection: , with , where represents an empty space. After a selection interaction, the grid point previously occupied by the individual of species becomes an empty space.
-
2.
Reproduction: . A new individual of any species occupies an available empty space.
-
3.
Mobility: , where indicates either an individual of any species or an empty site. When moving, an organism switches position with another individual of any species or with an empty space.
-
4.
Infection by disease :
with . An organism of species infected with pathogen contaminated a healthy individual or a host of pathogen .
-
5.
Infection by disease :
with . An individual of species transmits the pathogen to a healthy individual or a host of pathogen .
-
6.
Cure of disease :
An individual cured from the illness caused by pathogen but becomes susceptible to reinfection with the same virus.
-
7.
Cure of disease :
An organism cured from disease may be become sick again after being cured.
-
8.
Death caused by disease :
When an ill individual dies because of the disease , the grid site becomes empty.
-
9.
Death due to disease :
A sick individual infected with pathogen may die, leaving its grid point empty.
The interaction stochasticity is defined by a set of probabilities, which is computed according to the parameters: (reproduction), (reproduction), (mobility), (pathogen transmissibility), (disease mortality), and (cure). In case of coinfected organism, pathogens transmission and mortality are rescaled by the factors and , respectively.
The actions are implemented using the Moore neighbourhood, where each organism may interact with one of its eight immediate neighbours. The algorithm proceeds as follows: i) randomly picking an active individual among all organisms in the lattice; ii) randomly choosing one interaction to be executed; iii) drawing one of the eight immediate neighbours to receive the action. One time step is counted if either an interaction is implemented. The time necessary for to occur is defined as one generation, our time unit.
3 Spatial patterns
We first investigate the spatial patterns arising from random initial conditions in the rock-paper-scissors model with two contagious diseases, considering a synergistic increase in the mortality rate of coinfected rates. For this purpose, we ran a single simulation in a lattice with starting from initial conditions for a timespan of generations, with , , , , and . This means coinfected individuals are twice as likely to die due to disease complications than sick organisms contaminated with a single disease.


To observe what happens during the simulation, we prepare three visualisations as follows:
- 1.
- 2.
- 3.
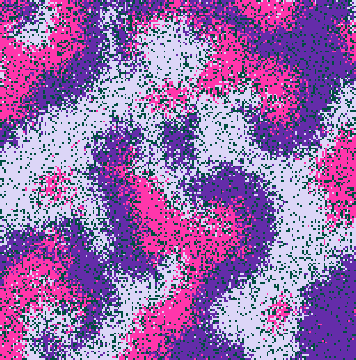
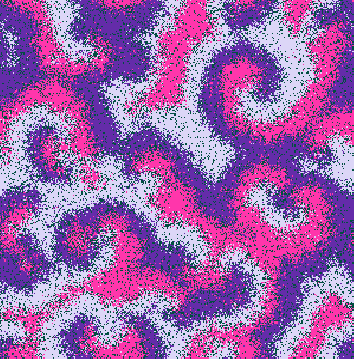
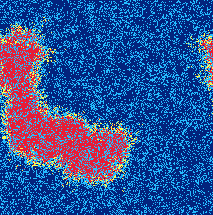
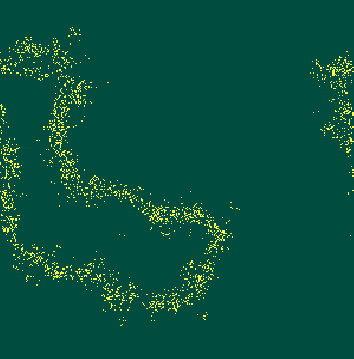
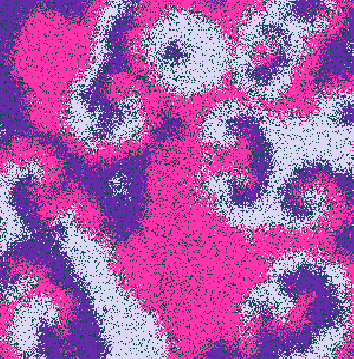
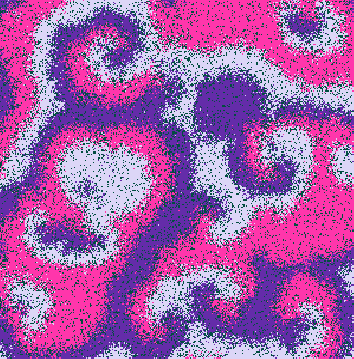
Videos https://youtu.be/k0LmZQmQtYg, https://youtu.be/hBsgxrjBU1U, and https://youtu.be/oujTTV9f3kU show the dynamics of the organisms’ spatial organisation, the disease distribution, and coinfected hosts, respectively, during the whole simulation. The snapshots in Fig. 1 were captured of the simulation at (Figs. 1(a), 1(f), and 1(k)), (Figs. 1(b), 1(g), and 1(l)), (Figs. 1(c), 1(h), and 1(m)), (Figs. 1(d), 1(i), and 1(n)), and (Figs. 1(e), 1(j), and 1(o)).
As we observe in Figs. 1(a) to 1(e), individuals of the same species occupy departed spatial domains after an initial stage of the pattern formation process. Because of the cyclic selection rules of the rock-paper-scissors game, spirals emerge from the random initial conditions. The outcomes show the spreading of both pathogens that initially separately infest only of individuals, thus leading to the coinfection of many hosts.
Since single-pathogen hosts survive longer than coinfected ones, there is a spontaneous arising of two kinds of spatial domains mostly occupied by sick individuals with disease (red) or illness (dark blue). Because of the spatial topology, coinfected individuals (yellow) concentrate in the interfaces on the borders between red and dark blue regions, as shown in Fig. 1(g) and highlighted in Fig. 1(l). As time passes, the total length of the interfaces of coinfected organisms reduces. Figures 1(h) to 1(j) show that the straightening minimises the size of the red area, resulting in its collapse. Therefore, the topological features of the two-dimensional space induce the extinction of one of the pathogens. The dynamics of the interface of coinfected individuals leading to the end of one disease are shown by the reduction and further disappearance of the yellow dots in Figs. 1(m) to 1(o).
3.1 Dynamics of species densities
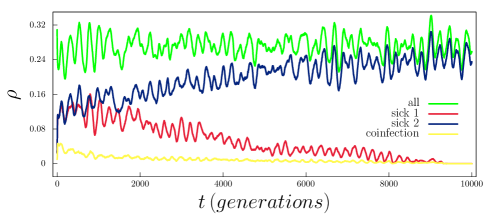
We also calculated the temporal dependence of the densities of organisms of each species during the entire simulation. The outcomes are shown in Fig. 2, where the green line shows the dynamics of the density of individuals of species . The red and dark blue lines depict the density of individuals of species contaminated with disease and , respectively; the yellow line shows the density of coinfected individuals of species . Our choice for presenting the outcomes of species is arbitrary since the symmetry of the rock-paper-scissors game with the assumption of the same parameters for all species results in the same average densities for every species.
Figure 2 shows two independent dynamics related to the cyclic spatial games and the epidemics. According to the green line, the temporal dependence of the species densities follows the symmetry inherent to the rock-paper-scissors game: alternating dominance with constant average density. Concerning the densities of hosts of each pathogen, the results show that the synergistic effects of coinfection provoke the increase in the average density of sick individuals infected with the virus (red) and, consequently, the reduction in the proportion of individuals of each species contaminated with the virus (dark blue). In addition, the yellow line depicts the decline in the density of coinfected individuals as the total length of the interface decreases.
4 Scaling Regime
In the previous section, we found that single-pathogen domains surrounded by interfaces mainly composed of coinfected organisms arise from random initial conditions. The interface network is similar to those which appear in systems of two species which directly compete for space or whose competition is apparent - induced by the presence of a common predator [42, 43, 44].
In our model, simultaneously contaminating an organism, there is a synergistic increase in disease severity. Therefore, the acceleration in coinfected organisms’ health depletion is the agent that breaks the spatial symmetry of the disease distribution, leading to each pathogen dominating departed areas. This means that the extinction of one of the diseases results from a coarsening process which leads some territories occupied by a single virus to grow, provoking the collapse of other single-disease domains [42, 44].
Based on the topological aspects of two-dimensional space, we investigate the dynamics of pathogens’ spatial distribution considering an interface with curvature radius and thickness , separating two distinct single-prey domains. Suppose organisms infected with virus are outside the interface while disease provoked by pathogen occupies the inner region. The interface comprises coinfected organisms transmitting the diseases in both directions, reaching immediate organisms outside and inside the interface. Thus, the transmission of pathogen can affect a number of hosts of pathogen that is proportional to the outer interface length: . Also, the number of individuals vulnerable to being infected with is proportional to the inner interface length, which is proportional to .
As the transmission of pathogens and occurs at the same rate, the difference between the average number of newly coinfected organisms per unit of times from outside and inside the interface is proportional to . This means that the time necessary for all organisms to become coinfected inside the interface is shorter than for all individuals outside the interface. The consequence is that, as time passes, one has a reduction of the interface curvature radius and the consequent collapse of closed interfaces.


We then conclude that the time necessary for the radius of a circular single-disease area reduces by is proportional to the interface length, i.e., proportional to . Hence, the dynamics of the interface network are curvature-driven: the speed of the collapse of single-pathogen spatial domains is proportional to its curvature, which is inherent to non-relativistic interfaces in condensed matter [45, 46].
4.1 Scaling power law
The characteristic length of the coinfection interface network at time using is defined as
| (2) |
where is the total grid area (the total number of grid points ) and is the number of single-pathogen domains in the time . As the dynamics of the interface network are curvature-driven, the number of single-pathogen spatial domains decreases as time passes [42, 44]:
| (3) |
where is a positive constant. Hence, the characteristic length grows following the scaling law
| (4) |
which describes the dynamics of the coinfection interface networks (yellow dots in Figs. 1(l) to 1(m)).
Furthermore, using the notation to represent the total number of coinfected individuals, one has where is total interface length and the interface thickness. As the average interface thickness is constant in time and space (since the parameters used in the stochastic simulations do not vary in space and time [47]), one has
| (5) |
We also notice that the number of single-prey domains is given by
| (6) |
where is the average domain perimeter. Given that the average domain radius defines the network characteristic length , one has
| (7) |
which allows Eq. 6 to be written as
| (8) |
Combining Eqs. 2 and 8, one has
| (9) |
Finally, substituting Eq. 4 in Eq. 9, we find the scaling power law that characterises the dynamics of the interface networks in our two-pathogen model competition model as
| (10) |
We verified the analytical prediction of the scaling law given by Eq. 10, using the outcomes of a set of simulations starting from different initial conditions. The realisations ran in lattices with sites, with a timespan of generations - the parameters are the same as in the simulation in Fig. 1. Given that each simulation started from different random initial conditions, we computed the average scaling exponent fitting the dynamics of the total number of coinfected individuals using the function . We have not considered the first generations to calculate the scaling exponent to avoid the transient interface network formation fluctuations observed in Fig.2. We found that , close to the theoretical prediction in Eq. 10. This confirms that the dynamics of the coinfected interface network approach the expected scaling regime; the deviation is due to grid size finiteness [42].
5 The impact of synergistic mortality on the coarsening dynamics
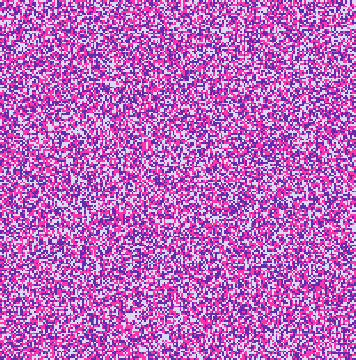
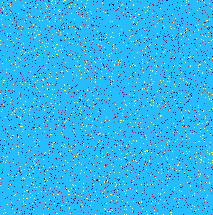
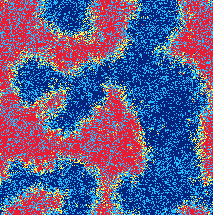
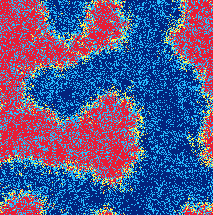
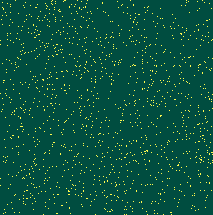
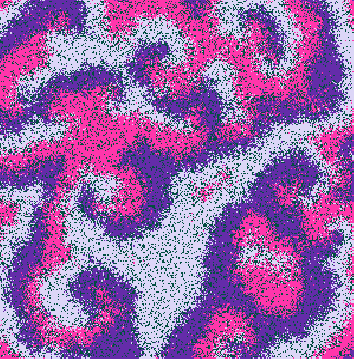
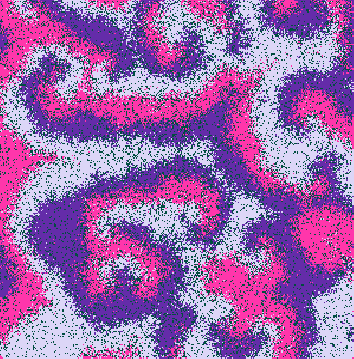
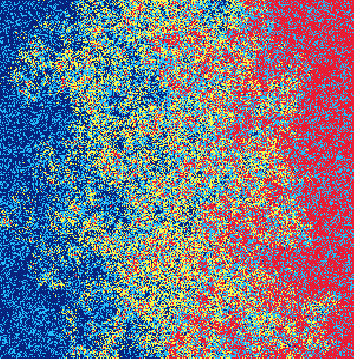
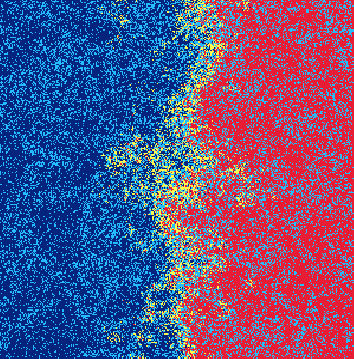
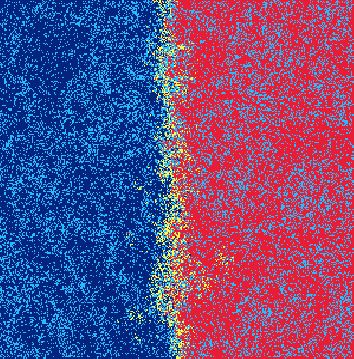
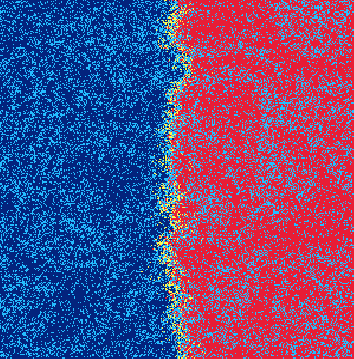
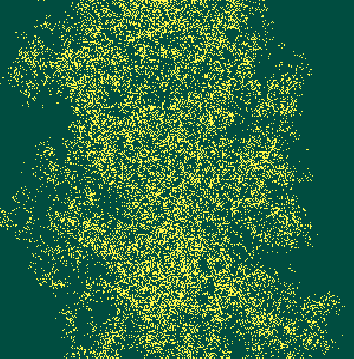
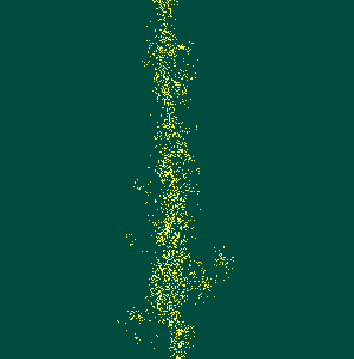
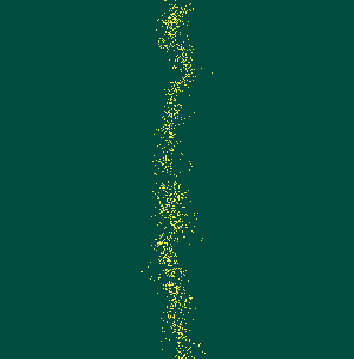
We now study the influence of the synergistic mortality factor, , on the pattern formation process and the coarsening dynamics of the single-pathogen domains. For this purpose, we prepare the initial conditions shown in Figs. 3(a), 3(f) and 3(k): i) organisms of every species are randomly allocated on the lattice (the number of individuals of each is the same); ii) on the left side, all individuals host the pathogen (red); on the right side, all organisms are infected with pathogen (red); iii) there is no coinfected individual in the initial conditions.
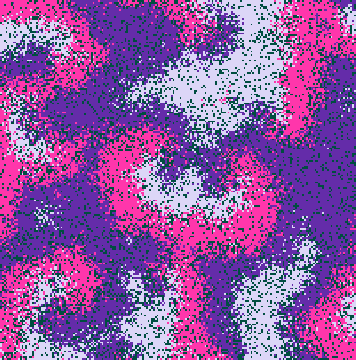
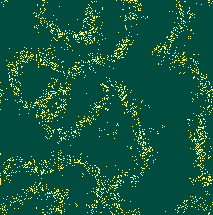
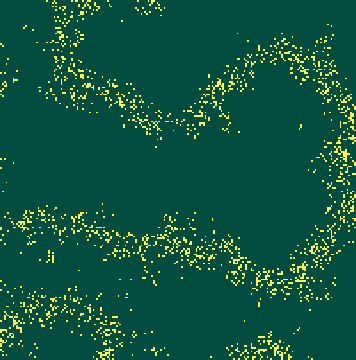
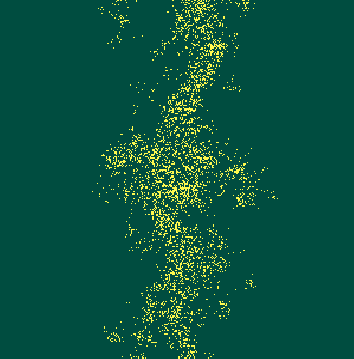
We performed four simulations assuming different synergistic mortality factors and captured the spatial configuration after generations: i) : Figs. 3(b), 3(g), and 3(l); ii) : Figs. 3(c), 3(h), and 3(m); iii) : Figs. 3(d), 3(i), and 3(n); iv) : Figs. 3(e), 3(j), and 3(o). We used lattices with grid sites; the other parameters are the same as in the previous simulations. We relaxed the periodic boundary to observe the dynamics of a central vertical interface, assuming a lattice with fixed edges.
As in Figure 1, the spatial patterns show spiral waves whose dynamics are controlled by rock-paper-scissors rules, not being relevantly affected by the mortality acceleration of coinfected individuals, as one observes in Figs. 1(b) to 1(e). On the other hand, the level of mortality of coinfected hosts controls the stability of the central interface. In summary,
-
1.
Organisms on the border are easily infected by the virus spreading from the opposite spatial domain. Thus, an interface of yellow dots appears after the simulation begins.
- 2.
-
3.
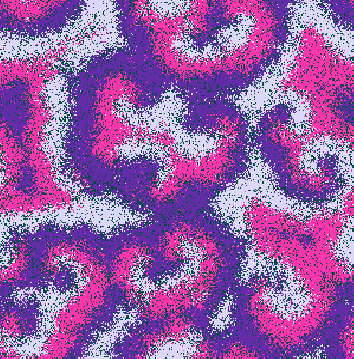
As grows, the chances of organisms that become coinfected on the border moving toward the interior of the red and dark blue regions reduce. This happens because a fraction of them die before transmitting the pathogens. Figures 3(h) and 3(m) show that for , coinfection waves stochastically propagate toward single-disease regions but disappear when organisms die. For , the probability of coinfection reaching individuals distant from the interface reduces, as shown in Figs. 3(i) and 3(n).
-
4.
Finally, the outcomes show that for - where mortality is twice likely for coinfected hosts - the chances of the virus spreading in the opposite spatial domains significantly reduce. In this case, coinfection waves quickly stop propagating into the single-disease domains due to the high probability of death of coinfected individuals.
We then quantify how the propagation of coinfection waves into the single-disease domains interferes with the coarsening dynamics predicted in the previous section. To achieve this goal, we ran sets of simulations for various values of starting from random initial conditions. The simulations were performed in lattices with sites, running until generations, for , in intervals of .
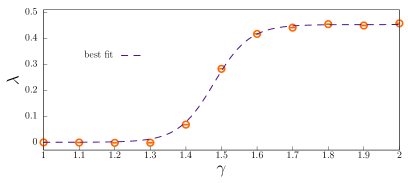
To measure the scaling exponent, we assume a generalised version of Eq. 10 as
| (11) |
where is a function of the synergistic mortality factor.
Figure 4 shows the average scaling exponent value, where the error bars show the standard deviations. The results confirm that for low , the coarsening dynamics depart from a curvature-driven scenario, with the scaling exponent indicating that the pathogens coexist. For , our findings show that the number of coinfected individuals is approximately constant in time. In contrast, for , the coarsening dynamics approaches the scaling regime predicted in Eq. 10 since the high mortality rate of coinfected individuals reduces the impact of the fluctuations.
Therefore, as the coinfection becomes deadly ( grows), there is a crossover from the coexistence regime () and the interface network coarsening (). We found the best fit to describe the dependence of the scaling exponent on the synergistic mortality factor:
where and , as depicted by the dashed purple line in Fig. 4.
We then conclude that the higher the coinfection mortality is, the less the dynamics of the spatial patterns are affected by the noise introduced by waves spreading through the single-pathogen species observed in Fig. 3. This is similar to the thermal fluctuations that roughen the interfaces, thus opposing the curvature-driven growth and decelerating the two-dimensional coarsening dynamics [48, 49, 50, 51, 52, 53].
6 Influence of synergistic mortality at individual and population levels
Finally, we investigate the influence of synergistic mortality factors on organisms’ infection risk and population dynamics. For this reason, we ran sets of simulations starting from different initial conditions in lattices with grid lattices running until generations. We conduct simulations for , in intervals of ; the other parameters are the same as in the previous sections.
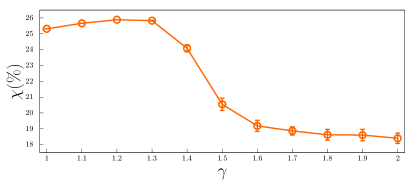
We define the infection risk, , as the probability of a healthy individual being infected by one of the pathogens per unit of time, respectively. For this purpose, the algorithm proceeds as follows: i) counting the total number of healthy individuals of species when each generation begins; ii) computing the number of healthy individuals of species that are contaminated (virus or virus ) during the generation; iii) calculating the infection risk , with , defined as the ratio between the number of infected individuals and the initial number of healthy individuals of species .
In addition, we compute the average value of the density of organisms of species , . Due to the symmetry of the rock-paper-scissors game, the results are the same for every species; thus, we use the data from species to compute and . The statistical analyses avoided the high fluctuations inherent to the pattern formation process: we calculate the mean infection risk and species densities using the data from the second simulation half.
Figures 5 and 6 show the organisms’ infection risk and species density dependence in the synergistic mortality factor . The outcomes reveal that the organisms’ infection risk reaches its maximum if coinfection mortality increases in . Thus, the proportion of individuals dying due to complications of species or is the highest for , resulting in the minimum species density, as shown in Fig. 6. For , is strongly reduced because of the reduction of the interface fluctuations, as shown in Fig. 3. The variation of becomes then smooth for . Therefore the growth in the species densities is more significant for .

7 Discussion and Conclusions
Our research addresses the spatial dynamics of two contagious disease epidemics spreading person-to-person in a cyclic model with three species. As the pathogen transmission happens independently, they may infect the same organism at any time. When coinfection happens, there is a synergistic rise in the probability of death because of complications of one of the diseases.
Our stochastic simulations revealed the role played by the synergistic mortality factor in population dynamics. If the diseases’ severity is not significantly altered (), both disease simultaneously affects almost all individuals in the grid, meaning that pathogens coexist, with the average number of coinfected individuals constant during the simulation. As the diseases become more severe, individuals infected with only one of the pathogens live longer, creating departed single-disease spatial domains bordered by interfaces mainly formed by coinfected individuals. In this limit, the dynamics of the interface network are curvature-driven, with the total number of coinfected individuals approaching the following scaling law .
The dynamics of pathogens’ spatial distribution impact organisms’ safety, provoking a rise in infection risk, reaching the maximum for an increase in disease severity of . Because of this, the average densities of individuals of each species reaches the lowest for . In contrast, for , coinfected individuals’ synergistic death rate accelerates, weakening the viruses’ transmission chain, thus, significantly reducing the organisms’ infection risk. Therefore, we show evidence that, in a two-disease model, the extinction of one of the pathogens results from the topological aspects of two-dimensional space. The spontaneous symmetry breaking caused by the interactions’ stochasticity defines how the synergistic mortality increase leads to eradicating one of the diseases.
Our model can be generalised for more complex models of more than two diseases caused by distinct pathogens dominating departed spatial domains. We may assume different symmetries for the diseases’ transmissibility and mortality parameters which result in diverse topological patterns in two-dimensional space simulations. As shown in other direct and apparent competition models, the pathogens may occupy patches forming separated by interfaces with -type junctions or string networks [42, 43, 44, 54, 55, 56, 57, 58]. The outcomes may help ecologists to understand the dynamics of epidemics and the role of space topology in organisms’ infection risk and disease eradication.
Acknowledgments
We thank CNPq, ECT, Fapern, and IBED for financial and technical support.
References
- [1] M. Begon, C. R. Townsend, J. L. Harper, Ecology: from individuals to ecosystems, Blackwell Publishing, Oxford, 2006.
- [2] B. Kerr, M. A. Riley, M. W. Feldman, B. J. M. Bohannan, Local dispersal promotes biodiversity in a real-life game of rock–paper–scissors, Nature 418 (2002) 171.
- [3] R. Durret, S. Levin, Allelopathy in spatially distributed populations, J. Theor. Biol. 185 (1997) 165–171.
- [4] B. C. Kirkup, M. A. Riley, Antibiotic-mediated antagonism leads to a bacterial game of rock-paper-scissors in vivo, Nature 428 (2004) 412–414.
- [5] B. Sinervo, C. M. Lively, The rock-scissors-paper game and the evolution of alternative male strategies, Nature 380 (1996) 240–243.
- [6] J. B. C. Jackson, L. Buss, The rock-scissors-paper game and the evolution of alternative male strategies, Proc. Natl Acad. Sci. USA 72 (1975) 5160–5163.
- [7] S. Islam, A. Mondal, M. Mobilia, S. Bhattacharyya, C. Hens, Effect of mobility in the rock-paper-scissor dynamics with high mortality, Phys. Rev. E 105 (2022) 014215.
- [8] E. Du, E. Chen, J. Liu, C. Zheng, How do social media and individual behaviors affect epidemic transmission and control?, Science of The Total Environment 761 (2021) 144114.
- [9] A. M. Dunn, M. E. Torchin, M. J. Hatcher, P. M. Kotanen, D. M. Blumenthal, J. E. Byers, C. A. Coon, V. M. Frankel, R. D. Holt, R. A. Hufbauer, A. R. Kanarek, K. A. Schierenbeck, L. M. Wolfe, S. E. Perkins, Indirect effects of parasites in invasions, Functional Ecology 26 (6) (2012) 1262–1274.
- [10] M. J. Young, N. H. Fefferman, The dynamics of disease mediated invasions by hosts with immune reproductive tradeoff, Scientific Reports 12 (2022) 4108.
- [11] T. Nagatani, G. Ichinose, K. ichi Tainaka, Epidemics of random walkers in metapopulation model for complete, cycle, and star graphs, Journal of Theoretical Biology 450 (2018) 66–75.
- [12] T. C. Reluga, Game theory of social distancing in response to an epidemic, PLoS Comput. Biol. 6 (5) (2010) e1000793.
- [13] S. Stockmaier, N. Stroeymeyt, S. E. C., H. D. M., L. A. Meyers, D. I. Bolnick, Infectious diseases and social distancing in nature, Science 371 (6533) (2021) eabc8881.
- [14] S. Stockmaier, N. Stroeymeyt, E. C. Shattuck, D. M. Hawley, L. A. Meyers, D. I. Bolnick, Infectious diseases and social distancing in nature, Science 371 (6533) eabc8881.
- [15] G. Dimarco, G. Toscani, M. Zanella, Optimal control of epidemic spreading in the presence of social heterogeneity, Philosophical Transactions of the Royal Society A: Mathematical, Physical and Engineering Sciences 380 (2224) (2022) 20210160.
- [16] Q. Shao, D. Han, Epidemic spreading in metapopulation networks with heterogeneous mobility rates, Applied Mathematics and Computation 412 (2022) 126559.
- [17] P. Edsberg Møllgaard, S. Lehmann, L. Alessandretti, Understanding components of mobility during the covid-19 pandemic, Philosophical Transactions of the Royal Society A: Mathematical, Physical and Engineering Sciences 380 (2214) (2022) 20210118.
- [18] T. Oka, W. Wei, D. Zhu, The effect of human mobility restrictions on the covid-19 transmission network in china, PLOS ONE 16 (7) (2021) 1–16.
- [19] To restrict or not to restrict? use of artificial neural network to evaluate the effectiveness of mitigation policies: A case study of turkey, Chaos, Solitons & Fractals 151 (2021) 111246.
- [20] N. Stroeymeyt, A. V. Grasse, A. Crespi, D. P. Mersch, S. Cremer, L. Keller, Social network plasticity decreases disease transmission in a eusocial insect, Science 362 (6417) (2018) 941–945.
- [21] V. Papanikolaou, A. Chrysovergis, V. Ragos, E. Tsiambas, S. Katsinis, A. Manoli, S. Papouliakos, D. Roukas, S. Mastronikolis, D. Peschos, A. Batistatou, E. Kyrodimos, N. Mastronikolis, From delta to omicron: S1-rbd/s2 mutation/deletion equilibrium in sars-cov-2 defined variants, Gene 814 (2022) 146134.
- [22] M. Becerra-Flores, T. Cardozo, Sars-cov-2 viral spike g614 mutation exhibits higher case fatality rate, International Journal of Clinical Practice 74 (8) (2020) e13525.
- [23] H. M. Zawbaa, H. Osama, A. El-Gendy, H. Saeed, H. S. Harb, Y. M. Madney, M. Abdelrahman, M. Mohsen, A. M. A. Ali, M. Nicola, M. O. Elgendy, I. A. Ibrahim, M. E. A. Abdelrahim, Effect of mutation and vaccination on spread, severity, and mortality of covid-19 disease, Journal of Medical Virology 94 (1) (2022) 197–204.
- [24] A. Bridier, P. C. Piard, J-C. and, S. Labarthe, F. Dubois-Brissonnet, R. Briandet, Spatial organization plasticity as an adaptive driver of surface microbial communities, Front. Microbiol 8 (2017) 1364.
- [25] F. M. Snowden, Epidemics and society: from the black death to the present, Yale University Press, New Haven and London, 2019.
- [26] J. Tanimoto, Sociophysics Approach to Epidemics, Springer,, Singapore, 2021.
- [27] R. Pastor-Satorras, C. Castellano, P. Van Mieghem, A. Vespignani, Epidemic processes in complex networks, Rev. Mod. Phys. 87 (2015) 925–979.
- [28] G. Bonaccorsi, F. Pierri, M. Cinelli, A. Flori, A. Galeazzi, F. Porcelli, A. L. Schmidt, C. M. Valensise, A. Scala, W. Quattrociocchi, F. Pammolli, Economic and social consequences of human mobility restrictions under covid-19, Proceedings of the National Academy of Sciences 117 (27) (2020) 15530–15535.
- [29] E. Rangel, B. Moura, J. Menezes, Combination of survival movement strategies in cyclic game systems during an epidemic, Biosystems 217 (2022) 104689.
- [30] J. Menezes, B. Moura, E. Rangel, Adaptive survival movement strategy to local epidemic outbreaks in cyclic models, Journal of Physics: Complexity 3 (4) (2022) 045008.
- [31] Spatial organisation plasticity reduces disease infection risk in rock–paper–scissors models, Biosystems 221 (2022) 104777.
- [32] J. Menezes, B. Ferreira, E. Rangel, B. Moura, Adaptive altruistic strategy in cyclic models during an epidemic, Europhysics Letters 140 (5) (2022) 57001.
- [33] P. Nicholson, N. Mon-on, P. Jaemwimol, P. Tattiyapong, W. Surachetpong, Coinfection of tilapia lake virus and aeromonas hydrophila synergistically increased mortality and worsened the disease severity in tilapia (oreochromis spp.), Aquaculture 520 (2020) 734746.
- [34] M. Chapwanya, A. Matusse, Y. Dumont, On synergistic co-infection in crop diseases. the case of the maize lethal necrosis disease, Applied Mathematical Modelling 90 (2021) 912–942.
- [35] T. Yan, S. Zhu, H. Wang, C. Li, Y. Diao, Y. Tang, Synergistic pathogenicity in sequential coinfection with fowl adenovirus type 4 and avian orthoreovirus, Veterinary Microbiology 251 (2020) 108880.
- [36] S. TELFER, R. BIRTLES, M. BENNETT, X. LAMBIN, S. PATERSON, M. BEGON, Parasite interactions in natural populations: insights from longitudinal data, Parasitology 135 (7) (2008) 767–781.
- [37] M. Singer, N. Bulled, B. Ostrach, E. Mendenhall, Syndemics and the biosocial conception of health, The Lancet 389 (10072) (2017) 941–950.
- [38] J. C. Kash, K.-A. Walters, A. S. Davis, A. Sandouk, L. M. Schwartzman, B. W. Jagger, D. S. Chertow, L. Qi, R. E. Kuestner, A. Ozinsky, J. K. Taubenberger, Lethal synergism of 2009 pandemic h1n1 influenza virus and streptococcus pneumoniae coinfection is associated with loss of murine lung repair responses, mBio 2 (5) (2011) e00172–11.
- [39] C. Yin, W. Yang, J. Meng, Y. Lv, J. Wang, B. Huang, Co-infection of pseudomonas aeruginosa and stenotrophomonas maltophilia in hospitalised pneumonia patients has a synergic and significant impact on clinical outcomes, European Journal of Clinical Microbiology & Infectious Diseases 36 (11) (2017) 2231–2235.
- [40] V. Andreasen, A. Pugliese, Pathogen coexistence induced by density-dependent host mortality, Journal of Theoretical Biology 177 (2) (1995) 159–165.
- [41] R. M. May, W. J. Leonard, Nonlinear aspects of competition between three species, SIAM J. Appl. Math. 29 (1975) 243–253.
- [42] P. P. Avelino, D. Bazeia, L. Losano, J. Menezes, von neummann’s and related scaling laws in rock-paper-scissors-type games, Phys. Rev. E 86 (2012) 031119.
- [43] T. A. Pereira, J. Menezes, L. Losano, Interface networks in models of competing species, Intern. J. of Mod., Sim. and Sci. Comp. 9 (2018) 1850046.
- [44] J. Menezes, B. Moura, Pattern formation and coarsening dynamics in apparent competition models, Chaos, Solitons & Fractals 157 (2022) 111903.
- [45] P. Avelino, J. Oliveira, C. Martins, Understanding domain wall network evolution, Physics Letters B 610 (1) (2005) 1–8.
- [46] P. P. Avelino, R. Menezes, J. C. R. E. Oliveira, Unified paradigm for interface dynamics, Phys. Rev. E 83 (2011) 011602.
- [47] A. Roman, D. Konrad, M. Pleimling, Cyclic competition of four species: domains and interfaces, J. Stat. Mech. 7 (2012) P07014.
- [48] L. F. Cugliandolo, Topics in coarsening phenomenai, Physica A 389 (2010) 4360–4373.
- [49] A. Sicilia, J. J. Arenzon, A. J. Bray, L. F. Cugliandolo, Domain growth morphology in curvature-driven two-dimensional coarsening, Phys. Rev. E 76 (2007) 061116.
- [50] P. Roy, P. Sen, Interplay of interfacial noise and curvature-driven dynamics in two dimensions, Phys. Rev. E 95 (2017) 020101.
- [51] M. P. O. Loureiro, J. J. Arenzon, L. F. Cugliandolo, A. Sicilia, Curvature-driven coarsening in the two-dimensional potts model, Phys. Rev. E 81 (2010) 021129.
- [52] M. J. Oliveira, J. F. F. Mendes, M. A. Santos, Nonequilibrium spin models with ising universal behaviour, J. Phys. A: Math. Gen. 26 (1993) 2317.
- [53] A. Tartaglia, L. F. Cugliandolo, M. Picco, Coarsening and percolation in the kinetic 2d ising model with spin exchange updates and the voter model 2018 (8) (2018) 083202.
- [54] P. P. Avelino, D. Bazeia, L. Losano, J. Menezes, B. F. Oliveira, Junctions and spiral patterns in generalized rock-paper-scissors models, Phys. Rev. E 86 (2012) 036112.
- [55] P. P. Avelino, D. Bazeia, L. Losano, J. Menezes, B. F. de Oliveira, Interfaces with internal structures in generalized rock-paper-scissors models, Phys. Rev. E 89 (2014) 042710.
- [56] P. P. Avelino, J. Menezes, B. F. de Oliveira, T. A. Pereira, Expanding spatial domains and transient scaling regimes in populations with local cyclic competition, Phys. Rev. E 99 (2019) 052310.
- [57] P. Avelino, D. Bazeia, J. Menezes, B. de Oliveira, String networks in lotka–volterra competition models, Physics Letters A 378 (4) (2014) 393 – 397.
- [58] P. Avelino, D. Bazeia, L. Losano, J. Menezes, B. de Oliveira, String networks with junctions in competition models, Physics Letters A 381 (11) (2017) 1014–1020.