The fate of time-reversal symmetry breaking in UTe2
Abstract
Topological superconductivity is a long-sought state of matter in bulk materials, and odd-parity superconductor UTe2 is a prime candidate. The recent observation of a field-trainable spontaneous Kerr signal in UTe2 at the onset of superconductivity provides strong evidence that the superconducting order parameter is multicomponent and breaks time-reversal symmetry. Here, we perform Kerr effect measurements on a number of UTe2 samples — grown both chemical vapor transport and the molten-salt-flux methods — that show a single superconducting transition between 1.6 K and 2.1 K. Our results show no evidence for a spontaneous Kerr signal in zero field measurements. This implies that the superconducting state of UTe2 does not intrinsically break time-reversal symmetry. Instead, we observe a field-trainable signal that varies in magnitude between samples and between different locations on a single sample, which is a sign of inhomogeneous magnetic regions. Our results provide an examination of representative UTe2 samples and place strong constraints on the superconducting order parameter of UTe2.
.1 Introduction
In a superconductor, electrons form pairs that condense into a macroscopic quantum state with zero electrical resistance. The underlying symmetries of the pair wavefunction are important to determine the properties of the superconducting state. When the orbital wavefunction is antisymmetric [], odd-parity superconductivity is realized Sigrist and Ueda (1991). When time-reversal symmetry is broken, chiral superconductivity may emerge. Odd-parity chiral superconductors are sought-after materials predicted to host topological excitations with nonabelian statistics that could enable quantum computing Kallin and Berlinsky (2016); Sato and Ando (2017). Over the past decade, the search for an odd-parity chiral superconductor has intensified, but an ideal candidate has yet to be established. Sr2RuO4 was long thought to be the leading candidate Mackenzie et al. (2017), but recent nuclear magnetic resonance experiments showed that the superconducting order parameter is even parity Pustogow et al. (2019).
Odd-parity UTe2 is a recently-discovered chiral superconductor candidate Ran et al. (2019). Evidence for chiral superconductivity in UTe2 comes from multiple experiments. Scanning tunneling microscopy reveals an asymmetry in the in-gap surface states at step edges argued to arise from a chiral superconducting state Jiao et al. (2020). Microwave surface impedance Bae et al. (2021) and anisotropic penetration depth Ishihara et al. (2021) studies also support a chiral superconducting state. In addition, a subset of specific heat measurements found a double peak near the superconducting transition temperature (Tc), which is similar to findings in chiral superconductor candidate UPt3 Joynt and Taillefer (2002); Schemm et al. (2014); Avers et al. (2020) and suggests the presence of a multicomponent superconducting state. A key characteristic of a chiral superconductor is that its order parameter breaks time-reversal symmetry, and the polar Kerr effect (PKE) is a powerful probe of time-reversal symmetry breaking. Previous PKE measurements in UTe2 indeed found a spontaneous Kerr rotation that arises at the onset of superconductivity Hayes et al. (2021). Because the Kerr rotation was found to be trainable by cooling in a axis magnetic field ( symmetry), a superconducting order parameter was put forward as the most likely multicomponent state Hayes et al. (2021). Further measurements of the PKE under larger training fields revealed that the magnitude of the Kerr rotation () scales with the training field up to a certain field Wei et al. (2022), which was attributed to a critical state of ferromagnetic vortices.
| Sample | Growth Method | Tc (K) | C/Tc (mJ mol-1 K-2) | (mJ mol-1 K-2) | RRR |
|---|---|---|---|---|---|
| S1 | MSF | 2.1 | 266 | 6 | 400 |
| S2 | CVT | 2.0 | 232 | 21 | 111 |
| S3 | CVT | 1.9 | 163 | 41 | 79 |
| S4 | CVT | 1.6 | 154 | 61 | 46 |
Importantly, the properties of UTe2 are markedly sensitive to sample growth conditions. For samples grown chemical vapor transport (CVT), lower growth temperatures increase Tc from 1.6 K to 2 K Rosa et al. (2022). Further decreasing the growth temperature leads to a sudden disappearance of superconductivity and a drastic decrease in the residual resistivity ratio (RRR). CVT growth either at higher temperatures or near the low-temperature limit often leads to samples with an apparent double transition in specific heat Weiland et al. (2022). The determination of the origin of the double transition has been hampered by strong sample dependence of the superconducting state of UTe2. However, several studies now suggest that, unlike UPt3, the double transition is not an intrinsic feature but rather a consequence of sample inhomogeneity Thomas et al. (2021); Aoki et al. (2022a). Further, single-transition samples show no evidence for a splitting of the superconducting transition under shear stress that couples to the proposed order parameter Girod et al. (2022), suggesting that the superconducting order parameter may be single component or belong to different symmetry channels. More recently, the quality of UTe2 single crystals was further improved using a molten-salt-flux (MSF) growth technique Sakai et al. (2022), leading to RRRs as large as 1000 and enabling the first observation of de Haas-van Alphen oscillations in UTe2 Aoki et al. (2022b).
A key outstanding open question is whether a spontaneous Kerr rotation persists in samples that show a single Tc. PKE experiments to date have only been reported on a sample with a double transition near 1.55 K in specific heat Hayes et al. (2021); Wei et al. (2022). In these samples, a large residual specific heat () was observed in the superconducting state Ran et al. (2019), which has been shown to decrease as Tc is increased Cairns et al. (2020); Rosa et al. (2022); Aoki et al. (2022a). Notably, a correlation has been identified between the volume fraction of inhomogeneous magnetic clusters detected by muon spin resonance (SR) and the size of Sundar et al. (2022), which naturally points to the role of magnetism in samples with large .
Here, we investigate the polar Kerr effect on a number of samples grown via both the CVT and molten-salt methods. All samples have only a single detectable transition in specific heat. Our measurements do not show evidence for a spontaneous PKE effect that emerges at Tc in zero-field-cooled measurements. Nonetheless, we observe a field-trainable signal that persists up to Tc and whose magnitude varies significantly between different samples and between different spots on the same sample. Contrary to the correlation observed in SR Sundar et al. (2022), no clear trend is observed between the magnitude of the PKE and , which suggests that magnetic clusters may not be the only source of PKE. Ac susceptibility measurements on another representative set of samples indicate a correlation between Tc and the size of the vortex peak effect, a measure of crystalline quality. This result unambiguously shows that lower-Tc samples have a higher density of vortex pinning centers. Our results demonstrate that UTe2 does not have a time-reversal symmetry breaking (TRSB) superconducting order parameter and that the inhomogeneous field-trainable PKE has an extrinsic origin.
.2 Results
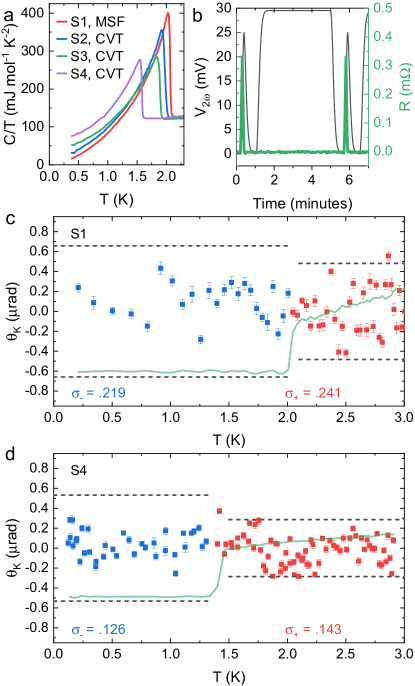
Temperature-dependent specific heat measurements for each of the samples on which PKE was measured, shown in Fig. 1a, reveal a single superconducting transition with a transition width of approximately 50 mK. Tc varies from a minimum of 1.6 K in sample S4 to a maximum of 2.1 K in sample S1. Samples S2–S4 were grown via chemical vapor transport Rosa et al. (2022), whereas sample S1 was grown using the molten-salt-flux method Sakai et al. (2022). As observed previously, the decreases dramatically as Tc increases Rosa et al. (2022); Cairns et al. (2020); Aoki et al. (2022a), and the MSF sample exhibits the smallest of only 6 mJ mol-1 K-2 Sakai et al. (2022). Table I summarizes key properties of the samples investigated here.
Figures 1c-d show the temperature-dependent polar Kerr rotation of our zero-field cooling experiments for samples S1 and S4, respectively. To ensure zero-field cooling conditions, each sample was heated above using a high-intensity light pulse as shown in Fig. 1b (see Methods for details). Each data point in Figures 1c-d represents the mean of measured after the sample is cooled to the indicated temperature from higher temperature (). Data for S2 and S3 are shown in Supplemental Fig. S1. No evidence for a spontaneous Kerr rotation below Tc is found for any of the investigated samples.
Under zero field conditions, prior measurements found that a spontaneous Kerr rotation developed below Tc with amplitude less than or equal to 0.4 rad () Hayes et al. (2021); Wei et al. (2022). The Kerr rotation was also found to change sign and amplitude between different runs. These changes were attributed to different chiral domain configurations that can form as the sample is cooled through Tc. In the presence of random domains, the standard deviation of the spontaneous Kerr rotation between cooldowns () is related to the ratio of the beam diameter () to the average domain size () via the expression for , wherein is the amplitude of the PKE arising from single domain Xia et al. (2006). The zero-field-cooled data presented by Wei et al. Wei et al. (2022) has a standard deviation () of 0.097 rad for TTc and 0.244 rad for TTc across six runs. Assuming that the noise (scatter) in the data () and the magnitude of the spontaneous Kerr signal are independent:
| (1) |
This provides a value for of 0.224 rad, and an approximate domain size of 6 m using the value of above and the stated beam diameter of 10 m. The beam diameter used in this study was also 10 m in diameter.
The values of and were calculated for each sample in this study. In contrast to prior reports Hayes et al. (2021); Wei et al. (2022), there is no significant difference between the standard deviation above and below Tc. Using our normal-state deviation and the value of determined from Wei et al. Wei et al. (2022) would imply a standard deviation in the superconducting state of 0.329 and 0.226 rad in our data for samples S1 and S4, respectively. Such an increase, illustrated by the dashed gray lines in Fig. 1c and d, is not observed.
Although there is no spontaneous Kerr rotation below Tc, all samples show a field-trainable Kerr signal that vanishes at Tc. Figure 2a shows the temperature dependence of for S3 when warmed in zero field after being cooled through Tc in small magnetic fields. A finite Kerr signal clearly emerges for , and the size of the signal is proportional to the cooling field for fields up to Oe. At higher fields, the signal begins to saturate as indicated by the identical Kerr rotation between the curves at 350 and 500 Oe.
In Wei et al. Wei et al. (2022), was also found to be proportional to the cooling field. In that study, however, was always rad for cooling fields between Oe and Oe in magnitude with the sign of dependent on the sign of the training field. For fields lower than 15 Oe, was distributed between rad and rad as noted above. Thus, aside from the low-field behavior, our results are consistent with those reported in reference Wei et al. (2022).
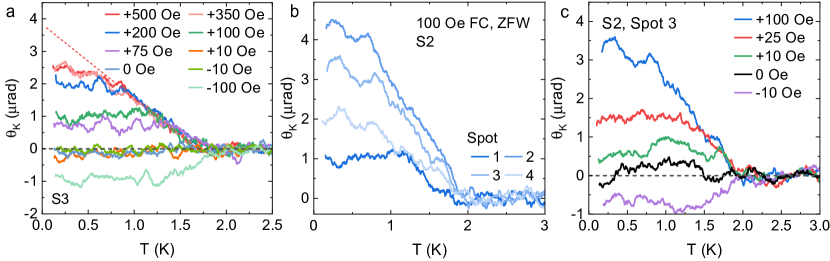
Now we turn to signs of sample inhomogeneity revealed by PKE measurements. Fig. 2b shows the temperature evolution of on four different spots of sample S2, upon warming up after being cooled in a field of +100 Oe. As illustrated by Fig. 2(b), there is more than a factor of four change in the size of between the spots measured in sample S2. This inhomogeneity strongly suggests an extrinsic origin for the trainable Kerr effect in UTe2. In addition, Figure 2c shows for spot 3 on S2 when warmed in zero field after being cooled in small magnetic fields. Even in small fields ( Oe), is proportional to the training field, which is in contrast to the behavior previously observed in samples that show a double transition in specific heat Hayes et al. (2021); Wei et al. (2022). As discussed below, inhomogeneity and vortex pinning by defects in samples with a double transition may be responsible for this discrepancy.
To further correlate the PKE behavior with sample quality, we investigate vortex pinning effects through ac magnetic susceptibility measurements. Figure 3a presents the real and the imaginary parts of the ac magnetic susceptibility of four different UTe2 single crystals with a range of Tc values between 1.48 K and 2.1 K. The specific heat data obtained on the same samples are shown in Fig. 3b for comparison. The temperatures of the diamagnetic drop in and the dissipation peak in are both consistent with the specific heat data. Samples S5, S6, and S2 exhibit a single thermodynamic transition, whereas sample S7 shows two clear transitions at 1.64 K and 1.48 K. Note that sample S2 is the same sample S2 on which PKE data was presented above. Once again, decreases systematically for samples with higher Tc. Although it has been previously argued that the double transition in some UTe2 crystals is an intrinsic feature Hayes et al. (2021), it most often appears in crystals with lower Tc or grown via CVT near the edge of the growth stability region for UTe2 Weiland et al. (2022).
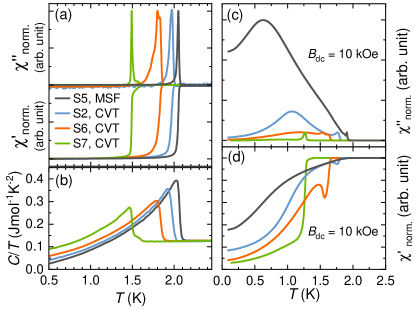
To investigate whether lower Tc samples also have lower crystalline quality, Figs. 3c and 3d show ac susceptibility measurements cooled in a dc field of 10 kOe applied along the axis. As Tc increases, the relative drop in below Tc decreases for a fixed magnetic field. To understand this apparent decrease in superconducting screening, we recall that, within the critical state model, the field H∗ at which magnetic flux first penetrates into the center of the sample after zero field cooling is proportional to the critical current (Jc) times the effective radius of the sample Bean (1964); Clem and Hao (1993). In addition, lower defect density typically decreases Jc and, as a result, H∗. For a given field, more flux will therefore penetrate in a higher-quality sample compared to a lower-quality sample. This is the reason for the enhanced (reduced screening) at low temperatures in samples with higher Tc. The relationship between vortex pinning strength and Tc can be seen more clearly in the imaginary part of the susceptibility (), which reveals a peak effect characteristic of vortex lattice dynamics within the mixed state of type-II superconductors Banerjee (2011). A broad peak in is observed below Tc due to dissipation from vortex dynamics. As vortex pinning becomes stronger, the broad peak in decreases due to a decrease in dissipation. Thus, the smaller peak in is thereby evidence of stronger vortex pinning in lower Tc samples.
.3 Discussion
The absence of a spontaneous polar Kerr effect in our investigation of representative single-Tc UTe2 samples requires a careful discussion of consistency checks. First, we note that the size of putative chiral domains should increase with increasing sample quality Kallin and Berlinsky (2016). In the case where the domain size is large compared to the beam diameter, will equal (0.4 rad). Our ac magnetic susceptibility results demonstrate that higher Tc samples have fewer defects, and the spontaneous polar Kerr response should therefore be even higher in the samples measured here if it were an intrinsic effect.
Second, we consider the effects of remnant magnetization in a type-II superconductor after cooling in constant field and removing the field at base temperature. Clem and Hao Clem and Hao (1993) have calculated the expected remnant magnetization as a function of vortex pinning strength. In a superconductor with strong vortex pinning, the remnant magnetization is expected to be nearly constant near the center of the sample and to decrease near the edges over a length scale determined by the vortex pinning strength. Near the center, the remnant magnetization is expected to be non-zero up to the irreversibility temperature (), which has been shown to be very close to in UTe2 for small magnetic fields Rosuel et al. (2022). Although remnant magnetization has been measured in UPt3 and URu2Si2 Koziol et al. (1994), prior measurements of in these systems have not found a signal that scales with the magnitude of the training field Schemm et al. (2014, 2015). It was argued that the reason for the difference between UTe2 and other U-based materials is that in UTe2 the vortices carry a ferromagnetic moment Wei et al. (2022).
If this were the case, and the observed Kerr effect in UTe2 were due to intrinsic magnetism, one would expect that would be uniform across a large region in the center of the sample due to the relatively strong vortex pinning Clem and Hao (1993). Our position-dependent PKE measurements in sample S2, however, reveal a significant variation in the magnitude of near the center of the sample (see Fig. 2b). This spatial inhomogeneity strongly suggests an extrinsic origin for the field-trainable Kerr effect in UTe2. Notably, this sample has the lowest of the three CVT-grown samples measured here. Sample S4 also shows a large difference between measured spots (see Supplemental Fig. S4). If the origin of the finite Kerr signal were solely the inhomogenous magnetic clusters detected via SR Sundar et al. (2022), one may expect a direct correlation between and the size of the Kerr signal at a given training field. Instead, the CVT-grown sample with the lowest has the highest variability of , which indicates the presence of another contribution to the field-trainable Kerr signal. One obvious distinction is that SR is a bulk probe, whereas PKE is surface sensitive. From temperature-dependent optical conductivity measurements, the penetration depth for 1550 nm light is estimated to be only 300 nm Mekonen et al. (2022). In addition, PKE probes a small surface area (10 m diameter) and will therefore depend on the local defect structure. In fact, SR measurements detect fluctuating magnetic clusters Sundar et al. (2022), and these fluctuations may be pinned by defects to become locally static Iguchi et al. (2022). This may lead to a PKE signal that depends strongly on the proximity of the beam with respect to a pinning center.
Third, we note that the saturation of in the highest-quality sample (S1, Tc = 2.1 K) occurs between 25 and 100 Oe, whereas a higher field between 200 and 350 Oe was required to saturate in sample S3 (Tc = 1.9 K). The field where saturation occurs is related to H∗, which is the field where the magnetic flux first penetrates into the center of the sample Wei et al. (2022). At first sight, this appears to be consistent with the model of Clem and Hao, where H∗ is expected to decrease as the vortex pinning strength decreases Clem and Hao (1993). The remnant magnetization, however, is expected to scale with the vortex pinning strength. If the magnitude of were related to the remnant magnetization of the bulk, then it should decrease as sample quality is improved. Instead, it varies between spots on a given samples and between samples with no apparent trend. This provides further evidence that the field-trainable Kerr effect is of extrinsic origin.
One significant difference between samples measured here and in prior reports is whether they host two transitions in specific heat. As has been shown by several studies Thomas et al. (2021); Rosa et al. (2022); Aoki et al. (2022a), the double transition is not an intrinsic feature of UTe2. Further, no evidence for a splitting of Tc was found under shear uniaxial stress that would couple to the proposed superconducting order parameter Girod et al. (2022). In the face of our results, a plausible explanation for the difference in spontaneous Kerr signal between samples showing either a single or double transition is that the spatial inhomogeneity of the superconducting state may help nucleate and pin magnetic flux from fluctuating magnetic clusters and vortices. In fact, extended crystallographic defects (e.g. line dislocations and grain boundaries) provide a natural explanation for stronger vortex pinning in lower Tc samples, and recent scanning SQUID measurements reveal that vortices tend to form along extended defects Iguchi et al. (2022).
Finally, we discuss the implications of our result for the superconducting order parameter of UTe2. If the superconducting state in UTe2 does not break time-reversal symmetry, proposals in favor of a chiral order parameter must be reevaluated. Aside from PKE measurements Hayes et al. (2021); Wei et al. (2022), a chiral order parameter has also been suggested from the temperature dependence of magnetic penetration depth measurements of CVT-grown samples that indicated multiple pairs of point nodes Ishihara et al. (2021). The samples investigated in Ref. Ishihara et al. (2021) display a large residual specific heat ( mJ mol-1 K-2), which indicates a large contribution from nonsuperconducting parts of the sample. With the advent of molten salt flux growth Sakai et al. (2022), it is crucial to revisit prior experiments to determine which properties of UTe2 are intrinsic and which are instead due to sample inhomogeneity, impurities, and crystallographic defects. Other reports that support a chiral order parameter rely heavily on the observation of a TRSB order parameter to rule out other possibilities Jiao et al. (2020); Bae et al. (2021). Further, no evidence for chiral domains or half-flux quantum vortices was observed in scanning SQUID measurements Iguchi et al. (2022). We therefore must conclude that a chiral order parameter in UTe2 is unlikely.
.4 Conclusion
In summary, we performed systematic polar Kerr effect and ac magnetic susceptibility measurements on representative UTe2 crystals of different quality to investigate the interplay between sample quality and time-reversal symmetry breaking. Our results show that samples with a single thermodynamic superconducting transition do not develop a spontaneous Kerr rotation in the superconducting state. In addition, the field-trainable Kerr effect observed in these samples is inhomogeneous and sample dependent, which strongly suggests an extrinsic origin. We conclude that the superconducting state UTe2 does not break time-reversal symmetry and a chiral order parameter is unlikely in UTe2.
.5 Materials and Methods
UTe2 samples were grown via both chemical vapor transport Rosa et al. (2022) and molten salt flux Sakai et al. (2022) techniques. One noted drawback of the MSF technique is the potential inclusion of ferromagnetic U7Te12 with ordering temperature of 48 K Opletal et al. (2022) or other uranium-tellerium binaries with ordering temperatures near 115 K Tougait et al. (2001). In sample S1, which was grown by the MSF method, ferromagnetic impurities ( mrad) were found on the surface, even after polishing, that tended to grow in thin strips along the axis. The presence of ferromagnetic impurities was also confirmed by measurements of magnetic susceptibility.
Ac susceptibility was measured in a set of commercially wound compensated susceptibility coils. Note that the data are normalized with respect to the height of the peak in at Tc for each sample. This allows comparison between samples of different sizes. The effectiveness of this normalization is shown in supplemental figure S6 where two pieces of sample S2 of different size were measured and seen to have similar behavior after this normalization.
Specific heat was measured using the quasi-adiabatic thermal relaxation technique in a He-3 cryostat insert. Both small-pulse and long-pulse methods were used to ensure that all samples measured only had a single transition in specific heat. Electrical resistivity was collected with a Lakeshore 372 AC bridge using a standard four-probe configuration wherein Pt wires were attached to sputtered gold pads with silver paint. The residual resistivity ratio was determined by fitting the low-temperature resistivity to and taking the ratio . Sample S2 was not measured directly, but the RRR for samples measured from the same growth batch was approximately 100.
PKE measurements were performed using a fiber-based zero area Sagnac interferometer operating at a wavelength of 1550 nm Xia et al. (2006); Fried et al. (2014). Samples were mounted on a set of XYZ cryogenic piezo-stepper devices and thermally anchored to the base plate of an adiabatic demagnetization refrigerator. Two different measurements types were performed: i) heat-pulse experiments to look for the development of a spontaneous PKE below Tc, and ii) field-cooled, zero-field-warmed measurements to investigate the field-trainable Kerr effect.
An example of the measurement process for the heat pulse experiments (i) is shown in Fig. 1b. To determine whether a spontaneous PKE onsets at Tc, samples were first cooled under zero magnetic field and illumination. Maintaining zero-field conditions, a high intensity laser pulse was applied to the sample to heat the sample above Tc. The left axis of Fig. 1b shows V2ω, which is proportional to the light received by the photodetector. The initial spike in V2ω is caused by the high intensity laser pulse that is used to heat the sample. It does not reach a very large value in the plot because of the short pulse time compared (7 seconds) to the settling time of the lockin amplifier (30 seconds). Importantly, the resistivity becomes non-zero during the pulse indicating that the sample is heated back into the normal state. The sample is then allowed to cool back to the current base temperature, which is the indicated temperature on Figs. 1c and 1d. Next, the PKE of the sample was measured for several minutes at the current base temperature using 10–20 W of optical power. This is the region in Fig. 1b where V2ω is nearly 30 mV and the sample resistance remains zero. This process was repeated as the base temperature of the system increased until the system warmed above Tc to approximately 3 K.
In field-cooled, zero-field-warmed measurements (ii) the sample was cooled in a constant magnetic field. After performing the demagnetization step needed to cool the system to base temperature, a the indicated field was applied to the sample. A high intensity laser pulse was then used to temporarily heat the sample above Tc without significantly raising the temperature of the base system. During the pulse, the sample temperature rise above Tc was confirmed by measuring the resistivity change in the sample. This process ensured that the sample cooled through Tc in the intended field and was not affected by the stray field from the demagnetization process. After the single heat pulse the field was set to zero, and the sample was warmed at a fixed rate by controlling the base temperature of the system. Measurements were typically made using 10–20 W of incident optical power as the sample was warmed. A small offset was subtracted from each curve so that the mean of was zero for . This offset is from a small remnant field ( Oe) that arises from trapped flux in the demagnetization and sample space superconducting magnets. Because the relationship between and the remnant field is known for , it can be used to confirm the small magnitude of the remnant field.
Samples S1–S4 were prepared for optical measurements by polishing the surface. The Supplemental Information also contains data on sample S8, which had as-grown surfaces that were suitable for optical measurements without polishing. No notable differences were observed in the measurements between the as-grown and polished surfaces. Additional heat pulse experiments were performed on S8 for which a local resistive heater was used to heat the sample above Tc instead of the laser. This allowed for the sample to cool from above Tc back to base temperature over a period of 60 seconds instead of a few seconds. No differences related to the cooling rate were observed.
Acknowledgements.
Work at Los Alamos was supported by U.S. Department of Energy, Office of Basic Energy Sciences, Division of Materials Science and Engineering project “Quantum Fluctuations in Narrow-Band Systems”. Development of the Kerr effect measurements was supported by the Los Alamos Laboratory Directed Research and Development program. MMB and BM acknowledge support from the Los Alamos Laboratory Directed Research and Development program.References
- Sigrist and Ueda (1991) M. Sigrist and K. Ueda, Reviews of Modern Physics 63, 239 (1991), ISSN 0034-6861, URL https://link.aps.org/doi/10.1103/RevModPhys.63.239.
- Kallin and Berlinsky (2016) C. Kallin and J. Berlinsky, Reports on Progress in Physics 79, 054502 (2016), ISSN 0034-4885, eprint 1512.01151, URL https://iopscience.iop.org/article/10.1088/0034-4885/79/5/054502.
- Sato and Ando (2017) M. Sato and Y. Ando, Reports on Progress in Physics 80, 076501 (2017), ISSN 0034-4885, eprint 1608.03395, URL http://stacks.iop.org/0034-4885/80/i=7/a=076501?key=crossref.db5f5db067ad36cf0669f5cbf8ccb916.
- Mackenzie et al. (2017) A. P. Mackenzie, T. Scaffidi, C. W. Hicks, and Y. Maeno, npj Quantum Materials 2, 40 (2017), ISSN 2397-4648, eprint 1706.01942, URL http://www.nature.com/articles/s41535-017-0045-4.
- Pustogow et al. (2019) A. Pustogow, Y. Luo, A. Chronister, Y. S. Su, D. A. Sokolov, F. Jerzembeck, A. P. Mackenzie, C. W. Hicks, N. Kikugawa, S. Raghu, et al., Nature 574, 72 (2019), ISSN 14764687.
- Ran et al. (2019) S. Ran, C. Eckberg, Q.-P. Ding, Y. Furukawa, T. Metz, S. R. Saha, I.-L. Liu, M. Zic, H. Kim, J. Paglione, et al., Science 365, 684 (2019), ISSN 0036-8075, URL http://www.sciencemag.org/lookup/doi/10.1126/science.aav8645.
- Jiao et al. (2020) L. Jiao, S. Howard, S. Ran, Z. Wang, J. O. Rodriguez, M. Sigrist, Z. Wang, N. P. Butch, and V. Madhavan, Nature 579, 523 (2020), ISSN 0028-0836, eprint 1908.02846, URL http://arxiv.org/abs/1908.02846http://dx.doi.org/10.1038/s41586-020-2122-2http://www.nature.com/articles/s41586-020-2122-2.
- Bae et al. (2021) S. Bae, H. Kim, Y. S. Eo, S. Ran, I.-l. Liu, W. T. Fuhrman, J. Paglione, N. P. Butch, and S. M. Anlage, Nature Communications 12, 2644 (2021), ISSN 2041-1723, eprint 1909.09032, URL https://www.nature.com/articles/s41467-021-22906-6.
- Ishihara et al. (2021) K. Ishihara, M. Roppongi, M. Kobayashi, Y. Mizukami, H. Sakai, Y. Haga, K. Hashimoto, and T. Shibauchi, arXiv pp. 1–32 (2021), eprint 2105.13721, URL http://arxiv.org/abs/2105.13721.
- Joynt and Taillefer (2002) R. Joynt and L. Taillefer, Reviews of Modern Physics 74, 235 (2002), ISSN 00346861.
- Schemm et al. (2014) E. R. Schemm, W. J. Gannon, C. M. Wishne, W. P. Halperin, and A. Kapitulnik, Science 345, 190 (2014), ISSN 0036-8075, URL https://www.sciencemag.org/lookup/doi/10.1126/science.1248552.
- Avers et al. (2020) K. E. Avers, W. J. Gannon, S. J. Kuhn, W. P. Halperin, J. A. Sauls, L. DeBeer-Schmitt, C. D. Dewhurst, J. Gavilano, G. Nagy, U. Gasser, et al., Nature Physics (2020), ISSN 1745-2473, URL http://dx.doi.org/10.1038/s41567-020-0822-zhttp://www.nature.com/articles/s41567-020-0822-z.
- Hayes et al. (2021) I. M. Hayes, D. S. Wei, T. Metz, J. Zhang, Y. S. Eo, S. Ran, S. R. Saha, J. Collini, N. P. Butch, D. F. Agterberg, et al., Science 373, 797 (2021), ISSN 0036-8075, eprint 2002.02539, URL http://arxiv.org/abs/2002.02539https://www.sciencemag.org/lookup/doi/10.1126/science.abb0272.
- Wei et al. (2022) D. S. Wei, D. Saykin, O. Y. Miller, S. Ran, S. R. Saha, D. F. Agterberg, J. Schmalian, N. P. Butch, J. Paglione, and A. Kapitulnik, Physical Review B 105, 024521 (2022), ISSN 2469-9950, eprint 2108.09838, URL https://link.aps.org/doi/10.1103/PhysRevB.105.024521.
- Rosa et al. (2022) P. F. S. Rosa, A. Weiland, S. S. Fender, B. L. Scott, F. Ronning, J. D. Thompson, E. D. Bauer, and S. M. Thomas, Communications Materials 3, 33 (2022), ISSN 2662-4443, URL https://www.nature.com/articles/s43246-022-00254-2.
- Weiland et al. (2022) A. Weiland, S. M. Thomas, and P. F. S. Rosa, Journal of Physics: Materials 5, 044001 (2022), ISSN 2515-7639, URL https://iopscience.iop.org/article/10.1088/2515-7639/ac8ba9.
- Thomas et al. (2021) S. M. Thomas, C. Stevens, F. B. Santos, S. S. Fender, E. D. Bauer, F. Ronning, J. D. Thompson, A. Huxley, and P. F. S. Rosa, arXiv (2021), eprint 2103.09194, URL http://arxiv.org/abs/2103.09194.
- Aoki et al. (2022a) D. Aoki, J.-P. Brison, J. Flouquet, K. Ishida, G. Knebel, Y. Tokunaga, and Y. Yanase, Journal of Physics: Condensed Matter 34, 243002 (2022a), ISSN 0953-8984, URL https://iopscience.iop.org/article/10.1088/1361-648X/ac5863.
- Girod et al. (2022) C. Girod, C. R. Stevens, A. Huxley, E. D. Bauer, F. B. Santos, J. D. Thompson, R. M. Fernandes, J.-x. Zhu, F. Ronning, P. F. S. Rosa, et al., Physical Review B 106, L121101 (2022), ISSN 2469-9950, URL https://link.aps.org/doi/10.1103/PhysRevB.106.L121101.
- Sakai et al. (2022) H. Sakai, P. Opletal, Y. Tokiwa, E. Yamamoto, Y. Tokunaga, S. Kambe, and Y. Haga, Physical Review Materials 6, 073401 (2022), ISSN 2475-9953, URL https://link.aps.org/doi/10.1103/PhysRevMaterials.6.073401.
- Aoki et al. (2022b) D. Aoki, H. Sakai, P. Opletal, Y. Tokiwa, J. Ishizuka, Y. Yanase, H. Harima, A. Nakamura, D. Li, Y. Homma, et al., Journal of the Physical Society of Japan 91, 1 (2022b), ISSN 13474073, eprint 2206.01363, URL https://journals.jps.jp/doi/10.7566/JPSJ.91.083704.
- Cairns et al. (2020) L. P. Cairns, C. R. Stevens, C. D. O’Neill, and A. Huxley, Journal of Physics: Condensed Matter 32, 415602 (2020), ISSN 0953-8984, URL https://iopscience.iop.org/article/10.1088/1361-648X/ab9c5d.
- Sundar et al. (2022) S. Sundar, N. Azari, M. Goeks, S. Gheidi, M. Abedi, M. Yakovlev, S. R. Dunsiger, J. M. Wilkinson, S. J. Blundell, T. E. Metz, et al., pp. 1–33 (2022), eprint 2207.13725, URL http://arxiv.org/abs/2207.13725.
- Xia et al. (2006) J. Xia, P. T. Beyersdorf, M. M. Fejer, and A. Kapitulnik, Applied Physics Letters 89, 062508 (2006), ISSN 0003-6951, URL http://aip.scitation.org/doi/10.1063/1.2336620.
- Bean (1964) C. P. Bean, Reviews of Modern Physics 36, 31 (1964), ISSN 0034-6861, URL http://aip.scitation.org/doi/10.1063/1.1713463https://link.aps.org/doi/10.1103/RevModPhys.36.31.
- Clem and Hao (1993) J. R. Clem and Z. Hao, Physical Review B 48, 13774 (1993), ISSN 0163-1829, URL https://link.aps.org/doi/10.1103/PhysRevB.48.13774.
- Banerjee (2011) S. Banerjee, in Superconductivity - Theory and Applications, edited by A. Moyses Luiz (IntechOpen, 2011), chap. 4, pp. 55–84, ISBN 9789533071510.
- Rosuel et al. (2022) A. Rosuel, C. Marcenat, G. Knebel, T. Klein, A. Pourret, N. Marquardt, Q. Niu, S. Rousseau, A. Demuer, G. Seyfarth, et al., pp. 1–26 (2022), eprint 2205.04524, URL http://arxiv.org/abs/2205.04524.
- Koziol et al. (1994) Z. Koziol, J. J. M. Franse, P. F. de Chatel, and A. A. Menovsky, Phys. Rev. B 50, 15978 (1994), ISSN 0163-1829, URL https://link.aps.org/doi/10.1103/PhysRevB.50.15978.
- Schemm et al. (2015) E. R. Schemm, R. E. Baumbach, P. H. Tobash, F. Ronning, E. D. Bauer, and A. Kapitulnik, Phys. Rev. B 91, 140506 (2015), ISSN 1098-0121, eprint 1410.1479, URL https://link.aps.org/doi/10.1103/PhysRevB.91.140506.
- Mekonen et al. (2022) S. M. Mekonen, C.-J. Kang, D. Chaudhuri, D. Barbalas, S. Ran, G. Kotliar, N. P. Butch, and N. P. Armitage, Physical Review B 106, 085125 (2022), ISSN 2469-9950, eprint 2105.05121, URL https://link.aps.org/doi/10.1103/PhysRevB.106.085125.
- Iguchi et al. (2022) Y. Iguchi, H. Man, S. M. Thomas, F. Ronning, P. F. S. Rosa, and K. A. Moler, pp. 1–12 (2022), eprint 2210.09562, URL http://arxiv.org/abs/2210.09562.
- Opletal et al. (2022) P. Opletal, H. Sakai, Y. Haga, Y. Tokiwa, E. Yamamoto, S. Kambe, and Y. Tokunaga, pp. 1–7 (2022), eprint 2211.16760, URL http://arxiv.org/abs/2211.16760.
- Tougait et al. (2001) O. Tougait, G. André, F. Bourée, and H. Noël, Journal of Alloys and Compounds 317-318, 227 (2001), ISSN 09258388, URL https://linkinghub.elsevier.com/retrieve/pii/S0925838800013335.
- Fried et al. (2014) A. Fried, M. Fejer, and A. Kapitulnik, Review of Scientific Instruments 85, 103707 (2014), ISSN 0034-6748, URL http://dx.doi.org/10.1063/1.4897184http://aip.scitation.org/doi/10.1063/1.4897184.