Examining the Impact of Uncontrolled Variables on Physiological Signals in User Studies for Information Processing Activities
Abstract.
Physiological signals can potentially be applied as objective measures to understand the behavior and engagement of users interacting with information access systems. However, the signals are highly sensitive, and many controls are required in laboratory user studies. To investigate the extent to which controlled or uncontrolled (i.e., confounding) variables such as task sequence or duration influence the observed signals, we conducted a pilot study where each participant completed four types of information-processing activities (READ, LISTEN, SPEAK, and WRITE). Meanwhile, we collected data on blood volume pulse, electrodermal activity, and pupil responses. We then used machine learning approaches as a mechanism to examine the influence of controlled and uncontrolled variables that commonly arise in user studies. Task duration was found to have a substantial effect on the model performance, suggesting it represents individual differences rather than giving insight into the target variables. This work contributes to our understanding of such variables in using physiological signals in information retrieval user studies.
1. Introduction
Laboratory user studies are an effective mechanism to understand how users interact with information access and retrieval systems (Kelly, 2009; Hearst, 2009). However, designing user studies is not trivial, as it requires controlling for numerous factors influenced by each individual participating in the experiment, and their perception of the information and task. Information-seeking models have been proposed to characterize how users interact with a variety of systems such as screen-based search (Belkin, 1980; Marchionini, 1995), spoken conversational search (Trippas et al., 2020), multimedia platforms (White, 2016), or multi-modality input/output in conversational recommender systems (Jannach et al., 2021). Most user-system interactions in such systems involve four basic Information-Processing Activities (IPAs): READ, WRITE, LISTEN, and SPEAK. With the recent advances in wearable devices, it is natural to wonder what physiological signals can tell us about how users engage in these IPAs.In this paper, we present the results of a laboratory user study () where physiological signals – Electrodermal Activity (EDA), Blood Volume Pulse (BVP), and Pupil Diameter (PD) – are collected using a wearable device and an eye-tracker. Our ultimate aim is to analyze the signals by defining a multi-class classification problem: Can we predict the specific IPA the user performed by feeding a machine-learning model with the signals obtained from the sensors? The signals are sensitive to noise. Therefore, we analyze how a set of variables (both controlled and uncontrolled, but likely to interfere) influence the machine-learning model’s performance, and whether this can be used as a mechanism to scrutinize the validity of our experimental design. Data and code are publicly available online.111GitHub: bit.ly/ji2023examining
The contributions of this paper are two-fold:
-
•
We introduce a simple but informative methodology that, by observing changes in the effectiveness of machine learning models, can potentially characterize the influence of controlled and uncontrolled variables in complex laboratory user studies.
-
•
The results of this analysis revealed that some variables, such as the duration of the task, should be carefully designed and gauged before running the study at a larger scale.
2. Related Work
User studies are widely used to understand how users interact with information access and retrieval systems and to collect data for evaluating such systems. ‘In-the-wild’ studies, e.g., (McDuff et al., 2021), involved complicated factors. Thus lab studies should be cautiously conducted beforehand to understand target outcomes and conditions. On the other hand, there is growing interest in bio-signals (e.g., fMRI (Moshfeghi et al., 2016), eye-tracking (Granka et al., 2004; Arapakis et al., 2009; Buscher et al., 2012; Cole et al., 2014)), especially when looking at affective feedback (Wu et al., 2017; White and Ma, 2017). Despite the sensitivity of bio-signals (Mostafa and Gwizdka, 2016), the experiment can be influenced by various factors, including task activities, task designs, environments, and participants’ inner status (e.g., physical or mental state). Moshfeghi et al. (2016)’s user study consisted of two interaction activities; pressing a physical button to respond and verbally expressing a search query. The participants in Arapakis et al. (2009)’s study performed both video- and text-search tasks. Lin et al. (2007) included listening tasks. Granka et al. (2004) controlled the task difficulty levels and topics. Moshfeghi and Jose (2013) controlled the task types (search intentions). Buscher et al. (2012) controlled the document relevance in two user studies. The relevance varied across short documents in the first and across sections within a long document in the second. The fatigue and complexity might have confounding effects.
In affective computing, multi-modal data have been used to detect emotions with three or more classes. Both Verma and Tiwary (2014) and Ganapathy et al. (2020) proposed architectures of deep learning feature-extraction methods with machine learning approaches, including Multilayer Perceptron (MLP), Support Vector Machines (SVM), and K-Nearest Neighbors (KNN) multi-label classifiers; while the former used multi-modal signals and the other used only EDA. They both tested with the DEAP database (Koelstra et al., 2011). It contains multiple physiological signals and emotion annotations from watching short videos. A short break is provided after around 27 minutes. Another popular multi-modal emotion dataset is the CEAP-360VR dataset (Xue et al., 2023) which contains physiological and behavioral signals.
In summary, it remains unclear if multiple activities or variables contained in one user study would impact the experiment results and require careful control in information processing experiments. In this regard, we select the variables that are commonly encountered and report their impact on a rigorous laboratory study to infer whether they require careful treatment in the experimental design.
3. User Study
Participants
As a pilot study, 8 participants were recruited in total. However, data for one participant had to be discarded due to the collection error and data from 7 participants (5M, 2F) were analyzed. One participant was in the 35–44 age group, and others were in the 25–34 age group. The study received ethics approval from the author’s university, and the participants provided written consent before the experiment.
Setup and Equipment
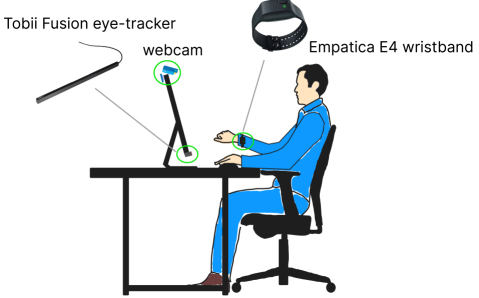
There are three sensors used in this study: a webcam camera for video recording, a Tobii Fusion eye-tracker222https://www.tobii.com/products/eye-trackers/screen-based/tobii-pro-fusion for PD and an E4 wristband333https://www.empatica.com/en-int/research/e4/ for EDA and BVP. The equipment setup is shown in Figure 1. There is a desktop PC mounted with an eye-tracker and a web camera in the experiment room. The participant sits in front of the computer and wears the wristband on the non-dominant hand. All participants used the computer mouse with their right hand. The instructor leaves the experiment room after calibration and instruction to avoid interruption.
Procedure
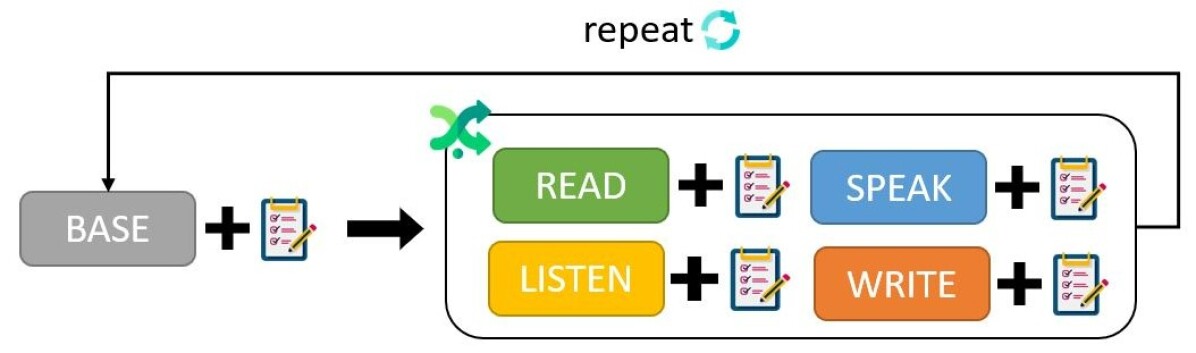
Each participant first completes a pre-task survey. The survey asks for sleeping hours prior and caffeine intake on the experiment day, which might affect the cognition status (Babaei et al., 2021). Figure 2 presents the user study procedure. The study consists of two sections, each corresponding to two pre-defined activity complexity levels (low and high). For READ and LISTEN IPAs, complexity is defined using low and high readability scores (Williams, 1972). The materials are scientific new items with around 500 words, some converted into synthesis speeches using Google Neutral Voice for LISTEN. For SPEAK and WRITE, complexity is estimated by the type of questions and the length of expected answers. The easy questions are recalling questions, e.g., ‘what was your routine this morning? (100 words minimum)’; the hard questions need recalling and analyzing, e.g., ‘does social media make you in general happier or sadder? why? (300 words minimum)’. Each section starts with a relaxing activity (BASE), where the participant is asked to watch a relaxing video and minimal cognitive efforts are involved. Then, the participant completes four IPAs: READ, LISTEN, SPEAK, and WRITE. Specifically, the participant needs to read one article, listen to one article, answer a question by speaking, and answer a question by typing. After each task (including BASE), the participant completes an engagement scale (O’Brien et al., 2018).
Data Pre-processing and Feature Extraction
To synchronize all the sensors, we convert the timestamps into ISO 8601 time format with milliseconds. The signals are segmented according to the event timestamps recorded during the experiment. We follow similar data cleaning procedures as in (Di Lascio et al., 2018; Bota et al., 2019; Braithwaite et al., 2013) for EDA and BVP, and similar procedures as in (Zhai et al., 2005; Kret and Sjak-Shie, 2019) for PD data. The pre-processed signals are first divided by sliding windows (2 seconds with 1-second overlap), then the average values of each feature are computed. The pre-processing steps and extracted features are described in Table 1.
| Data (Raw Hz) | Pre-processing | Features |
|---|---|---|
| Electrodermal | 1. Rolling median (5 sec. window) | original, |
| Activity (EDA, 4 Hz) | 2. Butterworth bandpass filter (1–8 Hz, order) | & derivative |
| Blood Volume Pulse | 3. Min-max Normalization | |
| (BVP, 64 Hz) | 4. EDA upsampled to 8 Hz | |
| Pupil Diameter | 1. Remove with range (1.5–9 mm) | mean, |
| (PD, 250 Hz) | 2. Remove and correct the gap caused by blink | median, |
| 3. Linear Interpolation | standard | |
| 4. Combine two sides by averaging | deviation | |
| 5. Zero-phase lowpass filter (4 Hz) | ||
| 6. Downsampled to 100 Hz |
4. Results And Analysis
Our classification task consists of classifying four activities: READ, LISTEN, SPEAK, and WRITE. Overall, our experiment follows a similar setting to the one proposed by Xue et al. (2023): it includes the same short-duration signals (70 seconds), the same sensor data (EDA, BVP, PD), the same collection devices for EDA and BVP data, and it addresses a multi-class classification problem. We use a leave-one-participant-out approach for cross-validation. As we have data from 7 participants, we have 7 times cross-validation. Note that this is a robust way to split the data: all the folds are equally balanced (12 training and 2 test instances for each IPA), and on each fold, all the IPAs of the test participant are in the test split, minimizing the risk of learning individual patterns from participants.
4.1. Model Selection
First, we compare different machine learning (ML) models which are commonly used on physiological data (Verma and Tiwary, 2014; Ganapathy et al., 2020; Xue et al., 2023; Maithri et al., 2022; Lin et al., 2010; Gao et al., 2020). Specifically, we use the following ML models: non-linear SVM (radial basis function kernel), RF (max. depth=4), KNN (Euclidean distance) and Naïve Bayes (NBayes). We also use MLP with the rectified linear unit (ReLU) activation function and Adam optimizer (Babu et al., 2018). We also report the effectiveness of a Random classifier. Figure 3 shows the accuracy of different ML models for our 4-class IPAs classification.
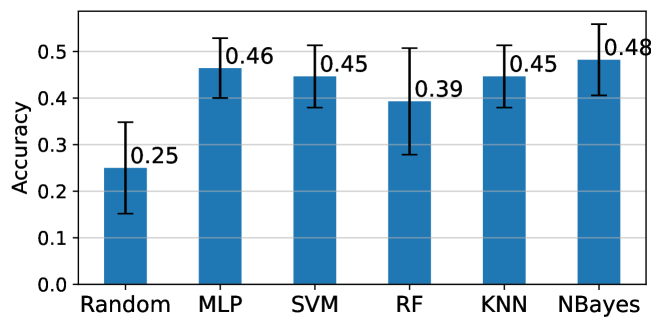
Overall, we can see that ML models are able to learn from physiological signals with comparable effectiveness. NBayes obtains the highest mean accuracy, whereas KNN and SVM obtain a comparable performance with smaller confidence intervals (CI). We report the rest of the experiment using SVM, a non-probabilistic, effective model often used for physiological data classification (Xue et al., 2023; Rajoub, 2020; Bakkialakshmi and Sudalaimuthu, 2021). Similar trends were observed with the other ML methods we used.
4.2. Impact of Variables
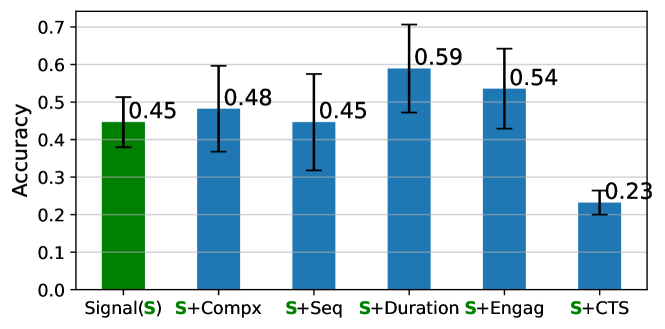
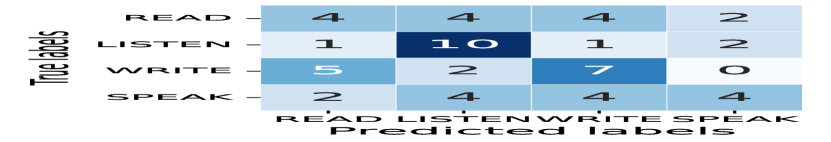
In total, we examine the influence of five variables. They are two controlled variables – ‘complexity’ and ‘task_sequence’ – and three uncontrolled variables – ‘duration’, ‘engage_score’, and ‘cumulative_time_spent’. The hypotheses are made based on the influence of each variable w.r.t. model effectiveness, which then can be used to inform changes to make the experimental design of our user study more robust. Intuitively, the model is supposed to calibrate the inputs (i.e., performance should not change) if the variables do not impact the user study. We report confusion matrices that aggregate the results from the 7 leave-one-participant-out folds. Our test data also has balanced classes (8 IPAs per participant). The prediction results with only signal features are presented in Figure 5(a). The model skews to LISTEN and WRITE while less on SPEAK.
4.2.1. Complexity
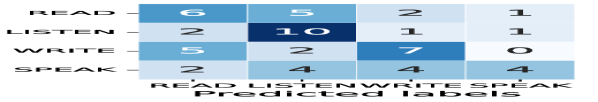
In the user study, there are two sections for low or high complexity. We control this variable to prevent participant distraction from task difficulty. As presented in Figure 4, the accuracy increases slightly after adding ‘complexity’ as a feature into the model. However, in addition to the confusion matrix in Figure 5(b), the complexity does not impact the classifications on WRITE and SPEAK at all, while it impacts classifications between READ and LISTEN.Furthermore, we conduct another experiment to classify the LOW and HIGH complexity using the signal features and linear SVM. The model results in low performance, 44.6% accuracy (), 36.9% F1 (), and 40.2% AUC (), indicates that the model is not able to classify complexities.
The results suggest the complexity level should be carefully controlled when designing a user study related to reading and listening. A limitation here is that complexity is instantiated in different ways for different IPAs (readability score for READ and LISTEN, complexity of questions and expected length of answers for SPEAK and WRITE). The result of complexity impacts READ and LISTEN but not SPEAK and WRITE, potentially due to this difference.
4.2.2. Task Sequence
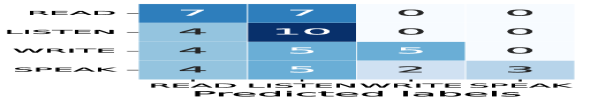
The ‘task_sequence’ in our user study is randomized to counterbalance any potential order effect (Kelly, 2009). After adding the ‘task_sequence’ as a feature, the accuracy does not change while the CI expands (Figure 4). In addition to Figure 5(c), the model skews to the READ or LISTEN more (82%) compared to using only signals. However, the reason is probably the small number of participants; the sequence of 4 tasks (in 2 sections) cannot be counterbalanced. By design, BASE activities are always taken as first and sixth in the sequence. In our pilot study, only SPEAK has equal occurrences, while READ occurs mostly as last, LISTEN never appears as last, and WRITE occurs in five out of the eight possible positions.
The results suggest that ‘task_sequence’ may not impact the model, as we have not observed changes in the model effectiveness when adding task_sequence as a feature. However, given the limited coverage of the possible sequence permutations in the existing data, we may observe different results in a larger dataset.
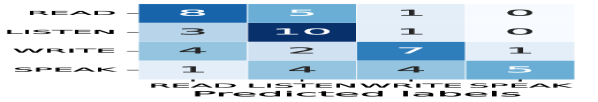
4.2.3. Activity Duration
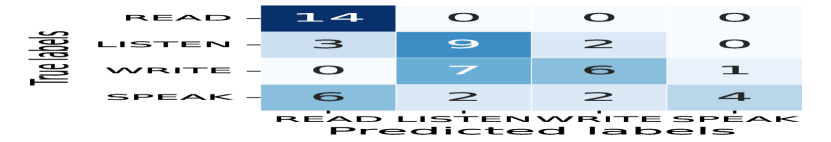
In our collected data, the duration unexpectedly varies. With this not controlled, we expect that ‘duration’ does not impact the effectiveness of the ML model. However, the accuracy increases 10% after adding the ‘duration’ as a feature. Both READ and WRITE are not time-restricted; the duration depends on the individual. But according to Figure 6(a), READ has a 100% True-Positive rate which indicates that READ has a similar duration across participants, while WRITE has more False-Negative results. In contrast, SPEAK has more False-Negative results which are unanticipated. The ‘next’ button only appears after a minimum pre-defined time, thus it should have fewer variants across participants, and so does the LISTEN, which the participants require to listen to audios for around 2:30 to 3 minutes.
The results suggest that IPA ‘duration’ may play a strong role in the user study. This finding informs the refinement of our design: we will encourage duration consistency across tasks by informing users about the expected duration of each IPA, and by showing a timer (but not enforcing termination) to nudge users to complete the activity in time.
4.2.4. Engagement
During our user study, the participants report their engagement score (O’Brien et al., 2018) after completing each IPA. We round the engagement score into integers, thus it is a rank number from 1–5. Intuitively, different engagement levels would be reflected in the physiological signal. However, this should be independent of the actual type of IPA performed by the participants. After adding the ‘engagement’ as a feature, the model increases around 9% accuracy but with a larger CI. As shown in Figure 6(b), engagement slightly increases the True-Positive for READ and SPEAK and the False-positive for READ and LISTEN.
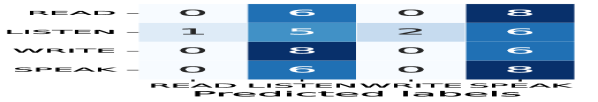
4.2.5. Cumulative Time Spent
In our user study, the whole session is expected to take 1 hour. We minimize the effect of fatigue by starting each section with a relaxing activity and providing a break time in the middle. ‘cumulative_time_spent’ is the cumulative time each participant takes till each IPA. It can be seen as a proxy of fatigue: as users progress through the study, they are more likely to be tired. Adding ‘cumulative_time_spent’ as a feature causes large accuracy drops (22%). The model is shifted toward LISTEN and SPEAK, instead of READ and LISTEN. The confusion matrix in Figure 6(c) shows that ‘cumulative_time_spent’ causes the model to draw a large portion of the decisions on the SPEAK and LISTEN.
Both results for ‘engagement’ and ‘cumulative_time_spent’ are observed to have substantial influences on the model performances. Although we took measures to avoid fatigue by maintaining the sessions short, this result suggests that shorter sessions may be more suitable (e.g., having a longer break between sections). However, further analysis using auxiliary signals – such as eye-blink frequency, average time to eye-closed duration, involuntary hand gestures – will be used to validate whether ‘cumulative_time_spent’ can indeed infer fatigue.
5. Conclusion
In this paper, we have used machine learning and the data collected in a pilot study () as a way to validate the robustness of our experimental design. In particular, we conduct an ablation study to examine the influences of five variables by adding each variable as an additional feature along with the signal features. Based on the preliminary analysis from examining the changes in the model’s classification performances, we can infer whether our experimental design needs further refinement before continuing with the study. Given the exploratory nature of our investigation and small sample size limitations, further research is needed to fully understand the variables’ impacts. But the methodology described in this paper allowed us to reveal the shortcomings in our experimental design early in data collection, and may assist practitioners in validating complex laboratory user study designs in a cost-effective manner.
Acknowledgements.
This research is partially supported by the Sponsor Australian Research Council https://www.arc.gov.au/ (Grant #CE200100005, Grant #DE200100064).References
- (1)
- Arapakis et al. (2009) Ioannis Arapakis, Ioannis Konstas, and Joemon M. Jose. 2009. Using Facial Expressions and Peripheral Physiological Signals as Implicit Indicators of Topical Relevance. In Proceedings of the 17th ACM International Conference on Multimedia (Beijing, China) (MM ’09). Association for Computing Machinery, New York, NY, USA, 461–470. https://doi.org/10.1145/1631272.1631336
- Babaei et al. (2021) Ebrahim Babaei, Benjamin Tag, Tilman Dingler, and Eduardo Velloso. 2021. A Critique of Electrodermal Activity Practices at CHI. In Proceedings of the 2021 CHI Conference on Human Factors in Computing Systems (Yokohama, Japan) (CHI ’21). Association for Computing Machinery, New York, NY, USA, Article 177, 14 pages. https://doi.org/10.1145/3411764.3445370
- Babu et al. (2018) Ashwin Ramesh Babu, Akilesh Rajavenkatanarayanan, James Robert Brady, and Fillia Makedon. 2018. Multimodal Approach for Cognitive Task Performance Prediction from Body Postures, Facial Expressions and EEG Signal. In Proceedings of the Workshop on Modeling Cognitive Processes from Multimodal Data (Boulder, Colorado) (MCPMD ’18). Association for Computing Machinery, New York, NY, USA, Article 14, 7 pages. https://doi.org/10.1145/3279810.3279849
- Bakkialakshmi and Sudalaimuthu (2021) VS Bakkialakshmi and T Sudalaimuthu. 2021. A Survey on Affective Computing for Psychological Emotion Recognition. In 2021 5th International Conference on Electrical, Electronics, Communication, Computer Technologies and Optimization Techniques (ICEECCOT) (Mysuru, India). IEEE, 480–486. https://doi.org/10.1109/ICEECCOT52851.2021.9707947
- Belkin (1980) Nicholas J Belkin. 1980. Anomalous States of Knowledge as a Basis for Information Retrieval. The Canadian Journal of Information Science 5, 1 (1980), 133–143.
- Bota et al. (2019) Patricia J. Bota, Chen Wang, Ana L.N. Fred, and Hugo Placido Da Silva. 2019. A Review, Current Challenges, and Future Possibilities on Emotion Recognition Using Machine Learning and Physiological Signals. IEEE Access 7 (2019), 140990–141020. https://doi.org/10.1109/ACCESS.2019.2944001
- Braithwaite et al. (2013) Jason J. Braithwaite, Derrick G. Watson, Robert Jones, and Mickey Rowe. 2013. A Guide for Analysing Electrodermal Activity (EDA) & Skin Conductance Responses (SCRs) for Psychological Experiments. Psychophysiology 49, 1 (2013), 1017–1034.
- Buscher et al. (2012) Georg Buscher, Andreas Dengel, Ralf Biedert, and Ludger V. Elst. 2012. Attentive Documents: Eye Tracking as Implicit Feedback for Information Retrieval and Beyond. ACM Trans. Interact. Intell. Syst. 1, 2, Article 9 (jan 2012), 30 pages. https://doi.org/10.1145/2070719.2070722
- Cole et al. (2014) Michael J. Cole, Chathra Hendahewa, Nicholas J. Belkin, and Chirag Shah. 2014. Discrimination between Tasks with User Activity Patterns during Information Search. In Proceedings of the 37th International ACM SIGIR Conference on Research and Development in Information Retrieval (Gold Coast, Queensland, Australia) (SIGIR ’14). Association for Computing Machinery, New York, NY, USA, 567–576. https://doi.org/10.1145/2600428.2609591
- Di Lascio et al. (2018) Elena Di Lascio, Shkurta Gashi, and Silvia Santini. 2018. Unobtrusive Assessment of Students’ Emotional Engagement during Lectures Using Electrodermal Activity Sensors. Proc. ACM Interact. Mob. Wearable Ubiquitous Technol. 2, 3, Article 103 (sep 2018), 21 pages. https://doi.org/10.1145/3264913
- Feng et al. (2018) Huanghao Feng, Hosein M Golshan, and Mohammad H Mahoor. 2018. A Wavelet-Based Approach to Emotion Classification Using EDA Signals. Expert Systems with Applications 112 (2018), 77–86. https://doi.org/10.1016/j.eswa.2018.06.014
- Ganapathy et al. (2020) Nagarajan Ganapathy, Yedukondala Rao Veeranki, and Ramakrishnan Swaminathan. 2020. Convolutional Neural Network Based Emotion Classification Using Electrodermal Activity Signals and Time-Frequency Features. Expert Systems with Applications 159 (2020), 113571. https://doi.org/10.1016/j.eswa.2020.113571
- Gao et al. (2020) Nan Gao, Wei Shao, Mohammad Saiedur Rahaman, and Flora D. Salim. 2020. N-Gage: Predicting in-Class Emotional, Behavioural and Cognitive Engagement in the Wild. Proc. ACM Interact. Mob. Wearable Ubiquitous Technol. 4, 3, Article 79 (Sept. 2020), 26 pages. https://doi.org/10.1145/3411813
- Granka et al. (2004) Laura A. Granka, Thorsten Joachims, and Geri Gay. 2004. Eye-Tracking Analysis of User Behavior in WWW Search. In Proceedings of the 27th Annual International ACM SIGIR Conference on Research and Development in Information Retrieval (Sheffield, United Kingdom) (SIGIR ’04). Association for Computing Machinery, New York, NY, USA, 478–479. https://doi.org/10.1145/1008992.1009079
- Hearst (2009) Marti A. Hearst. 2009. Search User Interfaces. Cambridge University Press. https://doi.org/10.1017/CBO9781139644082
- Jannach et al. (2021) Dietmar Jannach, Ahtsham Manzoor, Wanling Cai, and Li Chen. 2021. A Survey on Conversational Recommender Systems. ACM Comput. Surv. 54, 5, Article 105 (may 2021), 36 pages. https://doi.org/10.1145/3453154
- Kelly (2009) Diane Kelly. 2009. Methods for Evaluating Interactive Information Retrieval Systems with Users. Foundations and Trends® in Information Retrieval 3, 1–2 (2009), 1–224. https://doi.org/10.1561/1500000012
- Koelstra et al. (2011) Sander Koelstra, Christian Muhl, Mohammad Soleymani, Jong-Seok Lee, Ashkan Yazdani, Touradj Ebrahimi, Thierry Pun, Anton Nijholt, and Ioannis Patras. 2011. DEAP: A Database for Emotion Analysis Using Physiological Signals. IEEE Transactions on Affective Computing 3, 1 (2011), 18–31. https://doi.org/10.1109/T-AFFC.2011.15
- Kret and Sjak-Shie (2019) Mariska E. Kret and Elio E. Sjak-Shie. 2019. Preprocessing Pupil Size Data: Guidelines and Code. Behavior Research Methods 51 (2019), 1336–1342. https://doi.org/10.3758/s13428-018-1075-y
- Lin et al. (2010) Yuan-Pin Lin, Chi-Hong Wang, Tzyy-Ping Jung, Tien-Lin Wu, Shyh-Kang Jeng, Jeng-Ren Duann, and Jyh-Horng Chen. 2010. EEG-Based Emotion Recognition in Music Listening. IEEE Transactions on Biomedical Engineering 57, 7 (2010), 1798–1806. https://doi.org/10.1109/TBME.2010.2048568
- Lin et al. (2007) Yuan-Pin Lin, Chi-Hong Wang, Tien-Lin Wu, Shyh-Kang Jeng, and Jyh-Horng Chen. 2007. Multilayer Perceptron for EEG Signal Classification during Listening to Emotional Music. In TENCON 2007 - 2007 IEEE Region 10 Conference (Taipei, Taiwan). IEEE, 1–3. https://doi.org/10.1109/TENCON.2007.4428831
- Maithri et al. (2022) M. Maithri, U. Raghavendra, Anjan Gudigar, Jyothi Samanth, Prabal Datta Barua, Murugappan Murugappan, Yashas Chakole, and U. Rajendra Acharya. 2022. Automated Emotion Recognition: Current Trends and Future Perspectives. Computer Methods and Programs in Biomedicine 215 (2022), 106646. https://doi.org/10.1016/j.cmpb.2022.106646
- Marchionini (1995) Gary Marchionini. 1995. Information Seeking in Electronic Environments. Cambridge University Press. https://doi.org/10.1017/CBO9780511626388
- McDuff et al. (2021) Daniel McDuff, Paul Thomas, Nick Craswell, Kael Rowan, and Mary Czerwinski. 2021. Do Affective Cues Validate Behavioural Metrics for Search?. In Proceedings of the 44th International ACM SIGIR Conference on Research and Development in Information Retrieval (Virtual Event, Canada) (SIGIR ’21). Association for Computing Machinery, New York, NY, USA, 1544–1553. https://doi.org/10.1145/3404835.3462894
- Moshfeghi and Jose (2013) Yashar Moshfeghi and Joemon M. Jose. 2013. An Effective Implicit Relevance Feedback Technique Using Affective, Physiological and Behavioural Features. In Proceedings of the 36th International ACM SIGIR Conference on Research and Development in Information Retrieval (Dublin, Ireland) (SIGIR ’13). Association for Computing Machinery, New York, NY, USA, 133–142. https://doi.org/10.1145/2484028.2484074
- Moshfeghi et al. (2016) Yashar Moshfeghi, Peter Triantafillou, and Frank E. Pollick. 2016. Understanding Information Need: An FMRI Study. In Proceedings of the 39th International ACM SIGIR Conference on Research and Development in Information Retrieval (Pisa, Italy) (SIGIR ’16). Association for Computing Machinery, New York, NY, USA, 335–344. https://doi.org/10.1145/2911451.2911534
- Mostafa and Gwizdka (2016) Javed Mostafa and Jacek Gwizdka. 2016. Deepening the Role of the User: Neuro-Physiological Evidence as a Basis for Studying and Improving Search. In Proceedings of the 2016 ACM on Conference on Human Information Interaction and Retrieval (Carrboro, North Carolina, USA) (CHIIR ’16). Association for Computing Machinery, New York, NY, USA, 63–70. https://doi.org/10.1145/2854946.2854979
- O’Brien et al. (2018) Heather L. O’Brien, Paul Cairns, and Mark Hall. 2018. A Practical Approach to Measuring User Engagement with the Refined User Engagement Scale (UES) and New UES Short Form. International Journal of Human-Computer Studies 112 (2018), 28–39. https://doi.org/10.1016/j.ijhcs.2018.01.004
- Rajoub (2020) Bashar Rajoub. 2020. Chapter 3 – Supervised and Unsupervised Learning. In Biomedical Signal Processing and Artificial Intelligence in Healthcare, Walid Zgallai (Ed.). Academic Press, 51–89. https://doi.org/10.1016/B978-0-12-818946-7.00003-2
- Trippas et al. (2020) Johanne R. Trippas, Damiano Spina, Paul Thomas, Mark Sanderson, Hideo Joho, and Lawrence Cavedon. 2020. Towards a Model for Spoken Conversational Search. Information Processing & Management 57, 2 (2020), 102162. https://doi.org/10.1016/j.ipm.2019.102162
- Verma and Tiwary (2014) Gyanendra K. Verma and Uma Shanker Tiwary. 2014. Multimodal Fusion Framework: A Multiresolution Approach for Emotion Classification and Recognition from Physiological Signals. NeuroImage 102 (2014), 162–172. https://doi.org/10.1016/j.neuroimage.2013.11.007
- White (2016) Ryen W. White. 2016. Interactions with Search Systems. Cambridge University Press. https://doi.org/10.1017/CBO9781139525305
- White and Ma (2017) Ryen W. White and Ryan Ma. 2017. Improving Search Engines via Large-Scale Physiological Sensing. In Proceedings of the 40th International ACM SIGIR Conference on Research and Development in Information Retrieval (Shinjuku, Tokyo, Japan) (SIGIR ’17). Association for Computing Machinery, New York, NY, USA, 881–884. https://doi.org/10.1145/3077136.3080669
- Williams (1972) Robert T. Williams. 1972. A Table for Rapid Determination of Revised Dale-Chall Readability Scores. The Reading Teacher 26, 2 (1972), 158–165.
- Wu et al. (2017) Yingying Wu, Yiqun Liu, Ning Su, Shaoping Ma, and Wenwu Ou. 2017. Predicting Online Shopping Search Satisfaction and User Behaviors with Electrodermal Activity. In Proceedings of the 26th International Conference on World Wide Web Companion (Perth, Australia) (WWW ’17 Companion). International World Wide Web Conferences Steering Committee, Republic and Canton of Geneva, CHE, 855–856. https://doi.org/10.1145/3041021.3054226
- Xue et al. (2023) Tong Xue, Abdallah El Ali, Tianyi Zhang, Gangyi Ding, and Pablo Cesar. 2023. CEAP-360VR: A Continuous Physiological and Behavioral Emotion Annotation Dataset for 360∘ VR Videos. IEEE Transactions on Multimedia 25 (2023), 243–255. https://doi.org/10.1109/TMM.2021.3124080
- Zhai et al. (2005) Jing Zhai, A.B. Barreto, C. Chin, and Chao Li. 2005. Realization of Stress Detection using Psychophysiological Signals for Improvement of Human-Computer Interactions. In Proceedings. IEEE SoutheastCon, 2005. (Ft. Lauderdale, FL, USA). IEEE, 415–420. https://doi.org/10.1109/SECON.2005.1423280