A model of surface roughness effect on triboelectric charging of particles
Abstract
Tribocharging increases due to deformation and penetration of surface asperities, enlarging the real contact area. These experimental results translate into a theoretical description of particle charging that resolves the surface topology. Based on these findings, we propose a model that predicts the dependence of the particles’ saturation charge on the impact velocity and surface roughness.
I Introduction
In industry, triboelectrification causes disruption of production by the formation of wall deposits that are created by the accumulated charge on powder particles [1] or can cause explosions when accumulated charge suddenly releases in the form of brush discharge or propagating brush discharge which has enough energy to be an ignition source [2].
Recently, triboelectric nanogenerators have been developed to harness mechanical energy from human motion, wind, and the sea [3, 4].
The fundamental charge transfer is well described on the nano-scale, where the elementary charge is transferred directly or via ions. However, conclusions of such fundamental descriptions often do not hold on the macroscopic level. For example, the macroscopic condenser model is derived from the fundamental difference in work functions of contacting materials. However, although it is a material property, in practice, this fundamental value is often used as a fitting parameter. This approach thus creates large sets of parameters that are valid only for specific experimental conditions. The surface roughness has been suspected to significantly affect the triboelectric charging for a long time; however, minimal effort was put into the description of the surface topology, and the latest reviews, and articles call for the description of surface roughness [5, 6, 7, 8, 9]. The description of mesoscopic surface roughness eliminates the empirical correlations and connects the effect of surface roughness and impact velocity on nominally flat surfaces on the saturation charge of particles. At the particle (i.e., macroscopic) level, the saturation charge is believed to be independent of the impact velocity [10]. However, several papers published opposite results [11, 12, 13, 14]. Such contradiction can be explained by the inclusion of surface roughness into charging models, where surface roughness will prevent the charge transfer from the complete contact area of the particle. To support our claim, we developed a model describing surface roughness’s effect on the saturation charge based only on morphological and elastic properties. We used it to describe and to capture several effects without any need for altering the material properties.
II Model
We model the common experimental setup: particle impacting a smooth plane in the normal direction. During this collision, the charge is exchanged between the particle and the plane, and net charge transfer is subsequently measured on the particles. Since the charge transfer can occur only at the contact patch or at a distance at which electrons can tunnel ( 10 nm), estimating the real contact area is crucial for accurately predicting the magnitude of triboelectric charging. We describe the surface roughness by discrete asperities deposited on the particle. Our model assumes that asperity 1) is independent of each other, 2) has a spheroid shape, 3) the semiaxis is normally oriented to the surface, 4) is randomly uniformly distributed, and 5) is deposited on the smooth core particle. This means that the roughness of particles is modeled through one smooth core particle and many small smooth spheroids attached to the core particle. Spheroids were preferred over spherical asperities because they better mimic naturally occurring surfaces on polymer particles, which are nascent PE particles ( 970 kg ).
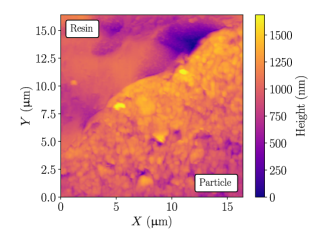
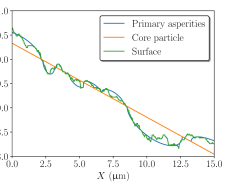
The first step is to capture the surface roughness and its properties. In order to extract the majority of topological information, the AFM (Bruker’s Dimension Icon) was used, see Fig. 1. The extracted topology was approximated with the mean of the surface, and the mean spheroids were deposited to minimize the total error (see Fig. 1 for illustration). As we show later, the first layer of spheroids was sufficient to capture the main trends in triboelectric charging. In principle, more layers of spheroids can be added to better capture the fractal nature of roughness, but this would introduce significant constraints. Sampling the surface on several spots produced a distribution of asperity characteristics (heights, width, and surface number density). Theses distributions were further used to model the particle with the same distribution of asperities as the real particle, namely the average roughness and root mean square roughness are kept close to the real surface (15%).
The second step is to describe the contact mechanics of asperity. Since we assumed that the core particle is smooth and asperities are deposited normally on its surface, each center of asperity can be tracked simply with two angles () in a spherical coordinate system of the core particle. With the assumption of independence of each asperities, we can easily define contact forces of individual asperity since, according to the Greenwood-Williamson model, each summit of asperity that is above the separation distance is compressed by where is the asperity height. Therefore each asperity has a contact area of where is the radius of contact on the ith asperity. The required force is . In principle, since each asperity is independent, we have relatively free choice over the description of the model for contact force. We approximated the contact force with linear force model , where strain is defined as , and is the effective Young modulus. We chose to preserve the discreteness of the model to retain the ability to describe the effect of asperity properties randomness on the charging and the arbitrary shape of asperities. Hence, each asperity is characterized by its position on the surface (), its semiaxes (), representing the height and width, and elastic properties (), where is the Poisson ratio. are randomly generated from a distribution obtained from the topological evaluation of a real particle.
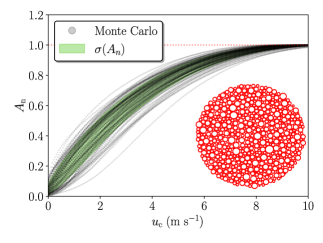
The third step includes an optional information reduction for large-scale models based on hard-sphere models. In those models, simulations of millions of multielement particles are not feasible, and neither is resolving each collision. Therefore, the collision mechanics of rough particles need to be simplified into a function of collision velocity. Such a function can be obtained by simulation of a few multielement particle collisions and extracting the averages of the maximal surface, thus creating a contact area – impact velocity function (through Monte-Carlo simulations). The maximal surface during collision is calculated from the minimum separation distance; the sum of contact areas of asperities at a given separation distance is compared with the sum of maximal contact areas of asperities in the contact region. Hence we define normalized accesible surface for charge transfer as , where and is the maximal peneteration of i-th asperity during collison. Such an approach limits the from 0 to 1, where 0 is in the case when no asperities are compressed. The case represents completely compressed asperities at the contact region (see Fig. 2)
The last model step is the implementation of charging models. Such a defined contact area can be used in both dynamic and equilibrium models. The key part of the model is that it only alters the contact surface. Hence any model which uses a smooth contact area can be modified by multiplying the smooth area with . The effect of impact velocity on the saturation charge of rough particles for the condenser model can be captured as follows:
| (1) |
where is the proportionality constant in the case of ideal condenser model , is the surface area of a smooth sphere, and are the permittivities of free space and relative permittivity respectively, is the minimum distance between surfaces at which charge transfer can occur approximately 10 nm.
III Validation
The validation of this model proved difficult because not enough experimental data has been published. Nevertheless, we were able to validate the model on the effect of normal impact velocity () in the specific range, and the effect of root mean square roughness () coupled with the elastic properties ().
Increased charging at elevated impact velocity is a well-described phenomenon [11, 12, 13, 14]. On the other hand, at the high impact velocity, a particle’s saturation (equilibrium) charge is independent of the impact velocity [10]. We argue that the reason for such observations is that at low impact velocity, only a few asperities are in contact with the other surface, which limits the area where charge transfer can occur. When the impact velocity is increased, the ratio of asperities in contact will increase because the colliding surface will penetrate more. Such an increase in real contact is expected up to the point where all asperities at the contact area are entirely deformed. At that point, the maximal value of the collision surface area is reached, and this region is independent of the impact velocity, which is in agreement with measurements of Watanabe et al. [10].
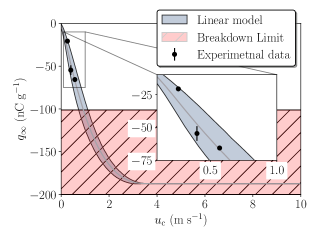
Our experimental dataset [15] was used to validate the model; we chose our dataset because we can evaluate the morphology of particles. Similar experimental observations were made by Liao et al. [16], reporting a linear relation between saturation charge and vibrating velocity. However, they do not report a surface roughness of particles, thus preventing us from using their data for validation. We had to use one fitting parameter equivalent to an effective work function to calibrate our model, the topology was evaluated via AFM. Since the lowest relative error was at the highest impact velocities, we used this data point to estimate this constant. The model has a good quantitative agreement with experimental data (see Fig. 3). However, our experimental setup cannot achieve a larger impact velocity than 0.57 m/s; therefore, limiting the model validation only to the linear section. In the atmospheric condition, we expect that the charge will become limited by dielectric breakdown [17, 18] before all asperities can be deformed. Therefore in our experimental setup (vertically vibrated particulate bed), we expect a linear relationship between saturation charge and impact velocity up to the point where the dielectric breakdown limits the charge; beyond this point, the saturation charge is suddenly independent of the impact velocity. This point occurs approximately when only 1/2 of the asperities are deformed. Therefore the description of the contact mechanics needs to be valid only up to this deformation.
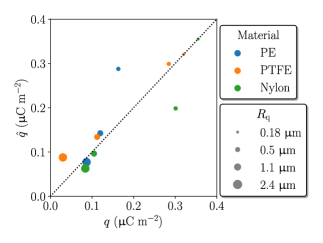
The second data set on which we were able to validate the model is by Wang et al. [19]. In their paper, a glass surface was normally pressed against four materials (PE, PTFE, Nylon, and Al) of various roughness; after separation, the charge on the glass was measured. This experimental setup differs from our model setup, which simulates a particle normally colliding with the wall. However, we can assume that the contact surface would be a unit surface, and thus the transferred charge would have units of C . The pressure used during the contact was not reported, but we assumed that it was the same for all material pairs. Considering that we also have to estimate the contact potentials of the material pairs, we used the experimental data of the smoothest samples to calibrate the contact potentials and contact pressure. The model prediction is in a good agreement with the experimental data except for outliners of PE and Nylon of 0.5 m (Fig. 4). We used the Young modulus of 500 MPa, 600 MPa, and 3000 MPa for PE, PTFE, and Nylon, respectively. The model prediction and experimental data showed that surface roughness affects the charge transfer more strongly than elastic properties. We should note that in the dataset of Wang et al. [19], the glass is also contacted with an Al material, but our model is not able to capture observed trends. One of the reasons for it is that our model assumes that the charge only directly at the contact points can be transferred and thus must be trapped by the high resistivity of the material, which in the case of conductive Al is not a valid assumption.
IV Conclusions
We have shown that the surface roughness effect on the triboelectric/contact charging can be modeled with a similar approach as commonly used in the field of tribology. The well-established Greenwood & Williamson model inspires the model, but we kept the discreteness of the surface roughness. This allowed us to impose fewer restrictions on the model at the cost of increased computational cost but gave us more freedom in the description of the contact mechanics. The independence of the asperities on each other means that the contact mechanics model is not limited to the linear model. For materials where the linear model is not suitable, other models can be used as long as contact mechanics of a single isolated asperity can be described.
The model uses a few inputs that are readily obtainable: standard metrics (,), and information about the shapes of the asperities. Those can be obtained either by AFM or aggregated from measurements of a profilometer, where the profile is reconstructed with spheroids, and the distribution of height and width, and surface number density of those spheroids is used in the model.
The model was validated on two datasets, one of which is our dataset. Nevertheless, we showed that the model does capture the linear dependency of saturation/equilibrium charge for low-impact velocity, and we showed that the effect of surface roughness could be predicted with our model. The validation of the model for those conditions shows that the apparent contact area during collision is an important parameter for charging. Thus using this model helps to unify the experimental observations and improve the further understanding of triboelectric charging.
V Acknowladgement
This project has received funding from the European Research Council (ERC) under the European Union’s Horizon 2020 research and innovation programme (grant agreement No. 947606 PowFEct) and Dutch Polymer Institute (DPI) from project No. 830.
References
- Hendrickson [2006] G. Hendrickson, Electrostatics and gas phase fluidized bed polymerization reactor wall sheeting, Chem. Eng. Sci. 61, 1041 (2006).
- OHS [2017] Brush and propagating brush discharges on insulating sheets in contact with a grounded conductor, J. Electrostat. 88, 171 (2017), special Issue on The International Conference on Electrostatics, Electrostatics 2017.
- Rathore et al. [2018] S. Rathore, S. Sharma, B. P. Swain, and R. K. Ghadai, A critical review on triboelectric nanogenerator, IOP Conf. Ser.: Mater. Sci. Eng. 377, 012186 (2018).
- Walden et al. [2022] R. Walden, C. Kumar, D. M. Mulvihill, and S. C. Pillai, Opportunities and challenges in triboelectric nanogenerator (teng) based sustainable energy generation technologies: A mini-review, Adv. Chem. Eng. 9, 100237 (2022).
- Lacks and Sinbrot [2019] D. J. Lacks and T. Sinbrot, Long-standing and unresolved issues in triboelectric charging, Nat. Rev. Chem. 3, 465 (2019).
- Shuaihang and Zhinan [2019] P. Shuaihang and Z. Zhinan, Fundamental theories and basic principles of triboelectric effect: A review, Friction 7, 2 (2019).
- Chowdhury et al. [2021] F. Chowdhury, M. Ray, A. Sowinski, P. Mehrani, and A. Passalacqua, A review on modeling approaches for the electrostatic charging of particles, Powder Technol. 389, 104 (2021).
- Grosshans and Jantač [2023] H. Grosshans and S. Jantač, Recent progress in CFD modeling of powder flow charging during pneumatic conveying, Chem. Eng. J. 455, 140918 (2023).
- Grosjean and Waitukaitis [2023] G. Grosjean and S. Waitukaitis, Single-collision statistics reveal a global mechanism driven by sample history for contact electrification in granular media, Phys. Rev. Lett. 130, 098202 (2023).
- Watanabe et al. [2007] H. Watanabe, M. Ghadiri, T. Matsuyama, Y. L. Ding, K. G. Pitt, H. Maruyama, S. Matsusaka, and H. Masuda, Triboelectrification of pharmaceutical powders by particle impact, Int. J. Pharm. 334, 149 (2007).
- Hansen et al. [2020] L. Hansen, A. Wollmann, M. Weers, B. Benker, and A. P. Weber, Triboelectric charging and separation of fine powder mixtures, Chem. Eng. Technol. 43, 933 (2020).
- Lesprit et al. [2021] U. Lesprit, T. Paillat, N. Zouzou, A. Paquier, and M. Yonger, Triboelectric charging of a glass bead impacting against polymers: Antistatic effects in glass/pu electrification in a humidity-controlled environment, J. Electrostat. 113, 103605 (2021).
- Schwindt et al. [2017] N. Schwindt, U. von Pidoll, D. Markus, U. Klausmeyer, M. Papalexandris, and H. Grosshans, Measurement of electrostatic charging during pneumatic conveying of powders, J. Loss Prev. Process Ind. 49, 461 (2017).
- Cole et al. [1969] B. N. Cole, M. R. Baum, and F. R. Mobbs, An investigation of electrostatic charging effects in high-speed gas-solids pipe flows, P. I. Mech. Eng. C. Pro. 184, 77 (1969).
- Jantač et al. [2019] S. Jantač, L. Konopka, and J. Kosek, Experimental study of triboelectric charging of polyethylene powders: Effect of humidity, impact velocity and temperature, Adv. Powder. Technol. 30, 148 (2019).
- Liao et al. [2011] C.-C. Liao, S.-S. Hsiau, and T.-Y. Huang, The effect of vibrating conditions on the electrostatic charge in a vertical vibrating granular bed, Powder Technol. 208, 1 – 6 (2011).
- Matsuyama and Yamamoto [1997] T. Matsuyama and H. Yamamoto, Charge-relaxation process dominates contact charging of a particle in atmospheric condition: II. the general model, J. Phys. D 30, 2170 (1997).
- Matsuyama and Yamamoto [2010] T. Matsuyama and H. Yamamoto, Maximum electrostatic charge of powder in pipe flow, Adv. Powder. Technol. 21, 350 (2010).
- Wang et al. [2019] A. E. Wang, I. Greber, and J. C. Angus, Contact charge transfer between inorganic dielectric solids of different surface roughness, J. Electrostat. 101, 103359 (2019).