Young but fading radio sources: searching for remnants among compact steep-spectrum radio sources
Abstract
The incidence of young but fading radio sources provides important information on the life cycle of radio emission in radio-loud active galactic nuclei. Despite its importance for constraining the models of radio source evolution, there are no systematic studies of remnants in complete samples of young radio sources. We report results on the study of 18 compact steep-spectrum (CSS) radio sources, selected from the statistically complete B3-VLA CSS sample, characterized by a steep optically-thin spectrum () and no core detection in earlier studies. Our deep multi-frequency Very Large Array (VLA), pc-scale Very Long Baseline Array (VLBA), and eMERLIN observations allowed us to locate the core component in 10 objects. In 3 CSS sources there is no clear evidence of present-time active regions, suggesting they are likely in a remnant phase. Among sources with core detection, we find 3 objects that have no clear active regions (hotspots) at the edges of the radio structure, suggesting that the radio emission may have just restarted. Our results support a power-law distribution of the source ages, although the poor statistics prevents us from setting solid constraints on the percentage of remnants and restarted sources in sub-populations of radio sources.
keywords:
radio continuum: general - galaxies: active - radiation mechanisms: non-thermal1 Introduction
Understanding how radio emission originates and evolves in
extragalactic radio sources is one of the
greatest challenges faced by modern astrophysics.
The improvement in sensitivity recently achieved at radio wavelengths,
together with the availability of multi-band information from infrared
to gamma-ray observations is allowing a major step forward in our
understanding of
the physics of radio sources and the global properties of their host
galaxies.
It appears that radio-loud active galactic nuclei (AGN) represent
only a small fraction (about 10 per cent) of the total population of
their host galaxies, suggesting that radio emission may be a
transient phase in the lives of these systems.
The typical duration of the active phase is 107-8 yr, much shorter than
the age of the host galaxy
(Parma et al., 2007; Orrú et al., 2010; Harwood et al., 2017). Detection of dying radio emission
implies that at some point the injection of relativistic plasma switches
off and the radio emission rapidly fades due to energy losses
(Komissarov & Gubanov, 1994; Murgia et al., 1999, 2011; Hardcastle, 2018). For this reason, search for remnants
is not an easy task in flux-density-limited catalogs
(e.g. Slee et al., 2001; Parma et al., 2007), and many relics have been discovered
serendipitously (e.g. Brienza et al., 2016; Randriamanakoto, Ishwara-Chandra & Taylor, 2020).
After the radio emission has switched off, it is possible that a second
epoch of radio activity starts. If the time elapsed is
comparable, or longer than the radiative time of the outer lobes,
only the new emission could be visible
precluding us to identify the radio source as a restarted object.
On the other hand, if the time elapsed between
two consecutive episodes of radio emission is about 10 per cent of the
total source age,
we observe double-double
radio sources (e.g., Lara et al., 1999; Schoenmakers et al., 2000; Konar et al., 2006).
Radio sources
showing more than two activity periods are very rare
(Brocksopp et al., 2007; Hota et al., 2011; Singh et al., 2016). However, remnants and restarted
objects are key to understand the life cycle of the radio emission and
how active and quiescent periods are interleaved (Morganti, 2017).
Systematic studies of remnants and restarted sources have been
recently boosted mainly at low frequencies,
thanks to the availability of high-sensitivity
deep-field observations
(e.g. Saripalli et al., 2012; Hardcastle et al., 2016; Brienza et al., 2017; Godfrey, Morganti & Brienza, 2017; Mahatma et al., 2018; Hardcastle et al., 2019; Mahatma et al., 2019; Jurlin et al., 2020; Morganti et al., 2021; Jurlin et al., 2021). The
relatively high fraction of remnants and restarted objects found in
these works requires a dominant population of short-lived radio
sources (Shabala et al., 2020).
There are indications that a significant fraction of compact steep spectrum
(CSS) and peaked spectrum (PS) sources,
which are radio sources in an early
evolutionary stage (see e.g. O’Dea & Saikia, 2021) will
not be able to evolve into classical extended radio galaxies. First,
there is a count excess of CSS/PS sources in flux-limited
samples, which cannot be explained even when
luminosity evolution is taken into account
(e.g. O’Dea & Saikia, 2021). Secondly,
the age distribution estimated in a sample of CSS/PS sources peaks
below 500 yr (Gugliucci et al., 2005). Finally, the fast evolution of the
radio spectrum that we
observe in some PS candidates suggests that not all the objects would
become classical Fanaroff-Riley radio sources (Orienti & Dallacasa, 2020).
To explain these short-lived
objects, Czerny et al. (2009) suggested
a radiation pressure instability scenario which may cause an
intermittent activity of the central
engine: outbursts of radio emission,
with a duration of 103-4 years,
repeat regularly every 105-6
years. The detection of quasars that have
transitioned from radio-quiet to radio-loud state on decadal time,
may provide another indication that intermittent episodes of
short-lived radio emission may be common in AGN (Nyland et al., 2020).
Extended arcsecond scale radio emission (i.e. tens to hundred kpc and
ages of 107-8 yr)
likely associated with young radio sources has been found only in a handful
of PS objects (Stanghellini et al., 2005; Tinti et al., 2005).
However, the discovery of relics from previous
radio activities at parsec-scale
distance from the young radio sources J1511+0518 (Orienti & Dallacasa, 2008), and
OQ 208 (Luo et al., 2007), suggests that the intermittency of short-lived active
phases may have duty cycles of the order of 103-4 yr.
If the distribution of the source age follows a power-law as
suggested by Shabala et al. (2020), one would expect a larger incidence of
remnants among compact symmetric objects (CSOs), i.e. sources with
linear size (LS) 1 kpc, rather than
middle-sized symmetric objects (MSOs), i.e. objects with 1 kpc
LS20 kpc111For details on the populations of
CSOs and MSOs see the review by O’Dea & Saikia (2021).
So far, not many studies searching for young but dying objects have
been carried out (e.g., Kunert-Bajraszewska & Marecki, 2007), and only a handful of young but
fading sources are known (e.g., Orienti, Murgia & Dallacasa, 2010; Callingham et al., 2015; O’Sullivan et al., 2021).
In this paper we aim at inferring, for the first time, the fraction of
remnants in a complete sample of CSS
radio sources. This will allow us to investigate the
incidence of short-lived objects and to shed a light on the life cycle
of the radio emission in its early evolutionary stages after the outburst.
Multi-frequency very large array (VLA), very long baseline array
(VLBA), and eMERLIN observations of the target sources were performed
in order to constrain the synchrotron radio spectrum and unveil the
presence of active cores that may have been missed in previous
observations with lower sensitivity.
The paper is organized as follows: in Section 2 we present the source
sample, in Section 3 we describe the radio
observations. Results are presented in Section 4 and discussed in
Section 5. In Section 6 we draw our summary.
Throughout this paper, we assume the following cosmology: ,
and ,
in a flat Universe. The spectral index
is defined as
.
2 The sample
To look for young but fading sources we constructed a complete sample
of candidate remnants from the B3-VLA CSS sample (Fanti et al., 2001).
The B3-VLA CSS sample consists of 87 CSS/PS sources with
flux density 0.8 Jy at 0.4 MHz, a steep radio spectrum
(),
and an angular size 2 arcsec (i.e. linear size
20 kpc).
Multi-frequency VLA and VLBA
observations were performed to study the radio structure:
25 out of the 87 sources of the sample with largest angular scale
(LAS) 0.25 arcsec were
target of VLBA observations (Dallacasa et al., 2002a; Orienti et al., 2004), whereas the
remaining 62 sources were target of VLA, EVN and
MERLIN observations (Fanti et al., 2001; Dallacasa et al., 2002b; Rossetti et al., 2006).
Among the sources of the B3-VLA CSS sample we selected all the objects
with a spectral index 1.0
and without any core detection in
earlier observations (Fanti et al., 2001; Dallacasa et al., 2002a, b; Orienti et al., 2004; Rossetti et al., 2006).
We end up with a sample of 18 CSS sources: 6 with LAS0.25 arcsec, and
12 with LAS0.25 arcsec.
The former were target of VLBA observations
while
the latter of VLA observations.
For 6 of them we also got high-resolution eMERLIN
observations.
We complement our observations with
archival high angular resolution VLA observations
already published in
Fanti et al. (2001) and Rossetti et al. (2006).
The source sample and the source properties are
reported in Table 1222We still consider MSOs the
three sources with LS between 20 and 30 kpc..
| Source Name | ID | z | S4.8GHz | LAS | LS | Ref. | ||
|---|---|---|---|---|---|---|---|---|
| mJy | mJy | arcsec | kpc | |||||
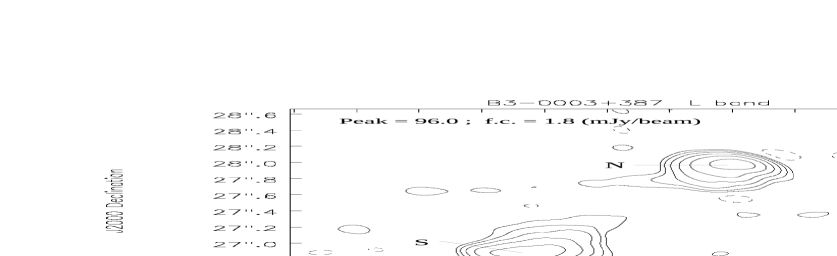
| B3-0003+387 | G | 1.47 | 52.8 | 22.4 | 1.4 | 1.3 | 11.2 | 1 |
| B3-0034+444 | G | 2.79 | 187.7 | 96.5 | 1.0 | 3.2 | 25.6 | 2 |
| B3-0128+394 | G | 0.929 | 128.9 | 42.8 | 1.1 | 2.7 | 21.5 | 3 |
| B3-0140+387 | G | 2.9p | 71.0 | 27.5 | 1.5 | 0.7 | 5.5 | 2 |
| B3-0748+413BaaSource re-classified as a large symmetric object. | E | - | 42.5 | 23.4 | 1.2 | 0.4 | 3.2 | - |
| B3-0754+396aaSource re-classified as a large symmetric object. | G | 2.119 | 143.1 | 74.7 | 1.1 | 2.2 | 19.6 | 2 |
| B3-0810+460B | G | 0.620 | 466.4 | 153.9 | 1.1 | 0.63 | 4.3 | 4 |
| B3-0856+406 | G | 2.285 | 37.8 | 14.0 | 1.5 | 0.8 | 6.7 | 5 |
| B3-1016+443 | G | 0.7p | 80.1 | 39.3 | 1.2 | 0.11 | 0.7 | 6 |
| B3-1039+424aaSource re-classified as a large symmetric object. | E | - | 66.2 | 32.3 | 1.1 | 1.5 | 12.2 | - |
| B3-1049+384 | G | 1.018 | 200.6 | 104.9 | 1.1 | 0.1 | 0.8 | 7 |
| B3-1133+432 | E | - | 499.1 | 286.3 | 1.0 | 0.07 | 0.5 | - |
| B3-1143+456 | G | 0.762 | 137.1 | 64.7 | 1.4 | 0.8 | 6.0 | 8 |
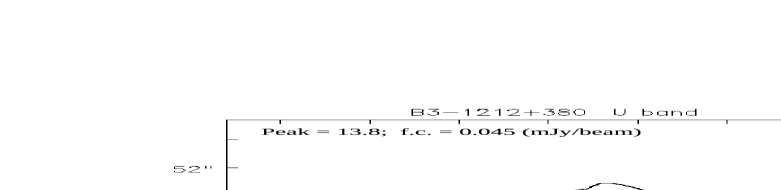
| B3-1212+380 | G | 0.947 | 63.8 | 33.3 | 1.2 | 0.3 | 2.4 | 9 |
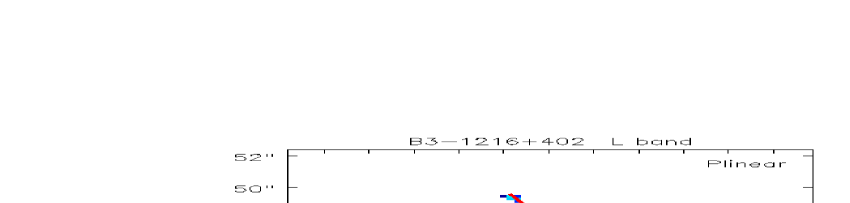
| B3-1216+402 | G | 0.756 | 161.6 | 61.5 | 1.0 | 3.8 | 28.3 | 8 |
| B3-1225+442 | G | 0.348 | 96.3 | 45.7 | 1.2 | 0.2 | 1.0 | 10 |
| B3-1340+439 | E | - | 130.4 | 67.0 | 1.2 | 0.07 | 0.5 | - |
| B3-1449+421 | G | 0.86p | 147.4 | 66.5 | 1.6 | 0.08 | 0.6 | 11 |
3 Radio observations
3.1 VLA observations
Multi-frequency VLA observations of the 12 CSS sources
with LAS0.25 arcsec (LS 1 kpc)
were carried out during four runs between 2015 and 2017 (Table
2).
Observations were performed in L (12 GHz) and S
(24 GHz) bands with the array in A-configuration, while
observations in U band (1315 GHz)
were performed with the array in B-configuration. The average angular
resolution is about 1.2 arcsec, 0.6 arcsec, and 0.5
arcsec in L, S, and U bands, respectively.
L-band observations have a bandwidth of 1 GHz, whereas
observations in S and U bands have a bandwidth of 2 GHz.
In each frequency band the bandwidth was
divided into 16 spectral windows. Depending on the local sidereal time
range of
the observing runs, either 3C 48 or 3C 286 was used as
primary, band pass, and electric vector position angle (EVPA) calibrator.
Each source was
observed for about 8 min per frequency. Secondary calibrators were
chosen to minimize the antenna slewing. In two observing runs (15A-140
in L and S bands, and 16B-107 in U
band) we observed as secondary calibrators J0713+4349 and J0111+3906,
respectively, which we also used as leakage (D-term) calibrators.
Calibration was performed using the CASA software
(McMullin et al., 2007)
following
the standard procedure for the VLA. Parts of L and S bands were highly
affected by RFI. In particular in L band we had to fully
flag some spectral windows.
Errors on the amplitude calibration are conservatively 3 per cent in
L and U bands, and 5 per cent in S band.
After the a-priori calibration,
imaging was done with the CASA task TCLEAN. When
other objects were present in the field of view, mainly in L-band, we
made use of the task CLEAN which allows imaging with several
phase centers.
Few iterations of imaging and self-calibration were performed before
creating the final images, which were produced with Briggs weighting
and using Multi-frequency synthesis algorithm with 2 Taylor
terms. Flux
densities were measured using the CASA task IMFIT
which performs a Gaussian fit on the image plane. If the source (source
components) could not be fitted by a Gaussian, we extracted the flux
density on a selected polygonal area using the CASA task
VIEWER.
In Table 3 we report the flux densities at 1.4, 3 and 14
GHz. To maximize the spectral coverage, we produced an image
for each spectral window (see Section 4.1). Errors on the
flux densities are estimated by ,
where is the uncertainty on the
amplitude calibration, is the error on the Gaussian
fit, and is the
1- noise level measured on the image plane, which is
, where is the source area,
and is the area of the Gaussian restoring beam.
Final images of the CSS sources are presented in Fig. A1, while
images of the sources falling within the VLA field
of view showing a resolved structure are presented in
Fig. B1. Properties of field sources are reported in Table B1.
| Date | Project | Array | Band | Polarization |
|---|---|---|---|---|
| 2015-02-15 | 15A-140 | VLA-B | U | Y |
| 2015-08-14 | 15A-140 | VLA-A | L,S | N |
| 2017-01-06 | 16B-107 | VLA-A | L,S | Y |
| 2017-10-19 | 17B-153 | VLA-B | U | N |
| 2010-12-31 | BO038A | VLBA | C,X | N |
| 2011-01-16 | BO038C | VLBA | C,X | N |
| 2011-01-21 | BO038B | VLBA | C,X | N |
| 2020-08-03/09 | CY10208 | eMERLIN | L,C | N |
| Source | Comp. | S1.4 | S3 | S14 | |
|---|---|---|---|---|---|
| (1) | (2) | (3) | (4) | (5) | (6) |
| B3-0003+387 | N | 262.8 7.9 | 114.53.4 | 11.30.4 | 1.50.1 |
| S | 227.0 6.8 | 108.83.3 | 12.40.4 | 1.40.1 | |
| Tot | 487.414.6 | 214.66.4 | 23.40.7 | 1.40.1 | |
| B3-0034+444 | N | 581.817.5 | 314.39.4 | 56.11.7 | 1.10.1 |
| S | 99.16.0 | 26.40.8 | 2.00.1 | 1.70.1 | |
| A | - | 243.67.5 | 51.81.5 | 1.10.2 | |
| B | - | 45.12.7 | 4.80.2 | 1.60.2 | |
| C | - | 9.31.7 | 1.10.2 | 1.40.2 | |
| D | - | 17.82.0 | 1.00.2 | 1.90.2 | |
| Tot | 707.821.2 | 347.610.4 | 58.11.7 | 1.20.1 | |
| B3-0128+394 | N | 173.2 5.4 | 86.44.0 | 13.40.5 | 1.20.1 |
| S | 163.05.1 | 75.54.0 | 11.20.6 | 1.20.1 | |
| Tot | 334.310.0 | 162.14.9 | 25.00.8 | 1.20.1 | |
| B3-0140+387 | N | - | 90.62.7 | 6.30.2 | 1.70.1 |
| S | - | 77.22.3 | 7.90.3 | 1.50.1 | |
| Tot | 450.213.6 | 167.15.0 | 14.00.4 | 1.60.1 | |
| B3-0748+413B | N | 200.36.1 | 83.54.4 | 13.60.5 | 1.20.1 |
| C | 2.90.2 | 1.50.3 | 0.70.1 | 0.60.1 | |
| S | 20.51.2 | 9.10.7 | 2.60.2 | 0.90.2 | |
| Tot | 231.77.0 | 94.14.9 | 17.60.5 | 1.10.1 | |
| B3-0754+396 | N | 525.715.8 | 247.813.1 | 45.71.4 | 1.10.1 |
| S | 7.8 0.3 | 3.40.3 | 0.50.1 | 1.20.1 | |
| Tot | 533.516.0 | 251.213.3 | 46.21.5 | 1.10.1 | |
| B3-0810+460B | N | - | 216.110.8 | 35.01.1 | 1.20.1 |
| S | - | 276.613.8 | 54.91.6 | 1.10.1 | |
| Tot | 1146.534.3 | 492.724.6 | 90.92.8 | 1.10.1 | |
| B3-0856+406 | E | - | 54.33.1 | 4.20.2 | 1.70.1 |
| W | - | 26.31.5 | 3.80.2 | 1.30.1 | |
| Tot | 225.5 6.8 | 80.64.5 | 7.70.3 | 1.60.1 | |
| B3-1039+424 | N | 7.50.5 | 2.70.3 | 0.40.1 | 1.30.1 |
| C | 0.20.1 | 0.150.03 | 0.050.02 | 0.40.7 | |
| S | 273.68.2 | 118.26.5 | 17.80.6 | 1.30.1 | |
| Tot | 281.18.4 | 120.96.6 | 18.00.6 | 1.30.1 | |
| B3-1143+456 | N | - | 45.82.6 | 4.20.2 | 1.60.1 |
| S | - | 230.812.0 | 27.80.8 | 1.40.1 | |
| Tot | 693.623.8 | 276.613.8 | 31.81.1 | 1.50.1 | |
| B3-1212+380 | Tot | 304.6 9.1 | 121.66.1 | 17.50.6 | 1.30.1 |
| B3-1216+402 | N | 155.34.7 | 71.54.0 | 14.40.4 | 1.10.1 |
| S | 211.46.3 | 107.25.4 | 22.30.7 | 1.00.1 | |
| Tot | 364.310.9 | 178.79.0 | 37.21.1 | 1.00.1 |
3.2 VLBA observations and data reduction
VLBA observations in C and X bands of the CSS sources with LAS0.25 arcsec
were carried out between 2010 December and 2011 January in dual
polarization (Table 2) at 32-MHz bandwidth, with the
exception of B3-1133+432 (both bands) and B3-1049+384 (C band only)
whose data were already published in Orienti et al. (2004).
Each source was observed for about 2 hr spread into twelve 10-min scans.
No fringes were detected for B3-1225+442 in C band.
Calibration and data reduction were performed following the standard
procedures described in the Astronomical Image Processing System
(AIPS) cookbook. J0927+3902 was used to generate the band pass
correction. Amplitudes were calibrated using antenna system
temperatures and antenna gains.
Uncertainties on the amplitude calibration are
approximately 10 per cent at both frequencies.
Images were produced in AIPS with the task IMAGR.
Few iterations of imaging and phase-only self-calibration were
performed before producing final images. In addition to
full-resolution images, we produced a set of images in C and X bands
with the same uv-range, beam size, and pixel size, with the aim of
computing the spectral index.
Flux densities were measured
using TVSTAT in AIPS which allows the selection of a
polygonal region on the image plane. VLBA images are shown in
Fig. A2, while flux densities and spectral indexes are
reported in Table 4. Errors on the flux density are
computed using the formula reported in Section
3.1, while errors on the spectral index are computed
assuming the error propagation theory.
| Name | Comp. | S4.8 | S8.3 | |
|---|---|---|---|---|
| mJy | mJy | |||
| B3-1016+443 | N | 45.44.6 | 18.71.9 | 1.60.3 |
| S | 6.61.0 | - | - | |
| Tot | 52.05.2 | 18.71.9 | - | |
| B3-1049+384 | W1 | 74.67.5 | 33.93.4 | 1.30.3 |
| W2 | 83.88.4 | 51.55.2 | 0.90.3 | |
| C | 15.11.5 | 19.01.9 | -0.40.3 | |
| E | 4.20.5 | 2.20.3 | 1.20.3 | |
| Tot | 180.718.1 | 106.610.7 | 1.00.3 | |
| B3-1225+442 | W1A | - | 7.10.7 | 0.10.1 |
| W1B | - | 2.40.2 | 0.60.1 | |
| E | - | 8.61.0 | - | |
| Tot | - | 18.11.9 | - | |
| B3-1340+439 | N1 | 84.78.5 | 29.73.0 | 1.20.3 |
| N2 | 20.62.1 | 13.61.4 | 0.90.3 | |
| C | 8.00.9 | 6.40.7 | 0.40.3 | |
| S | 8.60.9 | 2.60.4 | - | |
| Tot | 124.812.5 | 52.35.3 | - | |
| B3-1449+421 | N | 66.56.6 | 21.52.2 | 1.70.3 |
| C | 8.11.0 | 5.00.5 | 0.90.3 | |
| S3 | 14.31.5 | 5.20.6 | 1.70.3 | |
| S2 | 21.02.1 | 11.51.2 | 0.90.3 | |
| S1 | 22.22.2 | 5.70.7 | - | |
| Tot | 132.413.3 | 48.85.0 | - |
3.3 eMERLIN observations
eMERLIN observations were carried out between 3 and 9 August 2020 in
L and C bands.
The target sources were observed for about 4 and 3.5 hr
in L and C bands, respectively. Initial flagging and data calibration
were done using the eMERLIN CASA pipeline. After the a-priori
calibration some data were still highly affected by RFI, especially in
L-band, and additional
flagging was done before starting the imaging process. Final images
were produced after a few self-calibration iterations and are reported
in Fig. A3. In addition to the full-resolution
images, we also produced a set of low-resolution images with
uv-range (50–1250 k),
pixel size and restoring beam common to L and C
bands. These images were used to estimate the spectral index between L
and C bands. Owing to the
severe flagging, the final rms of the L-band images is of a few mJy
beam-1, much worse than the planned rms.
Flux
densities are reported in Table 5 and were measured
with the same CASA tasks described for the analysis of VLA
data (see Section 3.1). Errors on the flux density are
computed using the formula reported in Section 3.1.
| Name | Comp. | S1.5 | S4.8 | |
|---|---|---|---|---|
| mJy | mJy | |||
| B3-0003387 | N | 221.911.2 | 29.81.5 | 1.70.1 |
| S | 171.08.8 | 32.91.7 | 1.40.1 | |
| Tot | 392.919.6 | 62.73.1 | 1.60.1 | |
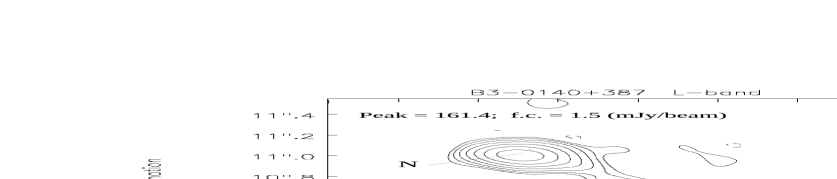
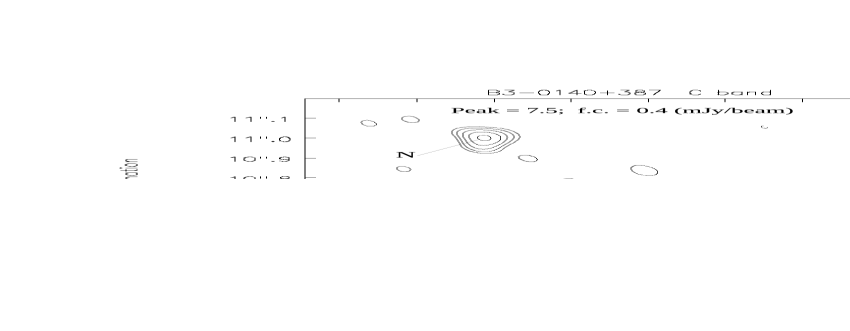
| B3-0140+387 | N | 211.410.6 | 11.00.6 | 1.80.1 |
| C | 52.82.9 | 3.70.5 | 1.70.1 | |
| S1 | 88.44.4 | 4.70.5 | 1.90.1 | |
| S2 | 15.21.3 | - | - | |
| Tot | 371.018.6 | 19.41.0 | 1.90.1 | |
| B3-0810+460B | N | 439.422.0 | 79.74.0 | 1.20.1 |
| S1 | 258.913.1 | 59.13.0 | 1.10.1 | |
| S2 | 262.513.5 | 11.75.2 | 1.40.2 | |
| Tot | 943.047.2 | 150.57.6 | 1.30.2 | |
| B3-0856+406 | E | 154.17.8 | 13.50.7 | 1.80.1 |
| C | - | 1.00.3 | - | |
| W | 46.22.4 | 5.10.3 | 1.40.1 | |
| Tot | 202.810.4 | 19.61.0 | 1.70.1 | |
| B3-1143+456 | N | 115.26.8 | 7.01.1 | 2.40.1 |
| S | 526.826.6 | 64.83.4 | 1.80.1 | |
| Tot | 628.332.0 | 71.83.6 | 1.90.1 | |
| B3-1212+380 | N | 138.07.0 | 18.91.0 | 1.50.1 |
| S | 137.37.0 | 14.00.7 | 1.50.1 | |
| S1 | - | 5.10.3 | - | |
| S2 | - | 8.90.6 | - | |
| Tot | 275.313.8 | 32.91.7 | 1.50.1 |
4 Results
4.1 Spectral fit
For the sources observed with the wide bandwidth available
at the VLA we measured the flux
density for each spectral window, in order to exploit the spectral
coverage as much as possible.
Flux densities at 4.8 and 8.4 GHz are from historical VLA
observations with narrow bandwidth (Fanti et al., 2001). Flux densities in U
band are from our new low-resolution wide band observations which
guarantee a better characterization of the high frequency part of the
spectrum, preventing the artificial steepening that may be caused by
the lack of short spacings of earlier high resolution observations
(Rossetti et al., 2006), unable to pick up extended low-surface brightness
emission.
For the compact sources targeted by VLBA observations we constructed the
integrated radio spectrum making use of VLA flux density from the
literature where the sources are unresolved.
This prevents us to miss flux density that may be
resolved out and/or poorly sampled in our VLBA observations.
We complemented the information in the GHz regime by including flux
density at 74 MHz from the VLA low-frequency sky survey
(VLSS; Cohen et al., 2007) and VLSS redux (Lane et al., 2014), 150 MHz from
the TIFR GMRT sky survey (TGSS; Intema et al., 2017),
and at 408 MHz (Ficarra, Grueff & Tomassetti, 1985) in order to characterize
the radio spectrum at low frequencies.
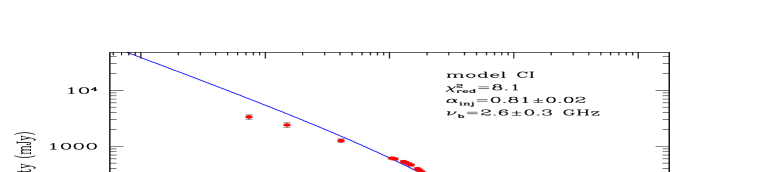
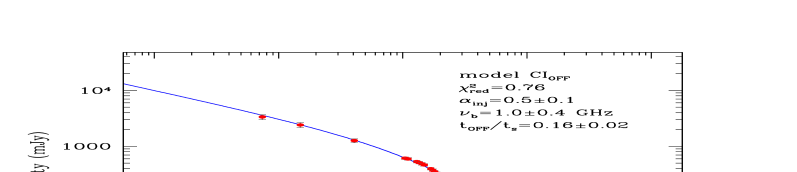
To determine the shape of the synchrotron emission we fit the radio
spectrum of the sources assuming two different models. The first model
implies a continuous injection of fresh relativistic particles
(CI model), while in the second one the
injection of new particles has switched off and the source is already
in a relic phase (CI OFF model). In the latter model a second break
appears in the spectrum at high frequencies and beyond that the
spectrum cuts off exponentially. In both models radiative losses
dominate over the other energy losses (see Murgia, 2003)
and are characterized by a)
the injection spectral index (), b) the break
frequency (), c) and the flux normalization. In addition
to these parameters, the CI OFF model is also characterized by the
relic to total source age ratio (, i.e. the
relic period and the source age, respectively). For , CI OFF model approaches CI model333
In addition to the CI/CI OFF models, we fitted the spectrum
considering a passive evolution of a synchrotron spectrum without
any injection of fresh particles and either with a continuous
re-isotropization of the pitch angle (JP, Jaffe & Perola, 1973) or without
(KP, Kardashev, 1962). Both models are usually comparable and
their is in good agreement with that of CI OFF
model, since the CI OFF model
tends to the JP for ..
When the turnover frequency falls within the frequency range covered
by the observations, we fit the optically-thick part of the spectrum
with a pure synchrotron self-absorption (SSA) model (). A detailed description
of the spectral models can be found in Murgia et al. (2011).
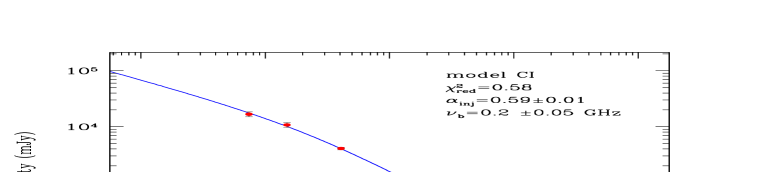
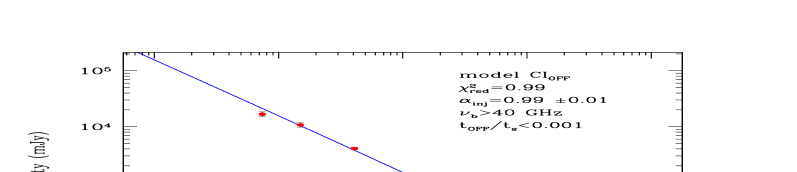
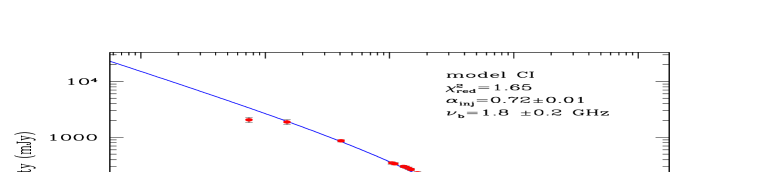
To evaluate the best model that fits the spectrum we compare the value
of the injection spectral index and the reduced chi-square. An example
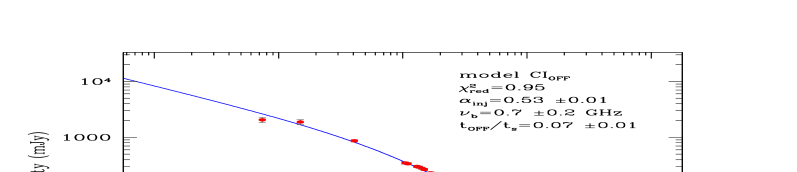
of the fits for B3-0003+387 is shown in Fig. 1. Fits of
the overall spectra for the whole sample are presented in Fig. C1,
and the parameters are reported
in Table C1.
4.2 Polarization
For the sources observed with the VLA we could study the polarization
either in L-S bands or in U band. In all the sources we detect
polarized emission with the exception of B3-1143+456 and
B3-1212+380 which are unpolarized (polarization percentage
per cent) in
both L and S bands, and B3-0003+387, unpolarized in U band (
per cent).
To estimate the rotation measure (RM) we complemented our data with the
information in C and X bands from Fanti et al. (2001). In three sources
(B3-0003+387, B3-0034+444, and B3-1216+402) we find RM 100
rad m-2, whereas in B3-0748+413B, B3-0754+396, and B3-1039+424,
RM 12 rad m-2,
consistent with the Galactic value (Taylor, Stil & Sunstrum, 2009).
The latter sources are also those showing the highest
polarization percentage 10 per cent.
Our deep VLA observations point out that
these objects are components of larger
sources which extend far beyond the host galaxy, and therefore are not
genuine CSS sources (see Section 4.3).
For some objects our RM differs from those reported in
Rossetti et al. (2008) and this is likely due to the lower resolution of
the WSRT data (8 arcsec) which could not resolve the polarized emission
from different components, implying some level of beam depolarization.
| Source name | Comp. | RM | |||||||
|---|---|---|---|---|---|---|---|---|---|
| % | deg | % | deg | % | deg | rad/m2 | deg | ||
| B3-0003+387 | N | - | - | - | - | 0.5 | - | - | - |
| S | - | - | - | - | 6.5 | 234 | -135 | 26 | |
| B3-0034+444 | A | - | - | - | - | 4.3 | 147 | 109 | 11 |
| B | - | - | - | - | 4.0 | -472 | - | - | |
| B3-0128+394 | N | - | - | - | - | 2.9 | -625 | - | - |
| S | - | - | - | - | 4.7 | -605 | - | - | |
| B3-0140+387 | N | - | - | - | - | 2.5 | 662 | - | - |
| S | - | - | - | - | 5.0 | -502 | - | - | |
| B3-0748+413B | N | 0.1 | -444 | 2.4 | -388 | - | - | -4 | -34 |
| S | 11.7 | 424 | 16.2 | 133 | - | - | - | - | |
| B3-0754+396 | N | 8.0 | 858 | 9.8 | 848 | - | - | 2 | 81 |
| S | 0.1 | - | 3.6 | 288 | - | - | - | - | |
| B3-0810+460B | W | 0.1 | - | 0.1 | 02 | - | - | - | - |
| B3-0856+406 | Tot | 0.1 | - | 0.1 | - | - | - | - | - |
| B3-1039+424 | N | 5.6 | 364 | 14.1 | 174 | - | - | - | - |
| S | 7.0 | -492 | 13.8 | -672 | - | - | 12 | -76 | |
| B3-1143+456 | Tot | 0.1 | - | 0.1 | - | - | - | - | - |
| B3-1212+380 | Tot | 0.1 | - | 0.1 | - | - | - | - | - |
| B3-1216+402 | N | 0.6 | 735 | 8.5 | 774 | - | - | -5 | 84 |
| S | 0.2 | 496 | 1.8 | -428 | - | - | -151 | 41 |
4.3 Notes on individual sources
Here we provide a brief description of the sources, and their
classification: active, remnant, restarted, large symmetric object (LSO).
The classification is based on the
detection, or not, of active regions, like core and hotspots, and results
from the synchrotron fit to the integrated spectrum.
A question mark indicates that the
information is not adequate for a secure classification of the radio
emission.
In general, the spectral indices were computed using the flux
densities measured on images
that were produced using a uv-range, image sampling, and restoring beam
common to both frequencies. For VLA data, we report the
spectral index between 3 and 14 GHz, since the structure of many
sources is unresolved or marginally resolved at 1.4 GHz. For some
sources with eMERLIN observations, in addition to the spectral index
between 1.7 and 4.8 GHz from the eMERLIN data sets, we also computed
the spectral index using the 4.8-GHz eMERLIN data and the
high-resolution 15-GHz VLA data from Rossetti et al. (2006). The use of
these data sets obtained with different arrays may affect
the determination of the spectrum, mainly for extended
structures. Therefore, we
provide the spectral index using the 4.8-GHz eMERLIN data and the
high-resolution 15-GHz VLA data only
for compact regions.
VLA images of the sources are shown in Fig. A1: contours
show total intensity emission, while polarized emission (and
E-vectors) are shown in colors (for data sets with available
polarization information). Total intensity images from VLBA
observations are shown in Fig. A2, while eMERLIN images
are presented in Fig. A3.
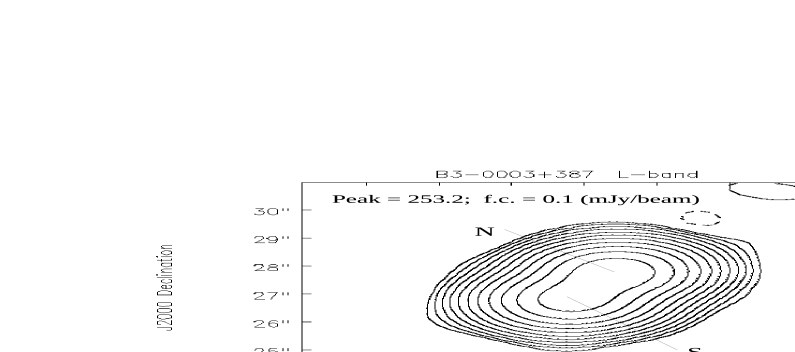
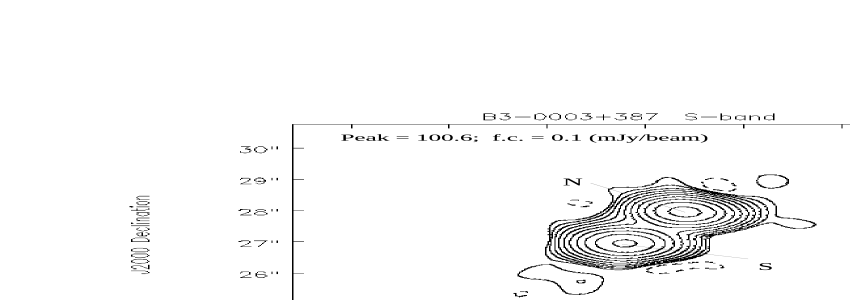
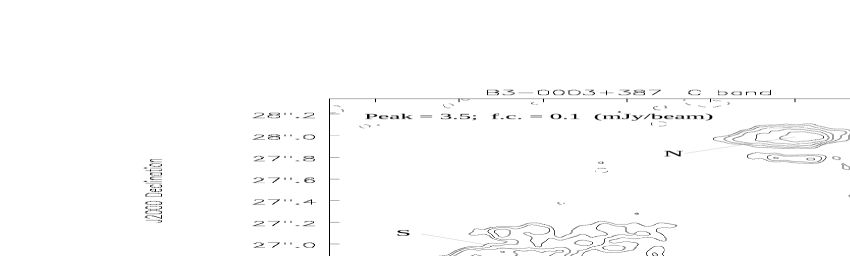
4.3.1 B3-0003+387 - remnant
The source has a double structure with no evidence of the source
core. Both components, unresolved with the VLA, have a steep
spectral index (, Tables 3 and
5) and are elongated in
the C-band eMERLIN image, with no evidence of any compact region. No
significant total-intensity flux-density asymmetry between the two components is
observed. The polarized emission is highly asymmetric, with
the southern component showing a fractional polarization of about
6.5 per cent and an
RM of -135 rad/m2, while the northern component is unpolarized.
The radio spectrum is well reproduced by CI OFF model
(Fig. 1),
supporting the relic nature of this object. This source is one of
the two objects best fitted by a JP model in Rossetti et al. (2006).
The time spent by the
source in the relic phase is about 16 per cent of the total radio source age.
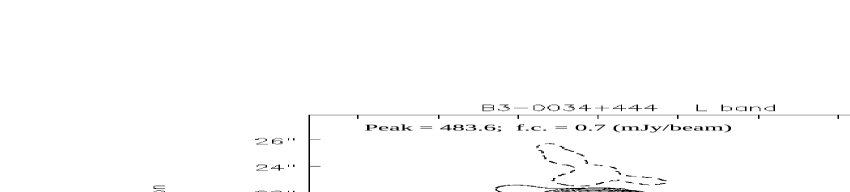
4.3.2 B3-0034+444 - active?
The source has an elongated morphology that reminds of a jetted
structure. There is no clear evidence for
a flat-spectrum core component. Rossetti et al. (2006) suggested component
B as the candidate core based on their high resolution
15-GHz data. However, from our VLA data this component shows a rather
steep spectrum (), while component A,
edge-brightened in the 15-GHz images presented in Rossetti et al. (2006),
has a spectral index of 1.1. Components C and D are resolved out
in the high-resolution 15-GHz images (Rossetti et al., 2006),
suggesting the lack of compact regions.
At 14 GHz only components A and B are polarized.
Both CI and CI OFF models provide a
similar fit to the spectrum. Since is very short,
the CI OFF model is rather equivalent to the CI model (see Section 4.1).
The result from the spectral analysis together with the
information on the source structure pointed out by high-resolution
images make us conservatively consider B3-0034+444 as a candidate
active source.
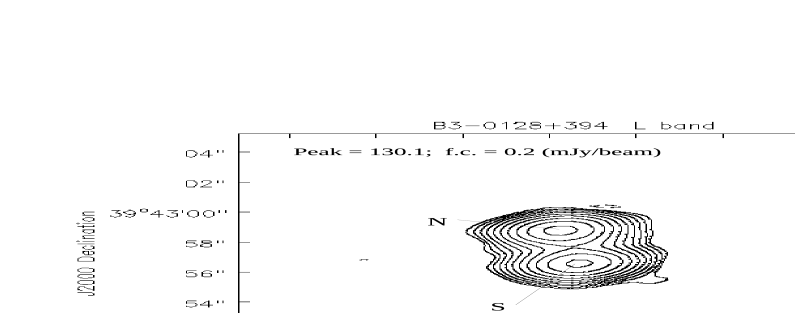
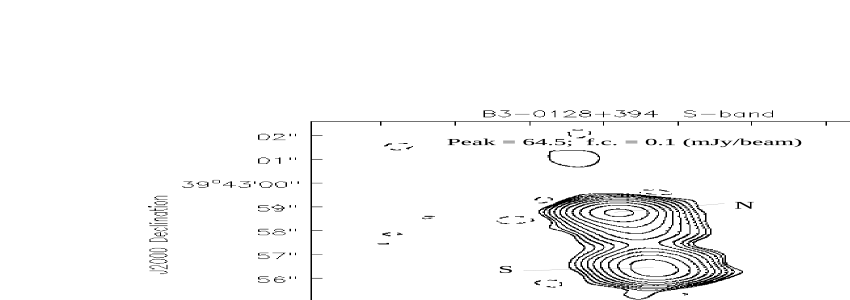
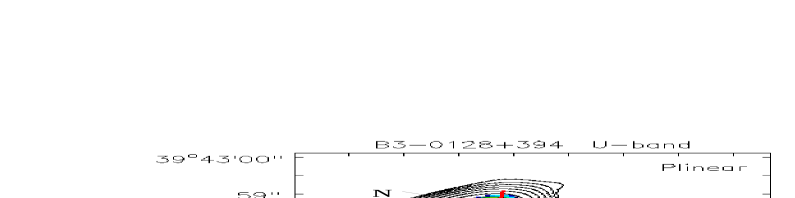
4.3.3 B3-0128+394 - active?
Source with a double structure characterized by a mildly steep
spectrum () and no significant
flux-density asymmetry. There is no clear evidence for a
flat-spectrum core component. In the high resolution images
presented in Rossetti et al. (2006) the extended structure of both the
northern and southern components is resolved
out and only the hotspots
are detected and resolved in substructures.
In particular, the compact component in the northern
lobe has a rather flat spectral index
when super-resolved
images at 8.5
GHz are considered (Rossetti et al., 2006).
At 14 GHz the peak of polarized emission in the
northern component does not
coincide with the peak of total-intensity emission, but it is
centered on the component labelled N2 in Rossetti et al. (2006).
Both CI and CI OFF models provide a
similar fit to the spectrum, with the latter slightly preferred over
the former. The result from the spectral analysis together with the
information on the source structure, i.e. presence of hotspots but
lack of clear core detection
make us conservatively consider B3-0128+394 a candidate active source.
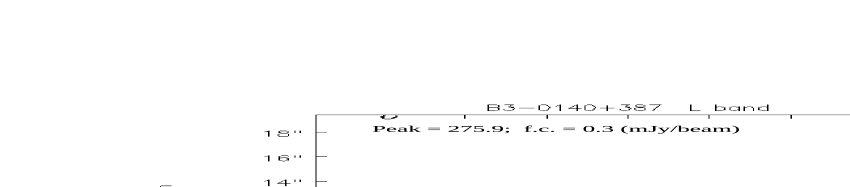
4.3.4 B3-0140+387 - active
Source showing a double structure in VLA images. When observed with
the higher resolution of eMERLIN it shows a triple structure. If we
compare the eMERLIN data at 4.8 GHz and the VLA data at 15 GHz from
Rossetti et al. (2006) we find that the central component, labelled C in
Fig. A3, has a relatively flat spectrum
(), indicating that it may host the source
core. Similarly, the outer compact components labelled N and S1
in eMERLIN image (Fig. A3) have a spectral index
0.6 and 0.7, respectively, i.e. much flatter
than those derived by lower resolution data (Tables 3
and 5). However, when observed with the high
resolution provided by the European Very Long Baseline Interferometry
(VLBI) network (EVN) at 18 cm only two compact regions are detected at the
edges of the source, while no compact component is clearly detected at the
centre (Dallacasa et al., 2002b), suggesting that the core may be absorbed at
such frequency.
The steep spectrum derived from low-resolution data may
be due to the contamination of steep-spectrum emission from lobes and
jets, which is
resolved out at high resolution. Component N is the brightest
in total intensity, with a flux density ratio between N and S1 of
about 2.3 and 2.5 in 4.8-GHz eMERLIN data and in 15-GHz high-resolution
VLA data (Rossetti et al., 2006), respectively,
while component S has the highest level of
polarization (Table 6). Both SSA+CI and SSA+CI OFF models
provide a similar fit to the spectrum. However, the detection of
hotspots and the tentative identification of the core component
suggest that the source is active.
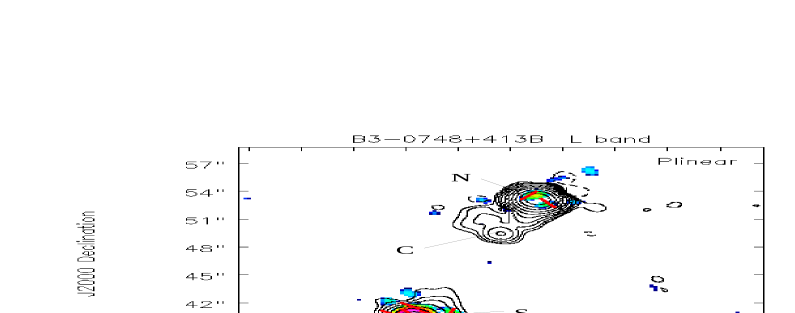
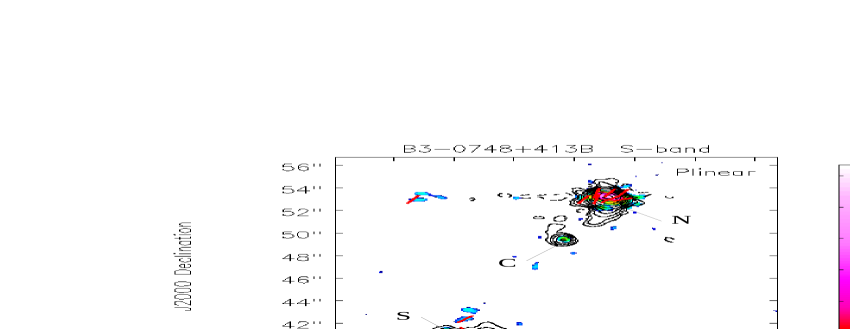
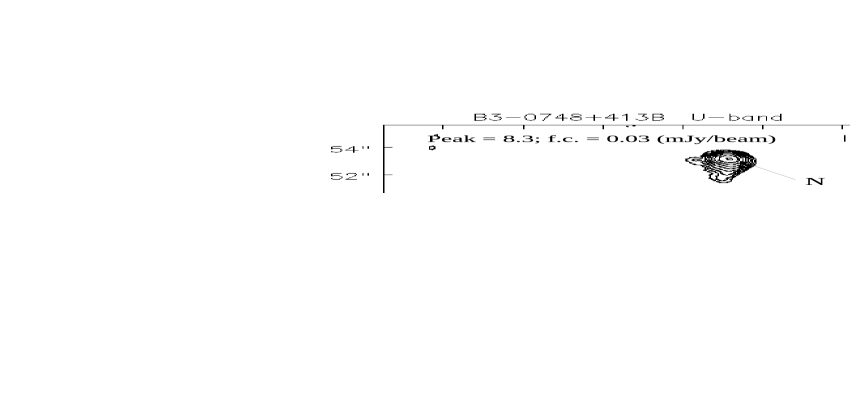
4.3.5 B3-0748+413B - LSO
The source that was classified as a CSS in Fanti et al. (2001) turns out
to be the northern lobe/hotspot, labelled N in Fig. A1,
of a larger radio source with LAS 13.5 arcsec (LS110 kpc
assuming =1.05). The radio source
has an asymmetric structure with the core at about 4 arcsec from
component N and about 9 arcsec from component S. The RM of component N
is consistent with the Galactic value (Table 6) suggesting
that the radio emission is not embedded within the interstellar medium
(ISM) of the host
galaxy. On the basis of these new pieces of evidence we classify
B3-0748+413B as an LSO and remove it from
the sample of CSS sources.
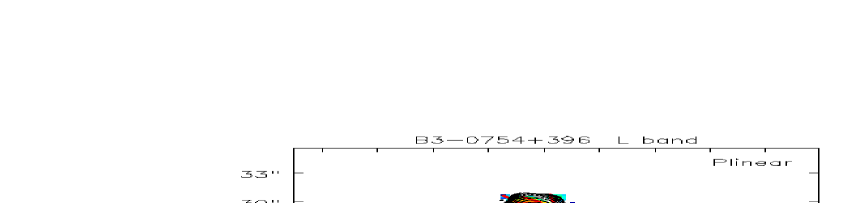
4.3.6 B3-0754+396 - LSO
The source that was classified as a CSS in Fanti et al. (2001) is likely
the northern lobe/hotspot, labelled N in Fig. A1,
of a larger radio source with LAS 11 arcsec (LS93 kpc at
=2.119). Both components
are elongated at low frequencies. No evidence of the source core is
found in our VLA images. The high fractional polarization of
component N and the RM consistent with the Galactic value (Table
6) support the idea that the emission is not embedded
within the ISM of the host galaxy. Moreover, EVN observations of
component N could detect only a set of knots, none reminiscent of
the core component (Dallacasa et al., 2002b). On the basis of these new pieces of
evidence we classify
B3-0754+396 as an LSO, and remove it from
the sample of CSS sources.
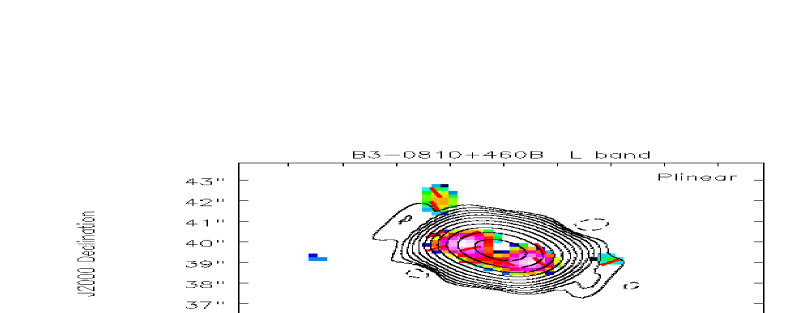
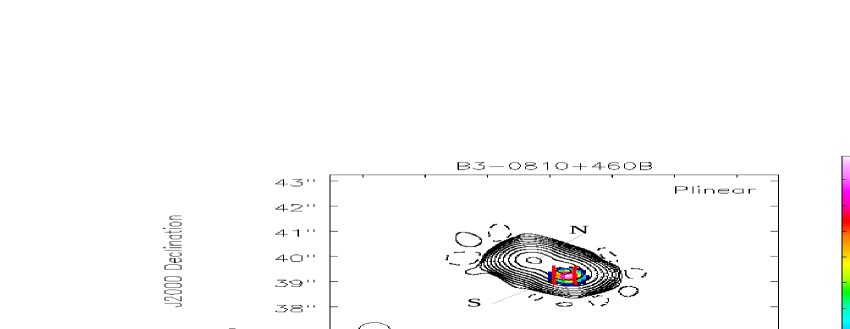
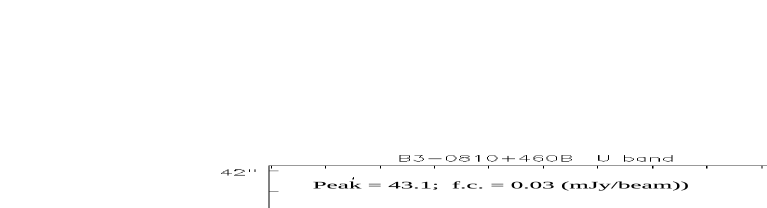
4.3.7 B3-0810+460B - active
The source has a double structure in our VLA images, while it is
resolved into three main components in eMERLIN images.
Component S1
might host the source core and its steep spectrum ()
may be due to the combination of core+jet emission which
cannot be spatially resolved by our observations. If we compare the eMERLIN
flux density at 4.8 GHz with high-resolution VLA data at 15 GHz from
Rossetti et al. (2006) we derive a relatively flat spectrum
() supporting its interpretation as
the source core. EVN observations at 18 cm could detect
only components N and S1, while component S2 is
completely resolved out, indicating its extended structure
(Dallacasa et al., 2002b). No significant flux density asymmetry is observed
between the northern and southern (S1+S2) components (Tables
3 and 5, and Rossetti et al. (2006)). The
source is slightly polarized in S band.
The CI model provides a good fit to the radio
spectrum, supporting the active nature of the source.
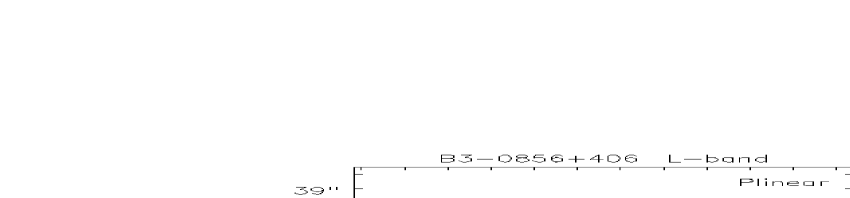
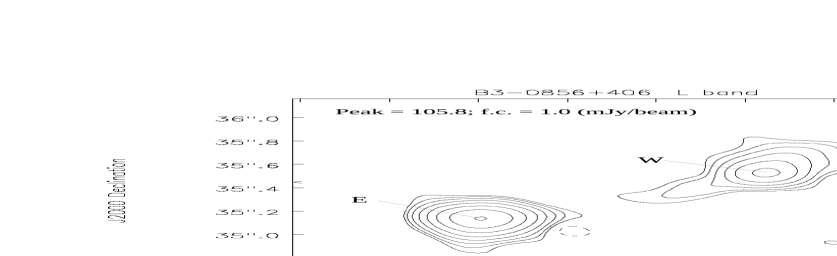
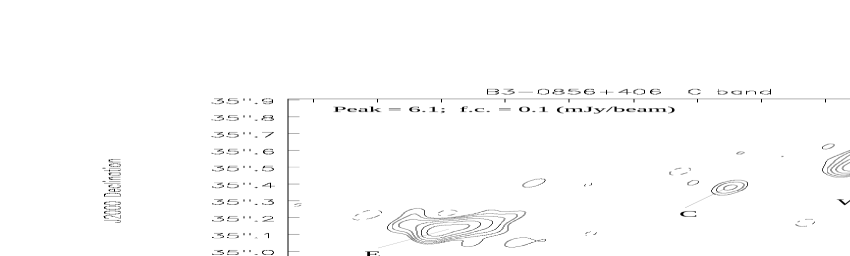
4.3.8 B3-0856+406 - restarted?
The source has a double structure in our VLA images, while it is
resolved into three main components in eMERLIN images. The component
labelled C in Fig. A3 is likely the source
core.
Components E and W have a relatively steep
spectrum both in our eMERLIN observations and in VLA data. Component E
is the brightest one with a flux density ratio ranging between 3.3, in
eMERLIN data at 1.4 GHz, and 1.1 in our VLA data at 14 GHz.
In high-resolution VLA data at 15 GHz, only component E was detected,
indicating that component W has a steep spectrum and
is likely extended (Rossetti et al., 2006). Although component E is
compact in high-resolution 15-GHz images, its spectrum is steep
() both in our VLA and eMERLIN data.
Neither component C was picked
up in that dataset. The source is unpolarized in our images in L and
S bands.
Both CI and CI OFF models
provide a similar fit to the spectrum (though with a rather large
value of the reduced chi-square), with the latter slightly
preferred over the former. This source is the only one together with
the relic B3-0003+387 (out of the 42 analysed) whose
spectrum was significantly better fitted with a JP model rather
than a CI one in Rossetti et al. (2006). These pieces of evidence suggest that the
radio emission of this source has restarted not long ago. However,
owing to the presence of a compact region in component E, though
with a steep spectrum, we conservatively classify this
object as a candidate restarted.
4.3.9 B3-1016+443 - remnant
The source has a double structure in our VLBA image at 4.8 GHz (Fig. A2) and at 1.7 GHz (Dallacasa et al., 2002a). At 8.4 GHz only the northern component is detected. The spectrum of both components is steep and there is no evidence of the source core. Both SSA+CI and SSA+CI OFF models provide a similar fit to the spectrum, with the former slightly preferred over the latter. However, the few data points available leave large uncertainties on the fit results and more data points are needed for a proper model of the synchrotron spectrum. Our classification of B3-1016+443 as a remnant is based on the multi-frequency morphology and spectral index information.
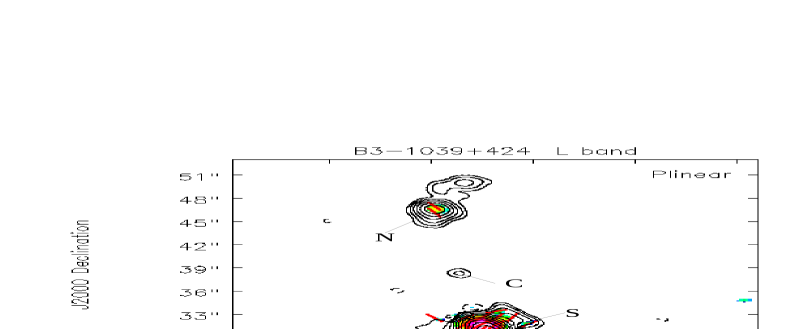
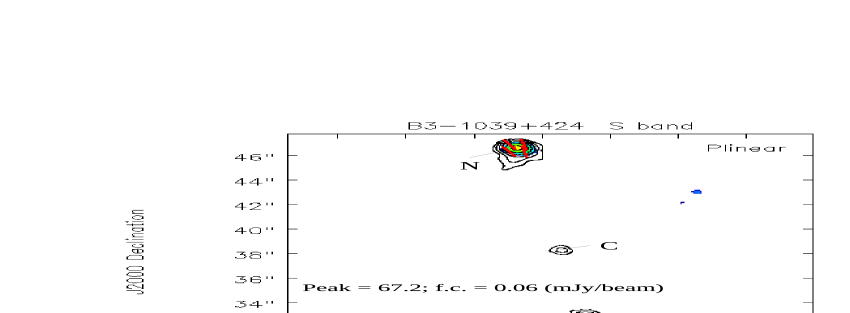
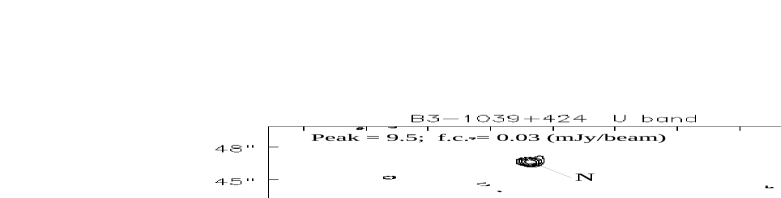
4.3.10 B3-1039+424 - LSO
The source that was classified as a CSS in Fanti et al. (2001) turns out
to be the southern lobe/hotspot, labelled S in Fig. A1,
of a larger radio source with LAS 19 arcsec (LS154 kpc
assuming =1.05). The faint core is
roughly midway between the northern and southern components.
The RM of component S
is consistent with the Galactic value (Table 6) suggesting
that the radio emission is not embedded within the ISM of the host
galaxy. On the basis of these new pieces of evidence we classify
B3-1039+424 as an LSO, and remove it from
the sample of CSS sources.
4.3.11 B3-1049+384 - active
The source is characterized by 4 components with an unusual
morphology. Components W1 and W2 seem a scaled-down version of a
double radio galaxy, and their elongation is misaligned with respect
to components E and C. Component C has a flat spectrum and is likely
the source core. A high flux density asymmetry is observed
between the eastern and western (W1+W2) components (Table 4).
The SSA+CI model provides a good fit to the radio
spectrum, supporting the active nature of the source.
4.3.12 B3-1133+432 - active?
This source is a CSO with a double structure and no evidence of the
source core. VLBA images were presented in Dallacasa et al. (2002a) and
Orienti et al. (2004). The northern component is the brightest, with a flux
density that is roughly double that of the southern component.
The spectral index is 0.9 and 1.0 for component N and
S, respectively, and slightly steepens between 4.8 and 8.4 GHz
(, Orienti et al., 2004).
The SSA+CI model provides a better fit
than the SSA+CI OFF model. However, the few data points available
leave large uncertainties on the fit results. Although the core
is not detected, we conservatively consider B3+1133+432 as a
candidate active source.
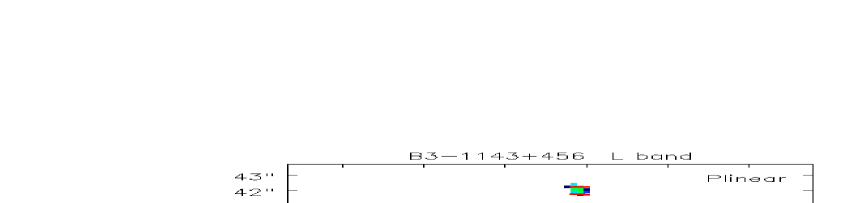
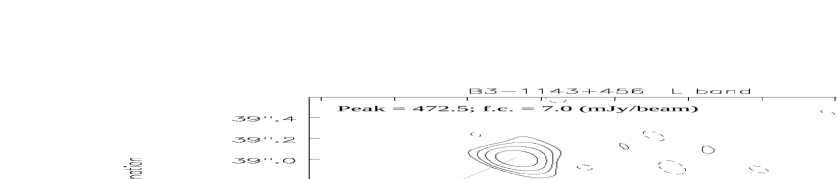
4.3.13 B3-1143+456 - active?
This source has a double structure in VLA and eMERLIN
images. Both components have a steep spectrum and there is no evidence
of the source core. However, if we compare the eMERLIN
flux density at 4.8 GHz with high-resolution VLA data at 15 GHz from
Rossetti et al. (2006) we derive 0.5 and 0.7 for
component N and S, respectively, suggesting that they may be active
hotspots. However, we notice that these are not compact regions, and
the spectral index may be artificially flat, due to missing flux
density from extended structures unrecovered by eMERLIN
observations. The flux density ratio between component N and S is
about 5-7 depending on the frequency,
with the southern being the brightest one. The source is
unpolarized in L and S bands.
Both SSA+CI and SSA+CI OFF models
give a similar fit to the spectrum, with the former providing
a slightly lower value of the reduced chi-square value.
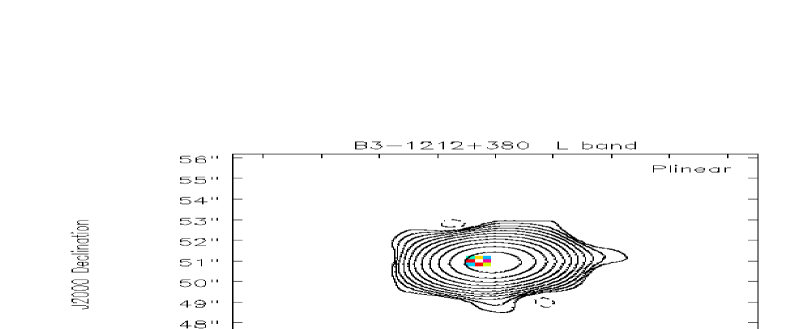
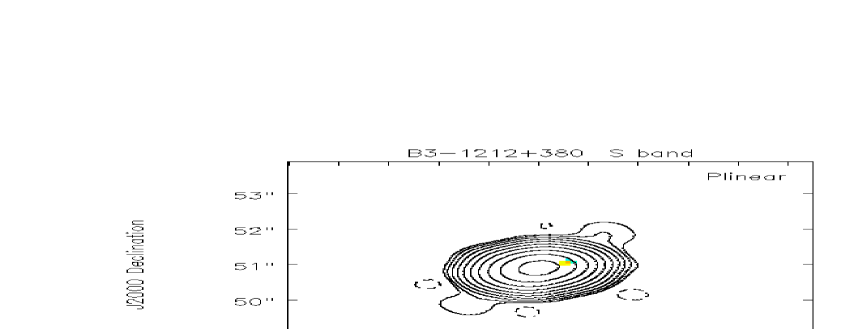
4.3.14 B3-1212+380 - active
This source has a double structure in eMERLIN
images and in the high-resolution 15-GHz VLA image (Rossetti et al., 2006),
while in our VLA observations the source is unresolved in L and S
bands, and slightly resolved in U band.
In eMERLIN images the southern component is slightly resolved
into two components elongated in the NW-SE direction. Component S1
might host the source core, and the
steep spectrum of the whole southern component
may arise from the blending of the core emission with that of the
steep-spectrum jet and mini-lobe.
This interpretation is
supported by the estimate of the spectral index of S1 between
eMERLIN data at 4.8 GHz and high-resolution VLA data at 15 GHz
(Rossetti et al., 2006), which turns out to be . The low data quality of EVN observations could not help identify the
core component (Dallacasa et al., 2002b). In eMERLIN images where the source structure
is resolved, there is no significant flux density
asymmetry between the northern and southern components (Table
5).
The source is unpolarized in our images in L and S bands.
The CI model provides a good fit to the radio
spectrum, supporting the active nature of the source.
4.3.15 B3-1216+402 - remnant?
This source has a double structure in our VLA images.
There is no evidence
of the source core. The spectral index 1.0,
i.e. not ultra-steep as it is found in other sources, may indicate the
co-existence of aged emission from lobes with the contribution of
active regions like hotspots, which are mixed up with the
resolution of our observations. However, in high resolution 15-GHz
VLA observations only the southern component hosts a faint
steep-spectrum compact
region, while the structure of the northern component is fragmented,
with no clear indication of a hotspot. Neither the core is detected
in this data set (Rossetti et al., 2006). There is no significant flux
density asymmetry between the northern and southern components at
low frequencies, while it becomes roughly double at 14 GHz, with the
southern being the brightest (Table 3).
Polarization increases from L to S
band, and is detected in both components, with component N
significantly polarized in S band (8.5 per cent). Both CI and CI OFF models
provide a similar fit to the spectrum. The lack of a clear core
detection and the possible presence of a candidate hotspot, (though
with a relatively steep spectrum) in
the southern component make us conservatively classify this object as a candidate remnant.
4.3.16 B3-1225+442 - restarted
Although at 1.7 GHz the source shows a triple morphology (Dallacasa et al., 2002a),
at 8.4 GHz it has a double structure, being the westernmost
component, labelled W2 in
Dallacasa et al. (2002a) undetected at high frequency. Only the central
component, labelled W1 in Dallacasa et al. (2002a), and the eastern one are
detected in our observations.
The component labelled E in Fig. A2
is severely resolved out, whereas the other component is resolved
into two sub-components labelled W1A and W1B.
The spectral index of W1A is
flat () indicating that the source core
may be hosted in this component. The lack of compact components at the
edge of the source and the possible presence of the core may indicate
that the radio emission has restarted not long ago. The SSA+CI OFF model
provides a slightly better fit than the SSA+CI model, supporting the recent
restart of the radio emission.
4.3.17 B3-1340+439 - restarted?
The source is resolved into several sub-components in our VLBA
images. The component labelled C in Fig. A2
has a rather flat spectrum and is
likely the source core. Component S is severely resolved out at 8.3
GHz, while component N1, though with a rather compact structure at 8.3
GHz, has a steep spectrum (). The
northern component (N1+N2+N3) is brighter than the southern one,
with a flux density ratio 10.
The SSA+CI OFF model
provides a slightly better fit than the SSA+CI one. As in the case of
B3-0856+406 and B3-1225+442,
these pieces of evidence may indicate that the radio
emission in this source
has restarted not long ago. However, the morphology of the
northern components is consistent with a jet structure, making us
conservatively consider this source as a candidate restarted.
4.3.18 B3-1449+421 - active
The source is resolved into several sub-components in our VLBA
images. The component labelled C in Fig. A2
is likely the source core, and the
rather steep spectrum may be due to the combination of core+jet
emission that cannot be resolved by our observations. The
morphology of the southern components is consistent with a jet
structure. There is no
significant flux density ratio ( 1) between the northern and southern
components.
The SSA+CI model
provides a good fit to the radio
spectrum, supporting the active nature of the source.
5 Discussion
A possible explanation for the high number of intrinsically compact
extragalatic radio sources is the intermittency of short-lived
episodes of jet activity. Several models predict that the dominant
population of extragalactic radio sources consists in short-lived objects
(e.g. Reynolds & Begelman, 1997; Hardcastle, 2018; Shabala et al., 2020) which may not evolve into classical
Fanaroff-Riley type I/II radio galaxies. The straightforward outcome
from this scenario is the existence of a population of young but dying
radio sources. To unveil the incidence of remnants in the population
of young radio sources we study the statistically complete B3-VLA CSS
sample and we searched for active regions in the 18 sources with a
steep ()
integrated radio spectrum and without any evidence of the core from
earlier observations. These could be considered the signatures of an
aged population of relativistic electrons, without a significant
contribution from freshly produced/accelerated ones.
The wide frequency coverage and the deep
sensitivity of our new observations allowed us to classify
the sources in either active or remnants. We find that 3 CSS sources
selected by Fanti et al. (2001) are components of large radio
sources, and we remove them from the CSS sample. The final
sample thus consists of 84 objects divided into 25 sources with
LAS0.25 arcsec, that we consider as CSOs (though the core is not
detected in all of them), while 59 sources have LAS0.25 arcsec, that
we classify as MSOs.
| Class | B3-VLA | this | core | remnants/ |
|---|---|---|---|---|
| CSS | sample | restarted | ||
| All CSS | 84 | 15 | 8 (44) | 3/3 |
| CSOs | 25 | 6 | 4 (12) | 1/2 |
| MSOs | 59 | 9 | 4 (30) | 2/1 |
| LSOs | 3 | 3 | 2 (2) | - |
5.1 Core detection
We detect the core component in 10 sources of our sample (inclusive of LSOs), while in 6 CSS sources we could set an upper limit on its flux density. The radio morphology of B3-0034+444 precludes us from determining the location of the core or setting a tight upper limit.
In Fig. 2 we plot the ratio between the core luminosity Pc at 5 GHz vs the total source luminosity Ptot at 408 MHz for the sources of the B3-VLA CSS sample, with the exception of the three LSOs (all luminosities are k-corrected). When no information at 5 GHz is available for the core component, we extrapolate the flux density assuming a flat spectral index . If the core is undetected at all frequencies we assume as upper limit the three sigma noise level of either the high-resolution VLA images at 15 GHz reported in Rossetti et al. (2006) for MSOs, or the VLBA images at 8.4 GHz for CSOs444We do not consider all the sources from the B3-VLA CSS sample without the core detection, but only those showing a morphology, mainly a double structure, for which it is reasonable to set an upper limit to the flux density related to the rms of the images. For those sources with a complex morphology, the core may be hidden by other components, like jets and low-surface brightness emission from lobes that bridges the outermost hotspot regions (e.g. B3-0902+416).. When the redshift is unknown, we assume (see Fanti et al., 2001).
In Fig. 2 we plot the
best fit (corrected for the cosmology adopted in this paper)
that is obtained for the 3CR radio galaxies
(Giovanninni et al., 1988), i.e.
for
objects with a luminosity between
1024-28 W Hz-1.
CSS sources from the B3-VLA are
in general above
the best fit.
If we perform a regression fit that minimizes the chi-square error
statistics, we obtain for the CSS sources:
Log Pc = (8.05.3) - (0.60.2)logPtot .
This empirical relation has a slope (though with
large uncertainty) that is similar to the one
found by Giovanninni et al. (1988), but it is slightly shifted towards higher
luminosities. This may be due to the slightly higher luminosities of
the B3-VLA CSS sample, i.e. about 10 W Hz-1 (Fanti et al., 2001).
For the CSS sources with no detection of the core component we could set a tight
upper limit on the luminosity, with the exception of B3-0034+444,
which is in general well below the average trends, suggesting that
some might be remnants. However, we cannot exclude the
possibility that some level of core activity (below the sensitivity
threshold) is present.
A very weak core and the steep
spectrum of the source may indicate that either some level of
activity of the AGN is always present, even if it is unable to launch
powerful jets, or that the radio core has just switched on
again (Jurlin et al., 2021). Apart from a few objects where the optical
counterpart is unknown, all the sources of our sample are optically
classified as
galaxies rather than quasars (i.e. jets oriented at a large angle with respect
to our line of sight). Therefore, we cannot exclude the possibility
that the core flux density may
be Doppler diminished and thus
non-detected by our observations due to sensitivity limitation
(see e.g., Saikia & Kulkarni, 1994).
5.2 Remnants and restarted sources
The analysis of the integrated radio spectrum points out that 5
sources
are best fitted by a continuous particle injection model,
while other 5 sources
require the inclusion of a relic phase. For the
remaining 5 CSS sources both models provide a quite equivalent
good fit to their spectra
(CI OFF model approaches CI model).
For LSOs are contaminant of our sample, they are dropped
from our analysis since they do not belong to the sample of subgalatic
size
radio sources.
To unveil whether a source is active or not, we need to
correctly determine both the integrated synchrotron spectrum, and
the nature of each sub-structure: extended vs compact regions, and
spectral index information. For the sources of our sample
we find that 9 are likely active: 5 with a secure classification, and 4
candidate active objects. The latter are radio sources with no core
detection, but with the presence of a hotspot (with at
least on one side). The non detection of a hotspot on both sides of the
radio emission may be an indication of an inhomogeneous
environment. 11 out of
the 15 MSOs/CSOs sources
of our sample show significant flux density asymmetry (i.e. flux
density ratio 1) between the two
sides of the radio emission, whereas polarization asymmetry is
observed in 4 of the sources with polarization information.
Asymmetries in flux density, polarization, and arm-length
ratio between the two sides of the radio emission caused by an
inhomogeneous medium have been found more often in young radio sources
than in classical double radio galaxies (see
e.g., Saikia & Gupta, 2003; Saikia et al., 2003; Orienti & Dallacasa, 2008; Dallacasa et al., 2013; Orienti & Dallacasa, 2014; Orienti, 2016; O’Dea & Saikia, 2021).
Among sources
with core detection, B3-1225+442 (CSO) is likely a restarted object. Its extended components
that are well imaged at low frequency (Dallacasa et al., 2002a) are either
undetected or highly resolved-out at the highest frequency,
and show a steep spectrum,
indicating that no compact active
regions, like hotspots, are present at the edges of the sources. On the
contrary the central component has a spectral index that is consistent
with current activity. The other two sources, B3-0856+406 (MSO) and
B3-1340+439 (CSO) are candidate restarted. Their integrated radio spectra
are better modelled when a relic period is included, suggesting that
the activity has not been continuous during the total source
age. However, the presence of an edge-brightened component in
B3-0856+406 and a jet-like structure in B3-1340+439 make us
conservatively consider
these objects candidate restarted.
We classify the remaining sources B3-0003+387 (MSO) and
B3-1016+443 (CSO) as remnants, while we conservatively consider
B3-1216+482 (MSO) a candidate
remnant.
The improvement in sensitivity and angular resolution that
will be achieved with
the next generation of radio facilities, like the Square Kilometre Array
(SKA) and the next-generation VLA (ngVLA), will allow
us to study the radio spectra of each component of the radio sources
(i.e. similar to the spectral studies currently done for radio galaxies with
sizes of hundred of kpc and beyond), rather than the
integrated one, providing a robust classification of the activity
of young radio sources.
Detecting young radio
sources already in a remnant/restarted phase strongly supports the power-law
distribution of the source ages
(e.g. Hardcastle, 2018; Shabala et al., 2020; Morganti et al., 2021)
implying that not all the
radio sources will evolve into large and old radio galaxies.
The detection of only three possible
cases of restarted sources suggests that the remnant phase in young
objects is shorter
than the time elapsed between the end of the first epoch and the start
of the second epoch of activity (i.e. 103-5 yr).
In CSS sources the decay of the
radio emission may be faster than in larger sources due to the
magnetic field (about a few mG, Fanti et al., 1995; Dallacasa et al., 2002a; Orienti et al., 2004; Orienti & Dallacasa, 2008)
that is usually orders of magnitude higher than in
extended radio galaxies (about a few
G, Croston et al., 2005; Brienza et al., 2016; Ineson et al., 2017). On the other hand,
inverse-Compton losses should not play a major role since the
equivalent magnetic field of the cosmic microwave background
for the source at the highest
redshift is about 50 G, i.e. much lower than the magnetic field
of the radio source. Similarly, inverse Compton losses due to the upscattering of various
surrounding photon fields (disc, torus, stars) by the lobes’ electrons
should be negligible (Stawarz et al., 2008).
For the
sources of the B3-VLA CSS sample span a large redshift range,
the steepness of the
spectrum may be due to the z- correlation
(e.g., Ker et al., 2012; Morabito & Harwood, 2018),
rather than the ageing. In Fig. 3 we plot the -z
correlation for the sources of our sample divided into active (open
stars) and (candidate) remnant/restarted (filled stars), together
with the radio sources from the whole B3-VLA CSS (open
circles). Only radio sources with a spectroscopic
redshift have been considered since we notice some discrepancy
between photometric and spectroscopic redshifts that may affect the
results of the correlation. The majority of the sources from our
sample are indistinguishable from those of the B3-VLA CSS,
suggesting that the redshift should not act as a main character in the
steepness of the spectrum. B3-0856+406 seems an outlier, with its
steep spectrum likely due to a combination of both high redshift and
ageing of the radio emission.
We remark that among the sources of the B3-VLA CSS sample not observed
here, there are other objects lacking a secure core detection and
showing radio structures dominated by extended low-surface brightness
features.
Although
their integrated spectrum is not ultra-steep, we
cannot exclude that there may be some sources that have either
switched off recently, or their radio emission has just restarted. For
this reason the percentages from this work should be considered lower limits.
Multi-frequency high angular
resolution observations of these remaining sources are thus
crucial for unveiling
the incidence of
restarted/remnants objects among the population of CSS sources.


6 Summary
This paper presents the first study of the incidence of remnant/restarted radio sources in a complete sample of CSS objects, making use of multi-frequency VLA, pc-scale VLBA, and eMERLIN observations of 18 candidate remnants from the B3-VLA CSS complete sample. The conclusions that we can draw from this investigation are:
-
•
we detect the core region in 10 radio sources;
-
•
we find that 3 sources (2 MSOs and 1 CSO) out of the 18 studied in this paper are likely remnants: two with a rather secure classification, while the remaining one is conservatively classified as a candidate remnant;
-
•
among the sources with core detection, two CSOs and 1 MSO are likely restarted radio sources (one with a rather robust classification, while two conservatively considered candidates). These sources, together with B3-0003+387 and B3-0128+394, are the only five objects whose synchrotron spectra are better reproduced by a CI+OFF model than a CI one;
-
•
we discovered that 3 objects are not CSS sources but components of larger radio sources, and we remove them from the B3-VLA CSS sample;
-
•
significant flux density asymmetry is observed in 11 out of 15 MSOs/CSOs of our sample, in agreement with the high fraction of asymmetric objects found in other samples of compact and young radio sources.
In order to extend the percentage of remnants and restarted sources
to the whole B3-VLA CSS sample we need further high-resolution
observations of those sources still lacking multi-frequency data.
Determining the incidence of young but fading radio sources that can
be observed by current and future facilities is paramount.
A complete characterization of the life-cycle of the radio emission
from relativistic jets will be fundamental for the exploitation of the
data from the forthcoming facilities, like SKA and ngVLA. Thanks to the
significant improvement in sensitivity and resolution, SKA and ngVLA
will allow systematic studies of populations of fainter
and farther radio sources, providing a fundamental step forward in our
understanding of their cosmological evolution.
Acknowledgments
We thank the referee, D. Saikia, for reading the manuscript carefully and making valuable suggestions. The VLA and VLBA are operated by the US National Radio Astronomy Observatory which is a facility of the National Science Foundation operated under cooperative agreement by Associated Universities, Inc. e-MERLIN is a National Facility operated by the University of Manchester at Jodrell Bank Observatory on behalf of STFC, part of UK Research and Innovation. This work has made use of the NASA/IPAC Extragalactic Database NED which is operated by the JPL, Californian Institute of Technology, under contract with the National Aeronautics and Space Administration. AIPS is produced and maintained by the National Radio Astronomy Observatory, a facility of the National Science Foundation operated under cooperative agreement by Associated Universities, Inc. Funding for the Sloan Digital Sky Survey IV has been provided by the Alfred P. Sloan Foundation, the U.S. Department of Energy Office of Science, and the Participating Institutions. SDSS acknowledges support and resources from the Center for High-Performance Computing at the University of Utah. The SDSS web site is www.sdss.org. SDSS is managed by the Astrophysical Research Consortium for the Participating Institutions of the SDSS Collaboration including the Brazilian Participation Group, the Carnegie Institution for Science, Carnegie Mellon University, Center for Astrophysics Harvard & Smithsonian (CfA), the Chilean Participation Group, the French Participation Group, Instituto de Astrofísica de Canarias, The Johns Hopkins University, Kavli Institute for the Physics and Mathematics of the Universe (IPMU) / University of Tokyo, the Korean Participation Group, Lawrence Berkeley National Laboratory, Leibniz Institut für Astrophysik Potsdam (AIP), Max-Planck-Institut für Astronomie (MPIA Heidelberg), Max-Planck-Institut für Astrophysik (MPA Garching), Max-Planck-Institut für Extraterrestrische Physik (MPE), National Astronomical Observatories of China, New Mexico State University, New York University, University of Notre Dame, Observatório Nacional / MCTI, The Ohio State University, Pennsylvania State University, Shanghai Astronomical Observatory, United Kingdom Participation Group, Universidad Nacional Autónoma de México, University of Arizona, University of Colorado Boulder, University of Oxford, University of Portsmouth, University of Utah, University of Virginia, University of Washington, University of Wisconsin, Vanderbilt University, and Yale University.
Data Availability
The data uderlying this article are available in the NRAO Data Archive (https://science.nrao.edu/observing/data-archive) with the project codes BO038, 15A-140, 16B-107, and 17B-153. Calibrated data are available upon reasonable request.
References
- Albareti et al. (2017) Albareti, F., et al. 2017, ApJS, 233, 25
- Allington-Smith et al. (1988) Allington-Smith, J.R., Spinrad, H., Djorgovski, S., Liebert, J. 1988, MNRAS, 234, 1091
- Brienza et al. (2016) Brienza, M., et al. 2016, A&A, 585, 29
- Brienza et al. (2017) Brienza, M., et al. 2017, A&A, 606, 98
- Brocksopp et al. (2007) Brocksopp, C., Kaiser, C.R., Schoenmakers, A.P., de Bruyn, A.G. 2007, MNRAS, 382, 1019
- Callingham et al. (2015) Callingham, J.R. 2015, ApJ, 809, 168
- Cohen et al. (2007) Cohen, A.S., Lane, W.M., Cotton, W.D., Kassim, N.E., Lazio, T.J.W., Perley, R.A., Condon, J.J., Erickson, W.C. 2007, AJ, 134, 1245
- Croston et al. (2005) Croston, J.H., Hardcastle, M.J., Harris, D.E., Belsole, E., Birkinshaw, M., Worrall, D.M. 2005, ApJ, 626, 733
- Cruz et al. (2006) Cruz, M.J., et al. 2006, MNRAS, 373, 1531
- Czerny et al. (2009) Czerny, B., Siemiginowska, A., Janiuk, A., Nikiel-Wroczyński, B., Stawarz, Ł. 2009, ApJ698, 840
- Dallacasa et al. (2002a) Dallacasa, D., Tinti, S., Fanti, C., Fanti, R., Gregorini, L, Stanghellini, C., Vigotti, M. 2002a, A&A, 389, 115
- Dallacasa et al. (2002b) Dallacasa, D., Fanti, C., Giacintucci, S., Stanghellini, C., Fanti, R., Gregorini, L., Vigotti, M. 2002b, A&A, 389, 126
- Dallacasa et al. (2013) Dallacasa, D., Orienti, M., Fanti, C., Fanti, R., Stanghellini, C. 2013, MNRAS, 433, 147
- Fanti et al. (1995) Fanti, C., Fanti, R., Dallacasa, D., Schilizzi, R.T., Spencer, R.E., Stanghellini, C. 1995, A&A, 302, 31
- Fanti et al. (2001) Fanti, C., Pozzi, F., Dallacasa, D., Fanti, R., Gregorini, L., Stanghellini, C., Vigotti, M. 2001, A&A, 369, 380
- Fanti et al. (2011) Fanti, C., Fanti, R., Zanichelli, A., Dallacasa, D., Stanghellini, C. 2011, A&A, 528, 110
- Ficarra, Grueff & Tomassetti (1985) Ficarra, A., Grueff, G., Tomassetti, G. 1985, A&AS, 59, 25
- Giovanninni et al. (1988) Giovannini, G., Feretti, L., Gregorini, L., Parma, P. 1988, A&A, 199, 73
- Godfrey, Morganti & Brienza (2017) Godfrey, L.E.H., Morganti, M., Brienza, M. 2017, MNRAS, 471, 891
- Gugliucci et al. (2005) Gugliucci, N.E., Taylor, G.B., Peck, A.B., Giroletti, M. 2005, ApJ, 622, 136
- Hardcastle et al. (2016) Hardcastle, M.J., et al. 2016, MNRAS, 462, 1910
- Hardcastle (2018) Hardcastle, M.J., et al. 2018, MNRAS, 475, 2768
- Hardcastle et al. (2019) Hardcastle, M.J., et al. 2019, A&A, 622, 12
- Harwood et al. (2017) Harwood, J.J., et al. 2017, MNRAS, 638, 34
- Hota et al. (2011) Hota, A., et al. 2011, MNRAS, 417, 36
- Ineson et al. (2017) Ineson, J., Croston, J.H., Hardcastle, M.J., Mingo, B. 2017, MNRAS, 467, 1587
- Intema et al. (2017) Intema, H.T., Jagannathan, P., Mooley, K.P., Frail, D.A. 2017, A&A, 598, 78
- Jaffe & Perola (1973) Jaffe, W.J., Perola, G.C. 1973, A&A, 26, 423
- Jarvis et al. (2001) Jarvis, M.J., et al. 2001, MNRAS, 326, 1563
- Jurlin et al. (2020) Jurlin, N., et al. 2020, A&A, 638, 34
- Jurlin et al. (2021) Jurlin, N., et al. 2021, A&A, in press (arXiv:2106.13161)
- Kardashev (1962) Kardashev, N.S. 1962, SvA, 6, 317
- Ker et al. (2012) Ker, L.M., Best, P.N., Rigby, E.E., Röttgering, H.J.A., Gendre, M.A. 2012, MNRAS, 420, 2644
- Komissarov & Gubanov (1994) Komissarov, S.S., Gubanov, A.G. 1994, A&A, 285, 27
- Konar et al. (2006) Konar, C., Saikia, D. J., Jamrozy, M., Machalski, J. 2006, MNRAS,372, 693
- Kunert-Bajraszewska & Marecki (2007) Kunert-Bajraszewska, M., Marecki, A. 2007, A&A, 469, 437
- Lane et al. (2014) Lane, W.M., Cotton, W.D., van Velzen, S., Clarke, T.E., Kassim, N.E., Helmboldt, J.F., Lazio, T.J.W., Cohen, A.S. 2014, MNRAS, 440, 327
- Lara et al. (1999) Lara, L., Márquez, I., Cotton, W.D., Feretti, L., Giovannini, G., Marcaide, J.M., Venturi, T. 1999, A&A, 348, 699
- Luo et al. (2007) Luo, W.-F., Yang, J., Cui, L., Liu, X., Shen, Z.-Q. 2007, ChJAA, 7, 611
- Mahatma et al. (2018) Mahatma, V.H., et al. 2018, MNRAS, 475, 4557
- Mahatma et al. (2019) Mahatma, V.H., et al. 2019, A&A, 622, 13
- McMullin et al. (2007) McMullin J. P., Waters B., Schiebel D., Young W., Golap K., 2007, in Shaw R. A., Hill F., Bell D. J., eds., ASP Conf. Ser. Vol. 376, Astromical Data Analysis and Systems XVI, Astron. Soc. Pac. San Francisco, p. 127
- Morabito & Harwood (2018) Morabito, L.K., Harwood, J.J. 2018, MNRAS, 480, 2726
- Morganti (2017) Morganti, R. 2017, NatAs, 1, 596
- Morganti et al. (2021) Morganti, R., et al. 2021, A&A, 648, 9
- Murgia et al. (1999) Murgia, M., Fanti, C., Fanti, R., Gregorini, L., Klein, U., Mack, K.-H., Vigotti, M. 1999, A&A, 345, 769
- Murgia (2003) Murgia, M. 2003, PASA, 20, 19
- Murgia et al. (2011) Murgia, M., et al. 2011, A&A, 526, 148
- Nyland et al. (2020) Nyland, K., et al. 2020, ApJ, 905, 74
- O’Dea & Saikia (2021) O’Dea, C.P, Saikia, D.J. 2021, A&ARv, 29, 3
- Orienti et al. (2004) Orienti, M., Dallacasa, D., Fanti, C., Fanti, R., Tinti, S., Stanghellini, C. 2004, A&A, 426, 463
- Orienti & Dallacasa (2008) Orienti, M., Dallacasa, D. 2008, A&A, 487, 885
- Orienti, Murgia & Dallacasa (2010) Orienti, M., Murgia, M., Dallacasa, D. 2010, MNRAS, 402, 1892
- Orienti & Dallacasa (2014) Orienti, M., Dallacasa, D. 2014, MNRAS, 438, 463
- Orienti (2016) Orienti, M. 2016, AN, 337, 9
- Orienti & Dallacasa (2020) Orienti, M., Dallacasa, D. 2020, MNRAS, 499, 1340
- Orrú et al. (2010) Orrú, E., Murgia, M., Feretti, L., Govoni, F., Giovannini, G., Lane, W., Kassim, N., Paladino, R. 2010, A&A, 515, 50
- O’Sullivan et al. (2021) O’Sullivan, E., Kunert-Bajraszewska, M., Siemiginowska, A., Burke, D.J., Combes, F., Salomé, P., Giacintucci, S. 2021, ApJ, 913, 105
- Pahre & Djorgovski (1995) Pahre, M.A., Djorgovski, S.G 1995, ApJ, 449, L1
- Parma et al. (2007) Parma, P., Murgia, M., de Ruiter, H.R., Fanti, R., Mack, K.-H., Govoni, F. 2007, A&A, 470, 875
- Randriamanakoto, Ishwara-Chandra & Taylor (2020) Randriamanakoto, Z., Ishwara-Chandra, C.H., Taylor, A. R. 2020, MNRAS, 496, 3381
- Rawlings, Eales & Lacy (2001) Rawlings, S., Eales, S., Lacy, M. 2001, MNRAS, 322, 523
- Reynolds & Begelman (1997) Reynolds, C.S., Begelman, M. C. 1997, ApJ, 487, 135
- Rossetti et al. (2006) Rossetti, A., Fanti, C., Fanti, R., Dallacasa, D., Stanghellinni, C. 2006, A&A, 449, 49
- Rossetti et al. (2008) Rossetti, A., Dallacasa, D., Fanti, C., Fanti, R., Mack, K.-H. 2008, A&A, 487, 865
- Saikia & Kulkarni (1994) Saikia, D.J., Kulkarni, V.K. 1994, MNRAS, 270, 897
- Saikia & Gupta (2003) Saikia, D.J., Gupta, N. 2003, A&A, 405, 499
- Saikia et al. (2003) Saikia, D.J., Jeyakumar, S., Mantovani, F., Salter, C.J., Spencer, R.E., Thomasson, P., Wiita, P.J. 2003, PASA, 20, 50
- Saripalli et al. (2012) Saripalli, L., Subrahmanyan, R., Thorat, K., Ekers, R.D., Hunstead, R.W., Johnston, H.M., Sadler, E.M. 2012, ApJS, 199, 27
- Schoenmakers et al. (2000) Schoenmakers, A.P., de Bruyn, A.G., Röttgering, H.J.A., van der Laan, H., Kaiser, C.R. 2000, MNRAS, 315, 371
- Shabala et al. (2020) Shabala, S.S., Jurlin, N., Morganti, R., Brienza, M., Hardcastle, M.J., Godfrey, L.E.H., Krause, M.G.H., Turner, R.J. 2020, A&A, 496, 1706
- Singh et al. (2016) Singh, V., Ishwara-Chandra, C.H., Kharb, P., Srivastava, S., Janardhan, P. 2016, ApJ, 826, 132
- Slee et al. (2001) Slee, O.B., Roy, A.L., Murgia, M., Andernach, H., Ehle, M. 2001, AJ, 122, 1172
- Stanghellini et al. (2005) Stanghellini, C., O’Dea, C.P., Dallacasa, D., Cassaro, P., Baum, S.A., Fanti, R., Fanti, C. 2005, A&A, 443, 891
- Stawarz et al. (2008) Stawarz, L., Ostorero, L., Begelman, M.C., Moderski, R., Kataoka, J., Wagner, S. 2008, ApJ, 680, 911
- Taylor, Stil & Sunstrum (2009) Taylor, A.R., Stil, J.M., Sunstrum, C. 2009, ApJ, 702, 1230
- Thompson et al. (1994) Thompson, D., Djorgovski, S., Vigotti, M., Grueff, G. 1994, AJ, 108, 828
- Thompson et al. (2000) Thompson, D., Aftreth, O., Soifer, B.T. 2000, AJ, 120, 2331
- Tinti et al. (2005) Tinti, S., Dallacasa, D., de Zotti, G., Celotti, A., Stanghellini, C. 2005, A&A, 432, 31
- Wegner et al. (2003) Wegner, G., Salzer, J.J., Jangren, A., Gronwall, C., Melbourne, J. 2003, AJ, 125, 2373
Appendix A Images of the target sources
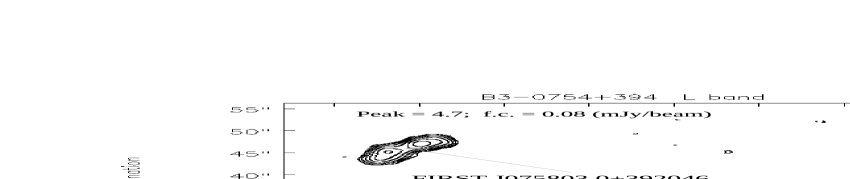
In Figs. 4, 5, and 6 we show images of the sources observed with the VLA, VLBA, and eMERLIN, respectively. On each image, we provide the source name, the observing band, the peak brightness (peak) and the first contour (f.c.), which is three times the off-source noise level on the image plane. Contours increase by a factor of 2. The beam is plotted in the bottom left-hand corner of each image. For the VLA data sets with polarization information, the color-scale represents the polarization intensity, while vectors represent the EVPA.


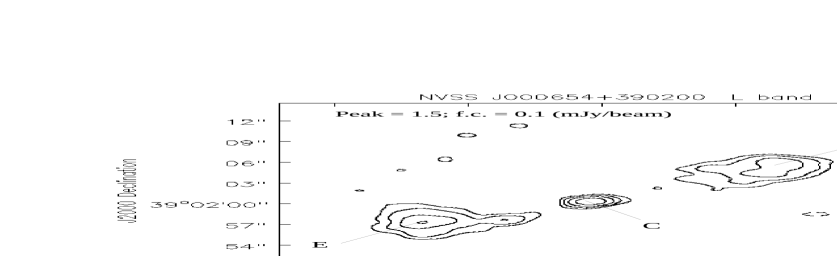
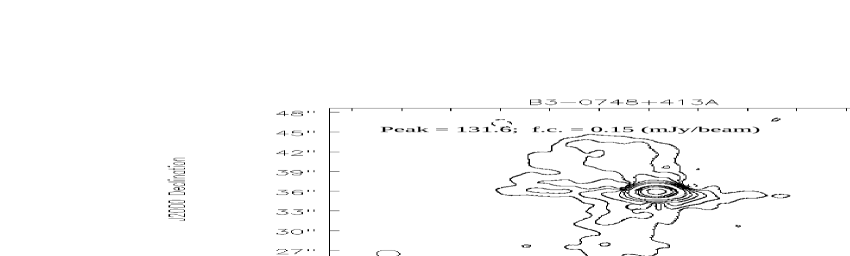
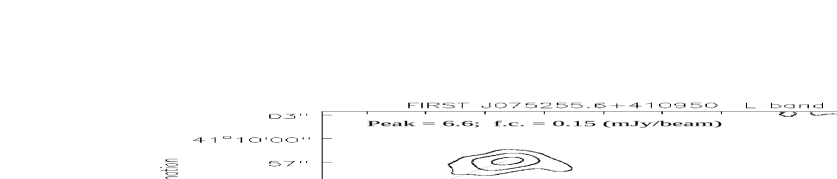
Appendix B Field sources
In L band we had to image several objects that fall within the
primary beam of the array. For no high-angular
resolution observations are available in the literature, here we
provide information on the radio structure and flux density at 1.5 GHz
based on images with a resolution of about 1 - 1.5 arcsec (Table
8). Flux density is measured on images corrected for the
response of the primary beam.
Images are presented in Fig. 7.
| Source name | RA (J2000) | Dec (J2000) | Component | Flux density | Morph. |
|---|---|---|---|---|---|
| mJy | |||||
| NVSS J000654+390200 | 00:06:54.54 | 39:02:00.34 | Tot | 9.70.4 | FRII |
| W | 4.20.2 | ||||
| C | 1.50.1 | ||||
| E | 4.00.2 | ||||
| B3-0004+387 | 00:07:30.34 | 39:03:47.0 | Tot | 42.51.3 | U |
| NVSS J014352+385702 | 01:43:52.46 | 38:57:02.38 | Tot | 29.40.9 | U |
| B3-0748+413A | 07:51:45.16 | 41:15:35.93 | Tot | 180.35.5 | Cx |
| FIRST J075255.6+410950 | 07:52:55:.63 | 41:09:51.07 | Tot | 20.70.7 | CJ? |
| W | 15.30.2 | ||||
| C | 1.70.2 | ||||
| E | 3.30.2 | ||||
| B3-0754+394 | 07:58:00.06 | 39:20:29.20 | Tot | 11.30.4 | U |
| FIRST J075803.0+392046 | 07:58:02.97 | 39:20:47.1 | Tot | 20.60.7 | FRI? |
| NVSS J085935+401826 | 08:59:35.96 | 40:18:26.13 | 22.60.7 | U | |
| NVSS J104144+420746 | 10:41:44.00 | 42:07:46.08 | Tot | 9.90.3 | T |
| N | 0.50.1 | ||||
| C | 4.90.2 | ||||
| S | 4.50.2 | ||||
| NVSS J104134+420916 | 10:41:34.78 | 42:09:16.43 | Tot | 8.10.2 | SR |
| WISEA J114540.82+452230.7 | 11:45:40.81 | 45:22:31.05 | Tot | 5.90.2 | U |

Appendix C Spectral fits
In Fig. 8 we present the integrated spectrum of the
sources along with the best-fit CI model and best-fit
CI OFF model. In Table 9 we report the parameters of
the fits.


| Source | CI | CI OFF | |||||||
|---|---|---|---|---|---|---|---|---|---|
| GHz | MHz | GHz | MHz | ||||||
| B3-0003+387 | 0.810.02 | 2.60.3 | - | 8.1 | 0.50.1 | 1.00.4 | 0.160.02 | - | 0.76 |
| B3-0034+444 | 0.830.02 | 10.83.3 | - | 0.96 | 0.840.03 | 31 | 0.5 | - | 0.97 |
| B3-0128+394 | 0.680.03 | 2.20.4 | - | 1.2 | 0.570.10 | 1.40.6 | 0.060.03 | - | 0.87 |
| B3-0140+387 | 1.100.01 | 3.00.5 | 1018 | 2.1 | 1.10.2 | 5.02.5 | 0.05 | 9810 | 2.0 |
| B3-0748+413B | 1.060.01 | - | 7.46 | 1.060.01 | - | - | 7.63 | ||
| B3-0754+396 | 0.580.02 | 1.10.2 | - | 0.58 | 0.780.10 | 8.54.5 | 0.001 | - | 0.86 |
| B3-0810+460B | 0.590.01 | 0.20.05 | - | 0.58 | 0.990.01 | 0.001 | - | 0.99 | |
| B3-0856+406 | 0.990.01 | 1.70.2 | - | 5.05 | 0.830.03 | 0.80.2 | 0.060.01 | - | 4.21 |
| B3-1016+443 | 0.780.07 | 2.51.2 | 20020 | 3.62 | 0.800.07 | 16 | 0.89 | 20015 | 4.71 |
| B3-1039+424 | 0.720.01 | 1.80.2 | - | 1.65 | 0.530.01 | 0.70.2 | 0.070.01 | - | 0.95 |
| B3-1049+384 | 0.550.10 | 1.81.0 | 24020 | 2.04 | 0.550.15 | 12 | 0.84 | 23030 | 2.29 |
| B3-1133+432 | 0.430.06 | 219 | 72040 | 2.76 | 0.540.20 | 12 | 0.89 | 620100 | 13.1 |
| B3-1143+456 | 0.880.03 | 2.30.4 | 10610 | 1.36 | 0.980.07 | 15 | 0.27 | 10710 | 1.79 |
| B3-1212+380 | 0.730.01 | 0.90.2 | - | 0.93 | 0.950.04 | 30 | 0.30 | - | 2.35 |
| B3-1216+402 | 0.720.15 | 9.44.7 | - | 1.21 | 0.760.02 | 29 | 0.3 | - | 1.37 |
| B3-1225+442 | 0.500.07 | 1.00.5 | 8915 | 1.80 | 0.500.15 | 5.2 | 0.870.35 | 620100 | 1.02 |
| B3-1340+439 | 0.650.05 | 1.90.7 | 20015 | 5.70 | 0.360.08 | 0.8 | 0.160.05 | 17435 | 3.24 |
| B3-1449+421 | 0.900.05 | 2.20.8 | 28020 | 5.80 | 0.850.08 | 12 | 0.86 | 27015 | 6.18 |