11email: vlasblom@strw.leidenuniv.nl 22institutetext: European Space Research and Technology Centre, Keplerlaan 1, 2200 AG Noordwijk, Netherlands
22email: gdemarchi@esa.int
Photometric determination of the mass accretion rates of pre-main-sequence stars
VIII. Recent star formation in NGC 299††thanks: Based on observations with the NASA/ESA Hubble Space Telescope, obtained at the Space Telescope Science Institute, which is operated by AURA, Inc., under NASA contract NAS5-26555.
††thanks: Tables 1 and 3 are available in electronic form at the CDS via anonymous ftp to cdsarc.cds.unistra.fr (130.79.128.5) or via https://cdsarc.cds.unistra.fr/cgi-bin/qcat?J/A+A/
We studied the properties of the young stellar populations in the NGC 299 cluster in the Small Magellanic Cloud using observations obtained with the Hubble Space Telescope in the , and bands. We identified 250 stars with H excess exceeding 5 and an equivalent width of the H emission line of at least 20 Å, which indicates that these stars are still undergoing active accretion and therefore represent bona fide pre-main-sequence (PMS) objects. For 240 of them, we derived physical stellar parameters such as the mass, age, and mass accretion rate by comparing the observed photometry with theoretical models. We find evidence that suggests the existence of two populations of PMS stars, one with a median age of around 25 Myr and the other about 50 Myr old. These ages are consistent with previously determined ages for the main population of the cluster. The average mass accretion rate for these PMS stars is M⊙ yr-1, which is comparable to the values found with the same method in other low-metallicity, low-density clusters in the Magellanic Clouds, but is about a factor of three lower than those measured for stars of similar mass and age in denser Magellanic Cloud stellar regions. Our findings support the hypothesis that both the metallicity and density of the forming environment can affect the mass accretion rate and thus the star formation process in a region.
A study of the spatial distribution of both massive stars and (low-mass) PMS objects reveals that the former are clustered near the nominal centre of NGC 299, whereas the PMS stars are rather uniformly distributed over the field. Although it is possible that the PMS stars formed in situ in a more diffuse manner than massive stars, it is also plausible that the PMS stars formed initially in a more compact structure together with the massive stars and were later dispersed due to two-body relaxation. To explore this possibility, we studied the cluster’s stellar density profile. We find a core radius pc and a tidal radius pc, with an implied concentration parameter , suggesting that the cluster could be dispersing into the field.
Key Words.:
stars: formation – stars: pre-main sequence – galaxies: Magellanic Clouds – galaxies: star clusters: individual (NGC 299) – open clusters and associations: individual (NGC 299)1 Introduction
In the current understanding of low-mass star formation (e.g. Hartmann et al. 2016), the lifetime of a protostar is dominated by heavy accretion from the envelope surrounding the central star, and the infalling matter is thought to follow the star’s magnetic field lines, a process known as magnetospheric accretion (Hartmann et al., 1998). The accretion of matter is also thought to be episodic (Hartmann & Kenyon, 1996), and the mass accretion rate can reach values as high as 10-4 M⊙ yr-1 during an accretion outburst (Calvet et al., 2000). Once the envelope is cleared out and the star reaches the pre-main-sequence (PMS) phase of its lifetime, the only accretion of matter onto the central star comes from the circumstellar disk. During this time, the mass accretion rate slows down significantly (Calvet et al., 2000). Near-infrared studies of nearby small star-forming regions have shown accretion rates of about M⊙ yr-1 at ages of Myr and about an order of magnitude less around 10 Myr. Correspondingly, the circumstellar disks of these PMS stars have been found to have a lifetime of around Myr, with very few surviving after 10 Myr (Haisch et al., 2001; Hernández et al., 2007).
In this work, we are interested in the star formation history of the open star cluster NGC 299 in the Small Magellanic Cloud (SMC). To this end, we focus on characterising the PMS stars. Specifically, we focus on the masses, ages, and mass accretion rates of these objects to understand the timing and intensity of the star formation episodes. Usually, the mass accretion rate of young stellar objects is derived through spectroscopy, but this strongly limits what regions can be studied because of the high spatial resolution required in regions at a distance larger than about 1 kpc. As a result, most spectroscopic studies of young stellar objects focus on star-forming regions that are very nearby, which happen to be relatively small and have a metallicity comparable to the solar value. In contrast, star-forming regions in the Magellanic Clouds have a lower metallicity, of roughly to Z⊙ (see, e.g. Russell & Dopita 1992; Geha et al. 1998; Rolleston et al. 2002; Lee et al. 2005; Grocholski et al. 2009; Choudhury et al. 2018). To better understand the star formation process and the effects the environment can have on it, studying the young stellar objects outside the Milky Way and in the Magellanic Clouds in particular is very important, including in a cosmological context since the majority of stars in the Universe formed at z 2 (Madau & Dickinson, 2014), when the prevailing metallicity was similar to that of the Magellanic Clouds.
A method for identifying PMS stars in extragalactic regions through photometry was proposed by De Marchi et al. (2010). Since excess H emission is a characteristic signature of the presence of accretion onto a PMS star (Calvet et al., 2000), De Marchi et al. (2010) propose identifying PMS stars by looking at their colour excess. We follow this same method for our work, as explained in more detail in Sect. 4. Interestingly, using this method allowed De Marchi et al. (2010) (see also De Marchi et al. 2011a, 2013, 2017) to identify PMS stars that still show signs of accretion well beyond the typical 10 Myr expected lifetime of the circumstellar disks in nearby Galactic star-forming regions of low total mass, such as Taurus, Oph, Chamaeleon, and Cep OB2 (see, e.g. Sicilia-Aguilar et al. 2010).
It is presently not known how these disks can still feed their central stars for well over 20 Myr, but one possibility is the lower metallicity of the star-forming regions in the Magellanic Clouds. A lower metallicity of the gas in the circumstellar disk likely dampens the effect of the radiation pressure on the gas itself (see, e.g. Wilson et al. 2019), which in turn could cause the circumstellar disk to be dispersed less efficiently, extending the duration of the accretion process. Indeed, De Marchi et al. (2017) find that the mass accretion rate for objects of similar ages and masses is typically lower in lower-metallicity environments. However, De Marchi et al. (2017) also note that the cluster NGC 602 in the SMC seems to depart from the relation they derived. Even though its metallicity is similar to that of the other SMC cluster in their sample, NGC 346, the accretion rate for stars of similar masses and ages is a factor of about two lower. They point out, however, that this cluster is located in a lower-density environment compared to the other clusters that they studied. Differences in the environments can be seen, for example, in the map of the dust surface density of the SMC (Utomo et al., 2019). Following up on this, Tsilia et al. (2023) studied the cluster NGC 376, also located in a low-density region of the SMC, and found it to have mass accretion rates similar to those found in NGC 602. These mass accretion rates were again systematically lower compared to NGC 346, a SMC cluster in a higher-density environment, further suggesting that the environment of a cluster may have a significant impact on the mass accretion rate. Similar indications come from the works of Biazzo et al. (2019) and Carini et al. (2022), who studied PMS objects in the Large Magellanic Cloud (LMC) clusters LH 95 and LH 91, respectively. They find that regions with lower dust densities also have lower mass accretion rates (and possibly lower gas densities).
As already mentioned, here we study the cluster NGC 299, a young and relatively small cluster in the western outskirts of the SMC expected to have a relatively low density. The cluster age has been estimated in previous studies to be roughly 25 Myr (Piatti et al., 2008; Glatt et al., 2010). The age of the cluster, combined with the metallicity and density of the environment, makes it a suitable candidate for studying the impact of a cluster’s environment on the process of accretion onto PMS stars.
The structure of the paper is as follows: in Sect. 2 we present the data and the photometric analysis. Section 3 is devoted to the colour-magnitude diagram (CMD) and an assessment of the extinction. In Sect. 4 we discuss how to identify PMS stars, and in Sect. 5 we derive their physical parameters and associated uncertainties. Section 6 is devoted to a study of the dynamical state of the cluster. A summary and conclusions are provided in Sect. 7.
2 Observations and photometry
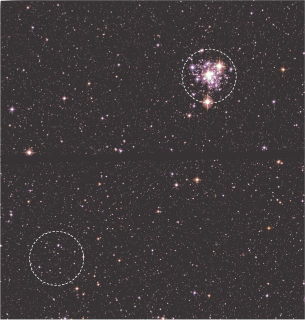
For this work, images obtained with the Hubble Space Telescope (HST) in three different photometric bands are used. The exposures taken in the F555W band (hereafter denoted as the ‘’ band) and in the F814W band (hereafter ‘’ band) were collected in 2004 September, as part of proposal number 10248 (principal investigator: A. Nota). These exposures were taken using the Wide Field Channel (WFC) of the Advanced Camera for Surveys (ACS). The exposure times for these images are 1858 and 1966 s in the and bands, respectively. In addition to these long exposures, short exposures of 3 s duration were also secured to allow for the correction of saturated stars. We also use exposures taken in the F656N band (hereafter denoted as the ‘’ band). These images were taken in 2013 August, as part of proposal number 13009 (principal investigator: G. De Marchi) and they were obtained from the UV/Visible (UVIS) channel of the Wide Field Camera 3 (WFC3). The combined image has an equivalent exposure time of 2394 s. All downloaded images were already subjected to the standard HST calibration pipeline, which takes into account the bias offset, dark current, and flat-fielding correction, as well as the compensation for charge transfer efficiency and geometric distortion. All of this was done according to the ACS and WFC3 data handbooks (see Ryon 2022; Dressel 2022). A true-colour image of the region is shown in Fig. 1.
To conduct the photometric analysis of the cluster, the DAOPHOT routine in IRAF (Image Reduction and Analysis Facility) was used (Tody, 1986). We selected our objects by requiring them to be brighter than the local background by at least five times the local standard deviation of the background. Then, the magnitudes of these objects were determined using an aperture of 2 pixels in radius and a sky annulus that runs from 3 to 5 pixel. An aperture correction was applied to take into account the corresponding encircled energies and a zero-point correction was applied to properly calibrate the stellar magnitudes. For this, the ACS and WFC3 data handbooks were again followed.
Next, we narrowed down our dataset by selecting the stars with reliable photometry for the CMD we subsequently constructed (see Sect. 3). We selected stars with a combined uncertainty in the and bands of less than mag, and once we added the photometry, we further narrowed this selection to contain only stars with an uncertainty less than mag. In total, 46617 objects are detected by our initial photometric analysis of the data, of which 7929 satisfy the conditions set on the uncertainties in the , and bands. Only these objects are considered in the rest of this work.
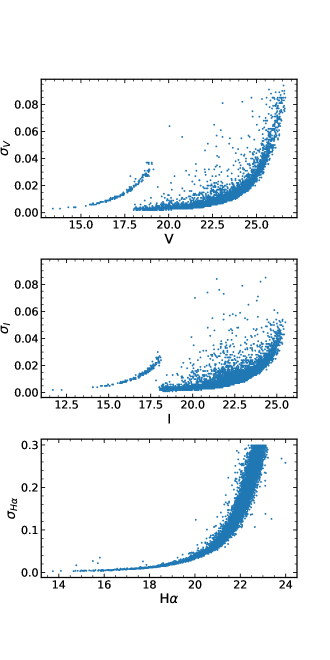
We show in Fig. 2 the photometric uncertainty as a function of the magnitude in the various bands. The larger uncertainty in the band is due to the narrower filter, compared to the and bands. The two sets of points in the graphs for the and bands correspond to the two different exposure times.
The positions, magnitudes and uncertainties in the , , and bands for all 7929 stars in our final sample are contained in Table 1, of which only the first few lines are shown here.
| ID | RA | Dec. | ||||||
|---|---|---|---|---|---|---|---|---|
| 1 | 0:53:24.0054 | -72:13:53.492 | 17.82 | 0.02 | 19.13 | 0.03 | 18.10 | 0.01 |
| 2 | 0:53:24.2016 | -72:13:52.578 | 21.98 | 0.01 | 22.65 | 0.01 | 21.68 | 0.14 |
| 3 | 0:53:24.0404 | -72:13:52.202 | 21.08 | 0.01 | 21.78 | 0.01 | 21.54 | 0.11 |
| 4 | 0:53:25.3437 | -72:13:52.041 | 21.89 | 0.01 | 22.51 | 0.01 | 22.25 | 0.13 |
| 5 | 0:53:23.9860 | -72:13:51.467 | 21.38 | 0.01 | 21.87 | 0.01 | 21.76 | 0.13 |
| 6 | 0:53:25.6099 | -72:13:51.432 | 22.49 | 0.01 | 23.34 | 0.01 | 22.37 | 0.20 |
| 7 | 0:53:25.1182 | -72:13:51.189 | 19.14 | 0.00 | 19.11 | 0.00 | 19.08 | 0.02 |
| 8 | 0:53:24.7255 | -72:13:51.185 | 20.31 | 0.01 | 21.37 | 0.01 | 20.63 | 0.06 |
| 9 | 0:53:24.6611 | -72:13:51.214 | 18.45 | 0.01 | 19.67 | 0.01 | 18.66 | 0.02 |
| 10 | 0:53:24.5414 | -72:13:50.998 | 23.37 | 0.02 | 24.12 | 0.02 | 22.69 | 0.24 |
3 Colour-magnitude diagram
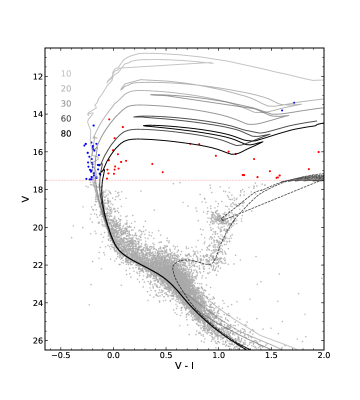
The resulting CMD is shown in Fig. 3, where all 7929 stars in our finally selected sample are marked in grey. Stars with excess emission above a certain threshold (PMS candidates) are shown in red. These stars, their detection method, and their physical properties are discussed in Sects. 4 and 5. Stars brighter than (see the thin horizontal line in Fig. 3) were measured on the short exposures, to avoid the effects of saturation.
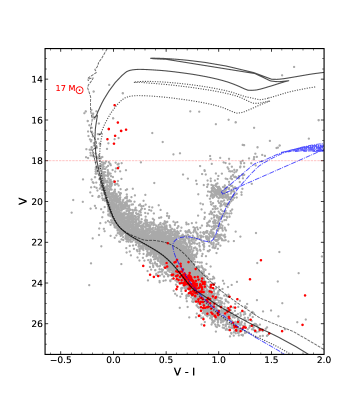
The CMD reveals a prominent main sequence (MS) that contains quite a few bright, massive stars, as well as many old stars in the red giant branch (RGB), along which the red clump (RC) can also be identified. The RC is slightly extended, revealing the presence of some differential extinction in this field (see, e.g. De Marchi et al. 2014; Yanchulova Merica-Jones et al. 2017), which we discuss later.
The isochrones shown in Fig. 3 correspond to ages of 10, 30, and 60 Myr (the dashed, solid, and black dotted lines, respectively), as well as 4 Gyr (the dot-dashed blue line) for the RGB. The isochrones, from the Padova group (see, e.g. Marigo et al. 2017, and references therein) correspond to metallicity , as appropriate for the SMC (see, e.g. Russell & Dopita 1992; Rolleston et al. 2002; Lee et al. 2005), and already include the reddening contribution of the Milky Way along the line of sight (; Carlson et al. 2007; Schmalzl et al. 2008). The 30 Myr isochrone appears to agree well with the approximate age of the cluster. Concerning the PMS stars, we can already see that there is some age spread in the CMD, even after taking into account the photometric uncertainty, with PMS candidates both younger and older than 30 Myr. We examine this in more detail in Sect. 5.1. The massive stars also reveal a spread in age. The bluest objects are compatible with ages younger than 30 Myr and most likely closer to 10 Myr. In that case, the most massive of these stars, at would have a mass of M⊙. On the other hand, red supergiants appear to have an age close to Myr.
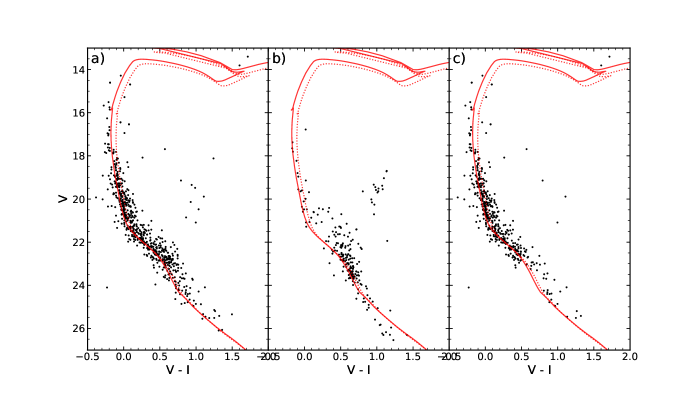
To assess the effects of differential extinction, one would ideally remove the contribution of the field stars in the image from the CMD. However, due to the fact that no dedicated offset region has been observed for this purpose, completely removing this contamination is difficult. It is completely possible that different populations of stars are interspersed throughout the image. This is also discussed further in Sect. 6.1, where we show, for example, that the massive stars are distributed throughout the image (although most of them are still near the cluster). This is not surprising, as we just concluded from the CMD that their approximate age is 30 Myr, so they can indeed have moved away from the cluster itself. Thus, we performed a statistical subtraction where we subtract a sample of off-cluster stars from the CMD. As our cluster sample, we selected all stars within a radius of 15 around the cluster centre, and all stars within a region of the same size but at the opposite corner of the image as our off-cluster sample. The location and approximate size of these regions is indicated in Fig. 1.
We constructed a CMD for both the cluster and off-cluster samples (shown in panels a) and b) of Fig. 4) and then performed a statistical subtraction. We divided the CMDs into smaller cells and counted the number of stars in each cell in the cluster CMD and off-cluster CMD. The cells, which are identical in both CMDs, are defined in such a way that there are enough objects in each of them for the cluster CMD, in order to limit the effects of small number statistics. The statistically-subtracted CMD is shown in panel c) of Fig. 4. Along with the CMDs, two isochrones are shown, one for an age of 30 Myr (same as in Fig. 3), and the other for the same age but shifted by an amount corresponding to twice the extinction produced by the Milky Way galaxy in the direction of the SMC, namely A, E(V-I) = 0.04 (e.g. Sabbi et al. 2011).
As panel c) of Fig. 4 shows, the cluster MS is rather narrow. Its spread is contained mostly within the separation of the two isochrones, indicating that the extinction experienced by the cluster is likely no more than twice the foreground extinction caused by the Milky Way. This corresponds roughly to an uncertainty of no more than in colour and in the magnitude, which in this analysis can be considered as negligible for our purposes. So, differential extinction is not considered further in this work.
4 Identifying PMS stars
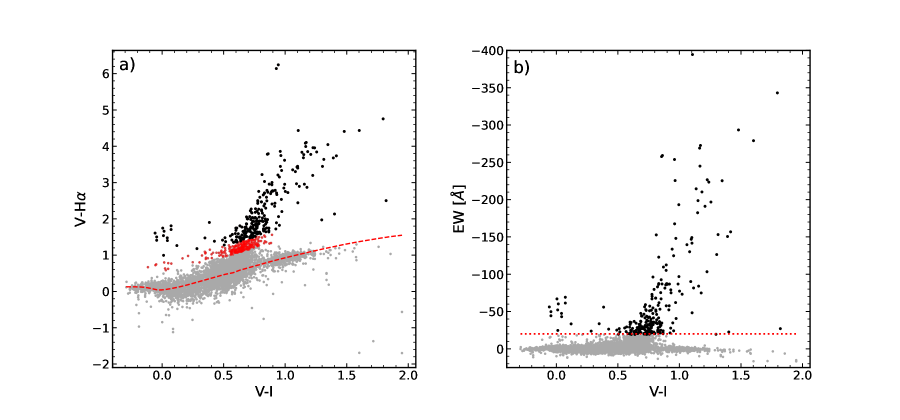
The selection of PMS star candidates is based on the identification of objects with excess emission. This is illustrated in the colour-colour diagram (CCD) shown in panel a) of Fig. 5, where the colour is plotted against the colour. The red dashed line in this figure shows, as a reference, the expected colours of normal MS stars, as per the models of Bessell et al. (1998) for metallicity . In the rest of the paper we refer to this as the ‘reference curve’. Stars with excess emission stand out in a graph of this type, since they have colours larger than those of the reference curve at the same colour (see De Marchi et al. 2010, 2011a, for more details) We initially selected the stars with an excess larger than 5 to be our bona fide PMS stars, where is the combined uncertainty in the colour.
It should be noted that the measurements in the and bands are contemporaneous with each other, but not with the measurements. However, the excess emission observed is far too large to be caused by photometric variability of the continuum. Variations of this type are rare, so it is unlikely that so many of such variable stars are all present in our sample. In fact, when searching our field of view in the Optical Gravitational Lensing Experiment (OGLE) survey111ogledb.astrouw.edu.pl/~ogle, only five variable stars can be found. Two of these are Cepheid variables with amplitudes of 0.5 and 0.3 magnitudes, respectively, and the other three are long-period variables with amplitudes between 0.016 and 0.006 mag. So, none of the known variable stars in the field of NGC 299 have the required variability to show an excess as large as what we see in our data.
To improve the selection criterion, we also derived the equivalent width (EW) of the emission line that corresponds to the observed colour difference between the value of a star and that of the reference curve for the same value of (which in practice provides the level of the continuum). In the case of narrow-band photometry, following De Marchi et al. (2010) and using the rectangular width (RW) of the filter (which is conceptually similar to the EW and fully defined by the properties of the filter), the EW of the line probed by the filter can be written as
| (1) |
where
| (2) |
Here, is the excess, the difference between the observations (subscript ‘obs’) and the reference curve (subscript ‘ref’). The RW is specific to the F656N filter mounted on the WFC3 instrument and corresponds to 17.679. The resulting EW as a function of the colour can be seen in panel b) of Fig. 5. Since the lines are in emission, we assigned a negative value to them, following the standard convention. Placing a condition on the EW, in addition to the one on the strength of the excess emission, allows us to avoid some slowly rotating stars and brown dwarfs with active chromospheres. It was shown by White & Basri (2003) that such stars typically have an absolute EW of less than 10Å, while classical T Tauri stars have a much larger EW. Since we do not have spectra for our candidate PMS stars, our determination of the EW is necessarily less accurate. Therefore, we adopt a more conservative threshold than that suggested by White & Basri (2003), namely EW Å. This also allows us to exclude stars with active chromospheres from our sample. When combining this criterion together with our 5 selection on the excess, this selection yielded 250 objects, which we consider bona fide PMS candidates.
Figure 5 also reveals that most stars with excess are found in a sort of ‘plume’ starting at , but there is a small group of 10 much bluer stars. In the CMD in Fig. 3, these objects are located at magnitude , next to the upper MS, whereas the other stars are much fainter. This small group of bright stars could be Be type stars, characterised by emission due to their intense winds (see, e.g. Porter & Rivinius 2003). We did not consider these objects further in this work, where we concentrate on the remaining 240 stars with excess.
5 Physical properties of PMS stars
In the following sections, we address the properties of the PMS stars that were identified in Sect. 4. This identification is based on a detection of excess emission at the 5 level and an EW Å at the time that the observations were taken. Thus, it is possible and, in fact, likely that the 240 objects identified are but a fraction of the overall PMS population in this field, owing to the large variations in the PMS stars’ emission over hours and days (e.g. Fernandez et al. 1995; Smith et al. 1999; Alencar et al. 2001). Nevertheless, these are the PMS objects that we can securely identify in this field and we expect them to represent a statistically significant sample of the overall population of PMS stars.
5.1 Masses and ages
As mentioned before, the isochrones in Fig. 3 can give us an approximate idea as to the age of the PMS stars. To obtain a more accurate determination of the ages, we follow Romaniello (1998), who proposed a statistical analysis of the positions of the stars in the CMD, or better Hertzsprung–Russell diagram (HRD), taking into account the uncertainties on the measured parameters. This method (hereafter the ‘Sieve’) was later refined by De Marchi et al. (2011a, b, 2013, 2017). It provides the probability distribution for each individual star to have a given value of the mass and age, given the specific photometric uncertainties affecting it. The method rests on the measurement errors alone and does not make any assumptions about the properties of the population, like for instance the functional form of the initial mass function.
Since the uncertainties on the measured parameters of the stars (effective temperature and bolometric luminosity ) depend on the accuracy of the photometry, we included in our sample only stars with a combined uncertainty in and of less than mag (see Sect. 2). Furthermore, even though some differential extinction might be present, we showed that it is very limited in this field, as revealed by Fig. 4. Thus, ignoring it will not affect significantly the determination of masses and ages.
To follow the Sieve method, we first constructed the HRD. We derived the effective temperature from the de-reddened colours (only Milky Way foreground extinction was considered, as mentioned above), through interpolation in the Bessell et al. (1998) models. We then computed the bolometric luminosity of the stars from the de-reddened magnitude in the band, adopting a distance modulus to the SMC of 18.91 0.04 (Sabbi et al., 2011) and the model atmospheres from Bessell et al. (1998). The typical uncertainty on is of the order of 100 K, while that on ranges between %.
The positions of the stars in the HRD are sampled using a uniform grid with evenly spaced cells and logarithmic steps in both temperature and luminosity. The sizes of the cells are set by the typical observational uncertainties. The cells are compared with the PMS evolutionary tracks of Tognelli et al. (2011) for (as appropriate for the SMC), after interpolation to a fine mass grid with a logarithmic step of . The most likely mass and age in each cell are computed from the time of permanence in the cell of all tracks that cross it. For any observed star, the cell of the grid to which that star belongs provides the most likely mass and age. In the comparison with these evolutionary tracks, binarity is not taken into account. The procedure is discussed in detail by De Marchi et al. (2017), to whom we refer the reader for further details.
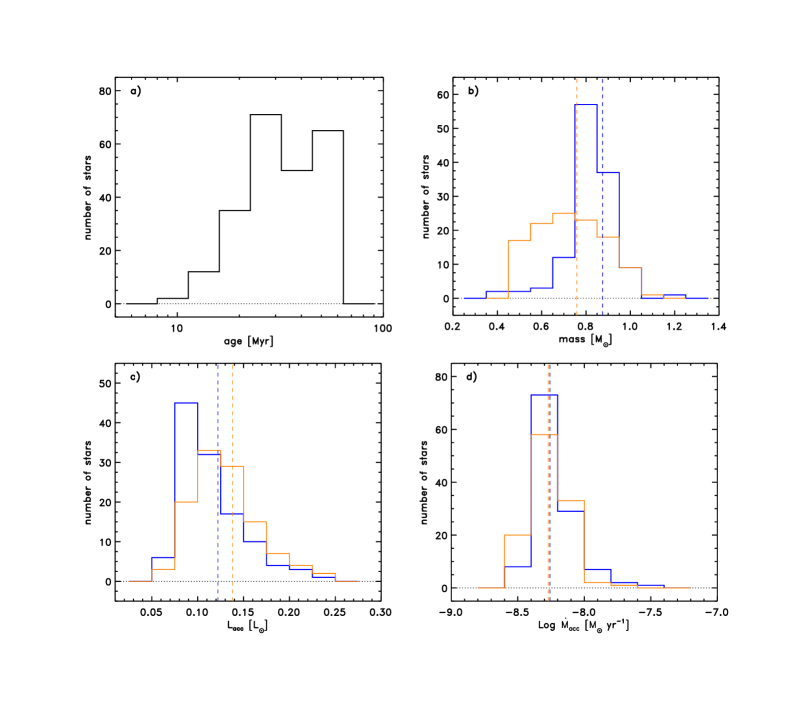
The resulting ages and masses for the 240 PMS stars in our sample are shown by the histograms in Fig. 6a) and 6b), respectively. The age distribution is binned in logarithmic steps of , which is a conservative estimate of the typical age uncertainty (De Marchi et al., 2011b). In this diagram, peaks can be seen at the bin between 23 and 32 Myr as well as at the bin between 45 and 64, with a slight trough in between. This suggests that there might be two different age groups present in the cluster, with median ages around Myr and 50 Myr. This suggests that the region might have undergone two separate episodes of star formation in the recent past. Indeed, as already mentioned in Sect. 3, we also see a similar split in the ages with the massive stars. We have also separated the two groups of younger and older PMS stars in the other panels of Fig. 6, with the split in ages placed at 32 Myr in consideration of our choice of age bins.
The mass distribution of the PMS stars is shown in Fig. 6b), where the histogram of PMS stars younger than 32 Myr is shown in blue, while that of older stars is indicated in orange. The median of each distribution is also indicated with a vertical dashed line of the respective colour. The identified PMS stars range in mass between and M⊙, with most stars having masses between and 1 M⊙. From this diagram, it seems that the PMS stars in the younger group are generally more massive than the older ones, with the younger stars having an average mass of M⊙ and the older stars having an average mass of M⊙, although these values do overlap within their uncertainty. This is understood, from a physical perspective, because as time proceeds more of the massive PMS stars reach the MS and are no longer undergoing accretion and thus are no longer detectable as objects with excess emission. However, it is also possible that our mass distribution of the younger PMS stars is slightly skewed towards higher masses. In the CMD, potential young, low-mass PMS stars would be at colours redder than (see also Fig. 3), implying that they are more than times fainter in than in , which would make them harder to detect. The steep drop in number of young PMS stars with masses smaller than M⊙ could be an indication of such a limitation in sensitivity in the band.
5.2 Accretion luminosity and mass accretion rate
The accretion luminosity is derived from . Following De Marchi et al. (2010), can be derived from the net excess emission H, already defined in Eq. 2, the distance modulus to the SMC (), as well as the sensitivity of the F656N filter (for further details, see De Marchi et al. 2010, 2011a, 2013). We can then relate to with the following equation (see, e.g. De Marchi et al. 2010, 2017):
| (3) |
Equation 3 makes the implicit assumption that there is a linear relationship between and . However, based on a purely empirical fit to the data, other authors have pointed out that the relationship is not necessarily linear and that the index can change with the value of (see, e.g. Alcalá et al. 2017, and references therein). The uncertainty on the derived best fitting parameters in those works, however, is large. So, in the absence of a compelling reason for a non-linear relationship (see, e.g. Clarke & Pringle 2006), we continued to adopt a linear relationship between the two quantities. Recently, Tsilia et al. (2023) combined literature data (including those from the work of Alcalá et al. 2017) and derived a new linear relation between and for a sample of 76 objects. The updated relationship that they obtain is , and therefore slightly less steep than the one of De Marchi et al. (2010, 2017). However, within the uncertainties, the two slopes agree, so we continued to use the original relationship of De Marchi et al. (2010, 2017) to make it easier to compare our results with those of previous work on other star-forming regions studied in the same way.
Once the accretion luminosity, , is known, the mass accretion rate, , can be calculated from the free-fall equation:
| (4) |
where is the accretion luminosity of the star, is the gravitational constant, and is the stellar mass derived in Sect. 5.1. is the inner radius of the circumstellar disk. Following Gullbring et al. (1998), we adopted . as the photospheric radius, which is derived from the photometry by comparing the absolute magnitude of the stars () with the theoretical values in the Bessell tracks (), where the radius is assumed to be 1 R⊙, using the adopted distance modulus as per the relationship
| (5) |
where .
Histograms of the distribution of and are shown, respectively, in Figs. 6c) and 6d). Like before, blue and orange lines refer, respectively, to stars younger and older than 32 Myr. Even though, formally, stars younger than 32 Myr appear to have a slightly lower median , namely compared to for the stars older than 32 Myr, within the uncertainties no difference is present. No difference is present in the mass accretion rates either, and the average value of is M⊙ yr-1. All of these parameters are also summarised in Table 2. The positions, observed magnitudes, and derived physical parameters of all the 240 bona fide PMS stars are contained in Table 3, of which the first few lines are shown below.
5.3 Uncertainty on the parameters
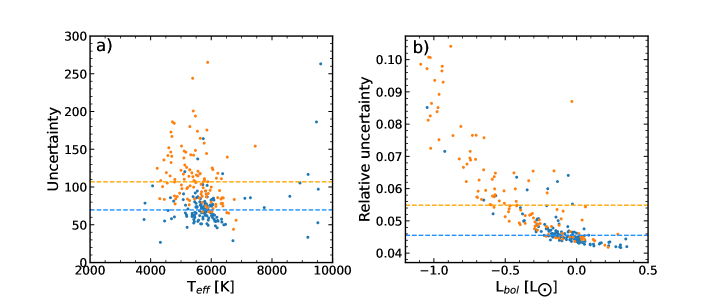
Concerning the uncertainty on the derived physical parameters, we start from the effective temperatures and bolometric luminosities, from which ages and masses were also derived. We show in Fig. 7a) and 7b), respectively, the absolute uncertainty on and relative uncertainty on , as a function of the parameters. PMS objects younger and older than 32 Myr are indicated, as before, respectively in blue and orange, and the dashed lines correspond to the median values. The uncertainty on appears to be tightly correlated with itself and this can be understood because is directly derived from the magnitude, which shows a similar correlation with its uncertainty (see Fig. 2). When considering the two age groups, we notice that the older population typically has a larger uncertainty on both parameters. This is not surprising, since we can see from Fig. 7 that the older population is also typically fainter, in line with our earlier finding that older objects have typically lower mass (Fig. 6b).
As for the age and mass determination, this is limited both by the accuracy of the photometry and by the time resolution allowed by the isochrones, which decreases roughly exponentially as a PMS objects travels across the HRD (or CMD) along its evolutionary track. That means, for our method of age determination, that the closer a star approaches the MS, the less precisely can we know its age. Nonetheless, even though the ability to determine the absolute age of PMS stars is limited, we can still explore and characterise quite accurately any systematical differences in relative ages. In this sense, there might be evidence for the existence of two separate age populations within the cluster, as pointed out in Sect. 5.1. For estimates on the typical uncertainties on the derived parameters, we refer to De Marchi et al. (2017). In that work, it was shown that the typical uncertainty of the age is about 18 %, and the typical uncertainty on the mass is approximately 6 %. It should be noted that the main source of uncertainty in De Marchi et al. (2017) was the reddening. However, we have already shown in Sect. 3 that such an effect is likely negligible for NGC 299, so these values can be considered as upper limits on the uncertainties on our parameters.
Finally, the uncertainty on the accretion luminosity and the mass accretion rate is dominated by the conversion from to (Eq. 3), which De Marchi et al. (2011a) have shown is no larger than dex, implying that the true intrinsic spread in the to conversion cannot be larger than this. Thus, following De Marchi et al. (2017) again, we estimate that the typical uncertainty on and is no more than 23 %. When comparing this finding to our results (Fig. 6d), we can see that our data also show a spread of roughly dex. Thus, we are confident that this value provides a good measure of the general uncertainty of our measurements of the mass accretion rate.
| Younger stars | Older stars | |
|---|---|---|
| Age [Myr] | 23 7 | 47 7 |
| Mass [M⊙] | 0.87 0.11 | 0.76 0.15 |
| [L⊙] | 0.12 0.04 | 0.14 0.05 |
| [M⊙/yr] |
| ID | RA | Dec. | I | V | H | T [K] | L [L⊙] | [R⊙] | [M⊙] | [Myr] | [Myr] | [L⊙] | log [M⊙ yr-1] |
|---|---|---|---|---|---|---|---|---|---|---|---|---|---|
| 11 | 0:53:24.1842 | -72:13:51.023 | 24.50 | 25.80 | 22.35 | 4452 | 1.5E-01 | 0.84 | 0.61 | 44.8 | 6.7 | 2.8E-03 | -8.1 |
| 30 | 0:53:26.4401 | -72:13:47.560 | 24.10 | 24.91 | 22.44 | 5559 | 3.4E-01 | 0.65 | 0.76 | 47.8 | 9.4 | 2.4E-03 | -8.4 |
| 52 | 0:53:29.2780 | -72:13:44.602 | 25.14 | 26.31 | 22.22 | 4674 | 9.4E-02 | 0.56 | 0.57 | 54.6 | 9.4 | 3.4E-03 | -8.1 |
| 137 | 0:53:29.2305 | -72:13:38.996 | 24.09 | 24.94 | 22.44 | 5418 | 3.3E-01 | 0.68 | 0.75 | 49.7 | 9.4 | 2.4E-03 | -8.3 |
| 167 | 0:53:34.0782 | -72:13:37.190 | 24.70 | 25.67 | 22.34 | 5079 | 1.7E-01 | 0.58 | 0.66 | 57.3 | 9.4 | 2.9E-03 | -8.3 |
| 214 | 0:53:33.6330 | -72:13:34.866 | 23.18 | 23.86 | 22.25 | 6018 | 9.0E-01 | 0.88 | 0.92 | 27.9 | 4.7 | 2.1E-03 | -8.4 |
| 254 | 0:53:32.9969 | -72:13:32.793 | 24.80 | 25.61 | 22.39 | 5542 | 1.8E-01 | 0.47 | 0.68 | 53.8 | 9.4 | 2.8E-03 | -8.4 |
| 264 | 0:53:39.4584 | -72:13:32.364 | 23.32 | 24.09 | 22.23 | 5694 | 7.3E-01 | 0.90 | 0.85 | 26.4 | 4.7 | 2.3E-03 | -8.3 |
| 273 | 0:53:30.8870 | -72:13:31.992 | 23.02 | 23.59 | 22.17 | 6525 | 1.2E+00 | 0.84 | 1.00 | 36.3 | 6.7 | 2.2E-03 | -8.4 |
| 335 | 0:53:37.0380 | -72:13:29.779 | 23.11 | 23.96 | 22.21 | 5421 | 8.2E-01 | 1.07 | 0.91 | 15.7 | 2.4 | 2.1E-03 | -8.3 |
5.4 Comparison with other SMC clusters
The typical mass accretion rate of the PMS stars in NGC 299, namely M⊙ yr-1 (or, ), can be compared with the values measured in other clusters with metallicity similar to that of NGC 299. For example, De Marchi et al. (2011a) studied the cluster NGC 346, located in the SMC. Considering objects in that work with ages and masses similar to those of our NGC 299 sample, we find a typical value of (see Fig. 10 in that paper). In a similar work, De Marchi et al. (2013) studied NGC 602 (also located in the SMC). From their Fig. 13, we derive a typical mass accretion rate , again considering only stars with masses and ages similar to those of our PMS stars in NGC 299.
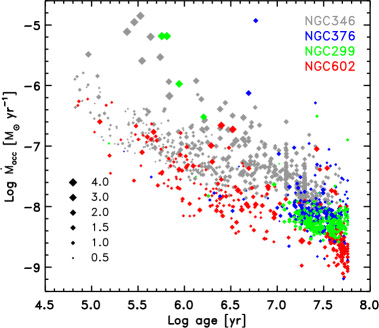
From the results on NGC 346 and NGC 602, combined with those stemming from a number of other regions that the same authors studied, De Marchi et al. (2017) suggest that NGC 602 has a lower characteristic mass accretion rate compared to NGC 346 and the other clusters, possibly because NGC 602 is located in a lower-density environment. This possibility was recently explored by Tsilia et al. (2023), who studied the cluster NGC 376 (also situated in a low-density SMC environment) and found it to have mostly PMS objects with an age of Myr and a typical mass accretion rate . NGC 299 is also located in a lower-density environment, so the typical mass accretion rate that we measure appears to support the hypothesis suggested by De Marchi et al. (2017) that the density of the environment, in addition to the age, mass, and metallicity of the PMS objects, can have an effect on the rate of mass accretion. Aside from calculating the average values for the mass accretion rate, we have also plotted the mass accretion rate as a function of the age for all of the PMS stars detected in all four of these SMC clusters. This is shown in Fig. 8. This clearly shows that the accretion rates found for the stars in NGC 346 (indicated in grey) are typically higher than those found in NGC 376 (blue), NGC 602 (red) and NGC 299 (green). Our hypothesis is further supported by the study of the PMS objects in the LMC clusters LH 95 by Biazzo et al. (2019) and LH 91 by Carini et al. (2022). Both regions are characterised by a low-density environment, as witnessed by their mean dust density (see Carini et al. 2022), and both reveal a systematically lower mass accretion rate for PMS stars in the range M⊙ than denser LMC regions such as 30 Dor. While still tentative, these results suggest that the gas density of the primordial molecular cloud could influence the typical size and mass of circumstellar disks that are formed in the cloud, which will then have an effect on the mass available for accretion onto the stars forming in that region.
Indications of the density of these environments are provided by existing surface density maps of the star-forming regions. Utomo et al. (2019) use Herschel observations to derive a map of the dust distribution and density of the SMC and LMC. These maps show that the dust surface density of the region containing NGC 299 is approximately M⊙ pc-2. We find a value of approximately M⊙ pc-2 for NGC 376, a value of approximately M⊙ pc-2 for NGC 602, and for NGC 346 the value is M⊙ pc-2. This shows that the dust density in NGC 346 is about an order of magnitude larger than that in NGC 376, NGC 602 and NGC 299. One expects that, in general terms, the same ratio will apply to the gas density, as this scales directly with the dust density. The fact that the surface density of the dust in NGC 299 is low is also supported by a visual inspection of the images, revealing a large number of background galaxies, suggesting that there is little dust attenuation in this area of the SMC. This is consistent with our previous analysis of the differential extinction in the field (Sect. 3), which we found to be negligible, as also witnessed by the rather compact shape of the RC in the CMD (Fig. 3). Thus, we can conclude, both in qualitative and quantitative terms, that the dust density and gas density in NGC 299 is low.
It is reasonable to imagine that a low gas density in the area would imply that there is less gas present in the disks around forming stars. This could in turn cause the mass accretion rate to be low, but also possibly cause the accretion timescale to be short. However, when comparing multiple studies of PMS stars in SMC clusters, one finds that the accretion times appear to be similar for clusters in both high- and low-density regions, since similar ages are found for PMS stars in all of these studies. On the other hand, the mass accretion rate appears to be systematically lower in low-density regions (De Marchi et al., 2011a, 2013; Tsilia et al., 2023). Therefore, we conclude that the lower mass of the disks in low-density regions does not affect the duration of the accretion process, but rather its intensity.
6 Dynamical state of NGC 299
6.1 Spatial distribution of PMS stars and massive stars
Our study of the PMS objects in NGC 299 suggests that the cluster might have undergone two recent episodes of star formation, about 25 and 50 Myr ago. The CMD in Fig. 3 reveals that massive stars also appear to be split in two age groups. Comparison with isochrones suggests an age of about 25 Myr for the objects on the upper MS (; ), while red supergiants (; ) are more consistent with an age around 60–80 Myr. Despite the uncertainties inherent in the comparison with isochrones, the CMD shows that two recent star formation episodes are a likely possibility in the region of NGC 299, with at least two populations of PMS and massive stars.
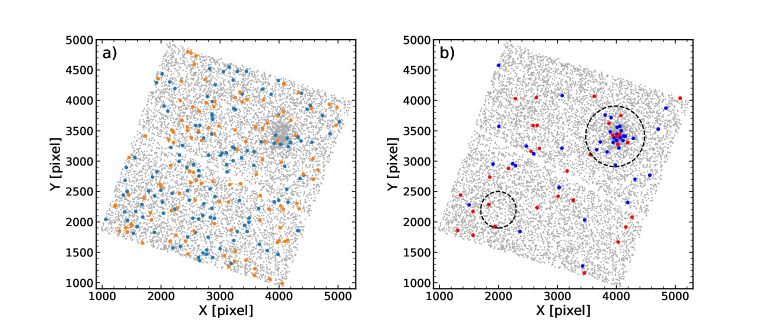
In Fig. 9 we show the spatial distribution of the two populations. Panel a) refers to PMS stars, where like in previous figures we indicate in blue the younger objects and in orange the older ones. As for the massive stars, shown in panel b), we selected objects brighter than (see also Fig. 10) and marked in blue the younger objects and in red the older ones. Although there is a small concentration of younger PMS stars near the centre of the cluster (upper right corner of the image), PMS stars are rather uniformly distributed, regardless of their age. Conversely, massive stars are clearly centrally concentrated, with the younger massive stars (indicated in blue) even more concentrated than the red supergiants. This difference can be clearly seen when considering the distributions of the younger and older massive stars both inside and outside of the 25 radius that is drawn on the diagram. Outside the 25 radius, both the younger and older massive stars are distributed roughly equally. However, within the 25 radius, the younger massive stars are more than twice as numerous as the older massive stars.
All this suggests the presence of mass segregation in NGC 299, since the low-mass PMS stars are much more widely distributed than massive objects. We do not know whether all the PMS stars that we detect formed inside the NGC 299 cluster, but if they did, their current spatial distribution would not be unexpected. Indeed, young star clusters such as NGC 299 can become mass segregated more quickly than one would expect from two-body relaxation processes alone if they formed from clumps of material that were already mass segregated by themselves (see, e.g. McMillan et al. 2007). Furthermore, adopting a typical velocity dispersion of km s-1, these stars can cross a distance of approximately one pc in 1 Myr. Our field of view covers about 50 pc on a side, so with an approximate cluster age of Myr one would expect the low mass stars (i.e. the PMS objects) to be fairly evenly spread throughout the field (see Fig. 9). We note, however, that it is equally possible that these PMS star candidates were not more clustered in the past, but rather formed in a more diffuse manner throughout the cloud. In that case, even if these stars were clustered in very small structures, these would likely have dispersed very quickly so none of that would be visible today.
Concerning massive stars, the older ones have a much wider distribution than the younger massive objects. Since massive stars are likely to form in binaries and multiple systems (Mason et al., 1998; Preibisch et al., 1999; García & Mermilliod, 2001), when one such star explodes as a supernova its companions will be ejected at high speeds. For the older population of massive stars, it is more likely that such a process has already occurred, so this could explain why they are more evenly distributed throughout the field and less centrally concentrated compared to their younger counterparts.
6.2 Stellar density profile
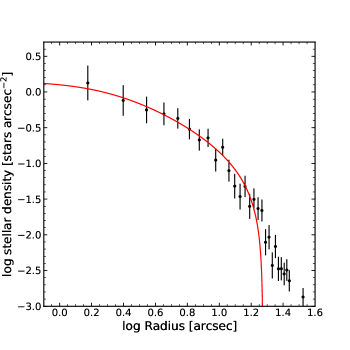
If the wider distribution of PMS candidates is indeed the result of mass segregation, it could be a sign that NGC 299 is currently dispersing into the field. To investigate the dynamical state of NGC 299, we followed a similar procedure to what was done in Sabbi et al. (2011), who studied the SMC cluster NGC 376 and found it to be dispersing into the field. We fitted a King model (King, 1962) to the NGC 299 stellar density profile in order to obtain a measure of the cluster’s core radius, , and tidal radius, . The typical form of the King model is
| (6) |
where is the central density. Equation 6 can also be rewritten to include the tidal radius explicitly, which gives it the following form:
| (7) |
where the and parameters are related as follows:
| (8) |
The stellar density profile was obtained by dividing our image into equally spaced annuli centred on the cluster and summing over the number of stars in those annuli. To limit the effects of photometric incompleteness, only stars brighter than were used in this analysis. Contamination by field stars must be removed from our stellar density profile. This contamination was estimated to be approximately stars/arcsec2, as measured in a small patch of sky in diameter at the edge of our frame, at a projected distance of from the cluster centre.
The best fit of the King model to the background-subtracted stellar density profile is shown in Fig. 11, corresponding to a core radius , or pc, and a tidal radius , or pc. The estimated uncertainty on is approximately c and that on about .
As a reference, the core radius of NGC 299 was determined once before in a study by Hill & Zaritsky (2006), who find a value of 2.44 pc. This is larger than the value provided by our more accurate photometry (0.6 0.15 pc), yet still compatible within the large uncertainty of Hill & Zaritsky (2006). The tidal radius of NGC 299 had not been measured before.
The concentration parameter is routinely used to characterise the dynamical state of a cluster, that is, to establish whether a system is in virial equilibrium (e.g. Meylan & Heggie 1997). In particular, systems with are not in virial equilibrium and dispersion into the field is already advanced. Conversely, tightly bound systems, which describes most globular clusters, have values of . With our constraints on the core radius () and tidal radius (), we find that for NGC 299, namely a concentration parameter around unity. Accordingly, the cluster would seem to still be in virial equilibrium, but the rather low concentration implies that the cluster might have already started to disperse into the field.
Finally, we can also tie this conclusion back to our findings for the two different age populations present in the cluster. We find that there was likely a previous star formation episode some 50 Myr ago, which, however, is hard to separate from the more recent episode on the basis of the masses and current accretion rates of the PMS stars. The finding that NGC 299 could be dispersing into the field is compatible with the two populations being very similar by now, not only in regards to the accretion process, but also the spatial distribution.
7 Summary and conclusions
In this work we study the cluster NGC 299 in the SMC using observations obtained with the ACS and WFC3 instruments on board the HST. We searched for recently formed PMS stars in the field and determined their masses, ages, and mass accretion rates. We also compared our measure of the average mass accretion rate with that of several other SMC clusters to test the hypothesis that the density of the environment could influence the mass accretion process. Additionally, we studied the spatial distribution of the PMS stars and compared it to that of the massive stars in the cluster. Finally, we studied the dynamical state of the cluster by investigating its stellar density profile. The main results of this work can be summarised as follows.
-
1.
We constructed a versus CMD for the cluster and compared it to theoretical isochrones, from which we conclude that NGC 299 is roughly 30 Myr old, confirming previous estimates of its age. From a statistical subtraction of the CMD of the field from that of the cluster, we conclude that extinction within the cluster, although present, is negligible for our purposes.
-
2.
From the versus CCD we detected 250 stars with excess emission above the 5 level and an EW in smaller than -20 Å, which we consider bona fide PMS stars. Ten of them are likely massive Be type stars, which exhibit excess due to stellar winds, and thus are not PMS stars.
-
3.
From a statistical analysis of the position of the remaining 240 bona fide PMS stars in the HRD and comparison to theoretical isochrones, we derived the most likely ages and masses of these stars. In terms of age, there are possibly two populations of PMS stars, with median ages of Myr and 50 Myr.
-
4.
The average mass accretion rate of the PMS stars in NGC 299 is M⊙ yr-1. This value is comparable to that measured in NGC 376 – also an SMC cluster with similarly low metallicity and stellar density – but systematically lower than the SMC cluster NGC 346, which has similarly low metallicity but higher stellar density. This supports the hypothesis that lower-density regions might have systematically lower mass accretion rates for objects of otherwise similar mass, age, and metallicity.
-
5.
The spatial distribution of the PMS stars shows that they are spread rather uniformly throughout the field, with no discernible difference between the two age groups. Conversely, massive stars are more centrally clustered, exhibiting clear signs of mass segregation, with the younger population of massive stars being more concentrated than the older ones.
-
6.
We studied the cluster’s dynamical state by fitting a King model to the stellar density profile. The best fitting parameters are (or pc) and (or pc).
-
7.
We find the concentration parameter, , to be around unity, suggesting that the cluster, while probably still in virial equilibrium, is likely already dispersing into the field.
A better understanding of the accretion process in these low-metallicity environments is expected from the already conducted spectroscopic observations of PMS stars in NGC 346 with the James Webb Space Telescope. A preliminary analysis of those observations (De Marchi et al., 2023) suggests longer timescales for the dissipation of circumstellar disks in low-metallicity environments than in the solar neighbourhood.
Acknowledgements.
We thank the anonymous referee for the helpful comments that helped improve this paper.References
- Alcalá et al. (2017) Alcalá, J. M., Manara, C. F., Natta, A., et al. 2017, A&A, 600, A20
- Alencar et al. (2001) Alencar, S. H. P., Johns-Krull, C. M., & Basri, G. 2001, AJ, 122, 3335
- Bessell et al. (1998) Bessell, M. S., Castelli, F., & Plez, B. 1998, A&A, 333, 231
- Biazzo et al. (2019) Biazzo, K., Beccari, G., De Marchi, G., & Panagia, N. 2019, ApJ, 875, 51
- Calvet et al. (2000) Calvet, N., Hartmann, L., & Strom, S. E. 2000, in Protostars and Planets IV, ed. V. Mannings, A. P. Boss, & S. S. Russell, 377
- Carini et al. (2022) Carini, R., Biazzo, K., De Marchi, G., et al. 2022, arXiv e-prints, arXiv:2203.13647
- Carlson et al. (2007) Carlson, L. R., Sabbi, E., Sirianni, M., et al. 2007, ApJL, 665, L109
- Choudhury et al. (2018) Choudhury, S., Subramaniam, A., Cole, A. A., & Sohn, Y. J. 2018, MNRAS, 475, 4279
- Clarke & Pringle (2006) Clarke, C. J. & Pringle, J. E. 2006, MNRAS, 370, L10
- De Marchi et al. (2013) De Marchi, G., Beccari, G., & Panagia, N. 2013, ApJ, 775, 68
- De Marchi et al. (2023) De Marchi, G., Giardino, G., Panagia, N., et al. 2023, in American Astronomical Society Meeting Abstracts, Vol. 55, American Astronomical Society Meeting Abstracts, 444.07
- De Marchi et al. (2017) De Marchi, G., Panagia, N., & Beccari, G. 2017, ApJ, 846, 110
- De Marchi et al. (2014) De Marchi, G., Panagia, N., & Girardi, L. 2014, MNRAS, 438, 513
- De Marchi et al. (2010) De Marchi, G., Panagia, N., & Romaniello, M. 2010, ApJ, 715, 1
- De Marchi et al. (2011a) De Marchi, G., Panagia, N., Romaniello, M., et al. 2011a, ApJ, 740, 11
- De Marchi et al. (2011b) De Marchi, G., Paresce, F., Panagia, N., et al. 2011b, ApJ, 739, 27
- Dressel (2022) Dressel, L. 2022, WFC3 Instrument Handbook for Cycle 30 v. 14, wFC3 Instrument Handbook, Version 14.0, (Baltimore: STScI)
- Fernandez et al. (1995) Fernandez, M., Ortiz, E., Eiroa, C., & Miranda, L. F. 1995, A&A Supplement, 114, 439
- García & Mermilliod (2001) García, B. & Mermilliod, J. C. 2001, A&A, 368, 122
- Geha et al. (1998) Geha, M. C., Holtzman, J. A., Mould, J. R., et al. 1998, AJ, 115, 1045
- Glatt et al. (2010) Glatt, K., Grebel, E. K., & Koch, A. 2010, A&A, 517, A50
- Grocholski et al. (2009) Grocholski, A. J., Parisi, M. C., Geisler, D., et al. 2009, in The Magellanic System: Stars, Gas, and Galaxies, Proceedings of the International Astronomical Union, IAU Symposium, Vol. 256, 287–292
- Gullbring et al. (1998) Gullbring, E., Hartmann, L., Briceño, C., & Calvet, N. 1998, ApJ, 492, 323
- Haisch et al. (2001) Haisch, Karl E., J., Lada, E. A., & Lada, C. J. 2001, ApJ, 553, L153
- Hartmann et al. (1998) Hartmann, L., Calvet, N., Gullbring, E., & D’Alessio, P. 1998, ApJ, 495, 385
- Hartmann et al. (2016) Hartmann, L., Herczeg, G., & Calvet, N. 2016, ARA&A, 54, 135
- Hartmann & Kenyon (1996) Hartmann, L. & Kenyon, S. J. 1996, ARA&A, 34, 207
- Hernández et al. (2007) Hernández, J., Hartmann, L., Megeath, T., et al. 2007, ApJ, 662, 1067
- Hill & Zaritsky (2006) Hill, A. & Zaritsky, D. 2006, AJ, 131, 414
- King (1962) King, I. 1962, AJ, 67, 471
- Lee et al. (2005) Lee, J. K., Rolleston, W. R. J., Dufton, P. L., & Ryans, R. S. I. 2005, A&A, 429, 1025
- Madau & Dickinson (2014) Madau, P. & Dickinson, M. 2014, ARA&A, 52, 415
- Marigo et al. (2017) Marigo, P., Girardi, L., Bressan, A., et al. 2017, ApJ, 835, 77
- Mason et al. (1998) Mason, B. D., Gies, D. R., Hartkopf, W. I., et al. 1998, AJ, 115, 821
- McMillan et al. (2007) McMillan, S. L. W., Vesperini, E., & Portegies Zwart, S. F. 2007, ApJ, 655, L45
- Meylan & Heggie (1997) Meylan, G. & Heggie, D. C. 1997, A&A Rev., 8, 1
- Piatti et al. (2008) Piatti, A. E., Geisler, D., Sarajedini, A., Gallart, C., & Wischnjewsky, M. 2008, MNRAS, 389, 429
- Porter & Rivinius (2003) Porter, J. M. & Rivinius, T. 2003, PASP, 115, 1153
- Preibisch et al. (1999) Preibisch, T., Balega, Y., Hofmann, K.-H., Weigelt, G., & Zinnecker, H. 1999, New Astronomy, 4, 531
- Rolleston et al. (2002) Rolleston, W. R. J., Trundle, C., & Dufton, P. L. 2002, A&A, 396, 53
- Romaniello (1998) Romaniello, M. 1998, PhD thesis, Scuola Normale Superiore, Pisa, Italy
- Russell & Dopita (1992) Russell, S. C. & Dopita, M. A. 1992, ApJ, 384, 508
- Ryon (2022) Ryon, J. E. 2022, ACS Instrument Handbook, aCS Instrument Handbook, Version 21.0 (Baltimore: STScI)
- Sabbi et al. (2011) Sabbi, E., Nota, A., Tosi, M., et al. 2011, ApJ, 739, 15
- Schmalzl et al. (2008) Schmalzl, M., Gouliermis, D. A., Dolphin, A. E., & Henning, T. 2008, ApJ, 681, 290
- Sicilia-Aguilar et al. (2010) Sicilia-Aguilar, A., Henning, T., & Hartmann, L. W. 2010, ApJ, 710, 597
- Smith et al. (1999) Smith, K. W., Lewis, G. F., Bonnell, I. A., Bunclark, P. S., & Emerson, J. P. 1999, MNRAS, 304, 367
- Tody (1986) Tody, D. 1986, in Society of Photo-Optical Instrumentation Engineers (SPIE) Conference Series, Vol. 627, Instrumentation in astronomy VI, ed. D. L. Crawford, 733
- Tognelli et al. (2011) Tognelli, E., Prada Moroni, P. G., & Degl’Innocenti, S. 2011, A&A, 533, A109
- Tsilia et al. (2023) Tsilia, S., De Marchi, G., & Panagia, N. 2023, Photometric determination of the mass accretion rates of pre-main sequence stars. VII. The low-density cluster NGC 376 in the Small Magellanic Cloud
- Utomo et al. (2019) Utomo, D., Chiang, I.-D., Leroy, A. K., Sandstrom, K. M., & Chastenet, J. 2019, ApJ, 874, 141
- White & Basri (2003) White, R. J. & Basri, G. 2003, ApJ, 582, 1109
- Wilson et al. (2019) Wilson, P. A., Kerr, R., Lecavelier des Etangs, A., et al. 2019, A&A, 621, A121
- Yanchulova Merica-Jones et al. (2017) Yanchulova Merica-Jones, P., Sandstrom, K. M., Johnson, L. C., et al. 2017, ApJ, 847, 102