11email: akke.corporaal@kuleuven.be 22institutetext: School of Mathematical and Physical Sciences, Macquarie University, Sydney, NSW, Australia 33institutetext: Astronomy, Astrophysics and Astrophotonics Research Centre, Macquarie University, Sydney, NSW, Australia 44institutetext: Univ. Grenoble Alpes, CNRS, IPAG, 38000 Grenoble, France 55institutetext: INAF, Observatory of Rome, Via Frascati 33, 00077 Monte Porzio Catone (RM), Italy 66institutetext: European Southern Observatory, Karl-Schwarzschild-Str. 2, 85748 Garching, Germany
Transition disc nature of post-AGB binary systems confirmed by mid-infrared interferometry††thanks: Based on observations collected at the European Southern Observatory under ESO programmes 075.D-0605, 60.A-9275, 0104.D-0739, 105.20QN, 106.21NK, 109.23KF, and 110.24AC
Abstract
Context. Many properties of circumbinary discs around evolved post-asymptotic giant branch (post-AGB) binary systems are similar to those of protoplanetary discs around young stars. The deficits of near-infrared (near-IR) flux in the spectral energy distributions (SEDs) of these systems hints towards large dust-free cavities that are reminiscent of transition discs as are commonly observed around young stars.
Aims. We aim to assess the size of the inner rim of six post-AGB binary systems with lack in the near-IR like this. We used resolved mid-infrared (mid-IR) high-angular resolution observations of VLTI/MATISSE and VLTI/MIDI. The inner rim of only one such system was previously resolved. We compared these inner rim sizes to five systems with available MATISSE data that were identified to host a disc starting at the dust sublimation radius.
Methods. We used geometric ring models to estimate the inner rim sizes, the relative flux contributions of the star, the ring, and an over-resolved emission, the orientation of the ring, and the spectral dependences of the components.
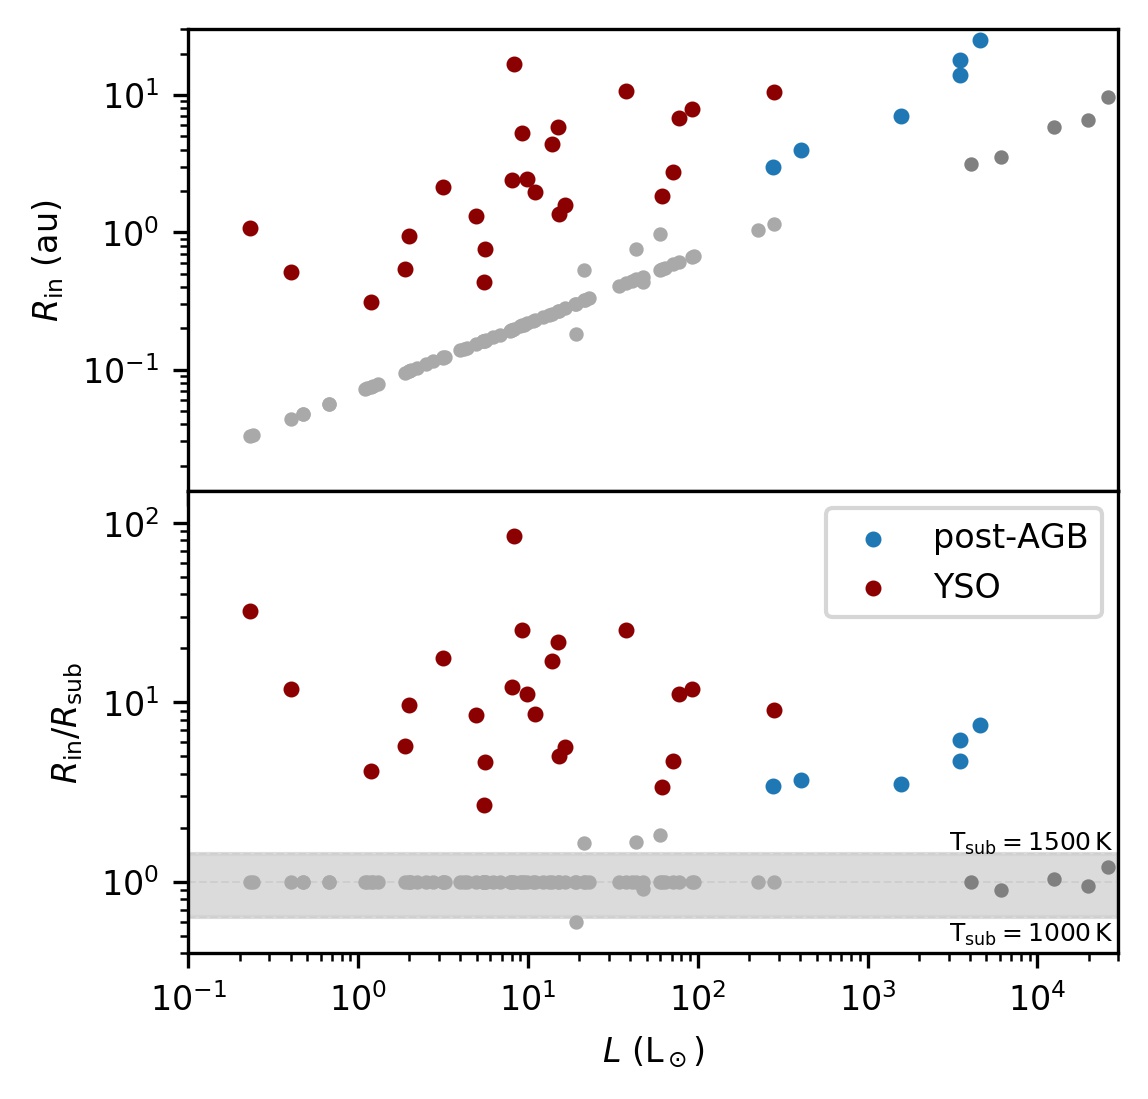
Results. We find that the inner dust rims of the targets with a lack of near-IR excess in their SEDs are to 7.5 times larger than the theoretical dust sublimation radii, and inner rim sizes of the systems that do not show this deficit are similar to those of their theoretical dust sublimation radii. The physical radii of the inner rims of these transition discs around post-AGB binaries are 3-25 au, which are larger than the disc sizes inferred for transition discs around young stars with VLTI/MIDI. This is due to the higher stellar luminosities of post-AGB systems compared to young stars, implying larger dust sublimation radii and thus larger physical inner radii of the transition disc.
Conclusions. With mid-IR interferometric data, we directly confirm the transition disc nature of six circumbinary discs around post-AGB binary systems. Future observational and modelling efforts are needed to progress in our understanding of the structure, origin, and evolution of these transition discs.
Key Words.:
Stars: AGB and post-AGB - techniques: interferometric - binaries: general - protoplanetary disks - circumstellar matter1 Introduction
Numerous circumstellar discs with dust-free cavities have been detected and characterised around young stellar objects (YSOs). The properties of these transition discs around YSOs have recently been reviewed by van der Marel (2023). Transition discs are generally defined as circumstellar discs with a cavity in their inner dust distribution. In these discs, dust is trapped at the edge of the cavity, which hinders the inward drift of dust grains. Transition discs either have inner regions that are completely devoid of dust, or they have a small dust ring closer to the star, followed by a large cavity in the dust (e.g. TW Hya; Ratzka et al. 2007; Menu et al. 2014).
The presence of transition discs was first discovered based on a deficit of flux at near-infrared (near-IR) wavelengths in the spectral energy distributions (SEDs) (e.g. Calvet et al. 2002), and it was later confirmed by numerous millimetre interferometric observations with the Plateau de Bure Interferometer, the SubMillimeter Array, and the Atacama Large Millimeter/submillimeter Array (ALMA) (e.g. Piétu et al. 2006; Brown et al. 2009; Andrews et al. 2011; Pinilla et al. 2015).
This lack of near-IR excess in the photometry has also been detected in circumstellar discs in a class of evolved binaries, namely in post-asymptotic giant branch (post-AGB) binaries. It indicates a large dust-free cavity similar to that of protoplanetary discs (PPDs; Kluska et al. 2022). Kluska et al. (2022) provided a catalogue of the SEDs of Galactic post-AGB binary systems and classified the systems into five categories based on the IR excesses. Systems with an excess starting in the near-IR are full discs with dust close to the dust sublimation radius, and they are classified as category 0 or 1 targets. Systems of category 2, 3, and 4 lack this near-IR excess. Category 2 systems show a strong mid-IR excess and are reminiscent of transition discs around YSOs. Category 3 systems show a milder mid-IR excess, and these systems are likely a mix between a full disc and transition discs. In category 4 systems, finally, the IR excess starts later than the mid-IR. The properties of the circumbinary discs around post-AGB binaries are reviewed by Van Winckel (2018). These discs show Keplerian dynamics (Bujarrabal et al. 2013a, b, 2015, 2017, 2018; Gallardo Cava et al. 2021, 2023) and a high degree of dust-grain processing (Gielen et al. 2011), indicating a stable nature.
Kluska et al. (2022) reported a relation between the IR excess colour, and thus the disc morphology, and a chemical phenomenon called depletion. Depletion is a photospheric chemical anomaly with an underabundance of refractory elements (e.g. Fe or Ti) observed in the photosphere of the post-AGB primary (e.g. Van Winckel et al. 1995; Giridhar et al. 2005; Oomen et al. 2018; Kamath & Van Winckel 2019). It can be explained by a re-accretion of metal-poor gas from the circumbinary disc (e.g. Oomen et al. 2019). The needed condition is that the dust grains are trapped within the disc, while the gas, devoid of refractory elements, can be accreted. The efficiency of this gas-dust separation is linked to the disc structure.
The relation is such that depletion is stronger for objects with a lack of near-IR excess, and Kluska et al. (2022) proposed that the depletion process is linked to the process creating the cavity. These authors suggested that this gas-dust separation might arise because a giant planet traps the dust in the outer disc and in that way carves a cavity, following Kama et al. (2015), or it might arise by dynamical truncation of the binary (Artymowicz & Lubow 1994; Miranda & Lai 2015; Hirsh et al. 2020) .
To progress on this hypothesis, we need to spatially resolve the inner rim regions, which are accessible with IR interferometric observations. These observations of systems that are surrounded by a full disc show that dust is located close to the dust sublimation radius and extends outwards (Hillen et al. 2016, 2017; Kluska et al. 2019; Corporaal et al. 2021). In contrast, mid-IR interferometric observations with the MID-infrared Interferometric instrument (MIDI), a decommissioned two-beam combiner on the Very Large Telescope Interferometer (VLTI), of AC Her (a category 2 system) have resolved the inner dust cavity, which is about seven times larger than its theoretical dust sublimation radius (Hillen et al. 2015). AC Her is the only post-AGB binary system for with a large dust-free cavity was resolved so far. Near-IR observations of AC Her with the long-baseline interferometric array at the Center for High Angular Resolution reveal the three-dimensional orbit of the inner binary and show that the inner cavity cannot be explained by the dynamical truncation of the binary (Anugu et al. 2023).
Here we present mid-IR interferometric observations with the four-beam combiner Multi-AperTure mid-Infrared SpectroScopic Experiment (MATISSE) installed on the VLTI of ten Galactic post-AGB binary systems together with the reanalysis of the archival MIDI data of AC Her. We aim to constrain the sizes of the cavities of the transition disc candidates and compare them to full-disc systems using geometric models. We present our sample selection and observations in Sect. 2, describe our geometric modelling of these data in Sect. 3, and analyse the results in Sect. 4. We discuss the inferred cavity sizes in Sect. 5 and summarise our conclusions in Sect. 6.
2 Observations
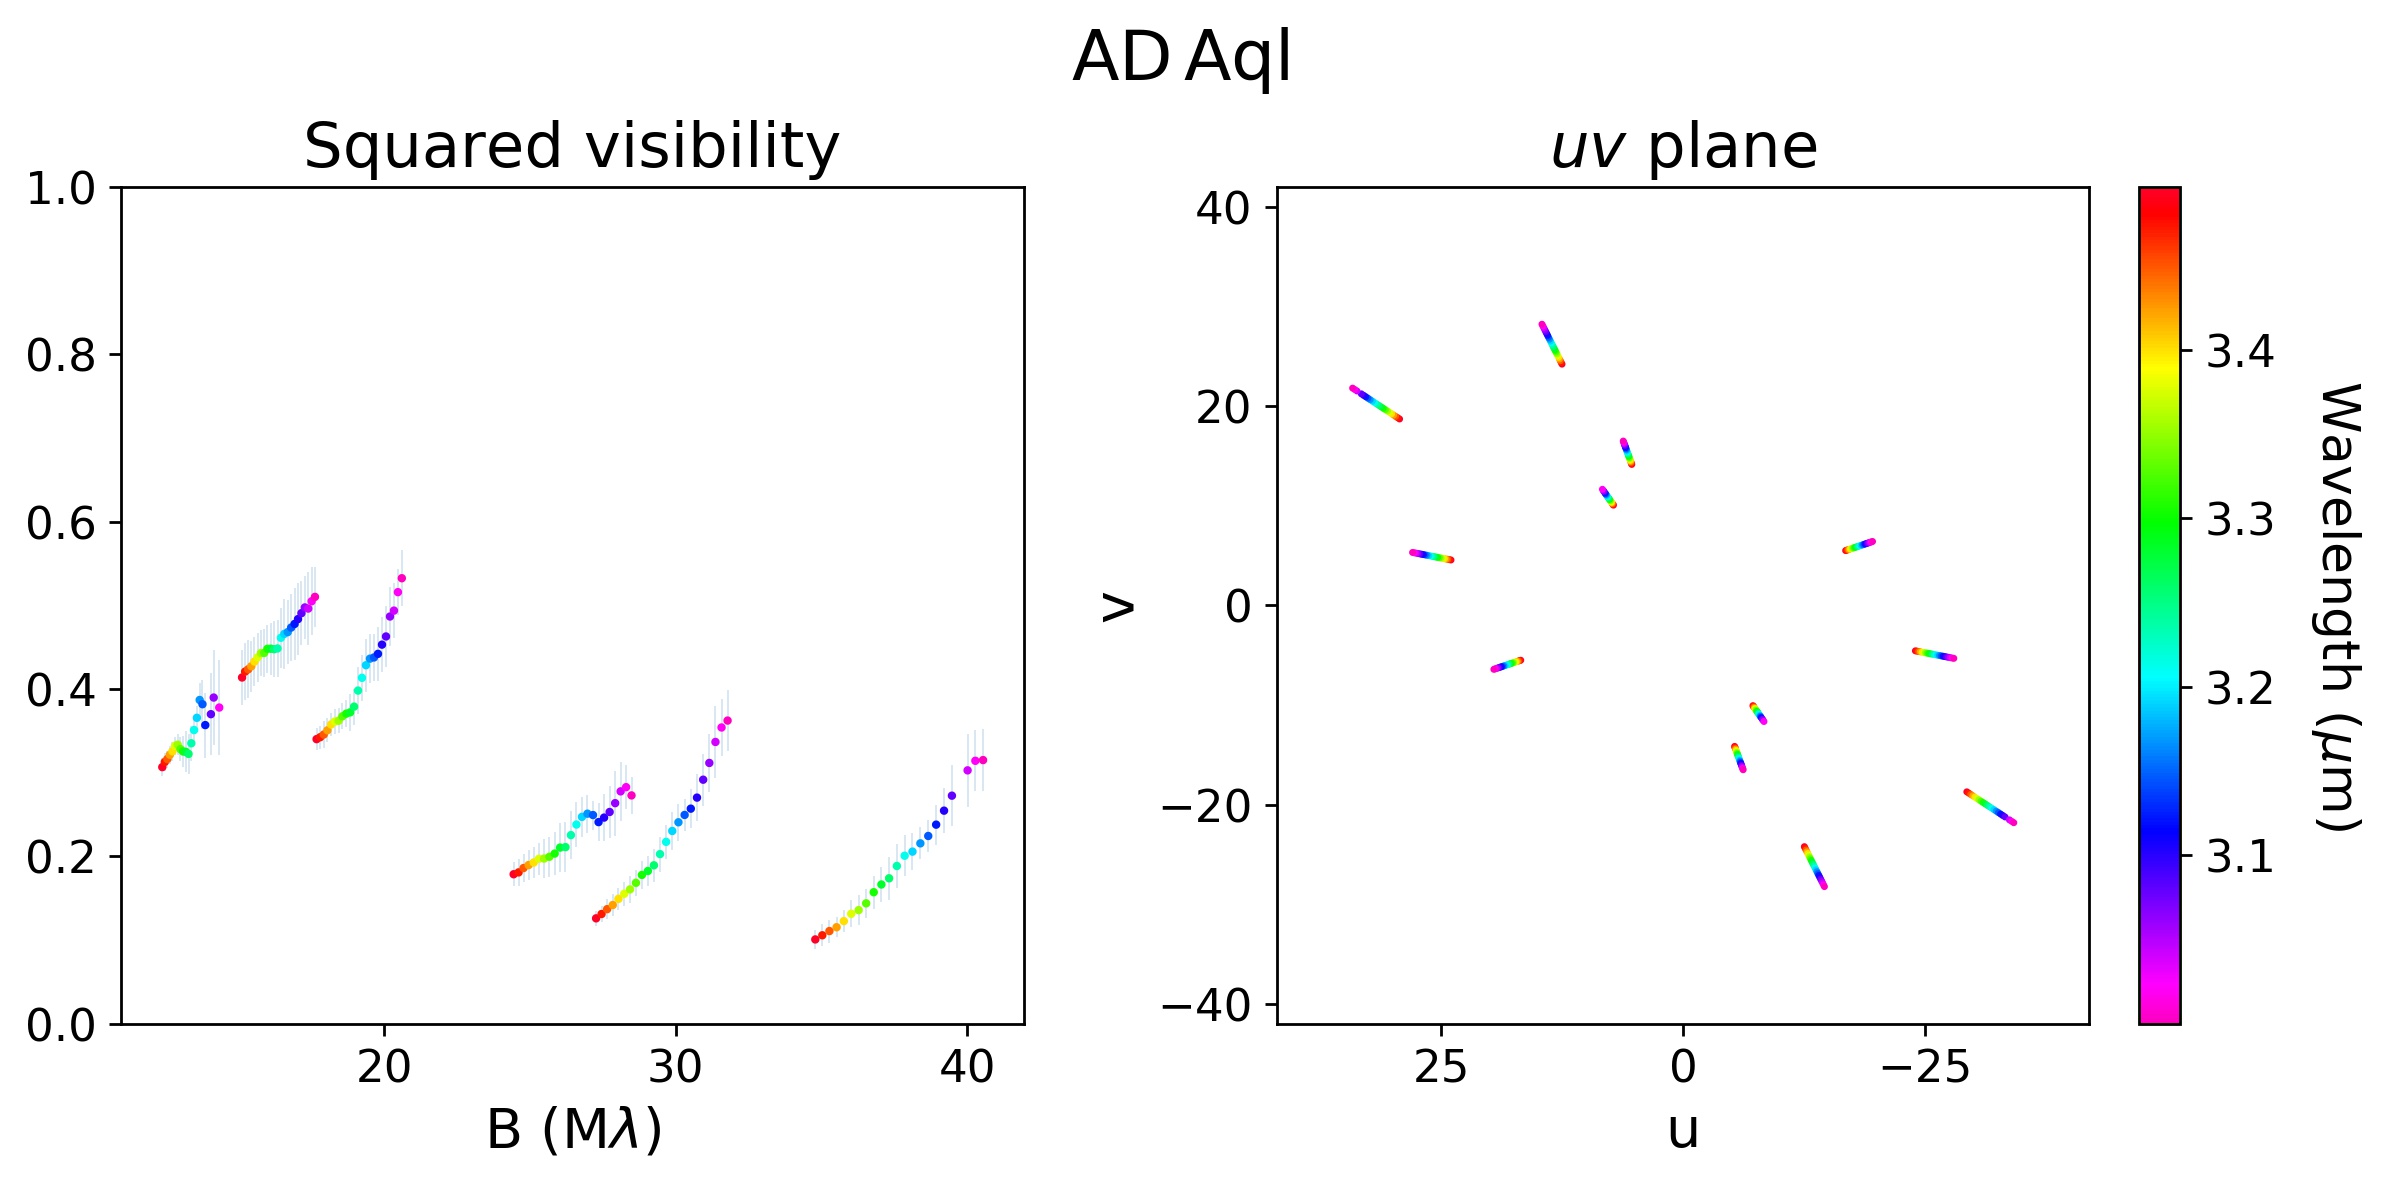
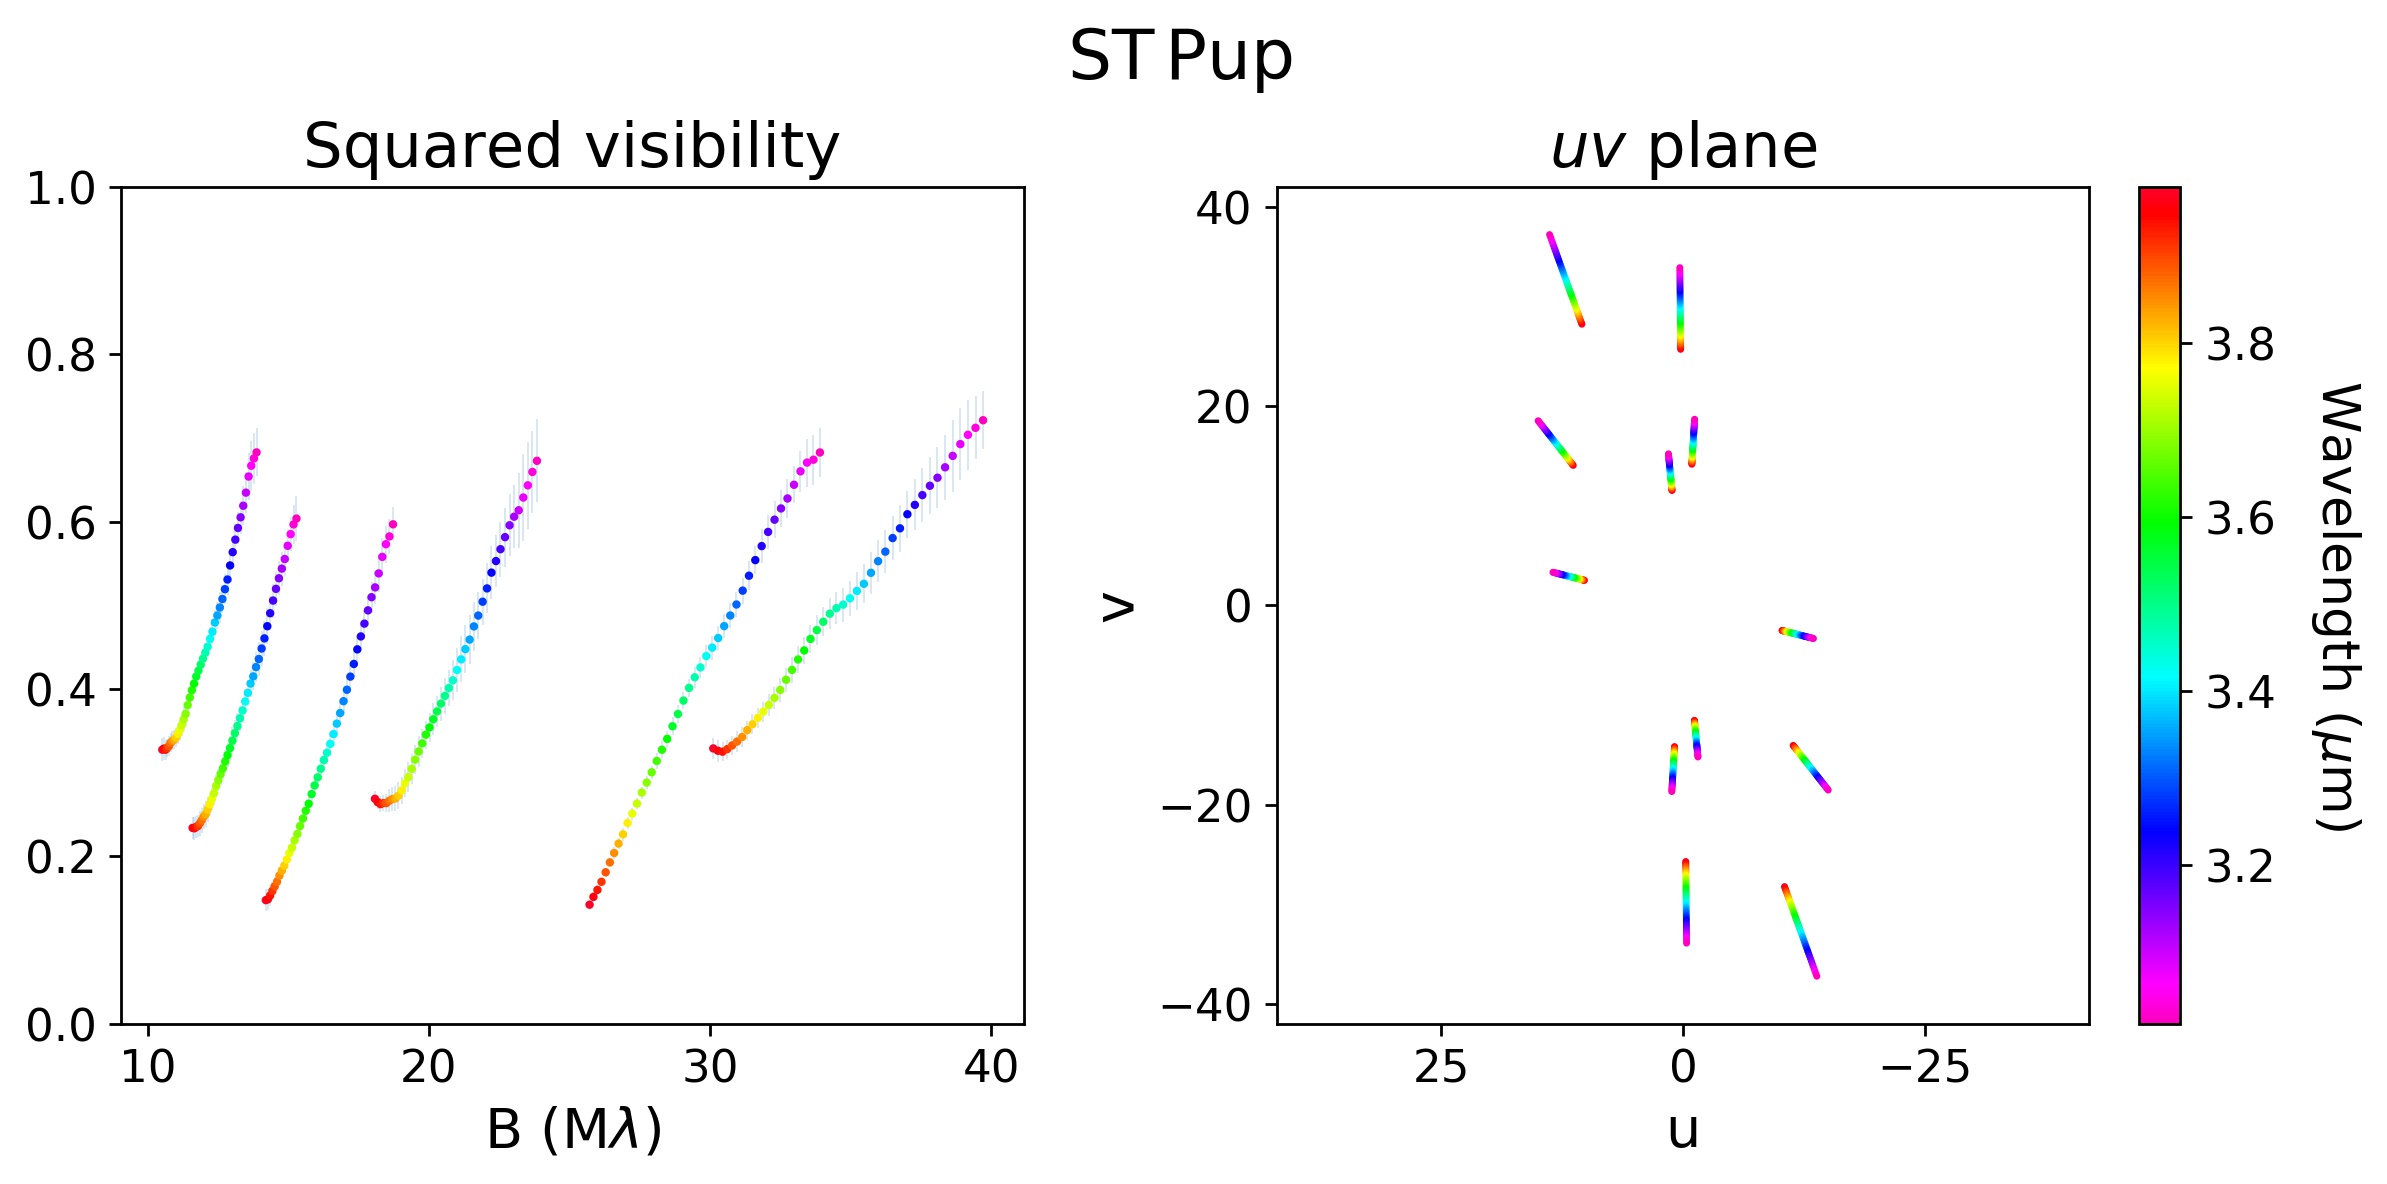
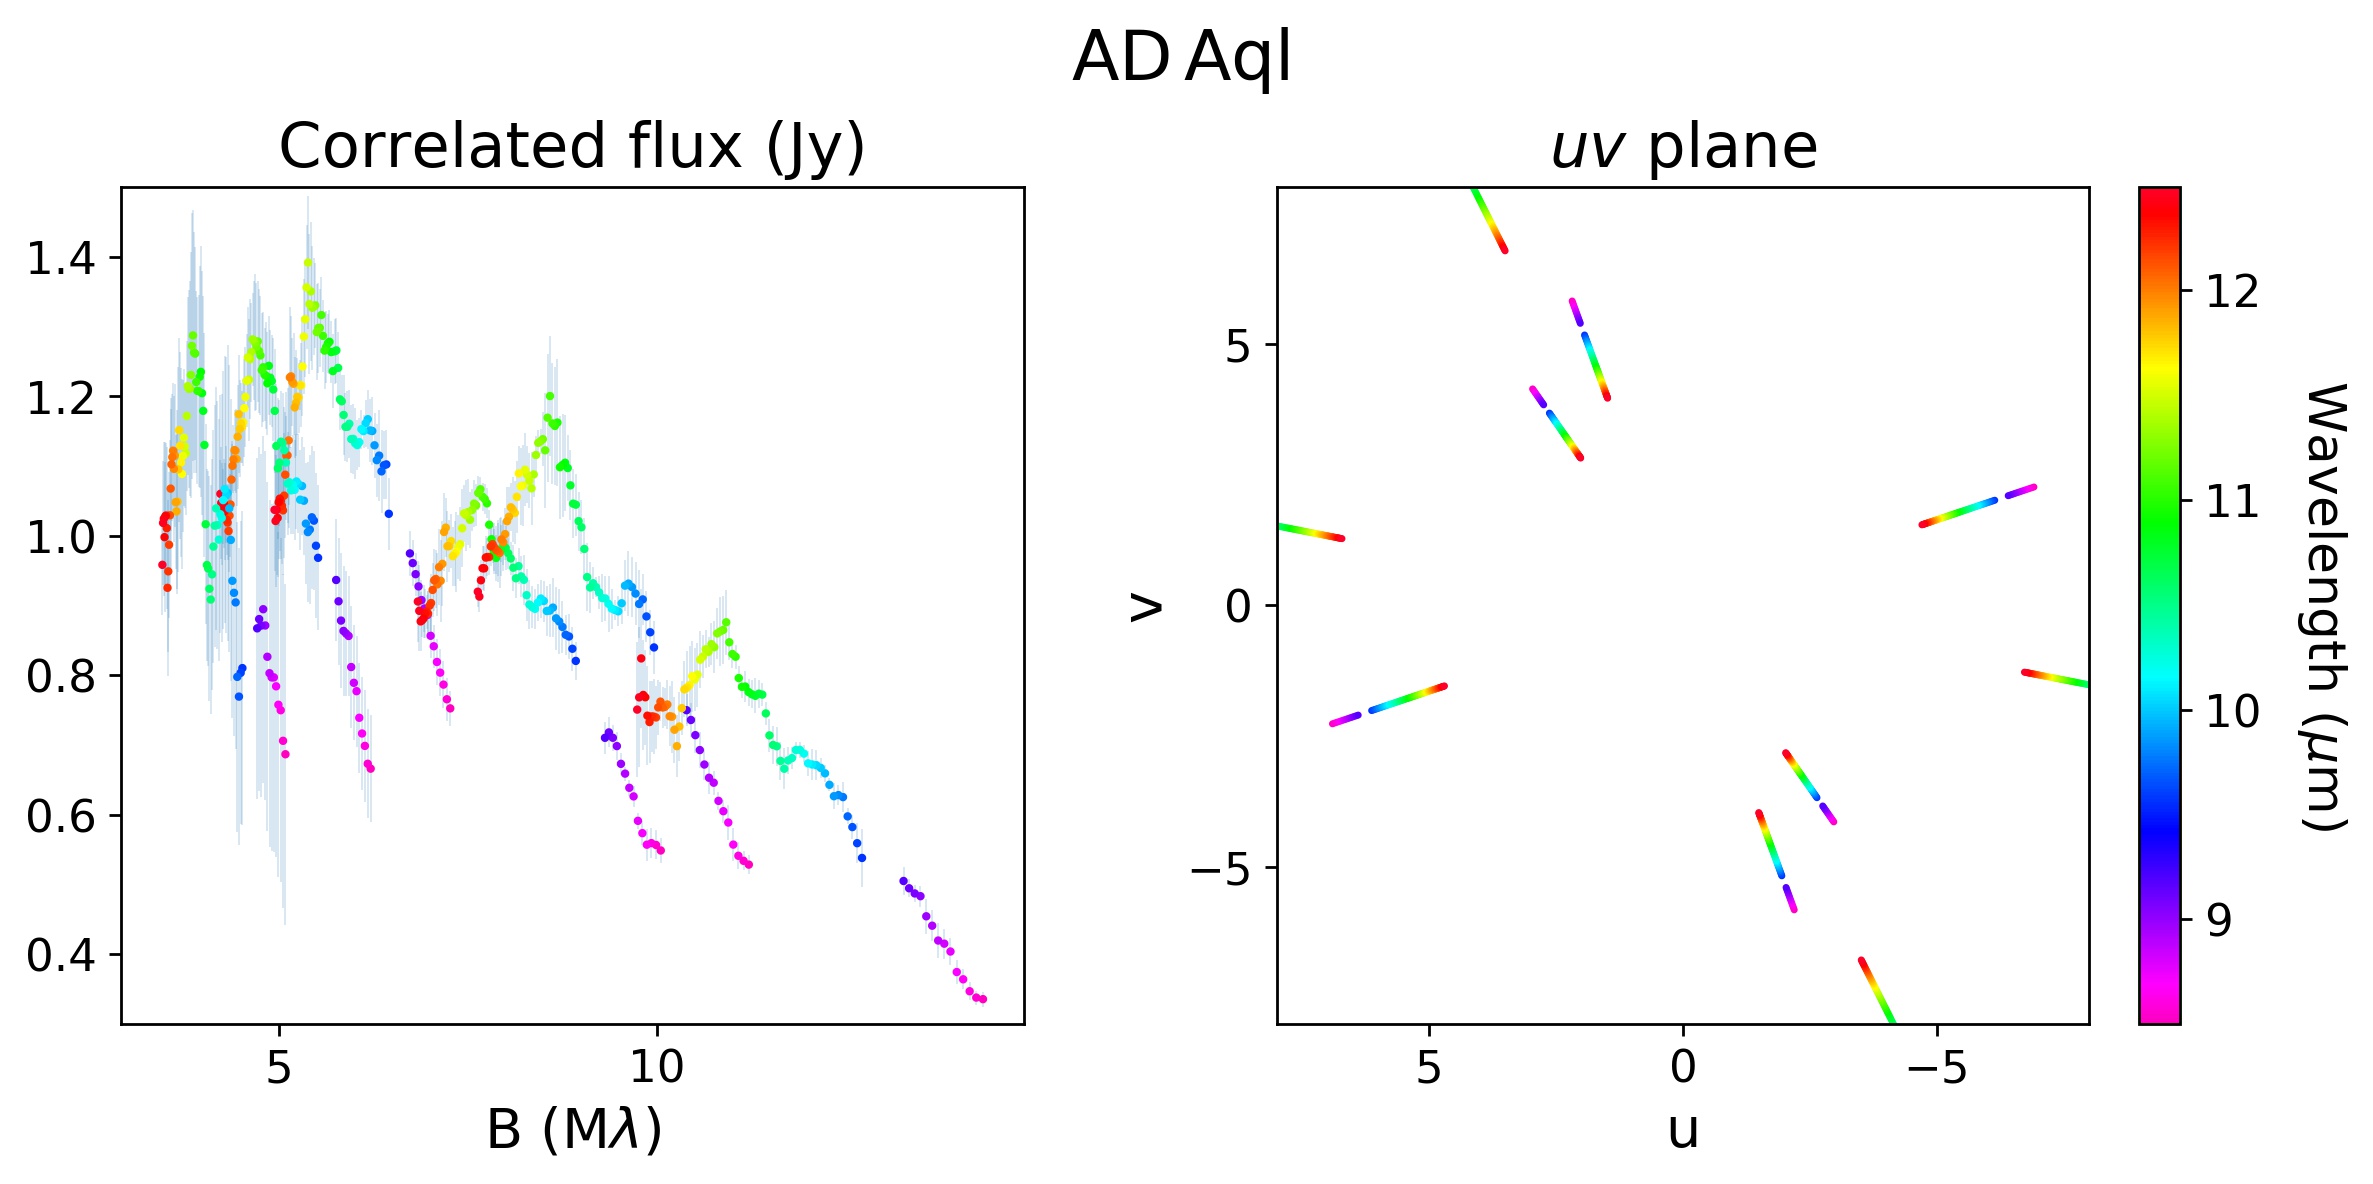
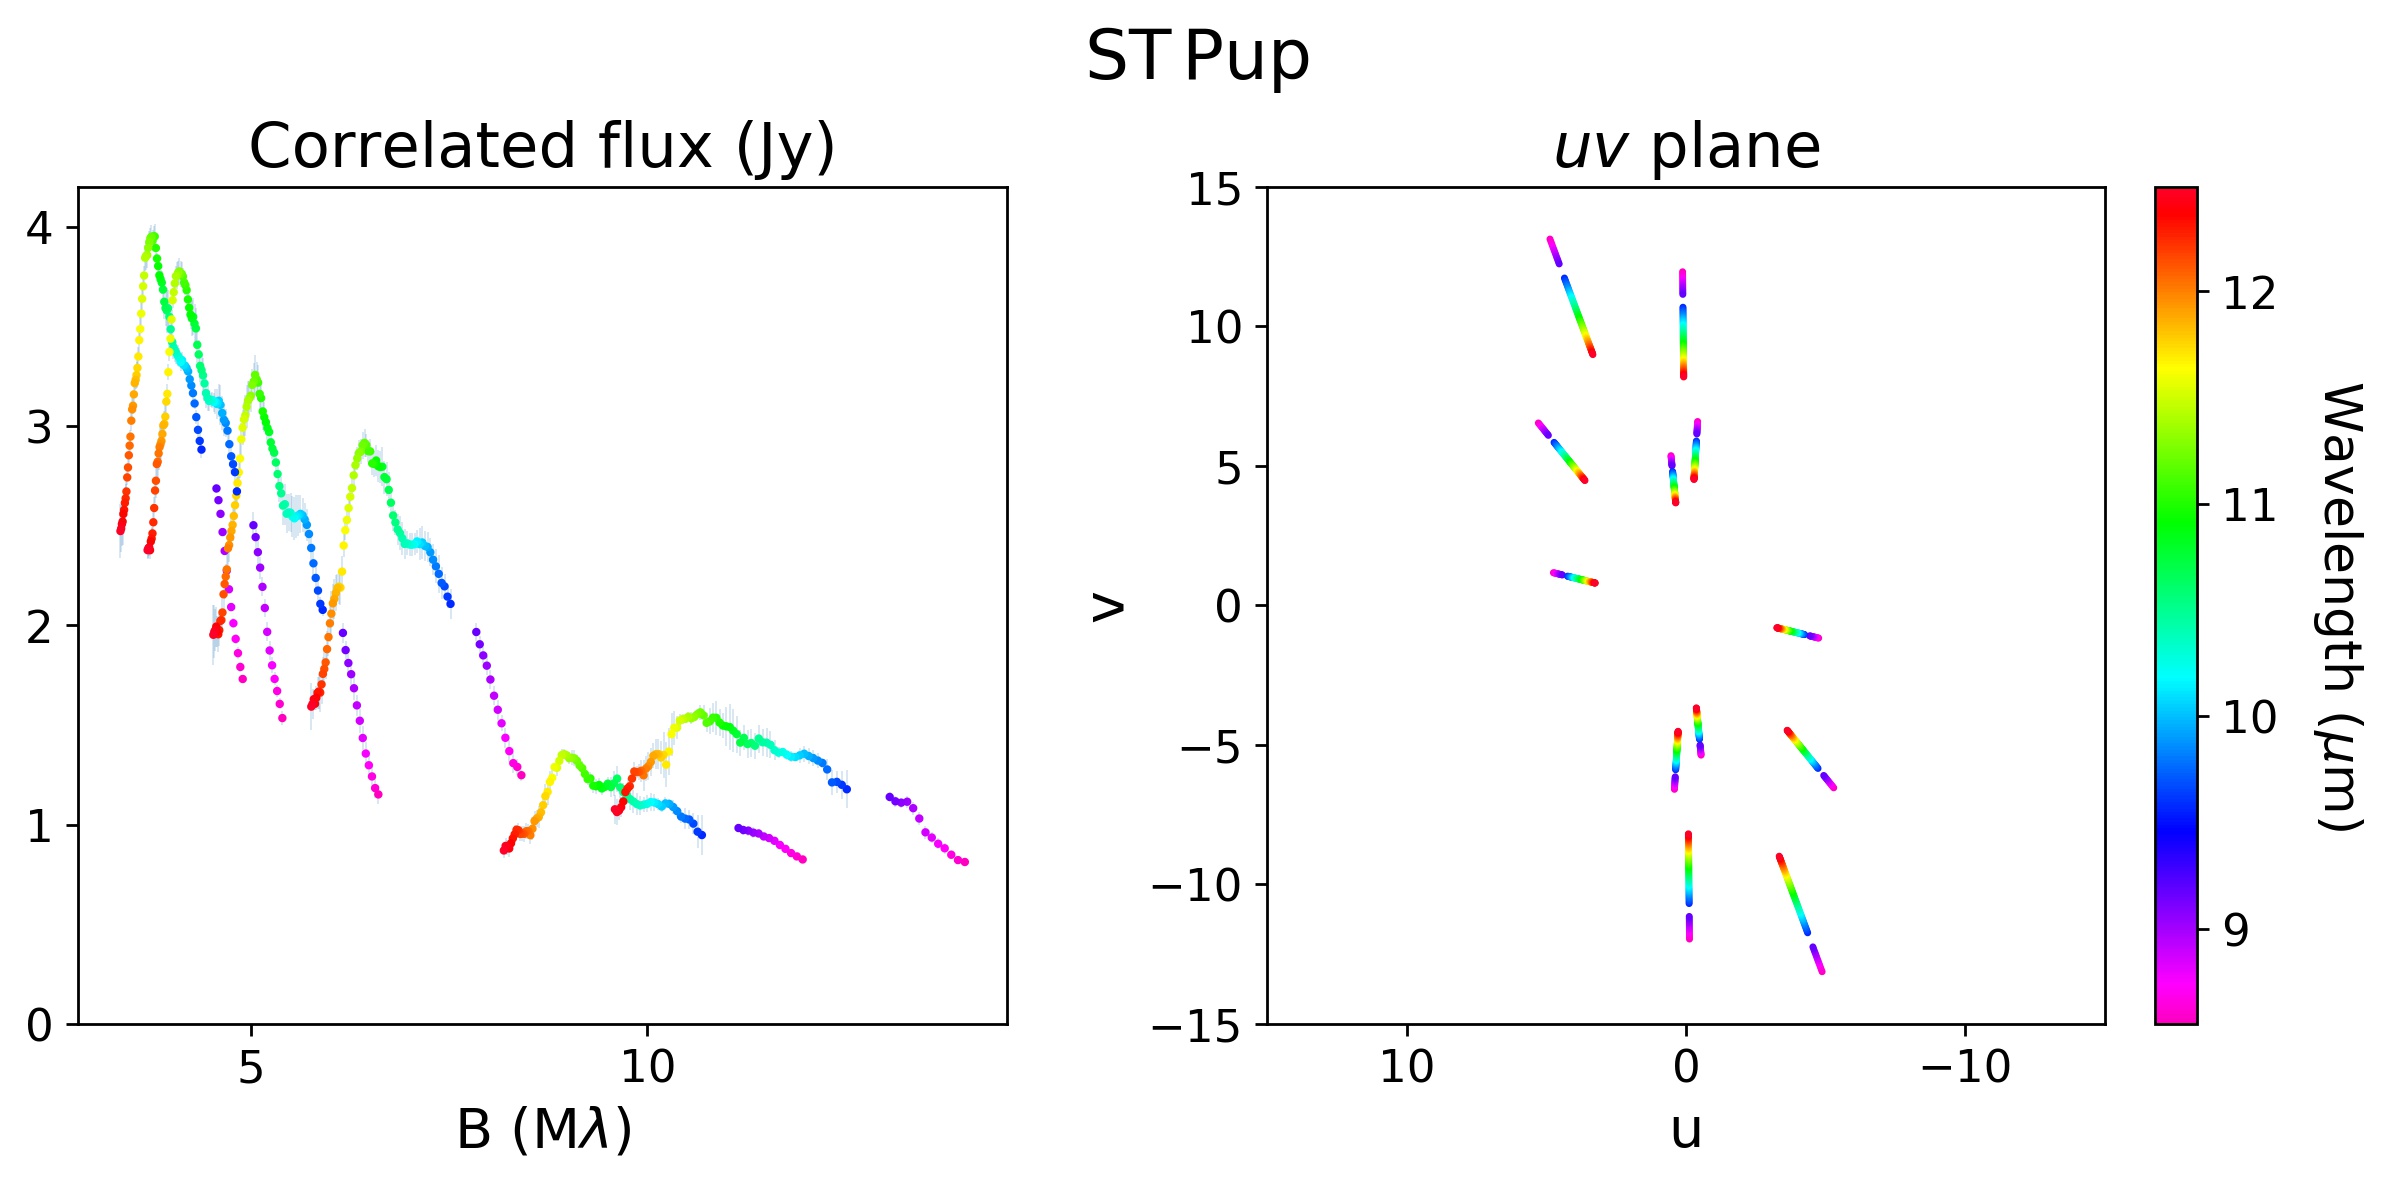
The SEDs were taken from the catalogue of Galactic post-AGB binary systems of Kluska et al. (2022). We used mid-IR interferometric observations of post-AGB binaries obtained with VLTI/MATISSE (Lopez et al. 2022). MATISSE operates in the (2.9-4.2 m), (4.2-5.0 m), and (8-13 m) bands. MATISSE combines the light of either the four Unit Telescopes (UTs) or the four Auxiliary Telescopes (ATs) and provides six simultaneous baselines and three independent closure phases (CPs) per measurement. The interferometric observables are the visibilities and the CPs. The visibility is measured as a squared visibility amplitude () in the band and the visibility amplitude () or the correlated flux (CF) in the band.
Our data set contains five systems of category 1 (HD 101584, HD 109014, IW Car, IRAS 08544-4431 (hereafter IRAS 08544), and IRAS 15469-5311 (hereafter IRAS 15469)) with an IR excess starting at near-IR wavelengths, and six systems (CT Ori, EP Lyr, AC Her, AD Aql, RU Cen, and ST Pup) with an excess starting at mid-IR wavelengths (categories 2 and 3). The target selection for the transition disc candidates was based on (1) the lack of near-IR excess, (2) the characteristics in depletion tracers ([Fe/H] , [Zn/Ti] , and K; see also Table 4 and Kluska et al. (2022)), and (3) the observability of the systems with MATISSE. The transition disc sample was complemented with data of AC Her taken with the VLTI/MIDI, which operated in the band as it is the only system for which a dust-free cavity was detected so far. For a log of these observations of AC Her, we refer to Hillen et al. (2015). The data of the transition disc candidates were compared to full-disc systems in the MATISSE wavelength range.
All MATISSE observations were taken in hybrid mode with a low spectral resolution () between 2019 and 2023. For a log of the observations of IRAS 08544, we refer to Corporaal et al. (2021). Data of IRAS 15469 were taken with the ATs in the small configuration (program ID 105.20QN, PI: Kluska). Observations of IW Car were carried out using the ATs on the small and medium configurations (program ID 106.21NK, PI: Kluska). Data of HD 101584, HD 108015, EP Lyr, AD Aql, RU Cen, CT Ori, and ST Pup were taken using the UTs with the GRA4MAT mode using GRAVITY as a fringe tracker to stabilise the fringes of these faint targets (program IDs 109.23KF and 110.24AC, PI: Corporaal). The log of these observations is reported in Table 3.
The data were reduced and calibrated with the MATISSE data reduction pipeline version 1.7.5. We used all data for which no observational or calibration problems occurred (see Appendix A). The -band data taken with the UTs were reduced in CF mode, meaning that photometry was not taken during the observations, and therefore, the coherent flux measurements could not be normalised. These visibilities are therefore reported in CF.
3 Geometric modelling
To constrain the inner rim radii, we modelled the IR interferometric visibilities using the code called parametric modeling of optical interferometric data (PMOIRED111https://github.com/amerand/PMOIRED; Mérand 2022). PMOIRED is a geometric modelling tool for IR interferometry that relies on semi-analytical expressions of complex visibilities. PMOIRED allows modelling systems by linearly adding the expressions of the considered components.
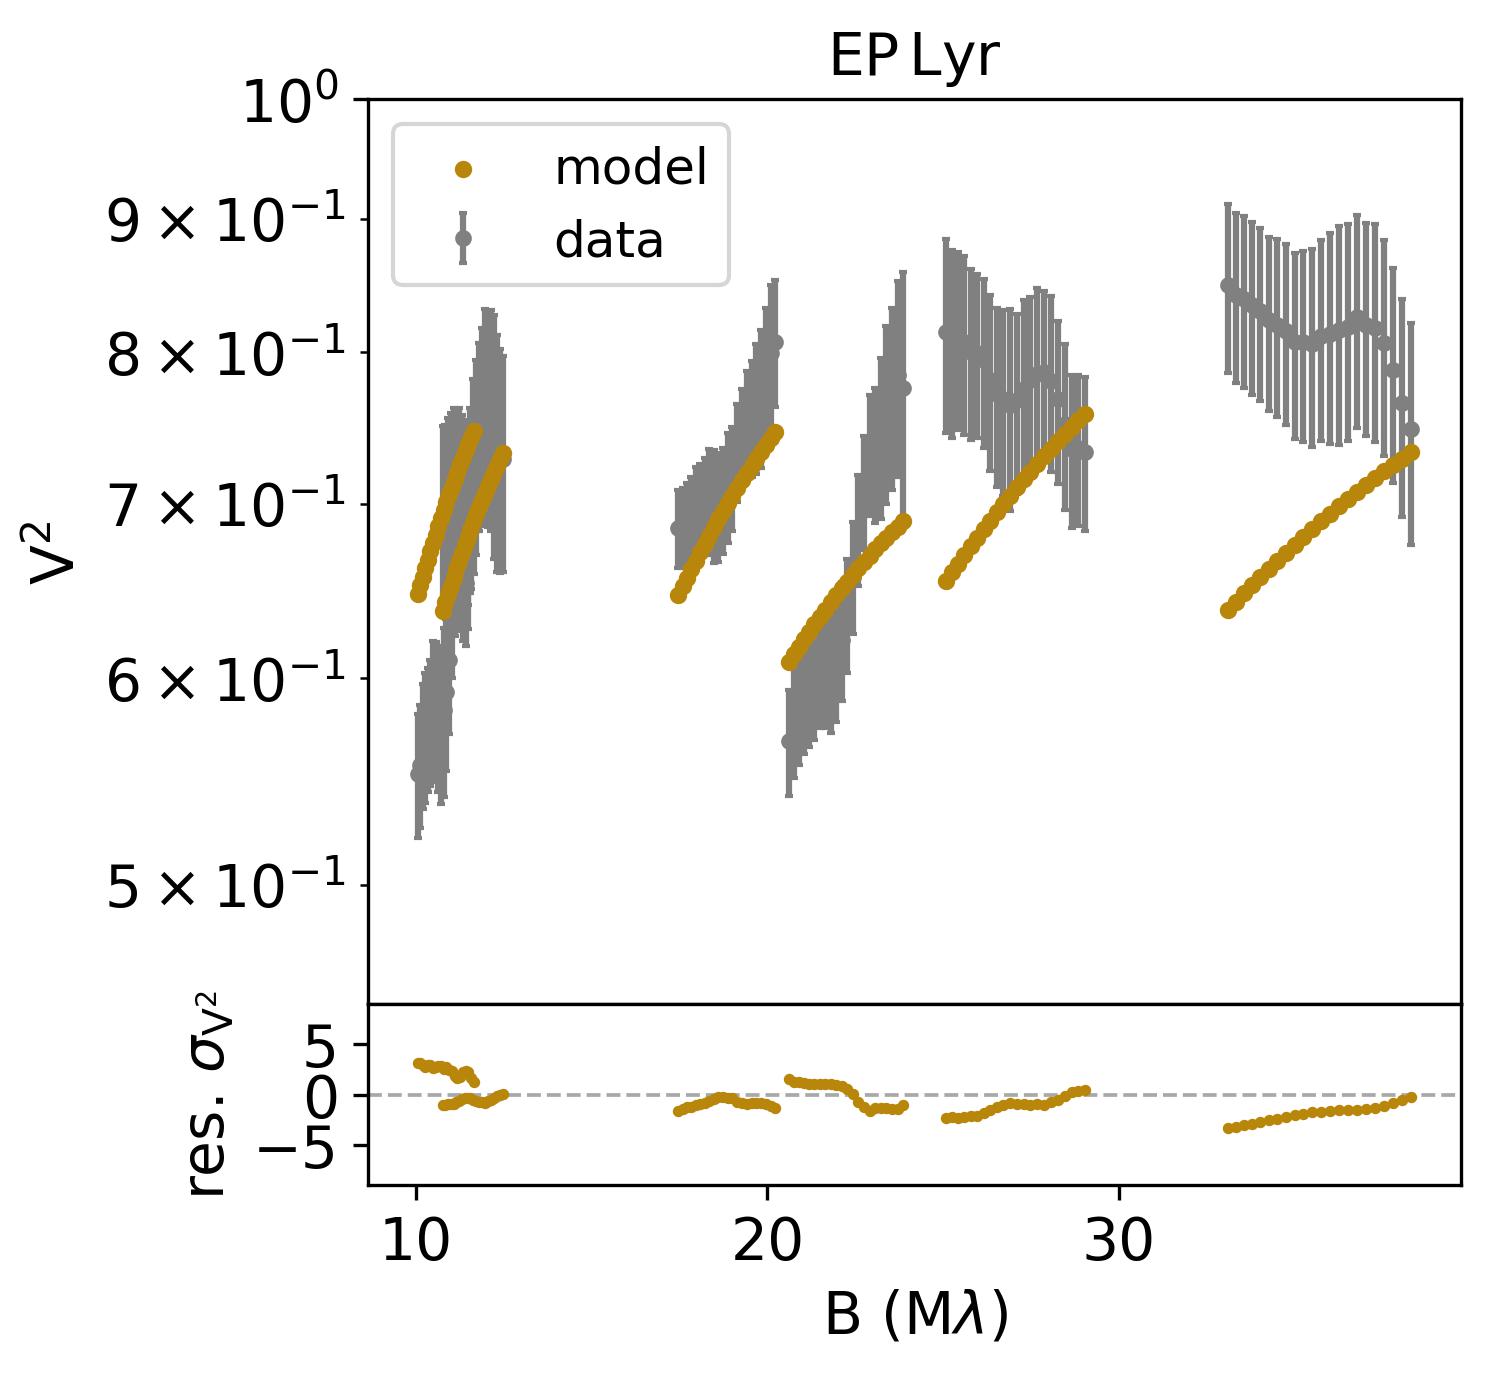
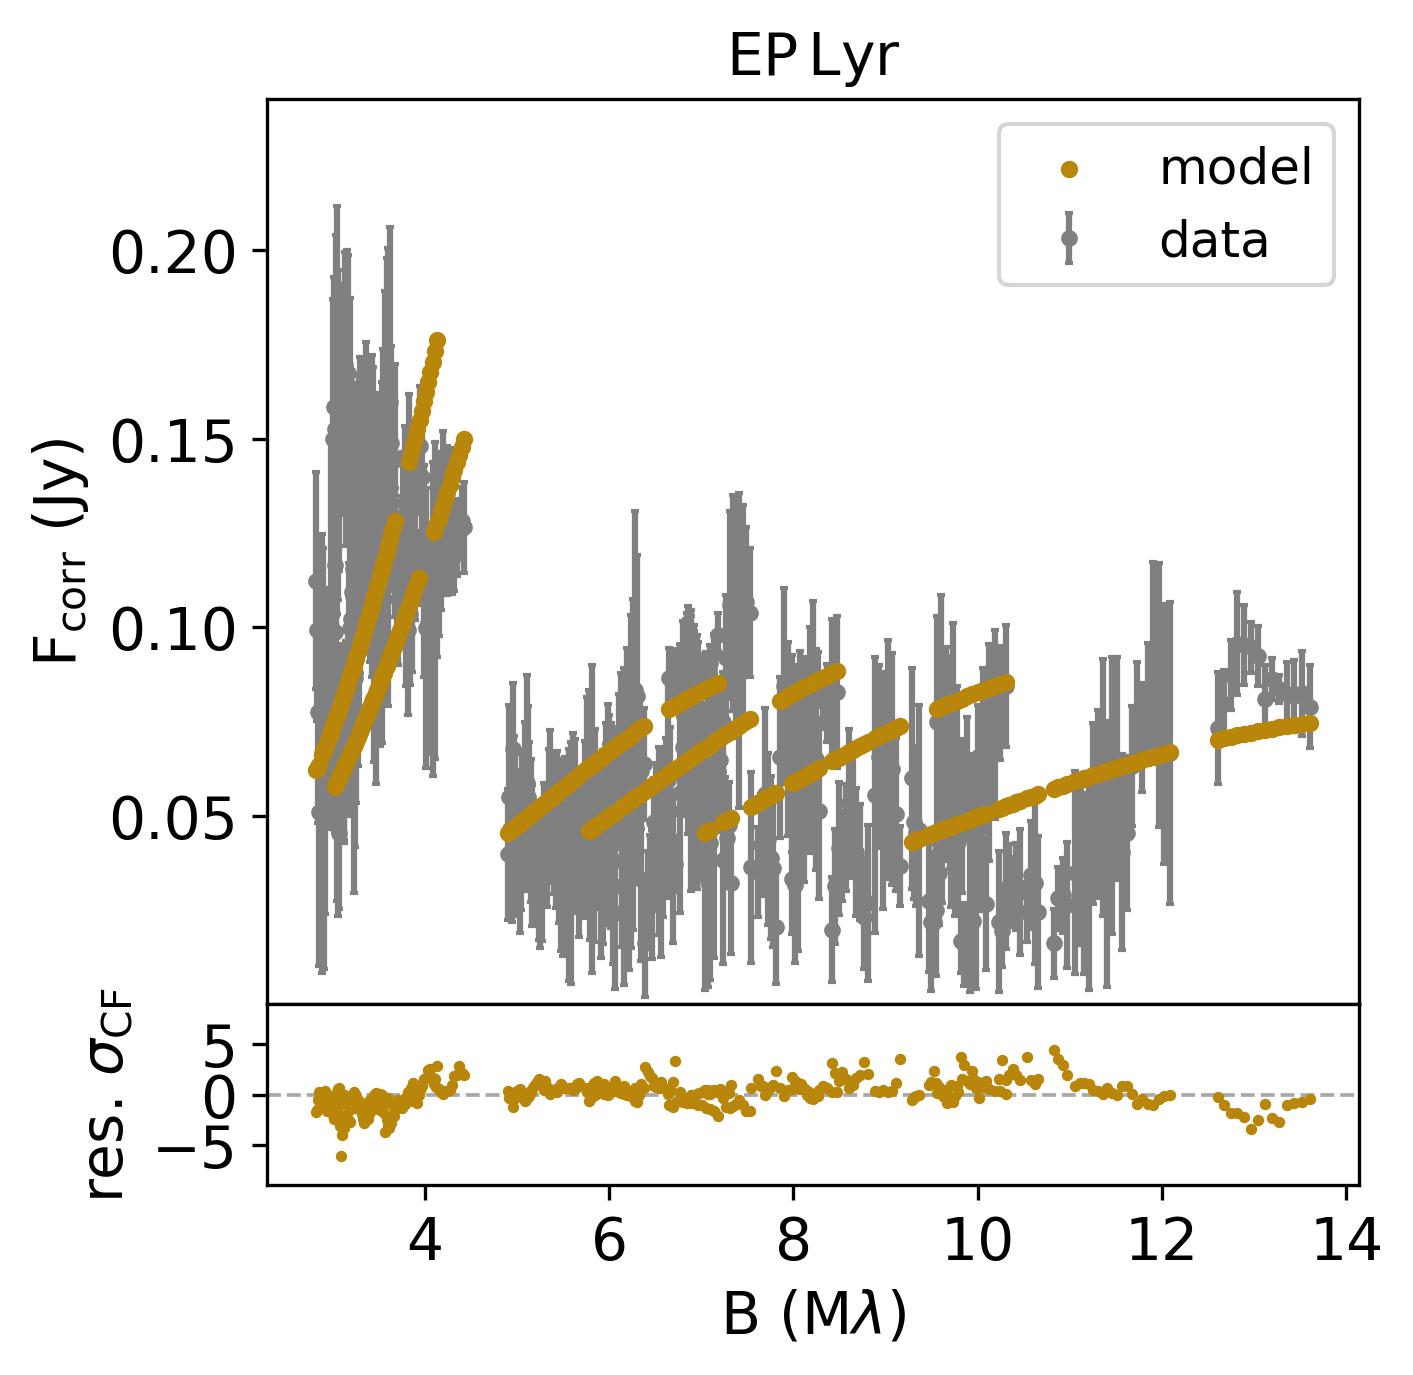
The systems were considered to consist of either a single star, an inclined ring, and an over-resolved emission or a binary and an over-resolved emission. The choice between models was based on the SEDs of the targets. In all but one target, the IR excess starts at wavelengths between 1 m and 4 m, indicating that the circumbinary disc emits in the and bands and that we thus probe the disc in both bands. In EP Lyr the IR excess starts later than m, but before m, such that the system is dominated by stellar emission in but the disc emits in .
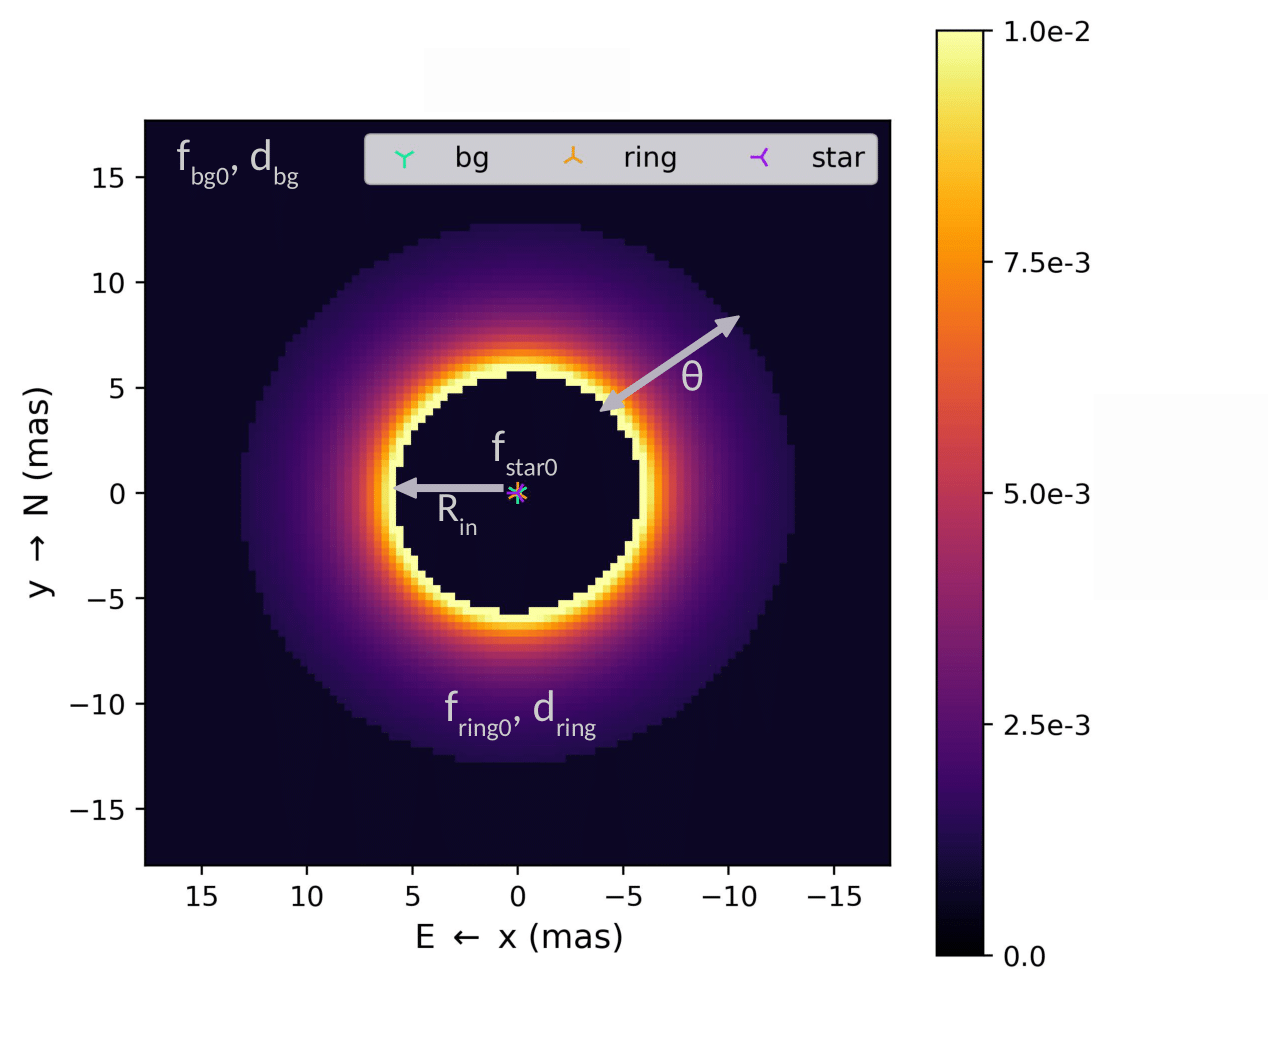
Fig. 1 illustrates the presumed structure of the ring models. In our modelling, we aimed to constrain the inner rim sizes and therefore did not consider a dust distribution with a small dust ring closer to the star followed by a cavity. In all disc models, we neglected the illumination of the companion, although we expect all systems to be binaries (e.g. Van Winckel 2018). The central star was considered in all cases where its relative flux contribution as deduced from the SED was . The flux contributions of the components, , were defined at the central wavelength, , of each band such that . The central star was modelled as a point source with a spectrum approximated by a Rayleigh–Jeans tail proportional to in the and bands ( K). The over-resolved emission was modelled as a wavelength-dependent fully resolved component to account for all large-scale scattered light emission with a spectrum following
| (1) |
where is the spectral index of this over-resolved emission. Visibility data displayed in CF are not sensitive to the over-resolved emission. Instead of and , the total flux at zeroth baseline, , was fitted for these data. The orientation of the circumbinary ring is given by its inclination, , and position angle, , measured north to east. The ring was assumed to be continuous with a radial profile and to have a wavelength-dependent spectrum following Eq. 1. The angular emission of the ring was parametrised by the inner rim radius, , and the ring width, . This resulted in up to nine free parameters.
| Ring models | ||||||||||
| Object | PA | |||||||||
| (mas) | (mas) | (deg) | (deg) | (%) | (%) | |||||
| HD 101584 | 0.7 | 1.90.1 | 6.50.6 | 2317 | 1821 | -3.00.3 | 119 | 2 | 34.110.0 | 24.96.8 |
| HD 108015∗ | 9.0 | 1.70.3 | 8.11.7 | 3511 | 4513 | -1.4 | 51 | 10 | -15.43.7 | 4.23.8 |
| IRAS 08544 | 23 | 5.80.1 | 7.90.9 | 165 | 11625 | -1.6 | 371 | 6 | 2.81.4 | -0.80.8 |
| IRAS 15469 | 1.0 | 1.70.2 | 14.82.3 | 475 | 504 | -2.1 | 113 | 6 | -1.15.3 | -1.55.8 |
| IW Car∗ | 29 | 2.20.2 | 18.21.1 | 503 | 1722 | -1.10.1 | 111 | 2 | 34.25.4 | 34.95.3 |
| CT Ori∗ | 1.5 | 3.90.2 | 2.11.0 | 404 | 1725 | -1.50.3 | 203 | 29 | 2.91.8 | -0.41.8 |
| AD Aql | 0.5 | 2.20.5 | 2.81.3 | 39 | 4819 | -2 | 2711 | 37 | 8.32.1 | 12.53.7 |
| RU Cen | 1.6 | 3.10.4 | 0.90.5 | 688 | 1545 | -2 | 92 | 78 | 9.21.6 | -6.33.1 |
| ST Pup | 15 | 1.50.6 | 9.8 | 50 | 128 | -1.6 | 305 | 61 | 6.21.0 | 1512 |
| Binary models | ||||||||||
| Object | ||||||||||
| (%) | (%) | (%) | (mas) | (mas) | ||||||
| EP Lyr | 2.3 | 1817 | 6512 | 1714 | 2.32.1 | -0.1 0.3 | 1.60.8 |
| Object | PA | ||||||||||
|---|---|---|---|---|---|---|---|---|---|---|---|
| (mas) | (mas) | (deg) | (deg) | (%) | (%) | (Jy) | |||||
| HD 101584 | 4.7 | 2.60.1 | 15.50.3 | 23 | 18 | -1.10.1 | - | - | - | -1.30.2 | 63.40.4 |
| HD 108015 | 1.1 | 1.80.1 | 12.50.3 | 322 | 152 | -1.30.1 | - | - | - | -0.20.1 | 23.70.3 |
| IRAS 08544 | 1.8 | 6.10.3 | 37.10.2 | 16 | 454 | -1.60.1 | - | 1.7 | -1.40.1 | 1773 | |
| IW Car | 4.4 | 2.40.1 | 27.80.4 | 64 | 174 | -1.20.1 | 301 | - | -14.810.5 | -19.710.3 | - |
| EP Lyr | 1.2 | 3.10.3 | 43.91.6 | 642 | 1713 | -1.90.1 | - | 1 | - | -2.60.1 | 0.16 0.01 |
| AC Her | 9.7 | 18.00.3 | 30.90.5 | 50 | 1662 | -2 | 61 | 2 | 7.11.2 | 10.02.1 | - |
| AD Aql | 7.2 | 2.30.1 | 3.60.2 | 3915 | 6611 | -2 | - | - | - | 0.8 0.1 | 1.20.1 |
| RU Cen | 50 | 3.40.1 | 32.80.7 | 681 | 1664 | -1.7 | - | - | - | 1.30.1 | 5.40.2 |
| ST Pup | 84 | 1.80.3 | 29.52.4 | 502 | 1282 | -1.60.1 | - | - | - | 0.50.2 | 5.10.4 |
The binary model took into account the flux ratios of the primary star, the secondary star (both modelled as point sources), and the over-resolved component. The positions of the secondary with respect to the primary, and , were allowed to be free. This resulted in five independent free parameters.
Since , , and are correlated with each other, we chose to let them free one by one. When the relative flux of the star was predicted to be similar to the flux ratio as deduced from the SED, we fixed it to this value and attempted to constrain the other free parameters. Then we explored each parameter one by one until all parameters that could be constrained with the available data had reasonable estimates. In each step, we minimised the reduced , . For each target, we first attempted to fit the - and -band data independently, but for some targets, the data did not allow us to constrain some parameters. In these cases, we fixed these parameters to the best-fit values of the other band or to the values fitted in an intermediate step. These parameters are reported without uncertainties. The uncertainties were calculated using a data resampling (bootstrapping) algorithm available in PMOIRED and scaled to the data scatter.
Our main aim was to constrain the inner rim size, which is obtained from the location of the fist zero of the visibilities. We therefore focused on reproducing this first zero. We checked whether the fitted was not strongly correlated with other fitting parameters. To have a distance-independent measure, the inner rim size was then compared to the theoretical dust sublimation radius, (Monnier & Millan-Gabet 2002; Lazareff et al. 2017),
| (2) |
where is the backwarming coefficient, is the cooling efficiency, is the bolometric luminosity of the post-AGB star, is the Stefan-Boltzmann constant, and is the dust sublimation temperature. We assumed and . Kluska et al. (2019) found that for post-AGB discs, the temperature of the inner dust rim is K. Similarly, radiative transfer modelling of IRAS 08544 shows that temperature of the inner dust rim is K (Corporaal et al. 2023). Therefore, we calculated at K.
As a consequence of the focus on reproducing the first zero, larger baseline data and hence smaller angular scales were not always fitted well. For these systems, we imposed a more complex model in which we added an azimuthal modulating in the ring. This modulation captures variations in the intensity distribution of the inner rim. We used the first- and second-order azimuthal harmonics implemented in PMOIRED as sinusoidal functions. the fitted parameters were the first- and second-order amplitudes of these modulations and the corresponding position angles with respect to the PA of the ring.
4 Results
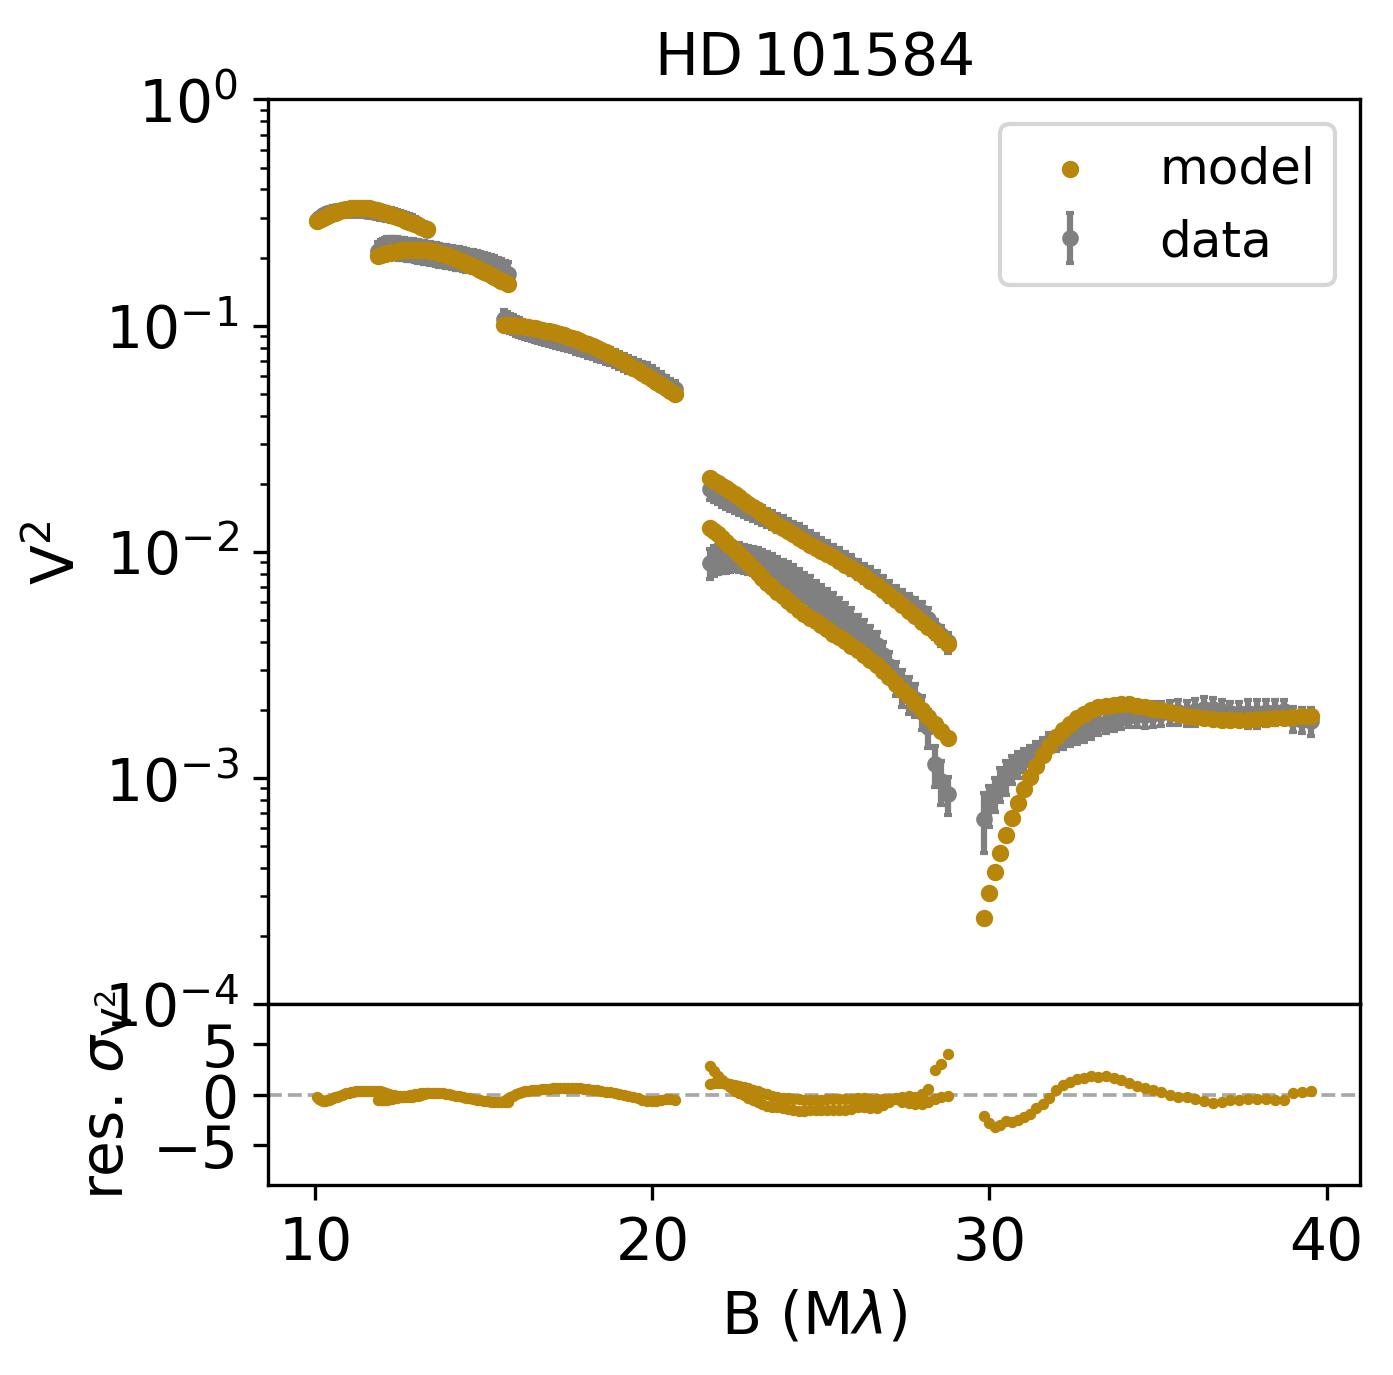
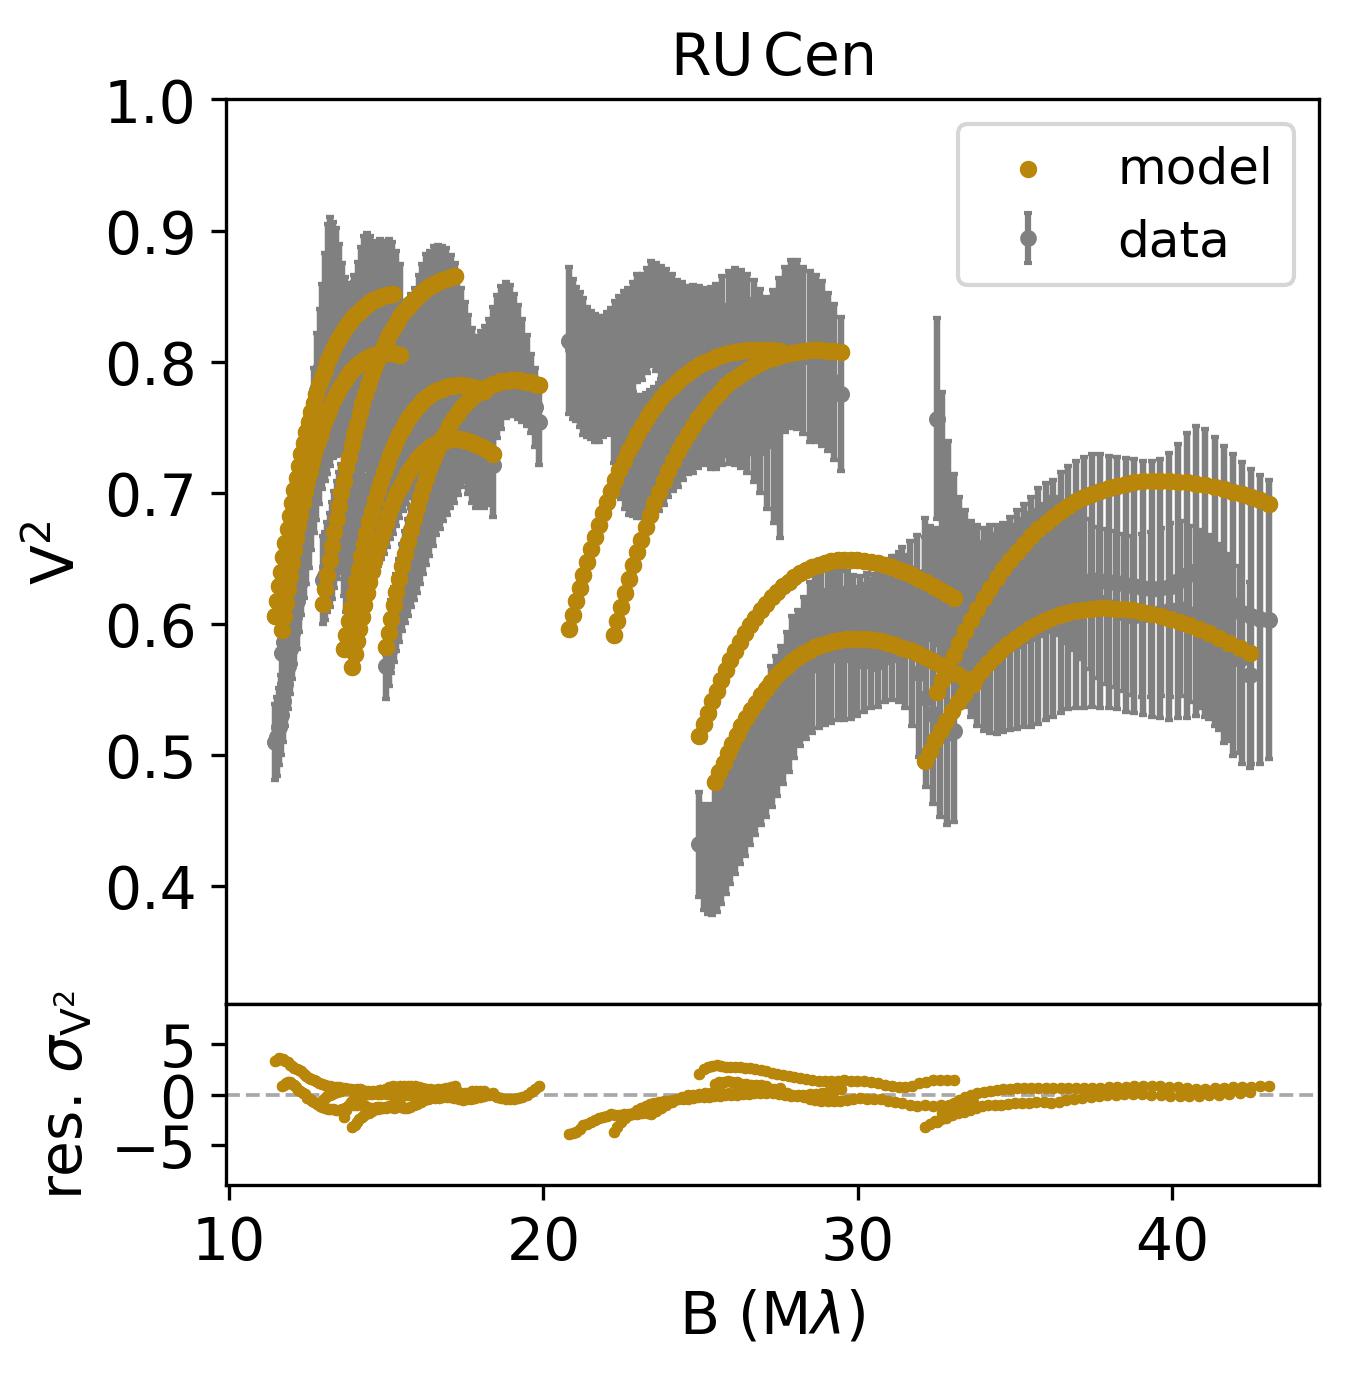
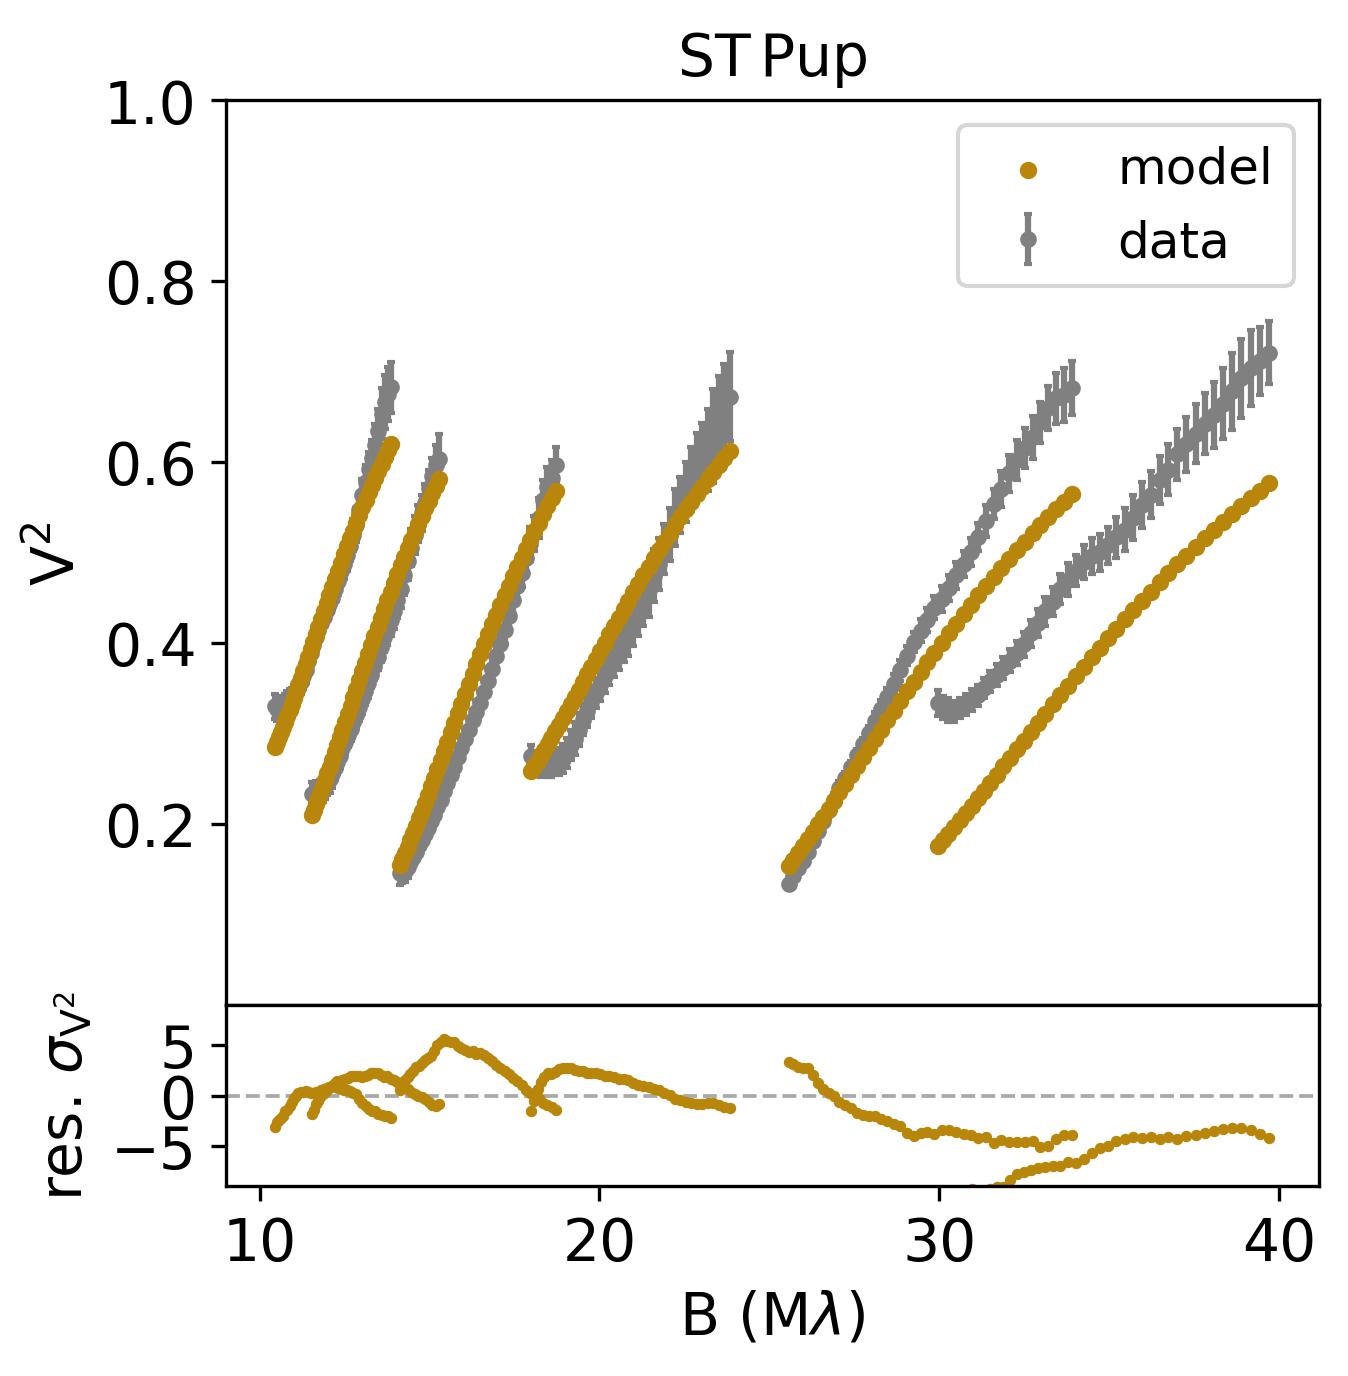
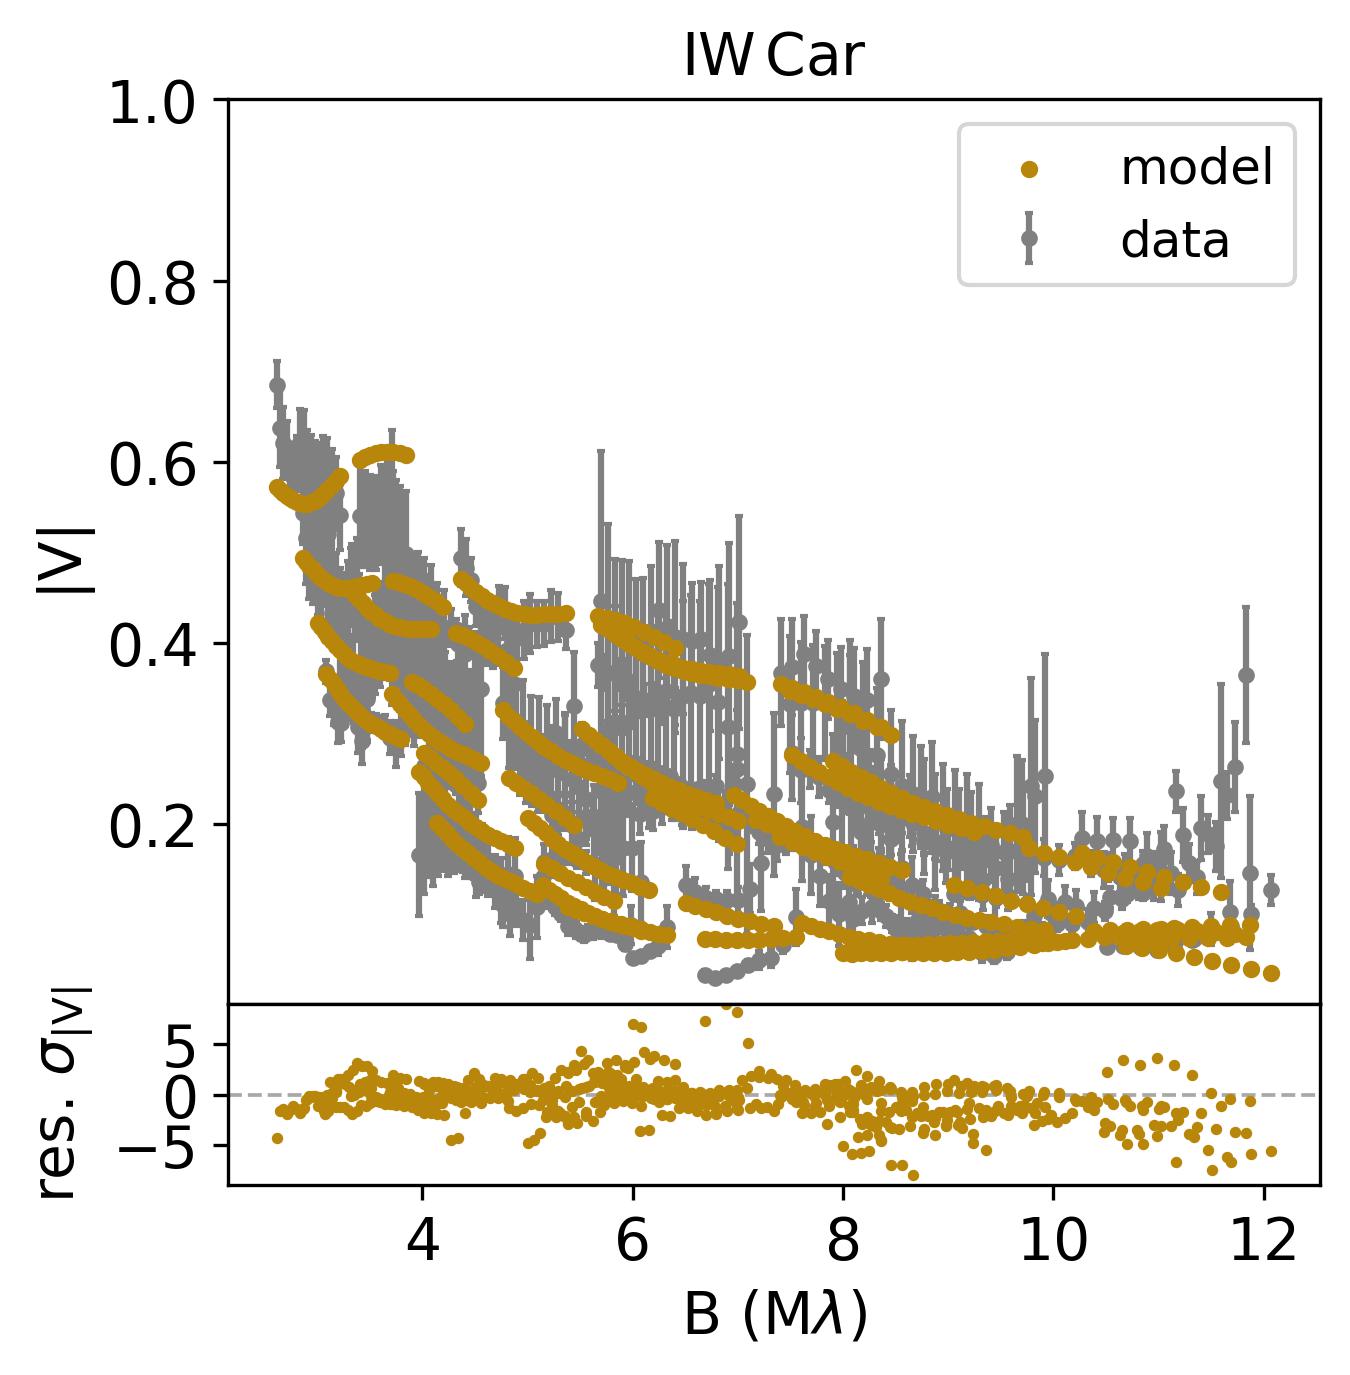
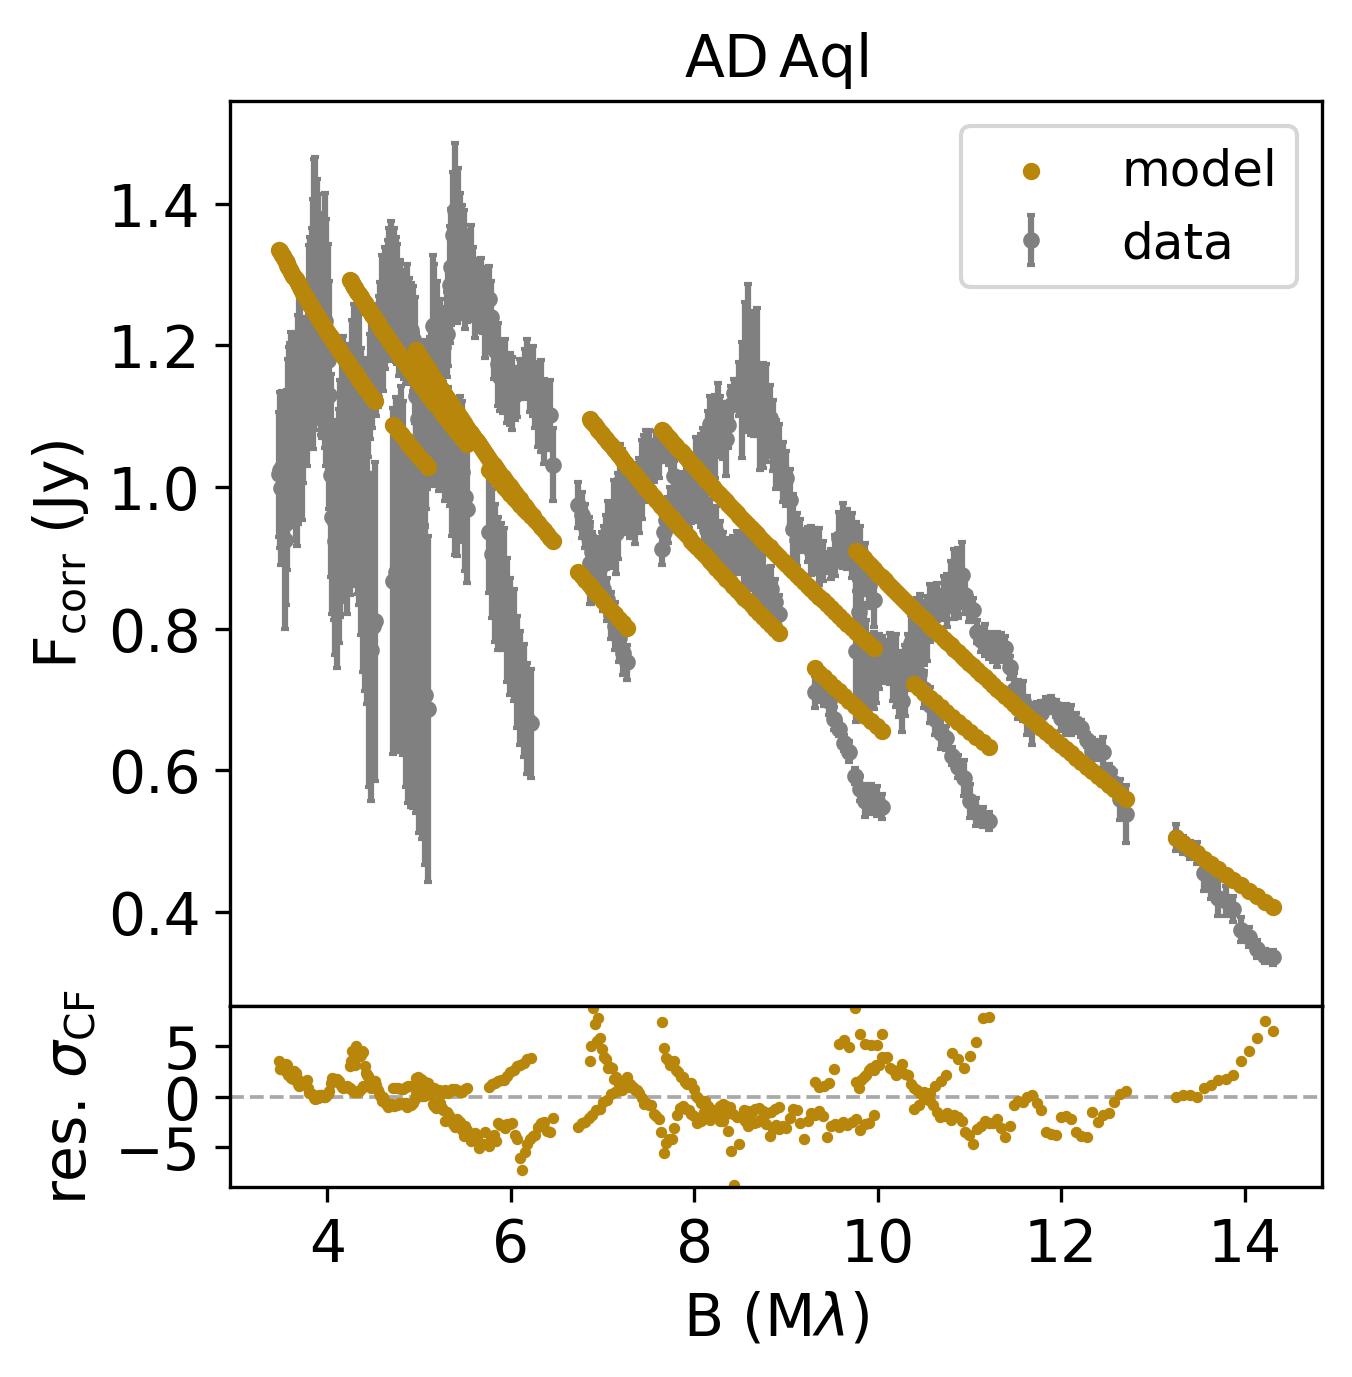
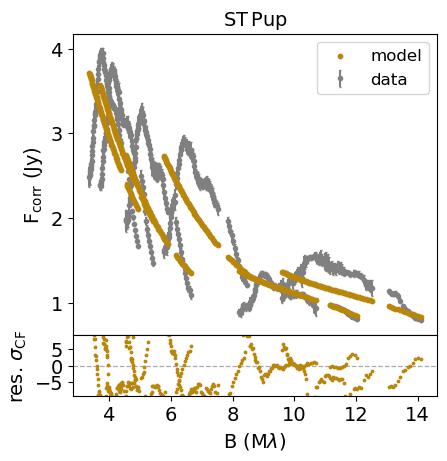
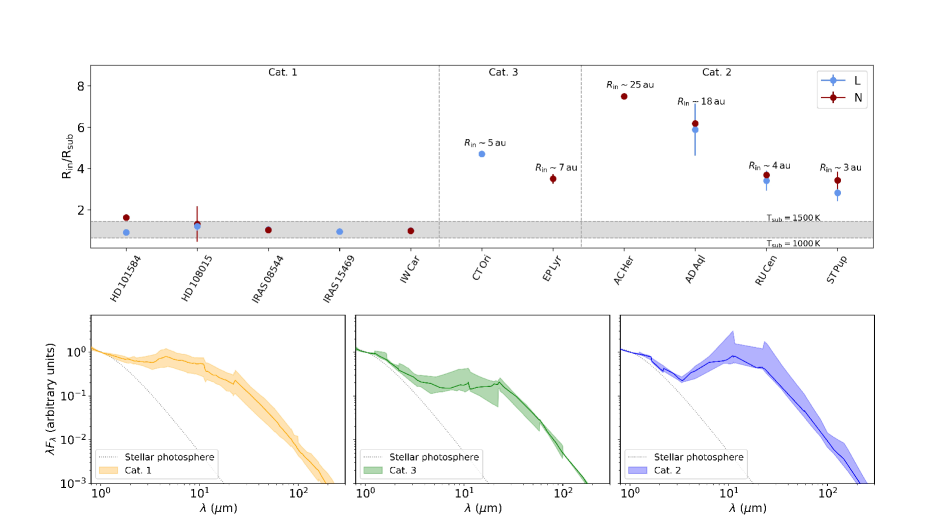
The parameters of the best-fit geometric models that reproduce the visibility data of the targets in the and bands are displayed in Tables 1 and 2, respectively. The visibility curves of the best-fitting models in the and bands are shown in Fig. 6 and Fig. 7, respectively. The inner rim radii relative to the theoretical dust sublimation radii of the targets are displayed in Fig. 2.
The inner rim radii of the category 1 targets are well constrained and are all within the boundaries of dust sublimation temperatures of 1000-1500 K, at least in . The inner rim radii of category 2 and 3 targets are clearly larger and are 2.5 to 7.5 times the dust sublimation radius. This translates into dust-free cavities of au assuming Gaia DR3 distances (Gaia Collaboration et al. 2016, 2022). In all cases for which reliable - and -band data were obtained, the estimates of the inner rim radii are consistent between these bands.
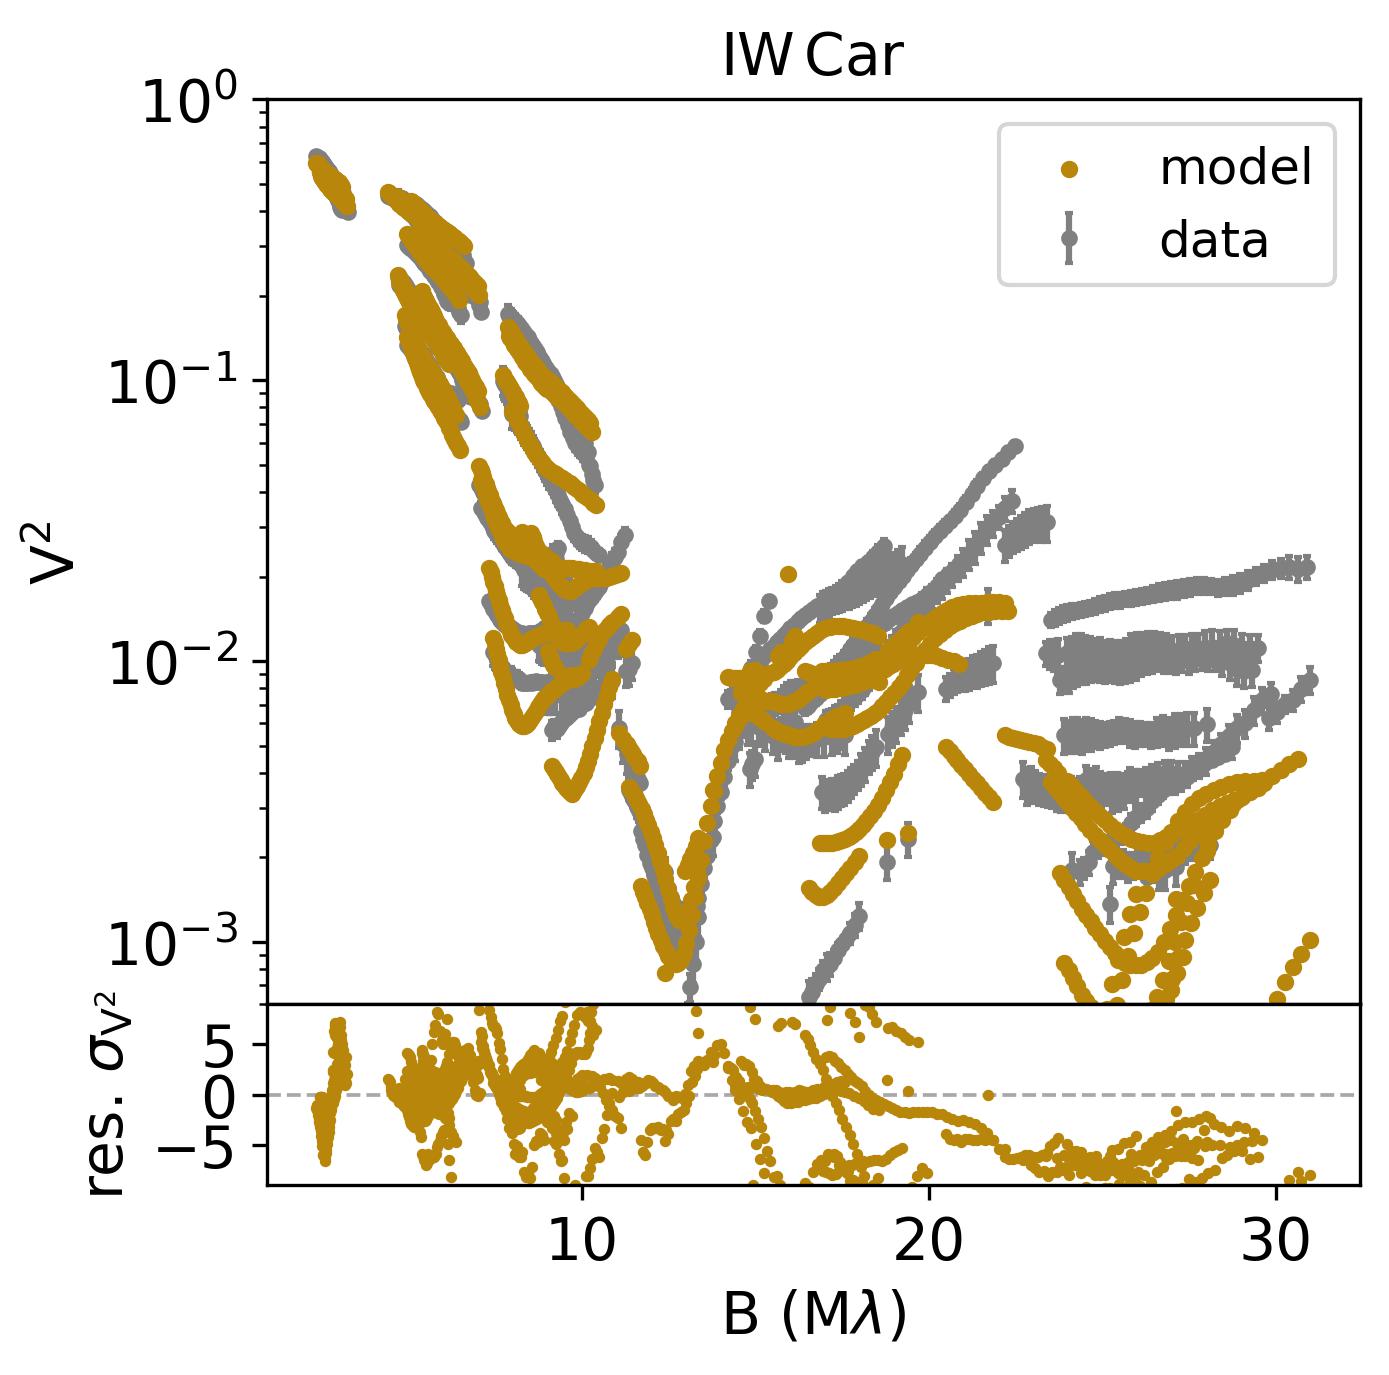
IW Car and EP Lyr are RVb variables (i.e. they show long-term changes in the mean brightness; e.g. Kiss et al. 2007; Manick et al. 2019) and indeed show high inclinations () in the band. The disc of EP Lyr does not emit in and thus no inclination can be derived. The inclination derived for IW Car in , however, is strongly preferred to be lower ( deg) than that of other RVb stars (see also Sect. 5).
The radial intensity profiles are better constrained in , covering broader disc regions than in . However, this is specifically the case for the full-disc sources, where MATISSE probes beyond the inner rim. Some are relatively high. We note that not the entire complexity has been captured by our modelling. In , higher values are found for the systems with a substantial amount of data (IRAS 08544 and IW Car), for the system to which the disc does not contribute significantly (9% at 3.5 m, ST Pup), or for the systems in which the complexity at smaller scales is not fully fitted (HD 108015 and CT Ori).
To reproduce the larger baselines of IW Car, HD 108015, and CT Ori azimuthal modulations of the first- and second-order were taken into account. These modulations lower the minimisation results from 60 to 29 for IW Car, from 18 to 9.0 for HD 108015, and from 7.1 to 1.5 for CT Ori. The best-fit results of IW Car have variations with amplitudes of 0.520.13 and 0.350.05 and position angles of -7924 deg and -486 deg with respect to the of the ring for the first- and second-order modulation, respectively. Similarly, the best-fit results of HD 108015 have azimuthal modulations with amplitudes of 0.680.16 and 0.510.15 at position angles of 12213 deg and 8210 deg for the first- and second-order modulation, respectively. Despite this additional complexity, the model is not able to fully reproduce the data of the large baseline, which corresponds to baseline UT1-UT4, while it is able to reproduce the data of the other baselines. The best-fit results of CT Ori show azimuthal modulations with amplitudes of 1.00.1 and 0.250.21 with position angles of 9011 deg and -8723 deg for the first- and second-order modulation, respectively.
The large baseline data of ST Pup are not well reproduced. As a result of the small contribution of the disc to the total flux, any azimuthal modulations of the inner rim do not improve the fit of these baselines. The contribution of its over-resolved component is high. Smaller-scale structures such as the binary component and their respective offsets from the centre likely play a role, but have not been captured in our modelling.
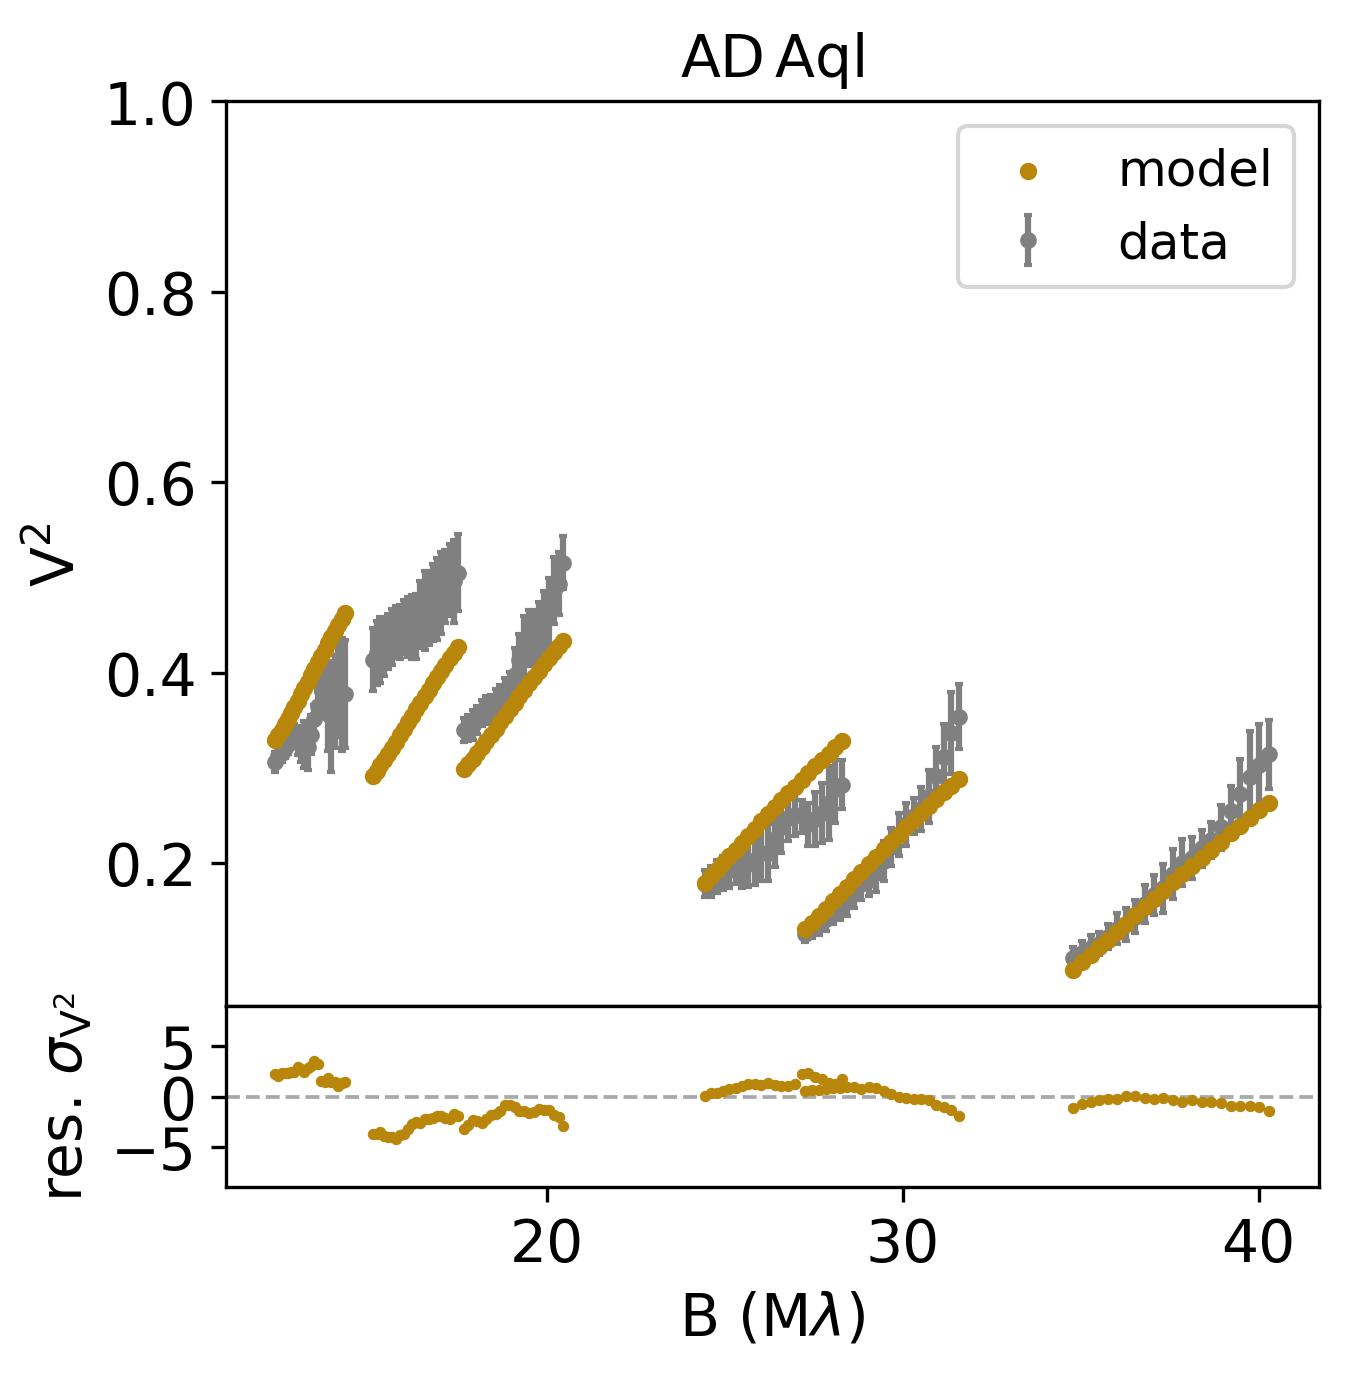
In , higher values are for systems that show prominent silicate features in their visibility curves (AD Aql, RU Cen, and ST Pup) or for a system with a sparse coverage (AC Her). For AD Aql, RU Cen, and ST Pup, only the general trend could be reproduced with these geometric modelling because no specific dust species was assumed. The small-baseline data (probing larger scales) of AC Her are not well reproduced with our modelling, while the larger-baseline data and the location of the first zero are reproduced well.
5 Discussion
The inner rim radii of the transition disc candidates are all several times larger than the dust sublimation radius. This indicates that these systems indeed show large inner dust-free cavities. CT Ori, EP Lyr, AC Her, AD Aql, RU Cen, and ST Pup are therefore indeed transition discs, reminiscent of those that surround YSOs. The physical inner cavity sizes are between 3 and 25 au. For AC Her, we found a lower than inferred with the radiative transfer model of Hillen et al. (2015) (scaled to the same distance) because we focused on reproducing the first zero.
The inclination derived for IW Car in is consistent with the RVb phenomenon. However, the -band visibilities prefer lower inclinations of deg. Similar inclinations were found with near-IR interferometric observations by Kluska et al. (2019). While azimuthal modulations significantly improve the fit in the band, the remains high, and our simple geometric model falls short of capturing the complexity of the disc structure. Multi-wavelength analyses combining the near-IR and mid-IR observations are needed to reveal its complexity.
For four systems, a silicate feature is evident in the -band visibility data. The most prominent silicate features are seen in the systems hosting a transition disc. Only in one system hosting a full disc, HD 108015, is the silicate feature observed, but it is much weaker than for AD Aql, RU Cen, and ST Pup. A radiative transfer treatment with the inclusion of dedicated dust species is needed to characterise this feature.
5.1 Comparisons with YSOs
We compared the cavity sizes of the transition discs around post-AGB binaries to the transition discs around YSOs. Varga et al. (2018) studied 82 PPDs with VLTI/MIDI and inferred the inner disc sizes via the dust sublimation radii or with radiative transfer modelling to infer structures such as cavities and gaps. We took their sample444https://cdsarc.cds.unistra.fr/viz-bin/cat/J/A+A/617/A83 and isolated the systems that have a dust-free cavity (). A comparison between the inner rim sizes of these discs and the post-AGB binary discs is shown in Fig. 3. The transition discs around post-AGB binaries show similar or larger physical inner rim sizes. Due to the higher intrinsic luminosities of the post-AGB stars, will be larger than in YSOs (see Eq. 2). The physical scale of the transition discs, which are several times , will thus also be larger. In units of , the inner disc radii are similar to the transition discs around YSOs, but show a narrower range because higher ratios imply very large physical radii (¿30 au) because the high luminosity of the post-AGB star implies large . More complete YSO transition disc studies using ALMA (angular resolutions ) reveal that typical dust-free cavities are au (van der Marel 2023), which is larger than found for any of the transition discs observed with mid-IR interferometry. The dust temperature regimes that these techniques probe are different, and larger cavities might be found for category 4 post-AGB discs.
5.2 Origin of the dust cavities
The origin of the dust cavities is unclear so far. In YSOs, five main interpretations have been put forward to explain the large dust cavities (van der Marel 2023, and references therein). These include massive planetary companions, photoevaporative clearing, dead zones, enhanced grain growth, and dynamical binary interactions.
For circumbinary discs around post-AGB binaries, photoevaporation and dead zones (i.e. low-ionisation regions in which the activity of magneto-rotational instability is quiescent) are unlikely to be the origin of the large inner cavities because there are no high-energy photons. These photons are needed to cause the dust to heat and evaporate or to magnetise the disc.
Birnstiel et al. (2012) showed that the lack of near-IR excess might be caused by effective grain growth in the inner disc, depleting the micrometre-sized grains, but not the millimetre-sized grains. In this scenario, inward radial drift must have occurred, which is unlikely to be efficient over the short lifetime of post-AGB discs ( yr). However, both millimetre observations and radiative transfer modelling are needed to conclude about the possibility of enhanced grain growth as the origin of transition discs among the circumbinary disc population around post-AGB binaries.
The scenario in which a massive planetary companion opens the gap remains a plausible explanation and would simultaneously explain the observed cavities and the depletion pattern. This scenario needs to be tested by taking the MATISSE phase information into account and subsequently using hydrodynamical simulations to reproduce the data.
The binary nature also remains a possibility because dynamical interactions induced by the binary might create the cavity. Whether these interactions can indeed create a large enough cavity depends on the dynamical truncation radius of the binary. In future work, the dynamical truncation radii obtained from astrometric orbits need to be compared with the cavity sizes obtained in this work. The astrometric orbit is only available for AC Her so far (Anugu et al. 2023) and needs to be determined for all systems for a clear view.
6 Conclusion
We presented mid-IR interferometric observations in the and bands of 11 post-AGB binary systems. These systems are distinct in their SED because 5 systems show an IR excess starting at near-IR wavelengths, while 6 systems show a deficit at these wavelengths and the IR excess starts at mid-IR wavelengths. We showed that the inner dust rims of the latter 6 systems are located at 2.5 to 7.5 times the theoretical dust sublimation radius, corresponding to dust-free cavity sizes of 3-25 au. We therefore confirm that CT Ori, EP Lyr, AD Aql, RU Cen, and ST Pup, in addition to AC Her, are indeed transition discs, reminiscent of those that surround young stars. In future modelling, we wish to explore the non-symmetry and potential discontinuity by fitting MATISSE phase information. This will allow us to test whether a planet or the binary interaction causes the transition disc nature. Moreover, we plan to use the Spectro-Polarimetric High-contrast Exoplanet REsearch instrument on the VLT and ALMA continuum observations to characterise the full extent of the dusty disc. Furthermore, the James Webb Space Telescope will allow us to search for the gaseous species inside the inner dust rim to characterise the depletion and accretion mechanisms.
Acknowledgements.
We thank the referee for their constructive comments and suggestions that substantially improved the clarity of the paper. A.C. and H.V.W. acknowledge support from FWO under contract G097619N. J.K. acknowledges support from FWO under the senior postdoctoral fellowship (1281121N). This project has received funding from the European Research Council (ERC) under the European Union Horizon Europe programme (grant agreement No. 101042275, project Stellar-MADE). D.K. and K.A. acknowledge the support of the Australian Research Council (ARC) Discovery Early Career Research Award (DECRA) grant (DE190100813). This research was supported in part by the Australian Research Council Centre of Excellence for All Sky Astrophysics in 3 Dimensions (ASTRO 3D) through project number CE170100013. This research has benefited from the help of SUV, the VLTI user support service of the Jean-Marie Mariotti Center555http://www.jmmc.fr/suv.htm, with special thanks to A. Matter. This research has made use of the Jean-Marie Mariotti Center OIFits Explorer666Available at http://www.jmmc.fr/oifitsexplorer and Aspro777Available at http://www.jmmc.fr/aspro services. This paper was submitted on -day 2023.References
- Andrews et al. (2011) Andrews, S. M., Wilner, D. J., Espaillat, C., et al. 2011, ApJ, 732, 42
- Anugu et al. (2023) Anugu, N., Kluska, J., Gardner, T., et al. 2023, ApJ, submitted
- Artymowicz & Lubow (1994) Artymowicz, P. & Lubow, S. H. 1994, ApJ, 421, 651
- Birnstiel et al. (2012) Birnstiel, T., Andrews, S. M., & Ercolano, B. 2012, A&A, 544, A79
- Brown et al. (2009) Brown, J. M., Blake, G. A., Qi, C., et al. 2009, ApJ, 704, 496
- Bujarrabal et al. (2013a) Bujarrabal, V., Alcolea, J., Van Winckel, H., Santander-García, M., & Castro-Carrizo, A. 2013a, A&A, 557, A104
- Bujarrabal et al. (2015) Bujarrabal, V., Castro-Carrizo, A., Alcolea, J., & Van Winckel, H. 2015, A&A, 575, L7
- Bujarrabal et al. (2017) Bujarrabal, V., Castro-Carrizo, A., Alcolea, J., et al. 2017, A&A, 597, L5
- Bujarrabal et al. (2013b) Bujarrabal, V., Castro-Carrizo, A., Alcolea, J., et al. 2013b, A&A, 557, L11
- Bujarrabal et al. (2018) Bujarrabal, V., Castro-Carrizo, A., Van Winckel, H., et al. 2018, A&A, 614, A58
- Calvet et al. (2002) Calvet, N., D’Alessio, P., Hartmann, L., et al. 2002, ApJ, 568, 1008
- Corporaal et al. (2021) Corporaal, A., Kluska, J., Van Winckel, H., et al. 2021, A&A, 650, L13
- Corporaal et al. (2023) Corporaal, A., Kluska, J., Van Winckel, H., Kamath, D., & Min, M. 2023, A&A, 671, A15
- Cruzalèbes et al. (2019) Cruzalèbes, P., Petrov, R. G., Robbe-Dubois, S., et al. 2019, MNRAS, 490, 3158
- Gaia Collaboration et al. (2016) Gaia Collaboration, Prusti, T., de Bruijne, J. H. J., et al. 2016, A&A, 595, A1
- Gaia Collaboration et al. (2022) Gaia Collaboration, Vallenari, A., Brown, A. G. A., et al. 2022, arXiv e-prints, arXiv:2208.00211
- Gallardo Cava et al. (2023) Gallardo Cava, I., Alcolea, J., Bujarrabal, V., Gómez-Garrido, M., & Castro-Carrizo, A. 2023, A&A, 671, A80
- Gallardo Cava et al. (2021) Gallardo Cava, I., Gómez-Garrido, M., Bujarrabal, V., et al. 2021, A&A, 648, A93
- Gielen et al. (2011) Gielen, C., Bouwman, J., van Winckel, H., et al. 2011, A&A, 533, A99
- Giridhar et al. (2005) Giridhar, S., Lambert, D. L., Reddy, B. E., Gonzalez, G., & Yong, D. 2005, ApJ, 627, 432
- Hillen et al. (2015) Hillen, M., de Vries, B. L., Menu, J., et al. 2015, A&A, 578, A40
- Hillen et al. (2016) Hillen, M., Kluska, J., Le Bouquin, J. B., et al. 2016, A&A, 588, L1
- Hillen et al. (2017) Hillen, M., Van Winckel, H., Menu, J., et al. 2017, A&A, 599, A41
- Hirsh et al. (2020) Hirsh, K., Price, D. J., Gonzalez, J.-F., Ubeira-Gabellini, M. G., & Ragusa, E. 2020, MNRAS, 498, 2936
- Kama et al. (2015) Kama, M., Folsom, C. P., & Pinilla, P. 2015, A&A, 582, L10
- Kamath & Van Winckel (2019) Kamath, D. & Van Winckel, H. 2019, MNRAS, 486, 3524
- Kiss et al. (2007) Kiss, L. L., Derekas, A., Szabó, G. M., Bedding, T. R., & Szabados, L. 2007, MNRAS, 375, 1338
- Kluska et al. (2022) Kluska, J., Van Winckel, H., Coppée, Q., et al. 2022, A&A, 658, A36
- Kluska et al. (2019) Kluska, J., Van Winckel, H., Hillen, M., et al. 2019, A&A, 631, A108
- Lazareff et al. (2017) Lazareff, B., Berger, J. P., Kluska, J., et al. 2017, A&A, 599, A85
- Lopez et al. (2022) Lopez, B., Lagarde, S., Petrov, R. G., et al. 2022, A&A, 659, A192
- Manick et al. (2019) Manick, R., Kamath, D., Van Winckel, H., et al. 2019, A&A, 628, A40
- Menu et al. (2014) Menu, J., van Boekel, R., Henning, T., et al. 2014, A&A, 564, A93
- Mérand (2022) Mérand, A. 2022, in Society of Photo-Optical Instrumentation Engineers (SPIE) Conference Series, Vol. 12183, Optical and Infrared Interferometry and Imaging VIII, ed. A. Mérand, S. Sallum, & J. Sanchez-Bermudez, 121831N
- Miranda & Lai (2015) Miranda, R. & Lai, D. 2015, MNRAS, 452, 2396
- Monnier & Millan-Gabet (2002) Monnier, J. D. & Millan-Gabet, R. 2002, ApJ, 579, 694
- Oomen et al. (2019) Oomen, G.-M., Van Winckel, H., Pols, O., & Nelemans, G. 2019, A&A, 629, A49
- Oomen et al. (2018) Oomen, G.-M., Van Winckel, H., Pols, O., et al. 2018, A&A, 620, A85
- Piétu et al. (2006) Piétu, V., Dutrey, A., Guilloteau, S., Chapillon, E., & Pety, J. 2006, A&A, 460, L43
- Pinilla et al. (2015) Pinilla, P., van der Marel, N., Pérez, L. M., et al. 2015, A&A, 584, A16
- Ratzka et al. (2007) Ratzka, T., Leinert, C., Henning, T., et al. 2007, A&A, 471, 173
- van der Marel (2023) van der Marel, N. 2023, Eur. Phys. J. Plus, 138, 225
- Van Winckel (2018) Van Winckel, H. 2018, arXiv e-prints, arXiv:1809.00871
- Van Winckel et al. (1995) Van Winckel, H., Waelkens, C., & Waters, L. B. F. M. 1995, A&A, 293, L25
- Varga et al. (2018) Varga, J., Ábrahám, P., Chen, L., et al. 2018, A&A, 617, A83
Appendix A MATISSE data reduction and calibration
We outline the data reduction process and the observational and calibration problems that occurred. A log of the observations is displayed in Table 3. The calibrated - and -band visibilities and the corresponding coverages are shown in Figs. 4 and 5, respectively.
The standard observing mode is the hybrid mode. It consists of two steps. First, all collected photons are sent into the interferometric and photometric channel (SiPhot mode) for the and bands and to the interferometric channel (HighSens mode) in the band. Second, telescope chopping is done in the SiPhot mode, and photometry is taken into the band. The second step was skipped for all observations taken with the four UTs during P109 and P110. This means that for these observations, no chopping sequences were carried out, such that no separation of the stellar flux from the sky background could be obtained. Coherent flux, differential phase, and closure phase measurements do not depend on chopping and could be recorded without this step.
The stability of the instrumental and atmospheric responses of observations of the science target and the calibrators were assessed from the variations in the transfer function. Calibrators were selected from the Mid-infrared stellar Diameters and Fluxes compilation Catalogue (Cruzalèbes et al. 2019) and were checked for being flagged for IR excesses or bad object types. The intended -band calibrators for IRAS 15469 and the small-baseline data of IW Car are bad calibrators as they show both an IR excess and an IR extent. The -band calibrator could not be used to calibrate the data either because its -band flux is too low. Therefore, the -band data of IRAS 15469 could not be calibrated and were discarded. Similarly, for IW Car, the small-baseline data could not be calibrated, and only the medium baseline -band data were used.
In the standard MATISSE pipeline, a spectral channel is represented by five and seven spectral pixels on the detector in the and bands, respectively. The data were thus binned accordingly. The data of all targets except for EP Lyr were reduced with these settings. EP Lyr is faint, and its mid-IR brightness of 0.25 Jy in is at the limits of the MATISSE instrument of 0.1 Jy correlated flux that could be guaranteed in P109. The resulting S/N was not enough with a regular spectral binning in the band. To increase the S/N, the data were reduced using a spectral binning of 21 pixels. The -band data of IW Car were spectrally binned by a factor of three after data reduction to increase the S/N.
During the observations of HD 108015, the baseline UT1-UT3 had technical issues that significantly affected the -band correlated flux. Consequently, baseline UT1-UT3 was disregarded in the modelling for this target.
For the band, the consequence of skipping the second step in the standard hybrid mode is that it lacks a correction of the thermal background fluctuations because no chopping is done. This mainly affected the data of EP Lyr and AD Aql. For these objects, photometry taken in in the first step was not reliable at m because they were affected by temporal fluctuations in the atmospheric conditions. Therefore, data at m were discarded for these two targets. Other (changes in) atmospheric conditions likely affected the observations of CT Ori. The -band data of CT Ori were discarded because they were found to be very noisy.
| Object | Date | Progam ID | MJD | Configuration | Calibrator(s) L | Calibrator(s) N |
|---|---|---|---|---|---|---|
| HD 101584 | 2022-05-23 | 109.23KF | 59722.06 | UT1UT2UT3UT4 | V918 Cen | V918 Cen |
| HD 108015 | 2022-05-23 | 109.23KF | 59722.10 | UT1UT2UT3UT4 | W Cen | W Cen |
| IRAS 15469 | 2021-05-21 | 105.20QN | 59355.12 | A0B2D0C1 | HD 140354 | - |
| IW Car (A) | 2020-12-30 | 106.21NK | 59213.24 | A0B2D0C1 | HD 77324 + CD-553254 | - |
| IW Car (B) | 2020-12-30 | 106.21NK | 59213.30 | A0B2D0C1 | HD 77324 + CD-553254 | - |
| IW Car (C) | 2021-01-02 | 106.21NK | 59216.29 | A0B2D0C1 | HD 77324 + CD-553254 | - |
| IW Car (D) | 2021-01-03 | 106.21NK | 59217.18 | A0B2D0C1 | HD 77324 + CD-553254 | - |
| IW Car (E) | 2021-02-23 | 106.21NK | 59268.16 | K0G2D0J3 | HR 3914 | N Vel |
| IW Car (F) | 2021-02-26 | 106.21NK | 59271.05 | K0G2D0J3 | HR 3914 | N Vel |
| IW Car (G) | 2021-03-10 | 106.21NK | 59283.10 | K0G2D0J3 | HR 3914 | N Vel |
| IW Car (H) | 2021-03-10 | 106.21NK | 59283.18 | K0G2D0J3 | HR 3914 | N Vel |
| IW Car (I) | 2021-03-20 | 106.21NK | 59293.05 | K0G2D0J3 | HR 3914 | N Vel |
| IW Car (J) | 2021-03-20 | 106.21NK | 59293.10 | K0G2D0J3 | HR 3914 | N Vel |
| CT Ori | 2023-01-07 | 110.24AC | 59951.17 | UT1UT2UT3UT4 | 17 Mon | 17 Mon |
| EP Lyr | 2022-05-23 | 109.23KF | 59722.32 | UT1UT2UT3UT4 | HD 180450 | HD 180450 |
| AD Aql | 2022-05-23 | 109.23KF | 59722.27 | UT1UT2UT3UT4 | i Aql | alf Sct |
| RU Cen (A) | 2022-05-22 | 109.23KF | 59722.00 | UT1UT2UT3UT4 | B Cen | HD 112213 |
| RU Cen (B) | 2023-01-08 | 110.24AC | 59952.30 | UT1UT2UT3UT4 | B Cen | HD 112213 |
| ST Pup | 2022-11-15 | 110.24AC | 59864.27 | UT1UT2UT3UT4 | HD 50235 | HD 47536 |


Appendix B System properties
Table 4 shows the properties of the 11 systems in the sample. To summarise, category 1 targets are surrounded by a full disc and show larger [Fe/H] and lower [Zn/Ti] than category 2 and 3 targets, which are surrounded by transition discs.
| Object | Cat. | (K) | [Fe/H] | [Zn/Ti] | RVb | (K) |
|---|---|---|---|---|---|---|
| HD 101584 | Cat. 1 | 7000 | 0.0 | - | no | - |
| HD 108015 | Cat. 1 | 7000 | -0.1 | 0.10 | no | - |
| IRAS 08544 | Cat. 1 | 7250 | -0.5 | 0.90 | no | 1200 |
| IRAS 15469 | Cat. 1 | 7500 | 0.0 | 1.80 | no | 1300 |
| IW Car | Cat. 1 | 6700 | -1.0 | 2.1 | yes | 1100 |
| CT Ori | Cat. 3 | 5500 | -2.0 | 1.90 | no | 1200 |
| EP Lyr | Cat. 3 | 7000 | -1.5 | 1.40 | yes | 800 |
| AC Her | Cat. 2 | 5500 | -1.7 | 1.00 | no | 1200 |
| AD Aql | Cat. 2 | 6300 | -2.0 | 2.50 | no | 1000 |
| RU Cen | Cat. 2 | 6000 | -2.0 | 1.00 | no | 800 |
| ST Pup | Cat. 2 | 5750 | -1.5 | 2.10 | no | 800 |
Appendix C Best-fitting models
The best-fitting geometric models to the visibilities of the - and -band data of the 11 targets in our sample are shown in Figs. 6 and 7, respectively.