Study of afterpulsing in optical image intensifiers
Abstract
We will describe the characteristics of the afterpulsing effect seen in the optical intensifiers. It can be caused by either secondary electrons produced by primary photoelectrons hitting the micro-channel plate surface or by electron emission from the photocathode induced by the ion feedback. The result of this effect are additional pulses delayed with respect to the primary parent pulses. Using a fast data-driven camera, Tpx3Cam, we were able to clearly show afterpulsing present in the data at short time differences and small distances from the primary pulse, as well as to show the evolution of the afterpulsing effect with increasing time difference. We also studied the afterpulsing spatial distribution and observed an azimuthal asymmetry, which we attribute to the afterpulsing ion component.
1 Introduction
Optical intensifiers discussed here are vacuum devices with fast amplification, which allow for optical cameras to reach higher sensitivity. The photons are converted to photoelectrons on a photocathode and undergo avalanche amplififcation in the micro-channel plate (MCP) before they are directed to a scintillator to produce a fast flash of light. As a result, a single photon is converted to the flash, which is registered by a camera. A variety of camera types are used with intensifiers, primarily cameras based on charge-coupled devices, CCD, and on complimentary metal-oxide-semiconductor or CMOS sensors [1, 2, 3, 4, 5]. Here we will be focusing on single photon sensitive cameras, in particular, on the performance of intensified Tpx3Cam, a data driven camera with nanosecond scale timing resolution and fast readout [6]. In our measurements we used the Tpx3Cam as a tool to investigate properties of intensifiers and, therefore, our results are applicable to all types of intensified cameras.
Below we will describe the characteristics of afterpulsing, which are the production of additional pulses delayed with respect to the primary parent pulse. Afterpulsing can mimic and distort various effects in quantum optics and quantum information science experiments, which involve registration and analysis of single photons, especially when studying the temporal and spatial correlations of multiple photons. An important example is the Hanbury Brown - Twiss (HBT) effect, which manifests itself as correlations of thermal photon pairs [7, 8, 9]. Other examples are coincidences of single photons in the Hong-Ou-Mandel (HOM) interference [4, 10, 11] and false detection of bright states in ion crystals in Paul traps [12].
In the following sections we describe the intensified Tpx3Cam camera used for the measurements and provide details of the measurements to characterize the afterpulsing phenomenon.
2 Tpx3Cam fast camera
Imaging of single photons throughout these experiments was done with a Tpx3Cam, a data-driven time-stamping camera [13, 14, 6, 15, 16]. This camera has high quantum efficiency (QE) [17] and a silicon optical sensor. This sensor is then bump-bonded to Timepix3 [18], which is an application specific integrated circuit (ASIC) with pixels of m2. The time of arrival (ToA) is measured using the electronics present in each pixel, which processes the incoming signals for hits that cross a predefined threshold of around 600 electrons, with a precision of 1.56 ns. Another important information, measured simultaneously with ToA for each hit, is the time-over-threshold (ToT), which is related to the deposited energy in each pixel. The ToT values are stored together with the ToA values as time codes. The readout of Timepix3 is data driven, with a pixel deadtime of 475 ns + ToT, which allows for multi-hit functionality of every pixel, each independent from others and very fast at a 80 Mpix/sec bandwidth [19].
2.1 Intensified Camera
For the single photon sensitive operation, the signal is amplified with the addition of CricketTM [20], which contains integrated image intensifier, power supply, and relay optics to project the light flashes from the intensifier output window directly on to the optical sensor in the camera. The image intensifier is a vacuum device comprised of a photocathode followed with a micro-channel plate (MCP) and fast scintillator P47 with risetime of about 7 ns and maximum emission at 430 nm [21]. The image intensifier operates at a high gain such that a single detected photon can creates a signal well above the threshold of the Timepix3 camera. The quantum efficiency of the camera is determined primarily by the intensifier photocathode with a variety of photocathodes available, covering the spectral range from 120–900 nm[20, 6]. As an example, the hi-QE-green photocathode in the intensifier has QE of about 30% in the range of 400 - 480 nm and hi-QE-red photocathode has QE of about 20% in the range of 550 - 850 nm [22]. The MCP in the intensifier can have an improved detection efficiency close to 100% [23].
Similar configurations of the intensified Tpx3Cam were used before for characterization of quantum networks [10, 24], quantum target detection [25, 26], quantum imaging [11, 27, 28], studies of micromotion in ion traps [12, 29, 30, 31], neutron detection [32, 33, 34, 35], optical readout of time-projection chamber (TPC) [36, 37] and lifetime imaging [38, 39, 40] studies.
2.2 Data post-processing
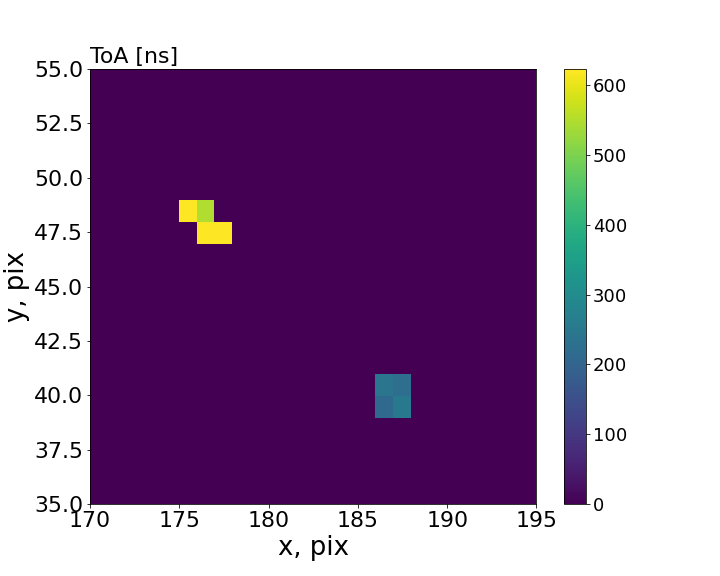
The left side of Figure 1 shows an example of raw TOA information for a pair of single photons registered in Tpx3Cam. Upon observation, it can be seen that photons appear as small groups of hit pixels. Subsequently, these pixels are organized into clusters within a predefined time window of 300 ns, using a recursive algorithm [14]. Since all hit pixels measure ToA and ToT independently and provide the position information, it can be used for centroiding to determine the coordinates of single photons. The ToT information is used for the weighted average, giving an estimate of the x, y coordinates for the incoming single photon with improved spatial resolution [38]. The timing of the photon is estimated by using ToA of the pixel with the largest ToT in the cluster. The above ToA is then adjusted for the so-called time-walk, an effect caused by the variable pixel electronics time response, which depends on the amplitude of the input signal [14, 41]. With this correction, a 2 ns time resolution (rms) can be achieved for single photons [24].
3 Afterpulsing
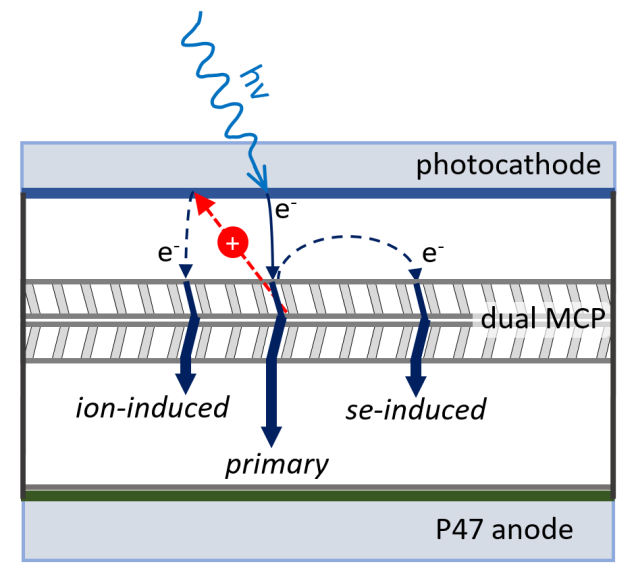
Alterpulsing is an important feature of the intensifier. It can be caused by secondary electrons or ions, which start another multiplication process in the vicinity of the primary pulse with a short delay [42]. The right part of Figure 1 illustrates these two mechanisms of afterpulsing generation. The first one is induced by primary photoelectrons hitting the web of the input MCP surface and producing secondary electrons. The number of secondary electrons is typically about 5 – 10. Most of them have low energy of few eV and are quickly collected by the nearest MCP channels, thus contributing to the primary pulse. However, some of the secondary electrons have higher energy and are able to fly away from the MCP and create their own avalanches. This happens within sub-ns time and with space distribution extended to double distance between photocathode and MCP, so to about 0.2 – 0.4 mm.
Another source of afterpulsing is a back flow of positively charged ions, which are generated by electron-ion stimulated desorption with the electron avalanche propagating through the MCP channels. These ions drift back to the photocathode, hitting its surface and generating emission of photoelectrons. Due to the ion higher mass the afterpulse is delayed with time distribution of the ion-induced afterpulses extending to 100’s of ns. The left part of Figure 1 shows two clusters of hits resulting from two photons in a pair hitting the Tpx3Cam. There is a clear delay between these two clusters of about 300-400ns showing a clear example of the afterpulsing effect.
Measurements described here were performed with the hi-QE-red photocathode [20]. We used the dark counts as a source of single photons with total rate of about 80 kHz distributed uniformly across the photocathode. This occupancy is entirely due to the thermal photoelectrons from the photocathode. After going through the registration chain (MCP-P47-Tpx3Cam), these signals look exactly the same and have same properties as response from the single photons.
To find the afterpulses in the data, we look at the differences in time and position between successive hits. Figure 2 shows two dimensional distributions of spatial differences in both the x and y directions for increasingly large time differences between the hits. Each of six graphs in the figure represents a 5 ns wide slice of data with different time difference between the pulses. The empty pixel area in the middle is due to the requirement for the two hits to be separated by at least one pixel. There is an obvious excess of pulses spatially close to each other due to the afterpulsing. It also can be seen from this figure that the afterpulsing effect quickly dissipates compared to its abundance in the 0-5 ns range and becomes very small (but still visible) by the time difference of about 200 ns between consecutive photon hits.
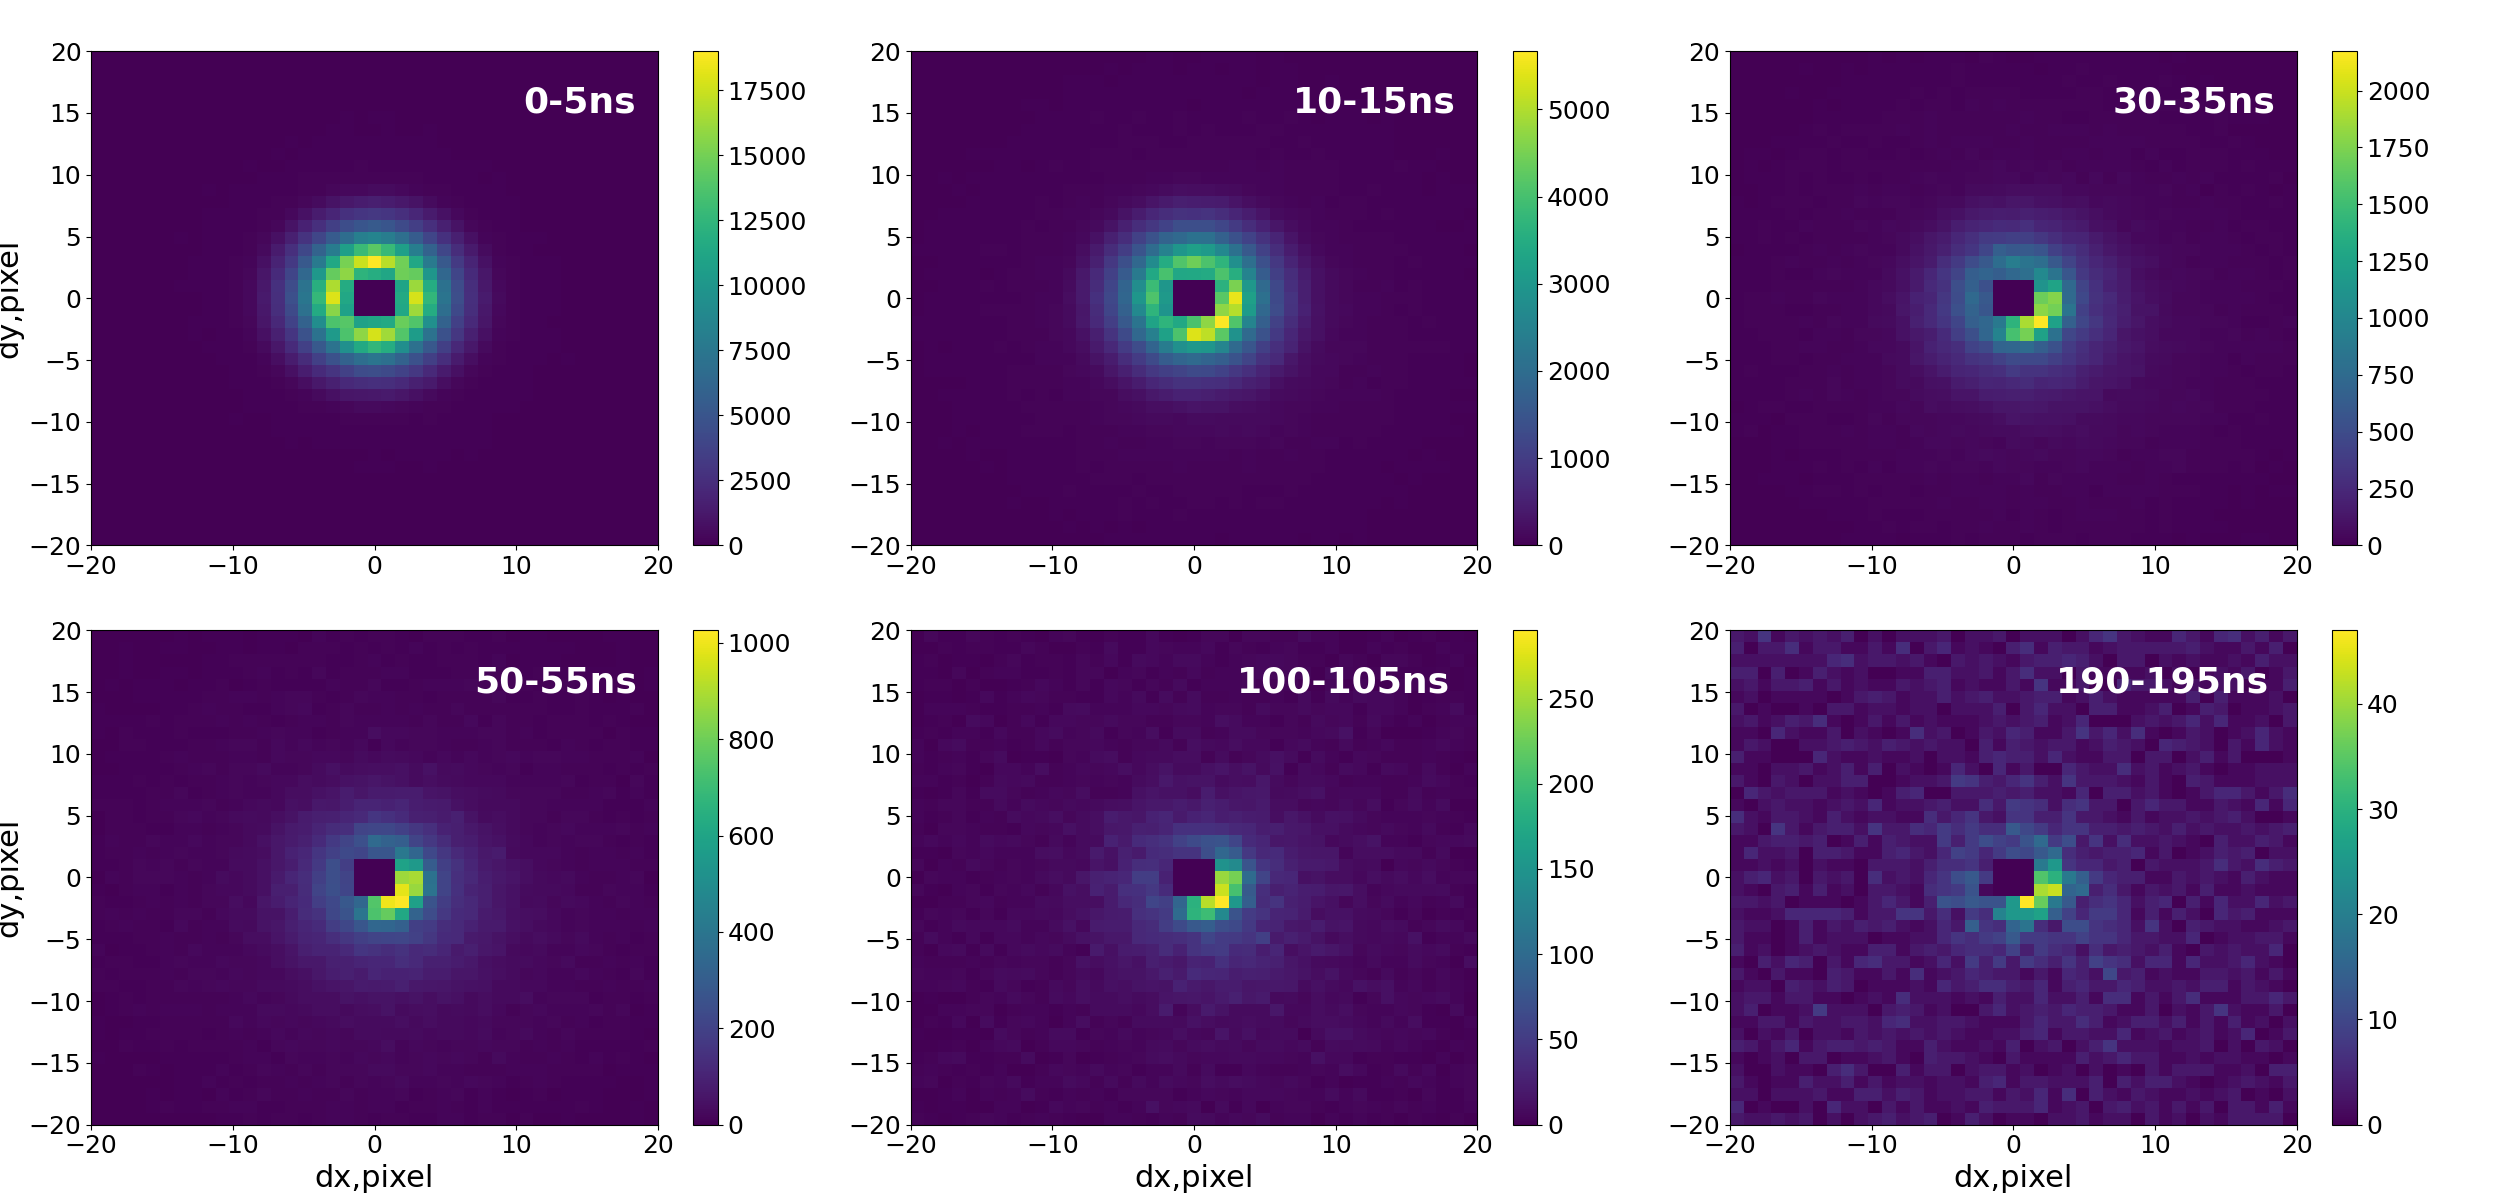
All of these graphs, except the one corresponding to the first 5 ns bin, also have an obvious asymmetry of the azimuthal distribution, which indicates a preferred direction. This is likely related to the orientation of channels in the MCP glass with respect to the sensor coordinate system. We verified this by rotating the intensifier by 90∘ with respect to the sensor, observing that the asymmetry followed the rotation.
An interesting issue to explore was to look at the ratio of the sum of all ToT values found within the asymmetrical region compared to the full ”donut” shaped region as shown in the left part of Figure 3. The right part of the figure shows this ratio over increasing time differences from 0 to 1000 ns with binning of 10 ns. It can be seen that the ratio is about 0.3 at small time differences corresponding to the ratio of corresponding geometrical areas and indicating azimuthal uniformity. The ratio reaches a peak of about 0.5 after 100 ns when the shape becomes asymmetric, then begins to drop off and falls back to the original 0.3 value, which is again consistent with a uniform dark count rate occupancy. This behavior suggests that the afterpulsing is only present until about 300 ns.

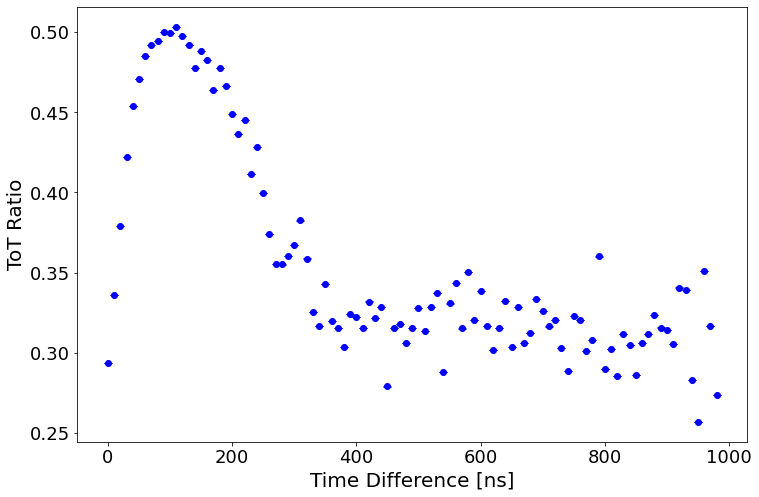
From the above measurements we see that there are two phases of afterpulsing: a bright and brief initial phase, which lasts about 10 ns or less and is symmetric, and an asymmetric delayed phase with lower intensity and duration of about 300 ns. We hypothesise that the first phase is due to the secondary electrons which are produced at the MCP surface and, therefore, are symmetric and the second phase is explained by generation of ions within the MCP channels during the multiplication process. The ions are driven by electric field towards the photocathode and acquire a direction as they move along the channels. The channels have a small angle, about 7 degrees, with respect to the orthogonal direction and, we believe, it is this that creates the asymmetry in the distribution. They also have a delayed response due to their slow movement and large distance to the photocathode.
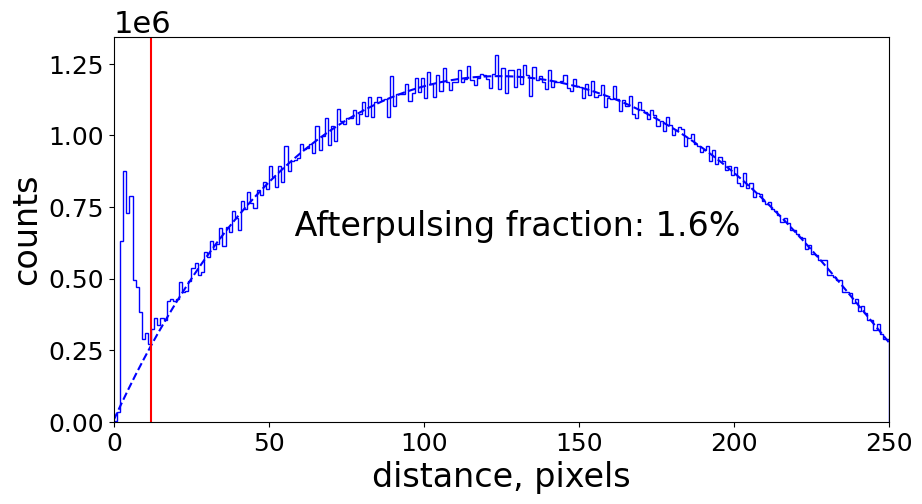
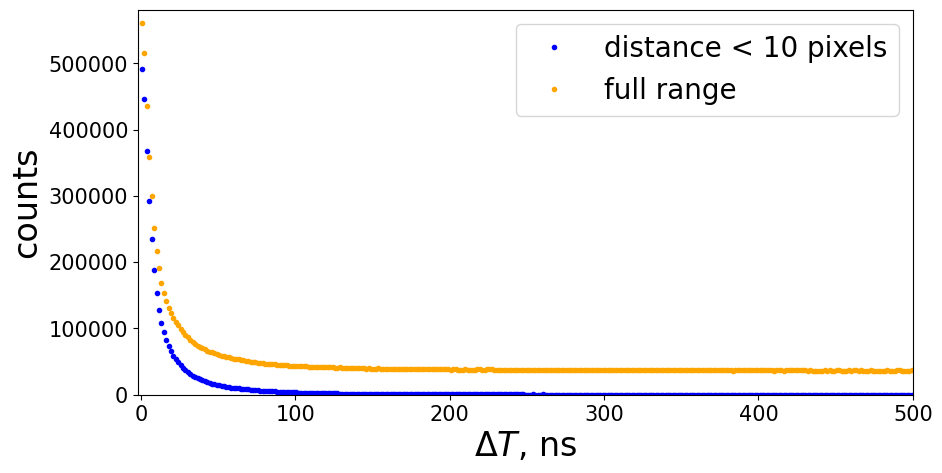
To characterize further the afterpulsing, we plot distributions of distance between successive hits and their separation in time, see Figure 4. There is an obvious excess for the small values in both distributions, which we estimate as deviations from the expected smooth behavior and interpret as afterpulses. We found that the fraction of afterpulsing events closer than 10 pixels is 1.6%. The right side of Figure 4 shows distributions of time differences between successive hits for two separate cases. The first case considers all distance values. The flat background in this case corresponds to the random coincidences between the dark count rate (DCR) hits. The second distribution considers time differences only for cases where the corresponding distance between successive hits is less than 10 pixels. It can be seen here that the distribution drops to very small values after about 100 ns with a fraction of events closer than 100 ns to be 1.4%. This is about the same number as obtained earlier for the spatial distribution.
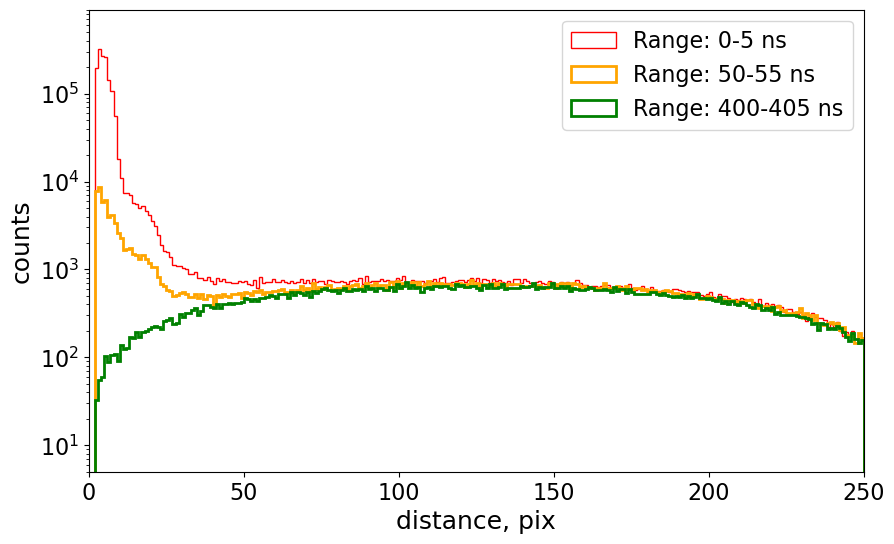
Figure 5 shows three different distributions of the distances between successive hits selected for various time difference bins. In all cases the bin width is 5 ns to maintain the same normalization at large distances, where the afterpulsing is not important. The peaks at small distance values are a result of afterpulsing and it can be seen that the peaks decrease as the time difference increases. We also note that the earliest hits in the 0 to 5 ns bin have a distribution, which is more peaked at 0 meaning smaller spatial separations between the parent hit and afterpulse in the electron phase of afterpulsing. For the last bin at 400 ns the afterpulsing is not visible confirming that the ion phase of afterpulsing ends at about 300 ns.
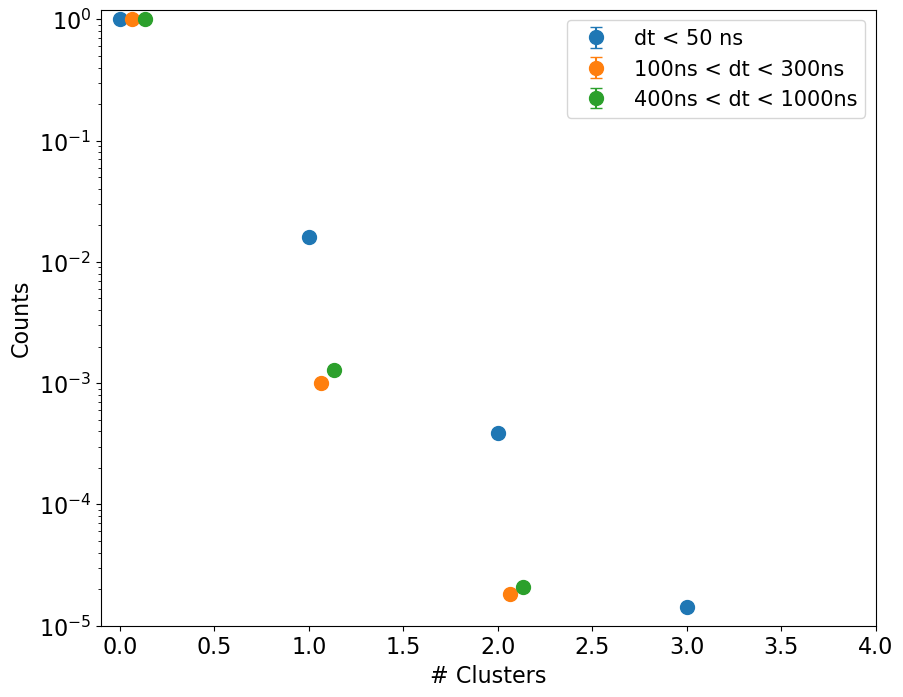
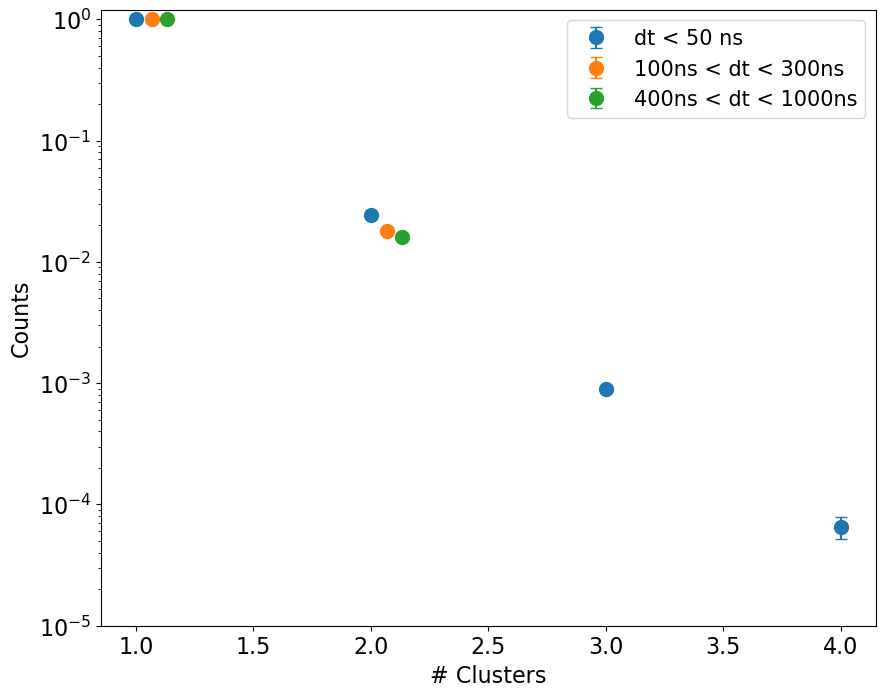
At last, we studied the multiplicity of afterpulses. The left plot in Figure 6 shows a distribution of number of clusters found after the primary pulse, normalized to the number of counts at zero, which corresponds to the case of no afterpulses. These distributions represent the number of clusters found within a 1000 ns time period after an initial cluster and within a predefined distance window, from 0 to 20 pixels. Again, it illustrates the fact that afterpulses are dominated by the hits close in time and space to the original parent hit. The right plot shows the same information but it starts at one so excluding zero hits and requiring presence of at least one afterpulse. These distributions show that there is no big difference in production of multiple afterpulses between different mechanisms, that would be distinguishable in the Tpx3Cam camera.
4 Conclusions
We studied the afterpulsing effect seen in the optical intensifiers using a fast data-driven camera, Tpx3Cam. We were able to clearly show afterpulsing present in the data at short time differences and distances from the primary pulse, as well as show the evolution of the afterpulsing effect with increasing time differences. We also studied the afterpulsing spatial distribution, which shows a considerable azimuthal asymmetry. We demonstrated different properties of afterpulsing for two different phases of this effect attributing them to either secondary electron or ion mechanism. Performance of the fast Tpx3Cam camera was the key element for the measurement, providing necessary temporal and spatial information about the afterpulses, which was necessary to distinguish different mechanism contributions.
The results of these studies provide useful insights for challenging measurements of photon coincidences with intensified cameras, which may also have spatial correlations. As an example we refer to the measurement of bunched photons due the HOM effect reported in [10] and note that the authors had to introduce a 28% correction to account for the afterpulsing, while the probability for a single photon to have an afterpulse, which would pass the analysis selections was 0.19%. We note that in this and all similar cases the afterpulsing effect can be evaluated by collecting independent datasets and by subtracting the afterpulsing contribution to the expected signal.
References
- [1] Giorgio Brida, Lucia Caspani, Alessandra Gatti, Marco Genovese, Alice Meda, and Ivano Ruo Berchera. Measurement of sub-shot-noise spatial correlations without background subtraction. Phys. Rev. Lett., 102:213602, May 2009.
- [2] Matthew Reichert, Xiaohang Sun, and Jason W. Fleischer. Quality of spatial entanglement propagation. Phys. Rev. A, 95:063836, Jun 2017.
- [3] Bradley M. Jost, Alexander V. Sergienko, Ayman F. Abouraddy, Bahaa E. A. Saleh, and Malvin C. Teich. Spatial correlations of spontaneously down-converted photon pairs detected with a single-photon-sensitive ccd camera. Opt. Express, 3(2):81–88, Jul 1998.
- [4] Michał Jachura and Radosław Chrapkiewicz. Shot-by-shot imaging of hong–ou–mandel interference with an intensified scmos camera. Opt. Lett., 40(7):1540–1543, Apr 2015.
- [5] Robert Fickler, Mario Krenn, Radek Lapkiewicz, Sven Ramelow, and Anton Zeilinger. Real-time imaging of quantum entanglement. Scientific Reports, 3:1914, May 2013.
- [6] Andrei Nomerotski. Imaging and time stamping of photons with nanosecond resolution in timepix based optical cameras. Nuclear Instruments and Methods in Physics Research Section A: Accelerators, Spectrometers, Detectors and Associated Equipment, 937:26–30, September 2019.
- [7] R. Hanbury Brown and R. Q. Twiss. A test of a new type of stellar interferometer on sirius. Nature, 178(4541):1046–1048, November 1956.
- [8] Richard Hanbury Brown. The Intensity Interferometer. Taylor & Francis, London, 1974.
- [9] C. Foellmi. Intensity interferometry and the second-order correlation function $g^(2)$ in astrophysics. Astronomy & Astrophysics, 507(3):1719–1727, September 2009.
- [10] Andrei Nomerotski, Dimitrios Katramatos, Paul Stankus, Peter Svihra, Guodong Cui, Sonali Gera, Mael Flament, and Eden Figueroa. Spatial and temporal characterization of polarization entanglement. International Journal of Quantum Information, 18(01):1941027, Feb 2020.
- [11] Yingwen Zhang, Duncan England, Andrei Nomerotski, and Benjamin Sussman. High speed imaging of spectral-temporal correlations in hong-ou-mandel interference. Optics Express, 29(18):28217, August 2021.
- [12] Liudmila A. Zhukas, Maverick J. Millican, Peter Svihra, Andrei Nomerotski, and Boris B. Blinov. Direct observation of ion micromotion in a linear paul trap. Physical Review A, 103(2), February 2021.
- [13] M. Fisher-Levine and A. Nomerotski. Timepixcam: a fast optical imager with time-stamping. Journal of Instrumentation, 11(03):C03016, 2016.
- [14] A. Zhao et al. Coincidence velocity map imaging using tpx3cam, a time stamping optical camera with 1.5 ns timing resolution. Review of Scientific Instruments, 88(9):113104, November 2017.
- [15] A. Nomerotski, M. Chekhlov, D. Dolzhenko, R. Glazenborg, B. Farella, M. Keach, R. Mahon, D. Orlov, and P. Svihra. Intensified tpx3cam, a fast data-driven optical camera with nanosecond timing resolution for single photon detection in quantum applications. Journal of Instrumentation, 18(01):C01023, January 2023.
- [16] www.amscins.com.
- [17] A. Nomerotski, I. Chakaberia, M. Fisher-Levine, Z. Janoska, P. Takacs, and T. Tsang. Characterization of timepixcam, a fast imager for the time-stamping of optical photons. Journal of Instrumentation, 12(01):C01017, 2017.
- [18] T. Poikela et al. Timepix3: a 65k channel hybrid pixel readout chip with simultaneous toa/tot and sparse readout. Journal of instrumentation, 9(05):C05013, 2014.
- [19] B. van der Heijden, J. Visser, M. van Beuzekom, H. Boterenbrood, S. Kulis, B. Munneke, and F. Schreuder. Spidr, a general-purpose readout system for pixel asics. Journal of instrumentation, 12(02):C02040, 2017.
- [20] https://www.photonis.com/product/hi-qe photocathodes.
- [21] B. Winter, S. J. King, M. Brouard, and C. Vallance. A fast microchannel plate-scintillator detector for velocity map imaging and imaging mass spectrometry. Review of Scientific Instruments, 85(2):023306, February 2014.
- [22] D.A. Orlov, J. DeFazio, S. Duarte Pinto, R. Glazenborg, and E. Kernen. High quantum efficiency s-20 photocathodes in photon counting detectors. Journal of Instrumentation, 11(04):C04015–C04015, April 2016.
- [23] D.A. Orlov, T. Ruardij, S. Duarte Pinto, R. Glazenborg, and E. Kernen. High collection efficiency MCPs for photon counting detectors. Journal of Instrumentation, 13(01):C01047–C01047, jan 2018.
- [24] Christopher Ianzano, Peter Svihra, Mael Flament, Andrew Hardy, Guodong Cui, Andrei Nomerotski, and Eden Figueroa. Fast camera spatial characterization of photonic polarization entanglement. Scientific Reports, 10(1), Apr 2020.
- [25] Yingwen Zhang, Duncan England, Andrei Nomerotski, Peter Svihra, Steven Ferrante, Paul Hockett, and Benjamin Sussman. Multidimensional quantum-enhanced target detection via spectrotemporal-correlation measurements. Phys. Rev. A, 101:053808, May 2020.
- [26] P. Svihra, Y. Zhang, P. Hockett, S. Ferrante, B. Sussman, D. England, and A. Nomerotski. Multivariate discrimination in quantum target detection. arXiv:2005.00612, May 2020.
- [27] A. Nomerotski, M. Keach, P. Stankus, P. Svihra, and S. Vintskevich. Counting of hong-ou-mandel bunched optical photons using a fast pixel camera. arXiv:2005.07982, May 2020.
- [28] Xiaoqin Gao, Yingwen Zhang, Alessio D’Errico, Khabat Heshami, and Ebrahim Karimi. High-speed imaging of spatiotemporal correlations in hong-ou-mandel interference. Optics Express, 30(11):19456, May 2022.
- [29] Liudmila A. Zhukas, Peter Svihra, Andrei Nomerotski, and Boris B. Blinov. High-fidelity simultaneous detection of a trapped-ion qubit register. Physical Review A, 103(6), June 2021.
- [30] Alexander Kato, Apurva Goel, Raymond Lee, Zeyu Ye, Samip Karki, Jian Jun Liu, Andrei Nomerotski, and Boris B. Blinov. Two-tone doppler cooling of radial two-dimensional crystals in a radio-frequency ion trap. Physical Review A, 105(2), February 2022.
- [31] Alexander Kato, Andrei Nomerotski, and Boris B. Blinov. Micromotion-synchronized pulsed doppler cooling of trapped ions. Physical Review A, 107(2), February 2023.
- [32] G. D'Amen, M. Keach, A. Nomerotski, P. Svihra, and A. Tricoli. Novel imaging technique for -particles using a fast optical camera. Journal of Instrumentation, 16(02):P02006–P02006, February 2021.
- [33] A. S. Losko, Y. Han, B. Schillinger, A. Tartaglione, M. Morgano, M. Strobl, J. Long, A. S. Tremsin, and M. Schulz. New perspectives for neutron imaging through advanced event-mode data acquisition. Scientific Reports, 11(1), 2021.
- [34] Jianqing Yang, Jianrong Zhou, Xingfen Jiang, Jinhao Tan, Lianjun Zhang, Jianjin Zhou, Xiaojuan Zhou, Wenqin Yang, Yuanguang Xia, Jie Chen, XinLi Sun, Quanhu Zhang, Jiang Li, Zhijia Sun, and Yuanbo Chen. A novel energy resolved neutron imaging detector based on a time stamping optical camera for the CSNS. Nuclear Instruments and Methods in Physics Research Section A: Accelerators, Spectrometers, Detectors and Associated Equipment, 1000:165222, June 2021.
- [35] Tianqi Gao, Gabriele D’Amen, Sergey Burdin, Mohammad Alsulimane, Paul Campbell, Cinzia Da Via, Andrei Nomerotski, Adam Roberts, Peter Svihra, Konstantinos Mavrokoridis, Jon Taylor, and Alessandro Tricoli. Novel imaging technique for thermal neutrons using a fast optical camera. Nuclear Instruments and Methods in Physics Research Section A: Accelerators, Spectrometers, Detectors and Associated Equipment, 1046:167604, January 2023.
- [36] A. Roberts, P. Svihra, A. Al-Refaie, H. Graafsma, J. Küpper, K. Majumdar, K. Mavrokoridis, A. Nomerotski, D. Pennicard, B. Philippou, S. Trippel, C. Touramanis, and J. Vann. First demonstration of 3d optical readout of a TPC using a single photon sensitive timepix3 based camera. Journal of Instrumentation, 14(06):P06001–P06001, June 2019.
- [37] Adam Lowe, Krishanu Majumdar, Konstantinos Mavrokoridis, Barney Philippou, Adam Roberts, Christos Touramanis, and Jared Vann. Optical readout of the ARIADNE LArTPC using a timepix3-based camera. Instruments, 4(4):35, November 2020.
- [38] Liisa M. Hirvonen, Merlin Fisher-Levine, Klaus Suhling, and Andrei Nomerotski. Photon counting phosphorescence lifetime imaging with TimepixCam. Review of Scientific Instruments, 88(1):013104, January 2017.
- [39] Rajannya Sen, Liisa M. Hirvonen, Alexander Zhdanov, Peter Svihra, Stefan Andersson-Engels, Andrei Nomerotski, and Dmitri Papkovsky. New luminescence lifetime macro-imager based on a tpx3cam optical camera. Biomed. Opt. Express, 11(1):77–88, Jan 2020.
- [40] Rajannya Sen, Alexander V. Zhdanov, Thomaz F. S. Bastiaanssen, Liisa M. Hirvonen, Peter Svihra, Patrick Fitzgerald, John F. Cryan, Stefan Andersson-Engels, Andrei Nomerotski, and Dmitri B. Papkovsky. Mapping o2 concentration in ex-vivo tissue samples on a fast PLIM macro-imager. Scientific Reports, 10(1), November 2020.
- [41] D. Turecek, J. Jakubek, and P. Soukup. USB 3.0 readout and time-walk correction method for timepix3 detector. Journal of Instrumentation, 11(12):C12065–C12065, Dec 2016.
- [42] D. A. Orlov, R. Glazenborg, R. Ortega, and E. Kernen. Uv/visible high-sensitivity mcp-pmt single-photon ghz counting detector for long-range lidar instrumentations. CEAS Space Journal, 11(4):405–411, Dec 2019.