Cluster formation near midrapidity - can the mechanism be identified experimentally?
Abstract
The formation of weakly bound clusters in the hot and dense environment at midrapidity is one of the surprising phenomena observed experimentally in heavy-ion collisions from a low center of mass energy of a few GeV up to a ultra-relativistic energy of several TeV. Three approaches have been advanced to describe the cluster formation: coalescence at kinetic freeze-out, cluster formation during the entire heavy-ion collision by potential interaction between nucleons and deuteron production by hadronic reactions. We identify experimental observables, which can discriminate these production mechanisms for deuterons.
pacs:
12.38MhI Introduction
The observation of light clusters at midrapidity Adam et al. (2016); Acharya et al. (2017) was one of the biggest surprises of the heavy ion experiments at ultra-relativistic energies. At midrapidity the transverse energy spectra of all hadrons have slopes of more than 100 MeV and point towards a very hot interaction region. Simulations of these reactions by transport and hydrodynamic models predict energy densities of well above 1 and hence a very dense interaction zone. In such an environment it is difficult to understand how loosely bound objects like d and t, with binding energies in the one MeV region, can survive. The thermal momentum of possible interaction partners would be sufficient to destroy them. This observation has been named “ice in the fire puzzle”.
It was even more surprising that in ultra-relativistic heavy-ion collisions the multiplicity of these clusters follows, without exception, the prediction of the statistical model if the same value of the temperature as for all the other hadrons is employed Andronic et al. (2011). The statistical model predicts the multiplicity of hadrons at chemical freeze-out and hence before the final state interactions among the hadrons which continue until the kinetic freeze-out. Taken for granted that the prediction of the cluster multiplicity by statistical model calculations is not a pure accident, one has to understand how it is possible that clusters survive the hadronic expansion from chemical to kinetic freeze out.
II kinetic models for deuteron production
The observation of these light clusters has also renewed the general theoretical interest in cluster production in heavy ion reactions. Besides the statistical model three approaches have been advanced:
Coalescence approach (cf. Butler and Pearson (1963); Sun et al. (2018); Kittiratpattana
et al. (2022)
and reference therein).
The coalescence mechanism is mostly used for deuteron production and assumes that clusters are formed at kinetic freeze-out, i.e. after the hadronic expansion phase, when the last of the two constituents of the deuteron had its last hadronic collisions.
If at that time a fellow nucleon with the right charge is in the coalescence radius in coordinate and momentum space, the two nucleons are considered as a deuteron. The radii are determined by a fit of the experimental multiplicities. Another variance of the coalescence model uses the Wigner density of the deuteron to determine the coalescence probability Scheibl and Heinz (1999); Zhu et al. (2015). The model can be extended to larger clusters, however the number of parameters, necessary to determine larger clusters, increases fast.
Cluster by potential interactions among nucleons Aichelin (1991); Aichelin et al. (2020); Gläßel et al. (2022).
The potential interaction of nucleons during the hadronic phase creates bound clusters of any size whose multiplicity depends on the details of the expansion of the hot interaction zone and its composition. This dynamical formation of clusters by potential interactions of nucleons can be modeled by propagating the n-body phase space density as done in the quantum molecular dynamics (QMD) approach.
Clusters are not suddenly produced but identified during the dynamical evolution of the system by the advanced Minimum Spanning Tree (aMST) procedure, explained in Ref. Aichelin et al. (2020).
We stress that MST is a cluster recognition procedure, not a “cluster building” mechanism, since the QMD transport approach propagates baryons, not clusters.
Cluster production by collisions Oliinychenko et al. (2019, 2021); Staudenmaier et al. (2021); Coci et al. (2023)
Light clusters - as deuterons - can be produced by inelastic reactions of hadrons like and with a pion or a nucleon as a “catalyst” during hadronic phase of heavy-ion collisions. They are called ‘kinetic’ deuterons.
In the first application of this ‘kinetic’ mechanism in the transport model SMASH, the three-body reactions have been replaced by two two-body collisions with an intermediate fictitious dibaryon resonance Oliinychenko et al. (2019). In the meantime the three-body entrance channel has been modeled directly employing detailed balance to the experimentally measured Staudenmaier et al. (2021) inverse and scattering.
In our recent work Coci et al. (2023) we extend the study of Ref. Staudenmaier et al. (2021) by implementing all isospin channels for pion induced reactions in the microscopic Parton-Hadron-Quantum Molecular approach (PHQMD) Aichelin et al. (2020) as well as deuteron finite size effects. In the ‘kinetic’ approach deuteron production and destruction is possible during the whole hadronic expansion of the hot interaction zone but calculations show that only the later produced cluster survive.
In all three approaches the transverse momentum distribution of clusters has been calculated (cf. Oliinychenko et al. (2019); Staudenmaier et al. (2021); Kireyeu et al. (2022); Gläßel et al. (2022); Coci et al. (2023)). The comparison with the experimental spectra in a wide energy range - from center-of-mass energies between 2.5 GeV to several TeV - shows for all approaches a reasonable agreement despite of the fact that deuterons are produced very differently: i) at different times: in the coalescence model deuterons are produced at freeze-out while in the other models they are created by interactions during the hadronic expansion phase; ii) according to different criteria: by phase-space correlations of nucleons at freeze-out in the coalescence scenario, by space correlations of nucleons with the condition that they are bound in the potential scenario, where in both approaches the deuteron is an extended object, by hadronic collisions where the deuterons are approximated as point like particles.
III Results
This situation that several theoretical models for cluster production, based on different assumptions, describe the same experimental data is enigmatic and unsatisfying. To understand the production of these clusters it is, therefore, desirable to explore whether there are experimental observables, which can discriminate between the different approaches. This is the goal of this article. To make this possible we have developed the PHQMD approach further. It allows now to realize all three mechanisms for deuteron production, ‘coalescence’ deuterons, ‘potential’ deuterons and ‘collisional’ deuterons, in the same transport approach. This allows to study the three different production mechanisms in an otherwise identical environment. We have made sure that PHQMD in the coalescence option agrees with the previous coalescence calculations Kireyeu et al. (2022) - where we compared the coalescence and MST mechanisms implemented in the PHQMD and UrQMD transport approaches - and that for the ‘collisional’ option the results agree with that of Ref. Coci et al. (2023). We name coalescence, potential and collisional nucleons those, which are part of a deuteron, which has been identified by one of the three methods.
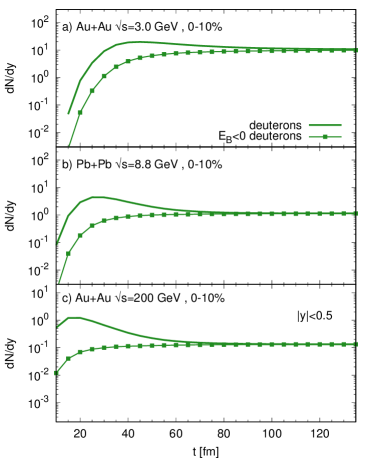
We start out with the time evolution of the clusters. The time evolution of the midrapidity multiplicity of bound deuterons and of all ‘deuterons’ (bound and unbound) in the ‘potential’ production mechanism is shown in Fig. 1 for central Au+Au collisions at three different beam energies. The deuterons are identified by MST as two nucleons with a distance , the range of the potential, under the condition that no other baryon has a distance smaller than 4 fm to one of the two nucleons. As seen in Fig. 1, the total number of deuterons (solid line) - identified by MST - grows with time and then decreases because only bound clusters survive asymptotically (the solid line with filled squares) Gläßel et al. (2022). The nucleons in unbound deuterons separate due to their momentum difference and it is just a question of time when their distance gets larger than 4 fm, the limit that the nucleons are considered as a cluster. Freeze-out takes place around 25 fm/c at = 2.52 GeV and decreases slightly with energy Gläßel et al. (2022). Roughly at that time it is determined in the coalescence model whether two nucleons form a deuteron. We see here that at this time the number of MST ‘deuterons’ (solid line) is larger than for . Most of the MST ‘deuterons’ at freeze-out are ‘unbound’ and the nucleons separate from each other during the further propagation.
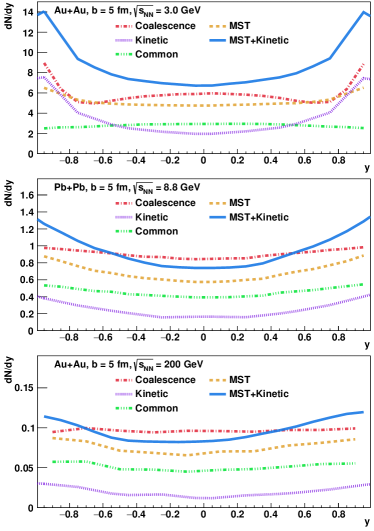
The rapidity distributions of deuterons are presented in Fig. 2 for the same center-of-mass energies as the multiplicities in Fig. 1. The orange dashed lines show the results for potential deuterons with (aMST), the dash-dotted red lines stand for the deuterons found in the coalescence approach. For the coalescence radii we used the values of Ref. Kireyeu et al. (2022): fm and MeV. These radii have been fitted to data in order to reproduce the deuteron multiplicity if a spin degeneracy factor of 3/8 Kireyeu et al. (2022) is applied. The multiplicity of ‘coalescence’ deuterons, which are formed at freeze-out, is much larger than that of the final (bound) ‘potential’ deuterons. This can been inferred from Fig. 1, which shows that the number of all ‘potential’ deuterons at that time is larger than the asymptotic yield. Therefore, if we apply the PHQMD nucleon-nucleon potential most of the ‘coalescence’ deuterons are unbound. The lines for ‘coalescence’ deuterons, presented in Fig. 2, show the number of nucleon pairs, which fulfil the coalescence criteria, multiplied by the factor 3/8. Furthermore, the dotted purple lines present the rapidity distribution of the ‘kinetic’ deuterons, which are much suppressed in PHQMD by including finite-size effects in coordinate and momentum space by two conditions - an excluded volume (no surrounding particle in the radius of deuterons) and momentum projection of nucleons forming a deuteron onto the deuteron wave function Coci et al. (2023). The solid blue lines represents the sum of the potential deuterons with and ‘kinetic’ deuterons. Finally, the green dash triple-dot lines indicate the rapidity distribution of ‘potential’ deuterons, identified by the aMST, which are simultaneously ‘coalescence’ deuterons. We observe that at midrapidity only about 20% of the MST deuterons are also identified as deuterons in the coalescence approach - before multiplication of coalescence results by the factor 3/8. Because potential deuterons and coalescence deuterons are composed of different nucleons we may expect to see differences in the observables. Indeed, the rapidity distribution of deuterons is rather different for the different approaches. At low energy the rapidity distribution of coalescence deuterons is concave and shows a maximum at midrapidity, which flattens out for higher energies, whereas potential deuterons have a rather flat distribution at low energy developing a convex form around midrapidity at higher energies.
From Fig. 2 we see that for determining experimentally the production mechanism one has to measure experimentally the ratio for the lowest energy and the ratio for the higher energies with a high enough precision, which is, however experimentally achievable. For this ratio we obtain 1.25 for and 1.5 for the reactions at higher energies. This precision has almost been obtained in the NA49 experiment Anticic et al. (2016) and will be achievable with more modern detectors. In Anticic et al. (2016) the rapidity distribution of deuteron is convex around midrapidity.
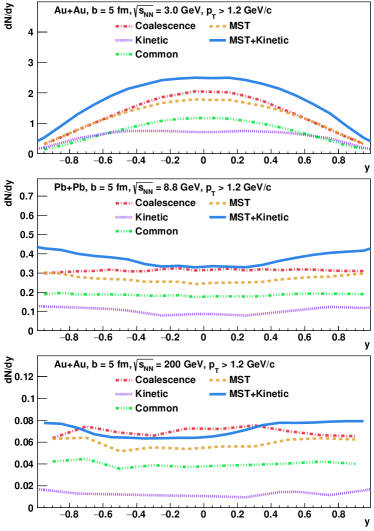
Fig. 3 shows the same rapidity distributions of deuterons as Fig. 2 but with the transverse momentum cut GeV/c in line with the present STAR acceptance. As seen in Fig. 3, a cut can change the form of the rapidity distributions at both, low and high energies. Thus, the measurement of low deuterons is necessary to identify the production mechanism.
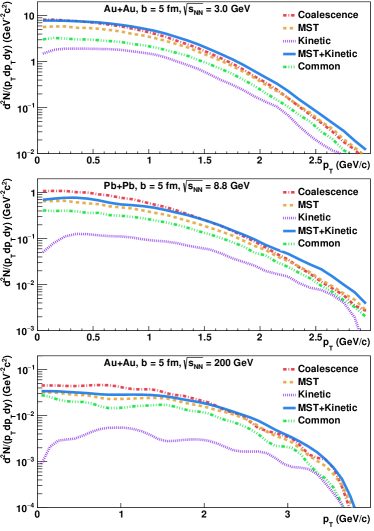
Is this distinction also true for other observables? In Fig. 4 we display the transverse momentum distribution of the deuterons for the same three energies. The color coding is the same as in Fig. 2. We observe that the distribution of ‘coalescence’ and ‘potential’ deuterons agree at large for the two lower energies, however, at small the spectra differ. This means that the clusters, which are produced by coalescence but which are not bound at the end (and therefore do not appear as ‘potential’ deuterons), are concentrated at low . This can also be inferred from Figs. 2 and 3. Thus, as said, one has to measure the spectra to low momentum in order to identify the deuteron production mechanism.
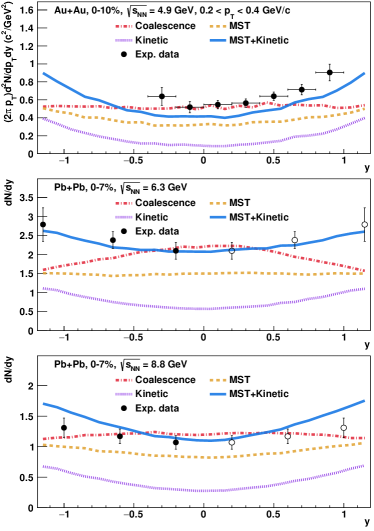
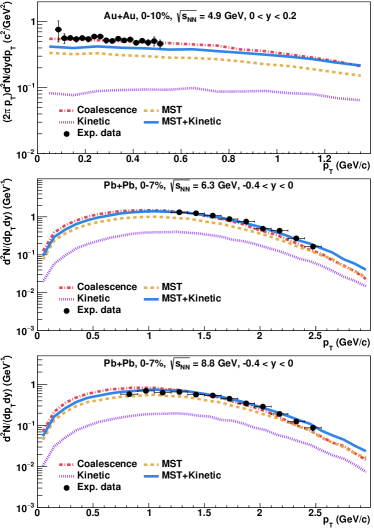
One may ask the question whether the presently available data in the interesting region are already sufficient to identify the production mechanism for deuterons. To address this question we show in Figs. 5 and 6 the PHQMD calculations for the different scenarios in comparison to the experimental rapidity and transverse momentum distributions of deuterons for the 10% most central Au+Au collisions at AGeV ( GeV) from the E864 Collaboration Armstrong et al. (2000) and for the 7% most central Pb+Pb collisions from the NA49 Collaboration Anticic et al. (2016) for and 40 AGeV.
We note that the experimental rapidity spectra are obtained by the integration of the spectra for different rapidity bins, which requires the extrapolation of the measured distributions to the low region, which is difficult to measure in experiments. This extrapolation is usually done with a blast-wave fit. The slope of the spectra at low might differ from the blast-wave fit and, therefore, this extrapolation procedure introduces uncertainties in the integrated distributions.
As follows from Fig. 6, in the measured range the NA49 transverse momentum spectra are nicely reproduced in the coalescence as well as in the MST + kinetic scenario. However, the coalescence spectra are slightly softer compared to the MST + kinetic spectra. The difference in the rapidity distributions in Fig. 5 - obtained by the integrated yield - comes from the low region, where experimental data are not available. Nevertheless, the shape of the extrapolated NA49 experimental spectra is more in favour to the MST + kinetic scenario for the both bombarding energies, 20 and 40 AGeV.
In the E864 experiment the low spectra has been precisely measured but, as shown in Ref. Coci et al. (2023), the MST + kinetic scenario under-predicts the deuteron yield by about 15% in all rapidity intervals. However, from the E864 data one may conclude with all caution that the presently available data favour a MST + kinetic scenario for deuteron production. More precise low deuteron data are certainly necessary to confirm this conclusion. It is also evident that a sufficient experimental precision is in reach.
Furthermore, we have studied collective variables as the directed flow, , and the elliptic flow, , which are the first two coefficients of the Fourier series of the azimuthal angular distribution, as a function of the rapidity. All three approaches provide rather similar results for these observables, which, therefore, may be not well suited to discriminate between the models for deuterons production.
IV Conclusions
We have investigated three approaches for deuteron production - coalescence, ‘potential and ‘kinetic’ mechanisms, which have been advanced to explain the finite cluster yield at midrapidity, observed in ultra-relativistic heavy ion collisions.
We have found that there are observables, which are sensitive to the deuteron production mechanism: the rapidity distribution has a different form and the transverse momentum distribution has a different slope at low . These differences are large enough to be measurable and will allow, therefore, for discriminating between the different mechanisms for deuteron production when confronting these results with data. Knowing the mechanism we can also identify how deuterons survive the hot and dense medium created at midrapidity of heavy-ion collisions and solve the ‘ice in the fire’ puzzle.
The analysis of the presently available data points tentatively to the MST + kinetic scenario but further experimental efforts are necessary to establish this mechanism.
Acknowledgements: The authors acknowledge inspiring discussions with M. Bleicher, V. Kolesnikov, J. Steinheimer, Io. Vassiliev, V. Voronyuk and N. Xu as well as the support by the Deutsche Forschungsgemeinschaft (DFG, German Research Foundation), by the GSI-IN2P3 agreement under contract number 13-70. This study is part of a project that has received funding from the European Union’s Horizon 2020 research and innovation program under grant agreement STRONG–2020 – No 824093. V. Kireyeu acknowledge the support by the JINR young scientists grant 23-102-04.
References
- Adam et al. (2016) J. Adam et al. (ALICE), Phys. Rev. C 93, 024917 (2016), eprint 1506.08951.
- Acharya et al. (2017) S. Acharya et al. (ALICE), Eur. Phys. J. C 77, 658 (2017), eprint 1707.07304.
- Andronic et al. (2011) A. Andronic, P. Braun-Munzinger, J. Stachel, and H. Stocker, Phys. Lett. B 697, 203 (2011), eprint 1010.2995.
- Butler and Pearson (1963) S. T. Butler and C. A. Pearson, Phys. Rev. 129, 836 (1963).
- Sun et al. (2018) K.-J. Sun, L.-W. Chen, C. M. Ko, J. Pu, and Z. Xu, Phys. Lett. B 781, 499 (2018), eprint 1801.09382.
- Kittiratpattana et al. (2022) A. Kittiratpattana, T. Reichert, J. Steinheimer, C. Herold, A. Limphirat, Y. Yan, and M. Bleicher, Phys. Rev. C 106, 044905 (2022), eprint 2206.01625.
- Scheibl and Heinz (1999) R. Scheibl and U. W. Heinz, Phys. Rev. C 59, 1585 (1999), eprint nucl-th/9809092.
- Zhu et al. (2015) L. Zhu, C. M. Ko, and X. Yin, Phys. Rev. C 92, 064911 (2015), eprint 1510.03568.
- Aichelin (1991) J. Aichelin, Phys. Rept. 202, 233 (1991).
- Aichelin et al. (2020) J. Aichelin, E. Bratkovskaya, A. Le Fèvre, V. Kireyeu, V. Kolesnikov, Y. Leifels, V. Voronyuk, and G. Coci, Phys. Rev. C 101, 044905 (2020), eprint 1907.03860.
- Gläßel et al. (2022) S. Gläßel, V. Kireyeu, V. Voronyuk, J. Aichelin, C. Blume, E. Bratkovskaya, G. Coci, V. Kolesnikov, and M. Winn, Phys. Rev. C 105, 014908 (2022), eprint 2106.14839.
- Oliinychenko et al. (2019) D. Oliinychenko, L.-G. Pang, H. Elfner, and V. Koch, Phys. Rev. C 99, 044907 (2019), eprint 1809.03071.
- Oliinychenko et al. (2021) D. Oliinychenko, C. Shen, and V. Koch, Phys. Rev. C 103, 034913 (2021), eprint 2009.01915.
- Staudenmaier et al. (2021) J. Staudenmaier, D. Oliinychenko, J. M. Torres-Rincon, and H. Elfner, Phys. Rev. C 104, 034908 (2021), eprint 2106.14287.
- Coci et al. (2023) G. Coci, S. Gläßel, V. Kireyeu, J. Aichelin, C. Blume, E. Bratkovskaya, V. Kolesnikov, and V. Voronyuk, Phys. Rev. C 108, 014902 (2023), eprint 2303.02279.
- Kireyeu et al. (2022) V. Kireyeu, J. Steinheimer, J. Aichelin, M. Bleicher, and E. Bratkovskaya, Phys. Rev. C 105, 044909 (2022), eprint 2201.13374.
- Armstrong et al. (2000) T. A. Armstrong et al. (E864), Phys. Rev. C 61, 064908 (2000), eprint nucl-ex/0003009.
- Anticic et al. (2016) T. Anticic et al. (NA49), Phys. Rev. C 94, 044906 (2016), eprint 1606.04234.