Confirmation of the standard cosmological model from red massive galaxies Myr after the Big Bang
Abstract
ARISING FROM I. Labbé, P. van Dokkum, E. Nelson, R. Bezanson, K.A. Suess, J. Leja, G. Brammer, K. Whitaker, E. Mathews, M. Stefanon & B. Wang. Nature 616, 266 (2023)
MAIN TEXT
In their recent study, Labbé et al. [1] used multi-band infrared images captured by the James Webb Space Telescope (JWST) to discover a population of red massive galaxies that formed approximately 600 million years after the Big Bang. The authors reported an extraordinarily large density of these galaxies, with stellar masses exceeding solar masses, which, if confirmed, challenges the standard cosmological model as suggested by recent studies[2, 3]. However, this conclusion is disputed. We contend that during the early epochs of the universe the stellar mass-to-light ratio could not have reached the values reported by Labbé et al. A model of galaxy formation based on standard cosmology provides support for this hypothesis, predicting the formation of massive galaxies with higher ultraviolet (UV) luminosity, which produce several hundred solar masses of stars per year and containing significant dust. These forecasts are consistent with the abundance of JWST/HST galaxies selected photometrically in the rest-frame UV wavelengths and with the properties of the recent spectroscopically-confirmed JWST/HST galaxies formed during that era. Discrepancies with Labbé et al. may arise from overestimation of the stellar masses, systematic uncertainties, absence of JWST/MIRI data[4], heavy dust extinction affecting UV luminosities, or misidentification of faint red AGN galaxies at closer redshifts[1]. The current JWST/HST results, combined with a realistic galaxy formation model, provide strong confirmation of the standard cosmology.
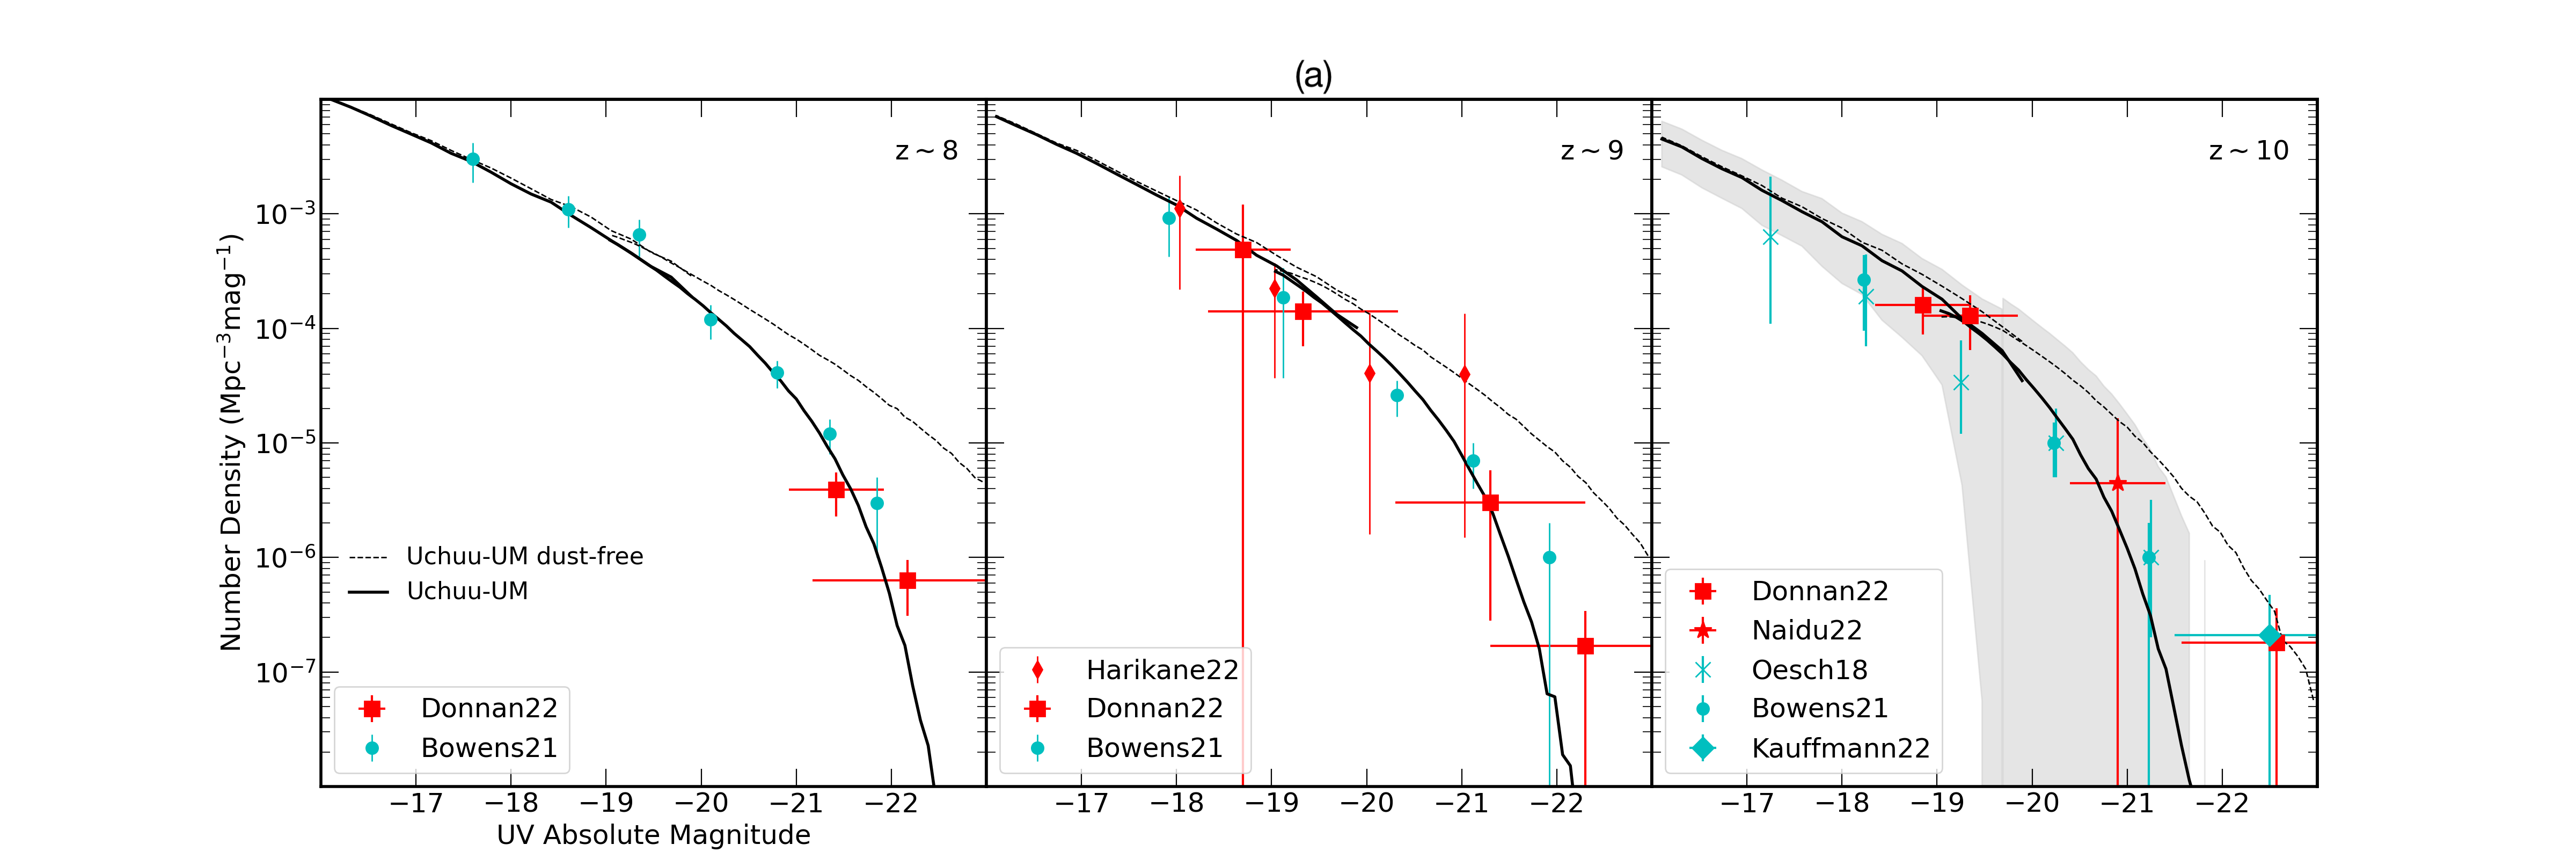
Fig. 1a shows the rest-frame UV luminosity function at , 9, and 10, derived from galaxy samples selected photometrically in the rest-frame UV. Red symbols represent the latest measurements from the JWST[5, 6, 7], while cyan symbols show those from the Hubble Space Telescope (HST)[8, 9, 10]. We also show theoretical results based on well-tested and widely-used combination of cosmological body simulations with a galaxy formation algorithm that produces simulated galaxies [12, 13]. Mock galaxy catalogues generated by this approach are called Uchuu-UM. Solid lines indicate the luminosity functions obtained from our Uchuu-UM galaxy catalogues, while dashed lines are for the same galaxies with no internal dust extinction. The shaded region, only shown at as a reference, represents the uncertainty due to cosmic variance considering the observed JWST volume at these redshifts. The Uchuu-UM model accurately reproduces the observed JWST and HST UV luminosity functions over a range of five UV absolute magnitudes.
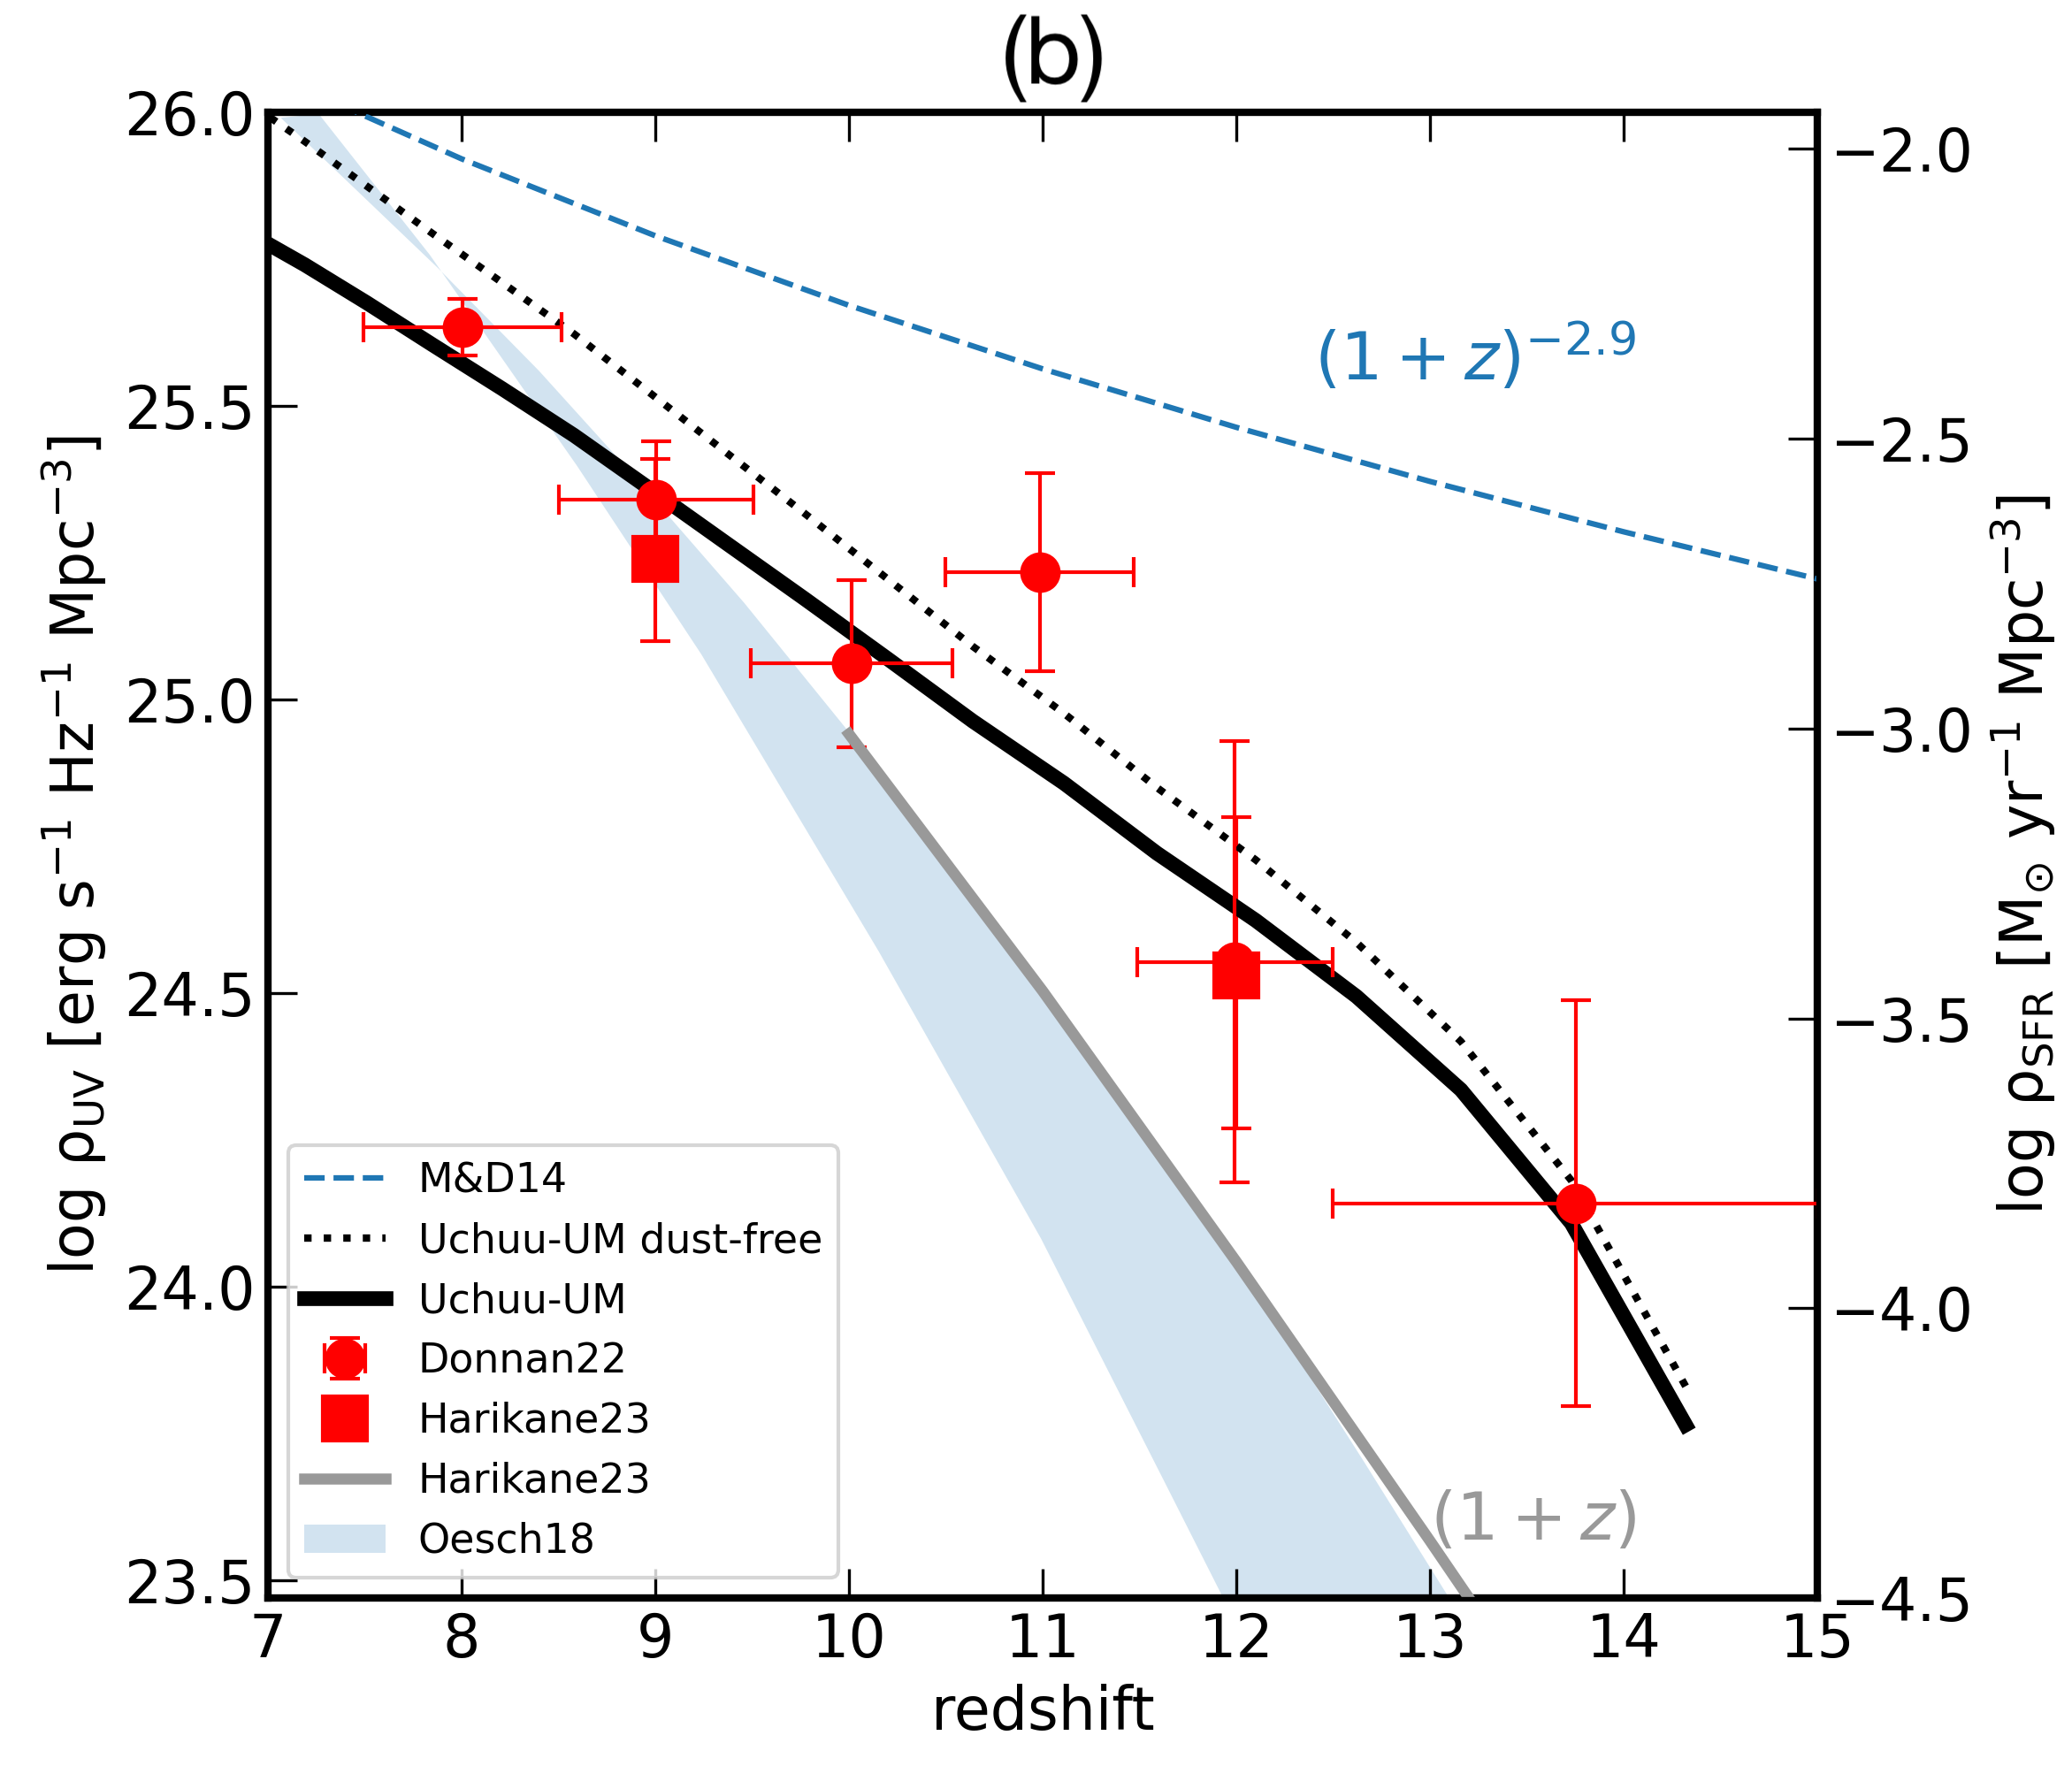
Fig. 1b shows the evolution of the cosmic UV luminosity and SFR density in galaxies integrated down to . Recent measurements with JWST are denoted by red symbols[6, 7]. The solid black line shows the results from Uchuu-UM catalogues; the dotted line is the same without internal dust extinction. The shaded cyan region depicts the halo evolution model from Oesch et al.[8], which predicts a rapid decline in density at . The extrapolated best-fit by Madau & Dickinson[11] and the constant star-formation efficiency model from Harikane et al[7] are also shown as a reference. Our Uchuu-UM model is in good agreement with the evolution of UV/SFR density determined from JWST over the redshift range .
The Uchuu-UM galaxy catalogues used in this analysis were generated by applying the UniverseMachine[12] to assign galaxies to the dark matter halos in Shin-Uchuu and Uchuu1000-PL18 -body simulations[13]. The UniverseMachine is a self-consistent empirical model that parameterises the galaxy SFR as a function of its host dark matter halo mass, mass accretion rate, and redshift. UniverseMachine was developed to accurately predict realistic global properties for individual high-redshift galaxies as observed by JWST[14], including UV luminosity, stellar mass, SFR, and dust extinction. Additionally, the model incorporates the evolution in the galaxy-halo relationship. Our galaxy catalogues cover redshifts from to 20. We use the same Planck cosmology for both simulations, with particle masses of M⊙ for Shin-Uchuu and M⊙ for UchuuPL18, and box sizes of 140 Mpc and 1000 Mpc, respectively.
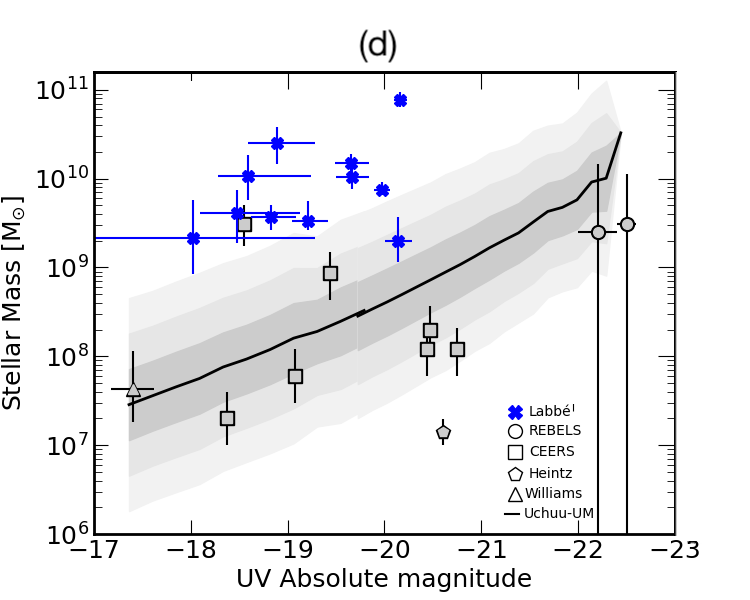
We validate Uchuu-UM predictions by comparing them with nine galaxies detected with JWST[15, 16, 17] and two galaxies with HST [18]. These galaxies have measured spectra and span the redshift range of . The weighted mean for the SFR - stellar mass relation of Uchuu-UM galaxies brighter than at (individual galaxies are color-coded by its dust extinction AUV) agrees with the available sample of spectroscopically-confirmed JWST/HST galaxies (each symbol is colored according to the corresponding AUV obtained from the galaxy spectra), see Fig. 1c. Uchuu-UM also provides a good explanation for the relationship between stellar mass and UV luminosity observed for those galaxies as shown in Fig. 1d. However, the eleven red massive galaxies in Labbé et al., denoted by blue cross symbols, exhibit anomalous properties, with an average stellar mass 50 times greater for their corresponding UV luminosities, resulting in a significantly higher mass-to-light ratio at this epoch. These galaxies show a significant deviation from the scatter of the Uchuu-UM galaxies, Fig. 1d. Labbé et al. considered the possibility of overestimated fiducial masses by factors of due to faint red AGN. Recent findings[4] indicate that adding JWST-MIRI data reduces the derived stellar mass by 0.4 dex for most high-redshift galaxies. On the other hand, if we accept their stellar mass estimates, these galaxies likely suffer from significant dust extinction, requiring their intrinsic UV luminosities to be 15-40 times larger than observed, in order to reconcile with the stellar mass - UV luminosity relation shown in Fig. 1d.
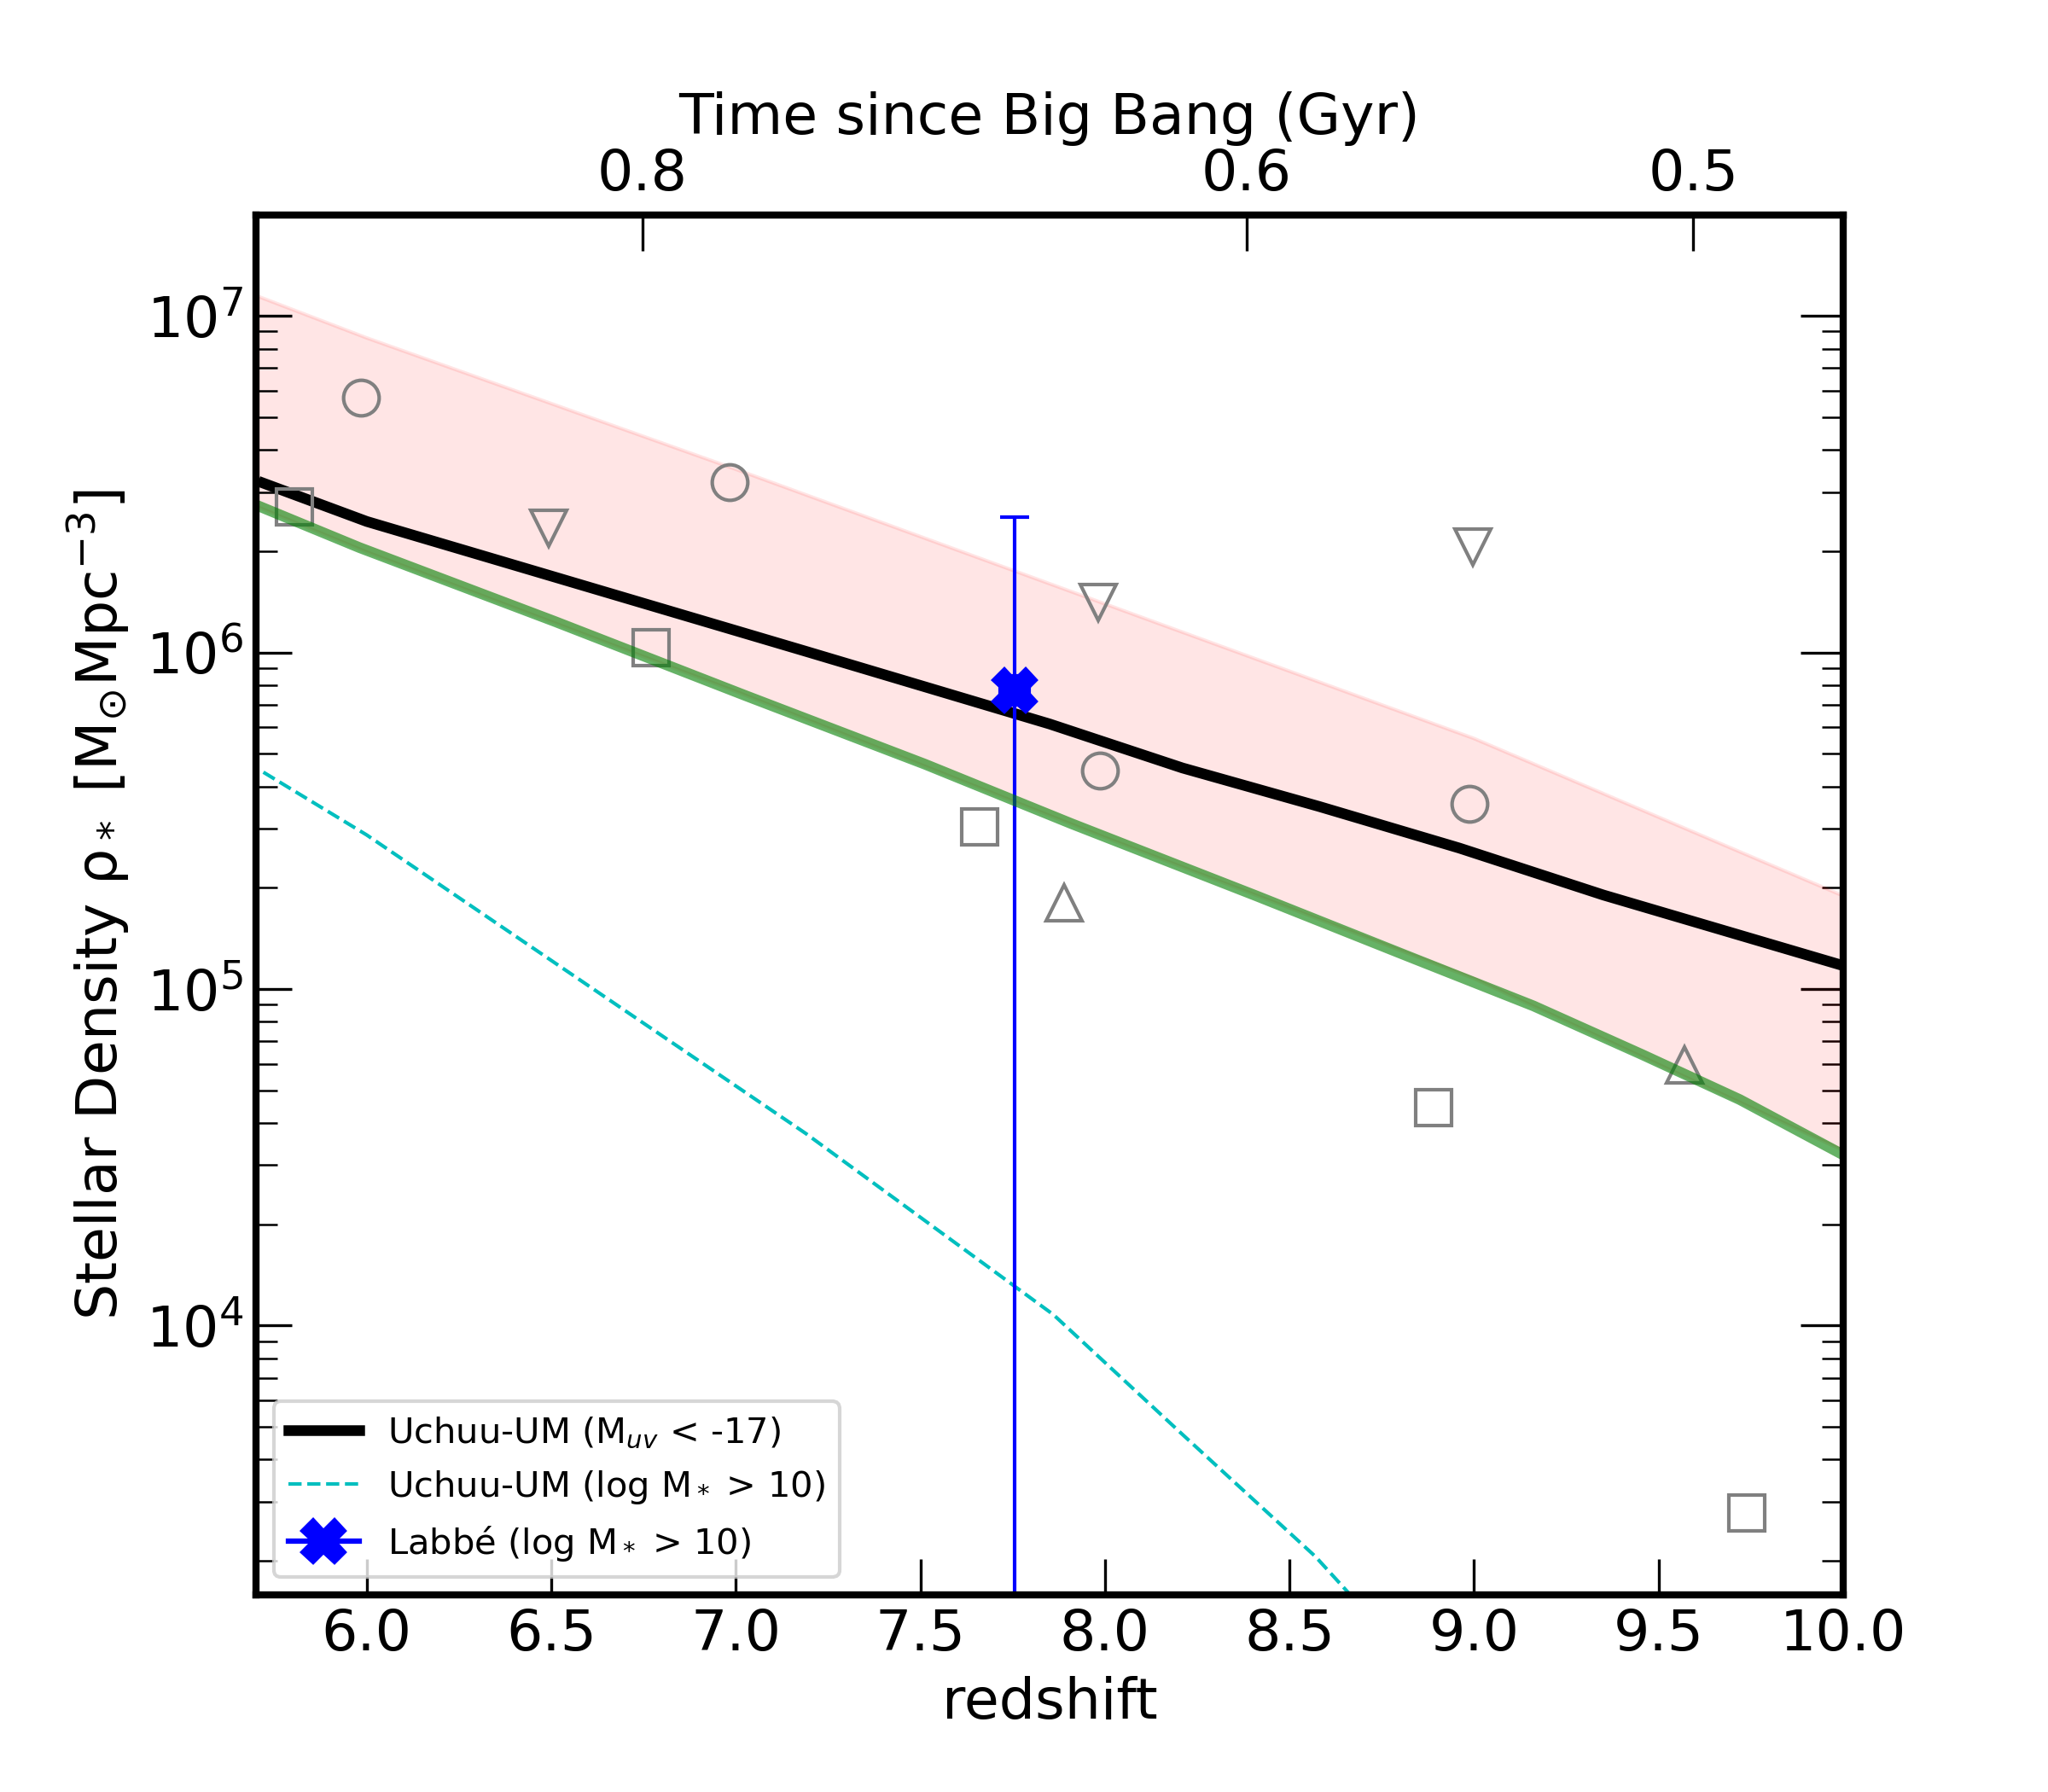
Fig. 2 depicts the cosmic evolution of stellar-mass density, with the black line representing the Uchuu-UM prediction for galaxies brighter than (equivalent to a few times solar masses) over the redshift range . This prediction is in agreement with recent measurements compiled by Papovich et al.[4] (gray open symbols) and with the maximally allowable density assuming that galaxies experience a burst at followed by normal star formation (shaded region), as reported in their work. The green line indicates the empirical model of Finkelstein (2016), corrected by Papovich et al. when JWST/MIRI data constrain the stellar masses. Additionally, we compare Labbé et al.’s estimate of the stellar-mass density for galaxies above solar masses (blue cross, with systematic errors estimated from their Table 2) to the Uchuu-UM prediction for masses above solar masses (cyan dashed line). Notably, the Labbé et al. estimate is two orders of magnitude larger than the expected value at .
Labbé et al. results, if correct, pose a challenge to the standard cosmology. According to Boylan-Kolchin [2] they would imply near 100% efficiency of converting “normal” gas to stars. Another “explanation” would be that Labbé et al. galaxies are extremely rare events [3]. None of those extreme assumptions are required if we assume recent JWST measurements as indicated in Figs. 1 and 2. Indeed, the efficiency of star formation in Uchuu-UM is , typical for galaxies such as our Milky Way. There is no need to resort to extreme values statistics either: observed galaxies at high redshifts are typical objects.
The strikingly large stellar-mass density observed in galaxies with stellar masses exceeding solar masses at , as reported by Labbé et al., is a crucial point of conflict with the standard galaxy formation model. Our claims presented in this matters arising research note add weight to the presence of potential systematic errors in Labbé et al.
References
- [1] Labbé, I. et al. A population of red candidate massive galaxies Myr after the Big Bang. Nature 616, 266 (2023). arXiv:2207.12446.
- [2] Boylan-Kolchin, M. Stress Testing CDM with High-redshift Galaxy Candidates. Accepted for publication in Nature Astronomy (2023). arXiv:2208.01611.
- [3] Lovell, C. C. et al. Extreme value statistics of the halo and stellar mass distributions at high redshift: are JWST results in tension with CDM? MNRAS 518, 2511 (2023). arXiv:2208.10479.
- [4] Papovich, C. et al. CEERS Key Paper IV: Galaxies at are Bluer than They Appear – Characterizing Galaxy Stellar Populations from Rest-Frame micron Imaging. Accepted for publication in ApJ (2023). arXiv:2301.00027.
- [5] Naidu, R. P. et al. Two Remarkably Luminous Galaxy Candidates at z 10-12 Revealed by JWST. ApJ 940, L14 (2022). arXiv:2207.09434.
- [6] Donnan, C. T. et al. The evolution of the galaxy UV luminosity function at redshifts from deep JWST and ground-based near-infrared imaging. MNRAS 518, 6011 (2023). arXiv:2207.12356.
- [7] Harikane, Y. et al. A Comprehensive Study of Galaxies at Found in the Early JWST Data: Ultraviolet Luminosity Functions and Cosmic Star Formation History at the Pre-Reionization Epoch. ApJS 265, 5 (2023). arXiv:2208.01612.
- [8] Oesch, P. A. et al. The Dearth of z 10 Galaxies in All HST Legacy Fields —The Rapid Evolution of the Galaxy Population in the First 500 Myr. ApJ 855, 105 (2018). arXiv:1710.11131.
- [9] Bouwens, R. J. et al. New Determinations of the UV Luminosity Functions from to Show a Remarkable Consistency with Halo Growth and a Constant Star Formation Efficiency. AJ 162, 47 (2021). arXiv:2102.07775.
- [10] Kauffmann, R. J. et al. COSMOS2020: UV-selected galaxies at z 7.5. A&A 667, A65 (2022). arXiv:2207.11740.
- [11] Madau, P. & Dickinson, M. Cosmic Star-Formation History. ARA&A 52, 415 (2014). arXiv:1403.0007.
- [12] Behroozi, P. et al. UNIVERSEMACHINE: The correlation between galaxy growth and dark matter halo assembly from . MNRAS 488, 3143 (2019). arXiv:1806.07893.
- [13] Ishiyama, T. et al. The Uchuu simulations: Data Release 1 and dark matter halo concentrations. MNRAS 506, 4210 (2021). arXiv:2007.14720.
- [14] Behroozi, P. et al. The Universe at : predictions for JWST from the UNIVERSEMACHINE DR1. MNRAS 499, 5702 (2020). arXiv:2007.04988.
- [15] Heintz, K. E. et al. The Gas and Stellar Content of a Metal-poor Galaxy at z = 8.496 as Revealed by JWST and ALMA. ApJ 944, L30 (2023). arXiv:2212.06877.
- [16] Fujimoto, S. et al. CEERS Spectroscopic Confirmation of NIRCam-Selected Galaxy Candidates with JWST/NIRSpec: Initial Characterization of their Properties. Submitted to ApJ (2023). arXiv:2301.09482.
- [17] Williams, H. et al. A magnified compact galaxy at redshift 9.51 with strong nebular emission lines. Accepted in Science (2023). arXiv:2210.15699.
- [18] Bouwens, R. J. et al. Reionization Era Bright Emission Line Survey: Selection and Characterization of Luminous Interstellar Medium Reservoirs in the Universe. ApJ 931, 160 (2022). arXiv:2106.13719.
Data Availability
The Uchuu-UM galaxy catalogues used in this work are publicly available at the Skies & Universes site for cosmological simulations: https://www.skiesanduniverses.org/Simulations/Uchuu/
Acknowledgements
We acknowledge discussions with E. Alfaro, C-A. Dong-Páez, Y. Dubois, Y. Harikane, and M. Volonteri. We thank I. Labbé and Y. Harikane for their guidance on the calculation of UV absolute magnitudes. FP, AK, and EP acknowledge support from the Spanish MICINN funding grant PGC2018-101931-B-I00 and grant CEX2021-001131-S funded by MCIN/AEI/10.13039/501100011033. PB was partially funded by a Packard Fellowship, Grant #2019-69646. TI has been supported by IAAR Research Support Program in Chiba University Japan, MEXT/JSPS KAKENHI (Grant Number JP19KK0344 and JP21H01122), MEXT as “Program for Promoting Researches on the Supercomputer Fugaku” (JPMXP1020200109), and JICFuS. The Shin-Uchuu simulation was carried out on the Aterui II supercomputer at CfCA-NAOJ and Uchuu1000-PL18 was generated at the supercomputer Fugaku at the RIKEN Centerfor Computational Science (R-CCS). The construction of merger trees of those simulations were partially carried out on XC40 at the Yukawa Institute Computer Facility in Kyoto University. We thank IAA-CSIC, CESGA, and RedIRIS in Spain for hosting the Uchuu data releases in the Skies & Universes site for cosmological simulations. The UniverseMachine and Uchuu-UM data analysis have made use of the @IAA-CSIC computer facility managed by IAA-CSIC in Spain (MICINN EU-Feder grant EQC2018-004366-P).
Author contributions
FP drafted the manuscript and contributed to the analysis efforts. AK and EP led the analysis of the Uchuu-UM galaxy catalogues, after PB applied the UniverseMachine to the Shin-Uchuu and Uchuu1000-PL18 -body cosmological simulations and created the Uchuu-UM galaxy catalogues. TI ran the Shin-Uchuu and Uchuu1000-PL18 simulations and generated halo and merger trees for their dark matter halos. EP produced the figures. All authors contributed to the discussion and presentation of the results and reviewed the manuscript.
Author information
The authors declare no competing financial interests. Correspondence and requests for materials should be addressed to FP at f.prada@csic.es