Tuning the thermal conductivity of silicon nanowires by surface passivation
Abstract
Using large scale molecular dynamics simulations, we study the thermal conductivity of bare and surface passivated silicon nanowires (SiNWs). For the smaller cross–sectional widths , SiNWs become unstable because of the surface amorphousization and even evaporation of a certain fraction of Si atoms when nm. Our results suggest that the surface (in–)stability is related to a large excess energy of the surface Si atoms with respect to the bulk Si. This is because the surface Si atoms being less coordinated and having dangling bonds. As a first step of our study, we propose a practically relevant method that uses as a guiding tool to passivate these dangling bonds and thus stabilizes SiNWs. The surface stabilization is achieved by passivation of Si atoms by hydrogen or oxygen. These passivated SiNWs are then used for the calculation of the thermal conductivity coefficient . While the expected trend of is observed for all SiNWs, surface passivation provides an added flexibility of tuning with the surface coverage concentration of passivated atoms. Analyzing the phonon band structures via spectral energy density, we discuss separate contributions from the surface and the core to . The effect of passivation on SiNW stiffness is also discussed.
I Introduction
Silicon (Si) is an important building block in designing nanoscale devices Lieber02Nat ; Dong08NL ; Jo09NL ; Mikolajick2013 ; ZhangRRL2013 , where tuning its physical properties, such as thermal and/or electrical transport, and mechanical stability, is an essential for their use in a desired application. In this context, the ability to conduct the heat current is one of the key properties for the applicability of a material under a wide range of environmental conditions CahillRev . For example, a high thermal transport coefficient is needed for a heat sink material, while a low is required for an high efficiency thermoelectric device Boukai2008 ; Jeong12JAP ; Pennelli20NL ; Li19CR .
To achieve a desired (predictive) level of tunability in , silicon nanowire (SiNW) sensors are of particular interests Boukai2008 ; Mikolajick2013 ; ZhangRRL2013 . In particular, decrease in was observed by changing the morphology via introducing kinks or pores JiangACSNanoLetters2013 ; Cartoixa2016 ; ZhaoKink2019 , roughness Hochbaum2008 , and the cross-sectional shapes LiuJAP2010 . Tuning the mechanical properties of SiNWs has also shown promising results. This may be achieved by introducing point defects in the crystalline lattice, where was shown to reduce by about MurphyACSNanoLetters2014 .
In the ongoing quest toward structural miniaturization, there is also a need to better understand these materials at the nanoscale, especially when the cross–section width nm. For nano–materials, lateral miniaturization often leads to a significant variation in Li2003 ; Hochbaum2008 ; Lim2012 ; Boukai2008 ; VolzChen1999 ; Rashid2018 . In particular, under strong confinement a delicate balance between the bulk as well as the surface phonon propagation controls Ponomareva2007 ; Donadio2009 ; Zhou2017 . For example, it has been experimentally shown that of SiNWs can be reduced by over an order of magnitude with respect to the bulk Si when nm Li2003 . However, a significant challenge here is to attain a stable SiNW structure in the simulations for the smaller values Yu2016 ; Zhou2017 . When is small, i.e., only about a few tens of unit cells, surfaces of a free–standing SiNW become amorphous, while the core remains fairly crystalline. In some cases, even the surface Si atoms evaporate. This behavior is particularly because of the dangling bonds on the surfaces, induced by the less coordinated surface Si atoms, and is not only known for SiNWs Term05JCP ; Term08APL , but is also observed for metal nanoparticles Robin2013 ; Robin2015 .
A common practical treatment to eliminate surface disorder is by the passivation of the surface dangling bonds Term05JCP ; Term08APL ; He2005 ; CuiLieber2003 ; YOUNGKIM2003269 ; Ashour_2013 . In this context, while there are several experimental studies highlighting the importance of surface passivation, to the best of our knowledge, simulation studies on the exact role of surface passivation on SiNW stability and its connection to are rather limited. Computational studies, however, dealt with surface–nitrogenation SiNH2011EPL and engineered surface–amorphousization Donadio2009 . In both cases, a layer of hydrogen atoms was introduced on the surfaces, without explicitly discussing the effects of hydrogen. Furthermore, we also note in passing that using N on Si is a rather nontrivial practical task because they usually induce large differential stresses and may make a surface unstable. Therefore, a detailed structure–property relationship is needed that may be used for the rational understanding and functional design of engineered advanced materials with stable surfaces.
Motivated by the above discussion, we study the behavior in SiNWs with the goals to: (1) establish a structure–property relationship in SiNWs, (2) study the surface stability by using the excess energy as a guiding tool and the effect of passivation on , (3) show how the surface passivation can lead to additional flexibility in tuning , and (4) discuss separate contributions of the surface and the core to the behavior as revealed by the phonon band structures. To achieve these goals, we employ a large scale atomistic molecular dynamics simulation protocol.
II Model and methods
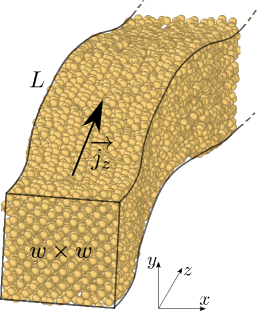
Individual systems consist of free–standing SiNW of length and the cross–section is chosen as a square geometry with the varying width between and . A representative simulation snapshot of a bare SiNW is shown in Fig. 1. Here, nm is the lattice constant. This leads to the typical number of particles per system varying between . We consider the crystalline plane oriented along the axis, i.e., the direction of calculation. The bare–SiNWs are also passivated with oxygen (O–SiNW) or hydrogen (H–SiNW).
The initial configurations are created by placing a SiNW at the center of a simulation box with dimensions . The periodic boundary conditions are applied along all directions, but a large vacuum in the lateral directions (i.e., along and directions) prevents the Si atoms from seeing their periodic images due to the flexural vibrations and thus precludes any simulation artifacts.
The Tersoff potential is used for the silicon (Si) interactions Tersoff1988 . A set of modified Tersoff parameters are used to mimic the interactions of Si with oxygen (O–SiNW) Munetoh2007 and hydrogen (H–SiNW) deBritoMota1999 .
The temperature is imposed using the Nosé-Hoover thermostat. Unless stated otherwise all physical properties are calculated at K. At different stages of simulations, spurious structural stresses along the direction are relaxed under NpT simulation, where pressure atm is also imposed using the Nosé-Hoover barostat. The equations of motion are integrated using the Verlet algorithm. The integration time step for SiNWs and O–SiNWs is fs, while fs is chosen for H–SiNWs. The GPU–accelerated LAMMPS package is used for these simulations Lammps2022 .
II.1 Equilibration of the free–standing SiNWs
To achieve a stable free standing SiNW structure, the initial structural equilibration is performed in different steps:
-
1.
The crystalline SiNW structures are initially created at K.
-
2.
Subsequently a SiNW is heated to K for a time ps.
-
3.
The final configurations from step 2 are then heated further to K for ps. For some test simulations, configurations are also created at K.
-
4.
The configurations from the step 3 are then further equilibrated at K for ps.
We note in passing that in steps 2–4, simulations are performed under an anisotropic pressure coupling that is only employed along the direction, i.e., along the SiNW length. The final configurations obtained after step 4 are equilibrated in the canonical ensemble for an additional ps. We would also like to emphasize that a rather complex sample preparation protocol is used to ensure that the well–defined (residual stress–free) SiNW structures are obtained.
II.2 Passivation of the free surface
The surface passivated systems (O–SiNW and H–SiNW) are prepared at different surface coverage concentrations . Here, is defined as the maximum number of passivating atoms that can be added without introducing more dangling bonds by the passivation. In the case of O–SiNW, one oxygen can bind to two Si atoms and thus leaves a small fraction of dangling bonds even for . In H–SiNW, however, all dangling bonds are passivated because of their single Si–H coordination. Subsequently, the samples with different are generated by randomly removing fraction of passivating atoms.
II.3 Thermal transport coefficient calculations
The thermal transport coefficient is calculated using the approach to equilibrium method Lampin2013 . Within this method, along the direction of heat flow is subdivided into three layers, i.e., (layer I), (layer II) and (layer III). In the first stage of canonical simulation, layers I and III are thermalized at K, while the layer II is kept at K. After this thermalization stage, simulations are performed in the microcanonical ensemble that allows for the redistribution of energy, where are allowed to relax. As proposed in Ref. Lampin2013 , we fit by a bi–exponential function and obtain the time constant along the direction of heat flow. Finally can be calculated using,
| (1) |
where is the heat capacity. We have used the Dulong–Petit classical estimate for , with being the Boltzmann constant and is the total number of atoms in a system.
The calculations are performed at K because the temperature equilibration in NVT and the subsequent relaxation in NVE for calculations can be achieved within a reasonable simulation time without any unphysical energy drift. Note that the microcanonical simulations (especially with complex empirical potentials) typically show an energy drift over long times and for relatively large FSBook . Furthermore, even when we are performing simulations at K, the harmonic approximation still holds, i.e, KittelBook . Here, is the Debye temperature and for this model K Fan2020 .
The of O–SiNW and H–SiNW are normalized with the bulk thermal transport coefficient W/Km. In our simulations, we have calculated for a sample with PBC in all directions. At a first glance, this value might look small compared to the known experimental values W/Km Glassbrenner1964 . However, this is consistent with the simulation data in Ref. Lampin2013 for nm. Here, we also wish to highlight that the phonon wavelength is truncated along the direction of heat flow due to the finite simulation box size (boundary scattering), thus a length dependent is expected Lampin2013 ; Bruns20prb . We have also attempted to calculate using the equilibrium Kubo–Green method KuboG , where the system size effects may be reduced. We, however, had severe problems with the convergence of heat flux autocorrelation function and drift in energy under NVE (data not shown).
II.4 Spectral energy density calculation
The phonon band structure is calculated using the spectral energy density (SED) Thomas2010 ; Thomas2015Erratum ; Hornavar2016 . In our study, we define a supercell of Si atoms within a region of size that in total has atoms per supercell. Here, is estimated using,
| (2) |
where is the velocity of the coordinate of the particle of mass in the unit supercell . corresponds to the equilibrium position of the supercell. We note in passing that Eq. 2 is based on a normal mode analysis in the frequency domain that does not rely on the phonon eigenvectors, instead only on the Fourier transform of the atoms velocities Feng2015 obtained over a total time . Using the equilibrated configurations, we run NVE simulations for ns per sample with fs for SiNWs and O–SiNWs and fs for H–SiNWs. Velocities and positions are stored every 16 fs.
III Results and discussions
III.1 Surface stability and excess energy
We begin by discussing the surface stability of SiNWs. For this purpose, we show a simulation snapshot of bare SiNW in Fig. 1. It can be appreciated that– even when the core of SiNW is crystalline, there is vissibly a large degree of rearrangement of the surface Si atoms, forming an amorphous surface layer. Therefore, to quantify this surface disorder and its correlation with the surface energy, we have calculated the excess energy using Cleveland1991 ; Baletto_etal_JCP116_3856_2002
| (3) |
where is calculated relative to the bulk cohesion energy per atom of bare Si and the energy of a SiNW with atoms is given by . The factor scales as the number of surface atoms. The variation of with is shown in Fig. 2.
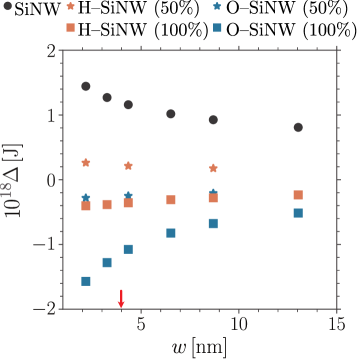
A closer look at the bare SiNW data (see the black data set) shows that increases monotonically with decreasing and thus indicates that the surface effects become more dominant for smaller . This variation with is also directly related to the stability of SiNWs, especially for smaller where creating a surface usually has a significant energy cost. Furthermore, we note that even when decreases with , it still remains significantly large for nm (i.e., J or at K) and thus the surfaces remain fairly disordered for all , see the Supplementary Fig. S1(a) epaps .
The central cause of such disorder is that the Si atoms are less coordinated on the surfaces than in the bulk and thus have a substantial number of dangling bonds. This contributes to a large energy penalty in forming a surface. Indeed, the surface energy, to a first approximation, is proportional to the total number of broken bonds at the surface Robin2013 . Furthermore, it has also been shown that the Si–Si bond length decreases on the surface compared to the core Li_2014 . Such lattice contraction has been reported both in simulations and in experiments for Si nano-clusters Hofmeister1999 ; Yu2002 . Likewise, our simulations also reproduce this behavior of lattice contraction. More specifically, cross–sectional surface area of a bare SiNW with is , which is about smaller than the expected value of for a perfect lattice. This has a direct implication on the elastic bending and torsional stiffnesses of the passivated SiNWs as we shall see later.
There are different treatments to eliminate surface disorder. Here, a common industrially relevant procedure is to deposit 5–10 nm of either silicon dioxide (SiO2) or silicon nitride (SiNH3) on bare SiNWs He2005 ; CuiLieber2003 ; YOUNGKIM2003269 ; Ashour_2013 . This serves as a natural route to reduce as it reduces the number of dangling bonds. Simulations have also shown that passivation using amorphous Si Donadio2009 or hydrogen wolkowHpassivation ; Li_2014 may stabilize the surfaces. We take motivation from these experimental and simulation studies and passivate SiNW surfaces with either oxygen (O–SiNW) or hydrogen (H–SiNW). The latter is specifically chosen because hydrogen–on–silicon is used for inorganic solar cellsBertoni2011 and/or for data storage wolkowdata . Note that we passivate the SiNW surfaces with only a monolayer of atoms.
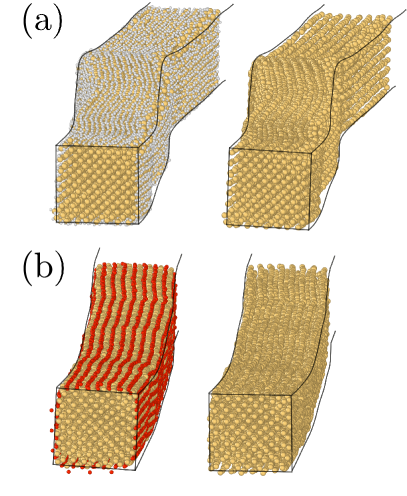
In Fig. 3 we show 100% passivated SiNWs, with (left panel) and without (right panel) rendering the passivated atoms. As expected, passivation helps preserving the crystallinity of the O–SiNW and H–SiNW surfaces (see the right panels in Fig. 3) in comparison to bare SiNW in Fig. 1.
Passivation also significantly reduces , see the and data sets in Fig. 2. It can be seen that remains almost constant for all passivated systems, except for O–SiNW with 100% passivation, see blue data set in Fig. 2. This observed large negative for O–SiNW can be understood by assessing the different contributions in Eq. 3. For example, in Eq. 3 is estimated relative to , which only includes Si–Si binding energy. Here, the Si–Si binding energy is about 222 kJ/mol, while the Si–O binding energy can be as high as 452 kJ/mol HKK_InorganicChem . These two separate contributions together will then result in a difference greater than just bare in Eq. 3. This correction is then expected to lead to a smaller negative magnitude of for O–SiNW. Note that these binding energy estimates are obtained at K and our simulations are performed at K. Therefore, it may not be trivial to straightforwardly apply these estimates to our calculations.
For H–SiNW, the reported H–H and Si–H binding energies are 432 kJ/mol and 318 kJ/mol, respectively HKK_InorganicChem . Other than explaining the negative for smaller , the difference might be at the origin of a competition between the passivation of the nanowire and the formation of a H2 phase. We can expect that this competition becomes increasingly important as the temperature increases, possibly explaining the noticeable expansion of the surface area for H–SiNW. Interestingly, we note that despite the strong negative value of for O–SiNW, which should promote the surface formation, the cross-section of the SiNW is actually shrinking, see the Supplementary Fig. S3 epaps .
III.2 Thermal conductivity coefficient
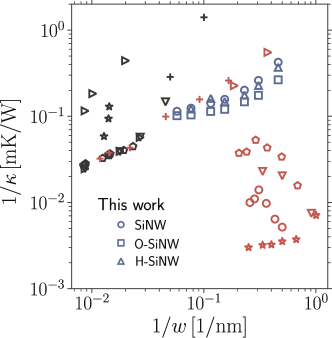
In Fig. 4 we show the variation of with . For comparison, we have also included earlier published simulation VolzChen1999 ; Donadio2010 ; Ponomareva2007 ; Zhou2017 ; Lacroix2006 ; Rashid2018 and experimental data Li2003 ; Hochbaum2008 ; Boukai2008 ; Lee2016 ; Lim2012 . Consistent with the experiments, our data also show the expected trend, i.e., decreases monotonically with decreasing . This is not surprising because lateral miniaturization leads to an enhanced phonon scattering by the surfaces. It can also be seen that our simulation and some experimental data sets Li2003 ; Lee2016 ; Lim2012 show the same linear variation, i.e., with the same prefactor . This, however, we believe to be a mere coincidence because: (a) in experiments are significantly larger than in our simulations and is known to increase with increasing Lampin2013 ; Bruns20prb , especially for the quasi–one–dimensional materials. (b) Exact quantitative comparison between the computationally computed and experimentally observed values is not possible within the classical simulations. The scenario (b) is due to the fact that in a classical simulation all modes contribute equally to , while in reality many modes are quantum mechanically frozen below and thus do not contribute to binder99jpcb ; Martin21prm . This leads to an overestimation of and thus also in classical simulation in comparison to the experiments KappaMDExp . It can also be seen that a few earlier simulations have shown opposite trends, i.e., increases for below nm Ponomareva2007 ; Donadio2010 ; Zhou2017 . This non-monotonous change with decreasing might be due to a transition from the phonon-boundary scattering to hydrodynamic phonon flow. In the case of the Tersoff potential, this transition has been located below 2 nm Zhou2017 .
Note that the data sets presented in Fig. 4 are obtained at different , and also by different methods. However, given that all all the data were obtained for , the generic trend, i.e., , should remain the same under the harmonic approximation, irrespectively of the system parameters and thus provides a robust overall picture of in SiNWs.
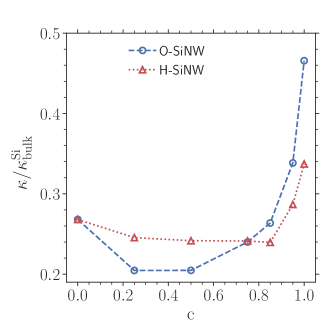
Fig. 4 presents the importance of lateral miniaturization as a common protocol to tune Li2003 ; Hochbaum2008 ; Lee2016 ; Boukai2008 ; Lim2012 ; Lacroix2006 ; Rashid2018 , while our results show that passivation provides an additional tuning parameter for . In Fig. 5 it can be appreciated that first decreases with increasing (for for O–SiNW and for H–SiNW), then again increases when . It is also evident that O–SiNW shows a greater variation in than H–SiNW. What causes such non–monotonous variation in with ? To answer this question, we focus on the phonon spectrum and compute the spectral energy density (SED) using Thomas2010 ; Thomas2015Erratum ; Hornavar2016 .
III.3 Spectral energy density
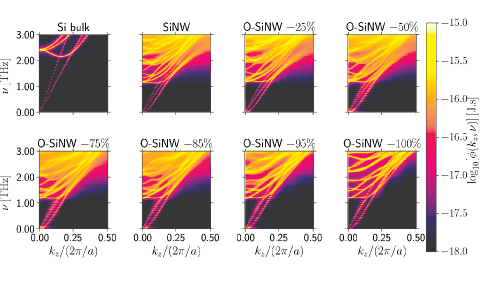
In Fig. 6 we show SED data for O–SiNW systems for different . For reference, we have also calculated SED for bulk Si and bare SiNW. Fig. 6 shows several interesting features:
-
1.
SiNW and O–SiNWs have rather complex phonon band structures compared to bulk Si with several optical branches appearing for THz.
-
2.
For THz, SiNWs show dilatational (D), torsional (T), and flexural (F) acoustic branches in the decreasing order of group velocities, respectively. More importantly, the emergence of the slow flexural phonons in the long wavelength acoustic limit (i.e., the lowest dispersion branch with near zero group velocity for ) can be seen. Furthermore, the partial confinement of the optical phonons can also be observed, identified by the flat dispersion near THz.
-
3.
The D and T phonon branches (following ) become softer for SiNW than bulk Si due to a reduction in the overall stiffness of a nanowire. We notice here that we only see one of the two T branches. This is because SiNWs are embedded in vacuum and thus the symmetrical cross–section leads to a degeneracy of the T branches HepplestoneSrivastava2005 ; Zhang2007 . This stiffness reduction will then lead to a reduction of as predicted by the minimum thermal conductivity model Cahill1992 .
-
4.
The SED maps become sharper with increasing , especially for , i.e., improved crystallinity and thus longer phonon life time and higher .
-
5.
We observe in Fig. 6 that the acoustic phonon branches steepen up with increasing , and has a profound influence on the intermediate T branch. It can be observed that the T branch approaches the D branch with increasing . Furthermore, there is a corresponding increase in the number of active phonon branches which changes the density of states (see the Supplementary Figure S2) epaps and hence .
-
6.
Passivation can also significantly change the flexural stiffness, and hence group velocities, of each of these modes of propagation (see the Supplementary Movie). Here, the flexural stiffness is related to and thus the kinks/bends along the less stiff SiNWs enhance phonon scattering and thus reduce kinksSi2013NL ; chen19jap ; Mukherji21AN . These flexural branches persist for all .
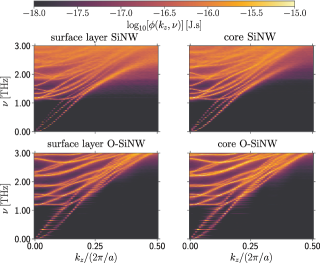
We also comment that the surface passivation not only helps stabilize a SiNW, but it also improves the bulk crystallinity. To validate this we have calculated the SED contributions from the bulk and surface Si atoms separately. In Fig. 7 we show SED for a SiNW and a O–SiNW for . It can be appreciated that the amorphous surface Si atoms also affect the bulk crystallinity (seen by the rather diffused SED branches in the top panels of Fig. 7), while O–passivation improves surface crystallinity and thus also that of the bulk (see the bottom panels in Fig. 7). Note that this behavior is most dominant for . For the the larger amorphous Si surface does not significantly affect the bulk crystallinity, see the simulation snapshot in Supplementary Fig. S1 epaps .
Lastly, to study the relative contribution of the surface modes to thermal transport, we have also computed . For the bare SiNWs (see the left panel in Fig. 8), it can be seen that D and F branches are dominated by the Si atoms at the core (), while the surfaces and the core contribute equally to the T branch (). Note also that the red region within the range and is likely due to some background noise by the surface atoms.
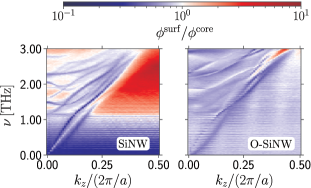
The case of O–SiNW is somewhat different. For example, it can be seen from the right panel in Fig. 8 that the surface and the core contribute almost equally (i.e., ). This explains that not only the surface crystallization that contributes to increase , instead a delicate balance between the surface crystallinity and the stiffness of an O–SiNW contributes to . A comparative comparison of the flexural vibrations between O–SiNW and H–SiNW is shown in the Supplementary Movie. This can be explained based on the fact that the passivation induces surface stress which increases the elastic torsional stiffness.
IV Conclusion
We have studied thermal transport in surface passivated silicon nanowires (SiNW) using classical molecular dynamics. Consistent with experimental data, our results indicate that SiNWs become rather unstable and amorphous for small cross–section widths, which can be attributed to a large excess energy of the surface silicon atoms. We used as a guiding tool to stabilize the SiNW surfaces via surface passivation. As an added advantage, the concentration of passivation provides an additional tuning parameter for thermal conductivity. When the surfaces remain crystalline due to the passivated atoms, they also increase the stiffness of a SiNW and thus show that a delicate balance between different system parameters controls the tunability in . Using the phonon band structure analysis, we also decouple the surface and the bulk effects on .
The discussion presented in this work thus highlights that the behavior of SiNWs and passivated SiNWs is dictated by a
delicate balance between different factors, i.e., surface–to–bulk crystallinity, flexural vibrations, and stiffness via passivation.
Therefore, it presents a microscopic picture of the heat flow in low dimensional systems.
Acknowledgement: C.R. gratefully acknowledges MITACS and Lumiense Photonics Inc. for the financial support. C.R. further thanks Daniel Bruns for useful discussions and Pierre Chapuis for the help with the representations of SiNWs. We thank the generous allocation of GPU hours to D.M. at the ARC Sockeye facility where majority of simulations are performed. Some simulations were also performed at the Compute Canada allocation to A.N. For D.M. and A.N. this research was undertaken thanks, in part, to the Canada First Research Excellence Fund (CFREF), Quantum Materials and Future Technologies Program.
Data availability: The scripts and the data associated with this research are available upon reasonable request from the corresponding author.
Author Contributions: C.R. wrote the LAMMPS scripts, ran the simulations, and analyzed the data. R.C.H. proposed the excess energy calculations and C.R. and R.C.H. co–analyzed the excess energy data. C.R. R.H., D.M., A.N., and S.P. proposed, designed, and conceptualized this study. C.R. and D.M. wrote the draft and all authors contributed to the editing. R.H., D.M., A.N., and S.P. contributed equally to this work and their names are written alphabetically.
References
- [1] M S Gudiksen, Lincoln J. Lauhon, Jianfang Wang, David C. Smith, and Charles M. Lieber. Growth of nanowire superlattice structures for nanoscale photonics and electronics. Nature, 415:617–620, 2002.
- [2] Yajie Dong, Guihua Yu, Michael C. McAlpine, Wei Lu, and Charles M. Lieber. Si/a-si core/shell nanowires as nonvolatile crossbar switches. Nano Letters, 8(2):386–391, 2008.
- [3] Sung Hyun Jo, Kuk-Hwan Kim, and Wei Lu. High-density crossbar arrays based on a si memristive system. Nano Letters, 9(2):870–874, 2009.
- [4] Thomas Mikolajick, André Heinzig, Jens Trommer, Sebastian Pregl, Matthias Grube, Gianaurelio Cuniberti, and Walter M. Weber. Silicon nanowires – a versatile technology platform. physica status solidi (RRL) – Rapid Research Letters, 7(10):793–799, 2013.
- [5] Gang Zhang and Yong-Wei Zhang. Thermal conductivity of silicon nanowires: From fundamentals to phononic engineering. physica status solidi (RRL) – Rapid Research Letters, 7(10):754–766, 2013.
- [6] David G. Cahill, Paul V. Braun, Gang Chen, David R. Clarke, Shanhui Fan, Kenneth E. Goodson, Pawel Keblinski, William P. King, Gerald D. Mahan, Arun Majumdar, Humphrey J. Maris, Simon R. Phillpot, Eric Pop, and Li Shi. Nanoscale thermal transport. ii. 2003–2012. Applied Physics Reviews, 1(1):011305, 2014.
- [7] Akram I Boukai, Yuri Bunimovich, Jamil Tahir-Kheli, Jen-Kan Yu, William A Goddard, III, and James R Heath. Silicon nanowires as efficient thermoelectric materials. Nature, 451(7175):168–171, January 2008.
- [8] Changwook Jeong, Supriyo Datta, and Mark Lundstrom. Thermal conductivity of bulk and thin-film silicon: A landauer approach. Journal of Applied Physics, 111(9):093708, 2012.
- [9] Shaimaa Elyamny, Elisabetta Dimaggio, Stefano Magagna, Dario Narducci, and Giovanni Pennelli. High power thermoelectric generator based on vertical silicon nanowires. Nano Letters, 20(7):4748–4753, 2020.
- [10] Renkun Chen, Jaeho Lee, Woochul Lee, and Deyu Li. Thermoelectrics of nanowires. Chemical Reviews, 119(15):9260–9302, 2019.
- [11] Jin-Wu Jiang, Nuo Yang, Bing-Shen Wang, and Timon Rabczuk. Modulation of thermal conductivity in kinked silicon nanowires: Phonon interchanging and pinching effects. Nano Letters, 13(4):1670–1674, 2013.
- [12] Xavier Cartoixà, Riccardo Dettori, Claudio Melis, Luciano Colombo, and Riccardo Rurali. Thermal transport in porous si nanowires from approach-to-equilibrium molecular dynamics calculations. Applied Physics Letters, 109(1):013107, 2016.
- [13] Yang Zhao, Lin Yang, Chenhan Liu, Qian Zhang, Yunfei Chen, Juekuan Yang, and Deyu Li. Kink effects on thermal transport in silicon nanowires. International Journal of Heat and Mass Transfer, 137:573–578, 2019.
- [14] Allon I Hochbaum, Renkun Chen, Raul Diaz Delgado, Wenjie Liang, Erik C Garnett, Mark Najarian, Arun Majumdar, and Peidong Yang. Enhanced thermoelectric performance of rough silicon nanowires. Nature, 451(7175):163–167, January 2008.
- [15] Ling Liu and Xi Chen. Effect of surface roughness on thermal conductivity of silicon nanowires. Journal of Applied Physics, 107(3):033501, 2010.
- [16] Kathryn F. Murphy, Brian Piccione, Mehdi B. Zanjani, Jennifer R. Lukes, and Daniel S. Gianola. Strain- and defect-mediated thermal conductivity in silicon nanowires. Nano Letters, 14(7):3785–3792, 2014.
- [17] Deyu Li, Yiying Wu, Philip Kim, Li Shi, Peidong Yang, and Arun Majumdar. Thermal conductivity of individual silicon nanowires. Applied Physics Letters, 83(14):2934–2936, 2003.
- [18] Jongwoo Lim, Kedar Hippalgaonkar, Sean C. Andrews, Arun Majumdar, and Peidong Yang. Quantifying surface roughness effects on phonon transport in silicon nanowires. Nano Letters, 12(5):2475–2482, 2012.
- [19] Sebastian G. Volz and Gang Chen. Molecular dynamics simulation of thermal conductivity of silicon nanowires. Applied Physics Letters, 75(14):2056–2058, 1999.
- [20] Zahid Rashid, Liyan Zhu, and Wu Li. Effect of confinement on anharmonic phonon scattering and thermal conductivity in pristine silicon nanowires. Phys. Rev. B, 97:075441, Feb 2018.
- [21] Inna Ponomareva, Deepak Srivastava, and Madhu Menon. Thermal conductivity in thin silicon nanowires: phonon confinement effect. Nano Letters, 7(5):1155–1159, 2007.
- [22] Davide Donadio and Giulia Galli. Atomistic simulations of heat transport in silicon nanowires. Phys. Rev. Lett., 102:195901, May 2009.
- [23] Yanguang Zhou, Xiaoliang Zhang, and Ming Hu. Nonmonotonic diameter dependence of thermal conductivity of extremely thin si nanowires: Competition between hydrodynamic phonon flow and boundary scattering. Nano Letters, 17(2):1269–1276, 2017.
- [24] Yi Yu, Fan Cui, Jianwei Sun, and Peidong Yang. Atomic structure of ultrathin gold nanowires. Nano Letters, 16(5):3078–3084, 2016.
- [25] R. Q. Zhang, Y. Lifshitz, D. D. D. Ma, Y. L. Zhao, Th. Frauenheim, S. T. Lee, and S. Y. Tong. Structures and energetics of hydrogen-terminated silicon nanowire surfaces. The Journal of Chemical Physics, 123(14):144703, 10 2005.
- [26] A. J. Lu, R. Q. Zhang, and S. T. Lee. Tunable electronic band structures of hydrogen-terminated ⟨112⟩ silicon nanowires. Applied Physics Letters, 92(20):203109, 05 2008.
- [27] Robinson Cortes-Huerto, Jacek Goniakowski, and Claudine Noguera. An efficient many-body potential for the interaction of transition and noble metal nano-objects with an environment. The Journal of Chemical Physics, 138(24):244706, 2013.
- [28] Robinson Cortes-Huerto, Jacek Goniakowski, and Claudine Noguera. Role of the environment in the stability of anisotropic gold particles. Phys. Chem. Chem. Phys., 17:6305–6313, 2015.
- [29] R. He, D. Gao, R. Fan, A. I. Hochbaum, C. Carraro, R. Maboudian, and P. Yang. Si nanowire bridges in microtrenches: Integration of growth into device fabrication. Advanced Materials, 17(17):2098–2102, 2005.
- [30] Yi Cui, Zhaohui Zhong, Deli Wang, Wayne U. Wang, and Charles M. Lieber. High performance silicon nanowire field effect transistors. Nano Letters, 3(2):149–152, 2003.
- [31] Hwa Young Kim, Jeunghee Park, and Hyunik Yang. Synthesis of silicon nitride nanowires directly from the silicon substrates. Chemical Physics Letters, 372(1):269–274, 2003.
- [32] E S M Ashour, M Y Sulaiman, N Amin, and Z Ibrahim. Silicon nitride passivation of silicon nanowires solar cell. Journal of Physics: Conference Series, 431(1):012021, apr 2013.
- [33] H. P. Li, Abir De Sarkar, and R. Q. Zhang. Surface-nitrogenation–induced thermal conductivity attenuation in silicon nanowires. Europhysics Letters, 96(5):56007, nov 2011.
- [34] J. Tersoff. New empirical approach for the structure and energy of covalent systems. Phys. Rev. B, 37:6991–7000, Apr 1988.
- [35] Shinji Munetoh, Teruaki Motooka, Koji Moriguchi, and Akira Shintani. Interatomic potential for si–o systems using tersoff parameterization. Computational Materials Science, 39(2):334–339, 2007.
- [36] F. de Brito Mota, J. F. Justo, and A. Fazzio. Hydrogen role on the properties of amorphous silicon nitride. Journal of Applied Physics, 86(4):1843–1847, 1999.
- [37] Aidan P. Thompson, H. Metin Aktulga, Richard Berger, Dan S. Bolintineanu, W. Michael Brown, Paul S. Crozier, Pieter J. in ’t Veld, Axel Kohlmeyer, Stan G. Moore, Trung Dac Nguyen, Ray Shan, Mark J. Stevens, Julien Tranchida, Christian Trott, and Steven J. Plimpton. Lammps - a flexible simulation tool for particle-based materials modeling at the atomic, meso, and continuum scales. Computer Physics Communications, 271:108171, 2022.
- [38] E. Lampin, P. L. Palla, P.-A. Francioso, and F. Cleri. Thermal conductivity from approach-to-equilibrium molecular dynamics. Journal of Applied Physics, 114(3):033525, 2013.
- [39] Daan Frenkel and Berend Smit. Understanding molecular simulation. Academic Press, UK, 2002.
- [40] Charles Kittel. Introduction to Solid State Physics, Eight Edition. John Wiley & Sons, 2005.
- [41] Zheyong Fan, Yanzhou Wang, Xiaokun Gu, Ping Qian, Yanjing Su, and Tapio Ala-Nissila. A minimal tersoff potential for diamond silicon with improved descriptions of elastic and phonon transport properties. Journal of Physics: Condensed Matter, 32(13):135901, dec 2019.
- [42] C. J. Glassbrenner and Glen A. Slack. Thermal conductivity of silicon and germanium from 3°k to the melting point. Phys. Rev., 134:A1058–A1069, May 1964.
- [43] Daniel Bruns, Alireza Nojeh, A. Srikantha Phani, and Jörg Rottler. Heat transport in carbon nanotubes: Length dependence of phononic conductivity from the boltzmann transport equation and molecular dynamics. Phys. Rev. B, 101:195408, May 2020.
- [44] Robert Zwanzig. Time-correlation functions and transport coefficients in statistical mechanics, 1965.
- [45] John A. Thomas, Joseph E. Turney, Ryan M. Iutzi, Cristina H. Amon, and Alan J. H. McGaughey. Predicting phonon dispersion relations and lifetimes from the spectral energy density. Phys. Rev. B, 81:081411, Feb 2010.
- [46] John A. Thomas, Joseph E. Turney, Ryan M. Iutzi, Cristina H. Amon, and Alan J. H. McGaughey. Erratum: Predicting phonon dispersion relations and lifetimes from the spectral energy density [phys. rev. b 81, 081411(r) (2010)]. Phys. Rev. B, 91:239905, Jun 2015.
- [47] Hossein Honarvar and Mahmoud I. Hussein. Spectral energy analysis of locally resonant nanophononic metamaterials by molecular simulations. Phys. Rev. B, 93:081412, Feb 2016.
- [48] Tianli Feng, Bo Qiu, and Xiulin Ruan. Anharmonicity and necessity of phonon eigenvectors in the phonon normal mode analysis. Journal of Applied Physics, 117(19):195102, 2015.
- [49] Charles L. Cleveland and Uzi Landman. The energetics and structure of nickel clusters: Size dependence. The Journal of Chemical Physics, 94(11):7376–7396, 1991.
- [50] F. Baletto, R. Ferrando, A. Fortunelli, F. Montalenti, and C. Mottet. Crossover among structural motifs in transition and noble-metal clusters. The Journal of Chemical Physics, 116(9):3856–3863, 03 2002.
- [51] Electronic supplementary material. document number to be included by the editor.
- [52] Hai peng Li and Rui qin Zhang. Anomalous effect of hydrogenation on phonon thermal conductivity in thin silicon nanowires. Europhysics Letters, 105(5):56003, mar 2014.
- [53] H. Hofmeister, F. Huisken, and B. Kohn. Lattice contraction in nanosized silicon particles produced by laser pyrolysis of silane. The European Physical Journal D - Atomic, Molecular, Optical and Plasma Physics, 9(1):137–140, 1999.
- [54] D. K. Yu, R. Q. Zhang, and S. T. Lee. Structural transition in nanosized silicon clusters. Phys. Rev. B, 65:245417, Jun 2002.
- [55] Jason L. Pitters, Lucian Livadaru, M. Baseer Haider, and Robert A. Wolkow. Tunnel coupled dangling bond structures on hydrogen terminated silicon surfaces. The Journal of Chemical Physics, 134(6):064712, 2011.
- [56] M.I. Bertoni, S. Hudelson, B.K. Newman, D.P. Fenning, H.F.W. Dekkers, E. Cornagliotti, A. Zuschlag, G. Micard, G. Hahn, G. Coletti, B. Lai, and T. Buonassisi. Influence of defect type on hydrogen passivation efficacy in multicrystalline silicon solar cells. Progress in Photovoltaics: Research and Applications, 19(2):187–191, 2011.
- [57] Roshan Achal, Mohammad Rashidi, Jeremiah Croshaw, Taleana R. Huff, and Robert A. Wolkow. Detecting and directing single molecule binding events on h-si(100) with application to ultradense data storage. ACS Nano, 14(3):2947–2955, 2020.
- [58] J. E. Huheey, E. A. Keiter, and R. L. Keiter. Inorganic Chemistry–Principles of Structure and Reactivity. HarperCollins College, 4 edition, 1993.
- [59] Davide Donadio and Giulia Galli. Temperature dependence of the thermal conductivity of thin silicon nanowires. Nano Letters, 10(3):847–851, 2010.
- [60] David Lacroix, Karl Joulain, Damian Terris, and Denis Lemonnier. Monte carlo simulation of phonon confinement in silicon nanostructures: Application to the determination of the thermal conductivity of silicon nanowires. Applied Physics Letters, 89(10):103104, 2006.
- [61] Jaeho Lee, Woochul Lee, Jongwoo Lim, Yi Yu, Qiao Kong, Jeffrey J. Urban, and Peidong Yang. Thermal transport in silicon nanowires at high temperature up to 700 k. Nano Letters, 16(7):4133–4140, 2016.
- [62] Jürgen Horbach, Walter Kob, and Kurt Binder. Specific heat of amorphous silica within the harmonic approximation. The Journal of Physical Chemistry B, 103(20):4104–4108, 1999.
- [63] Hongyu Gao, Tobias P. W. Menzel, Martin H. Müser, and Debashish Mukherji. Comparing simulated specific heat of liquid polymers and oligomers to experiments. Phys. Rev. Mater., 5:065605, Jun 2021.
- [64] M. Lim, Z. Rak, J. L. Braun, C. M. Rost, G. N. Kotsonis, P. E. Hopkins, J.-P. Maria, and D. W. Brenner. Influence of mass and charge disorder on the phonon thermal conductivity of entropy stabilized oxides determined by molecular dynamics simulations. Journal of Applied Physics, 125:055105, 2019.
- [65] S. P. Hepplestone and G. P. Srivastava. Lattice dynamics of ultrasmall silicon nanostructures. Applied Physics Letters, 87(23):231906, 2005.
- [66] Y. Zhang, J. X. Cao, Y. Xiao, and X. H. Yan. Phonon spectrum and specific heat of silicon nanowires. Journal of Applied Physics, 102(10):104303, 2007.
- [67] David G. Cahill, S. K. Watson, and R. O. Pohl. Lower limit to the thermal conductivity of disordered crystals. Phys. Rev. B, 46:6131–6140, Sep 1992.
- [68] Jin-Wu Jiang, Nuo Yang, Bing-Shen Wang, and Timon Rabczuk. Modulation of thermal conductivity in kinked silicon nanowires: Phonon interchanging and pinching effects. Nano Letters, 13(4):1670–1674, 2013.
- [69] Xuhui Duan, Zehuan Li, Jun Liu, Gang Chen, and Xiaobo Li. Roles of kink on the thermal transport in single polyethylene chains. Journal of Applied Physics, 125(16), 04 2019. 164303.
- [70] Aashish Bhardwaj, A. Srikantha Phani, Alireza Nojeh, and Debashish Mukherji. Thermal transport in molecular forests. ACS Nano, 15(1):1826–1832, 2021.