Polycyclic Aromatic Hydrocarbon emission model in photodissociation regions
\Romannum2: Application to the Polycyclic Aromatic Hydrocarbon and fullerene emission in NGC 7023
Abstract
We present a charge distribution-based emission model that calculates the infrared spectrum of fullerenes (C60). Analysis of the modelled spectrum of C60 in various charge states shows that the relative intensity of the features in the 5-10 m versus 15-20 m can be used to probe the C60 charge state in interstellar spectra. We further used our model to simulate emission from polycyclic aromatic hydrocarbons (PAHs) and C60 at five positions in the cavity of reflection nebula NGC 7023. Specifically, we modelled the 6.2/11.2 band ratio for circumcoronene and circumcircumcoronene and the 7.0/19.0 band ratio for C60 as a function of the ionization parameter . A comparison of the model results with the observed band ratios shows that the values in the cavity do not vary significantly, suggesting that the emission in the cavity does not originate from locations at the projected distances. Furthermore, we find that the C60 derived values are lower than the PAH-derived values by an order of magnitude. We discuss likely scenarios for this discrepancy. In one scenario, we attribute the differences in the derived values to the uncertainties in the electron recombination rates of PAHs and C60. In the other scenario, we suggest that PAHs and C60 are not co-spatial resulting in different values from their respective models. We highlight that experiments to determine necessary rates will be required in validating either one of the scenarios.
keywords:
astrochemistry – infrared: ISM – ISM: lines and bands – ISM: molecules - ISM: photodissociation region (PDR) - ISM: individual objects - NGC 70231 Introduction
Polycyclic Aromatic Hydrocarbons (PAHs) and fullerenes are two families of large aromatic molecules that are widespread and abundant in the Universe (Sellgren et al., 1983; Leger & Puget, 1984; Allamandola et al., 1985; Galliano et al., 2008; Cami et al., 2010; Sellgren et al., 2010). While PAHs are planar molecules composed of fused benzene rings decorated with hydrogen atoms at their edges, fullerenes are closed cage structures of carbon. Buckminsterfullerene, C60, is the most famous fullerene molecule. It has been unequivocally detected in the Universe and is the largest molecule discovered to date (e.g. Cami et al., 2010; Sellgren et al., 2010; Berné et al., 2013; Campbell et al., 2015; Cordiner et al., 2019).
Despite their distinct molecular structures, PAHs and C60 share a common excitation and emission mechanism (Tielens, 2021). PAHs and C60 are both strong ultraviolet (UV) photon absorbers that release the absorbed energy via their vibrational modes in the mid-infrared (MIR). Emission from these molecules typically originates from photodissociation regions (PDRs), the transition regions between the ionized gas and the molecular clouds where far-ultraviolet (FUV; 6-13.6 eV) photons drive the physics and chemistry of the gas. Berné & Tielens (2012) have hypothesized that these two molecular families are possibly linked by the mechanism of C60 formation from the UV processing of PAHs. However, several questions remain about the formation and destruction of PAHs and C60 and how they are related to each other.
In Sidhu et al. (2022), hereafter referred to as Paper I, we presented an emission model that calculates the charge distribution of PAHs using experimentally measured and theoretically calculated molecular properties of PAHs and combines that charge distribution with the emission model of PAHs to calculate the total PAH emission in astrophysical environments. In Paper I, we demonstrated that the charge distribution-based emission model could explain PAH observations in five different PDRs. In this paper, we extend our model to C60 given the similarity in the excitation mechanism of PAHs and C60. We model the emission of PAHs and C60 at five different locations in the cavity of the reflection nebula NGC 7023 and compare our results with observations in order to provide more insight into the relation between C60 and PAHs.
This paper is organized as follows. In section 2, we describe the astrophysical environment NGC 7023. In section 3, we apply our emission model to PAHs and C60, and in section 4, we compare the model results to the observations. In section 5, we discuss the disagreement between model results for C60 and PAH observations. Finally, in section 6, we provide a summary of this work.
2 NGC 7023
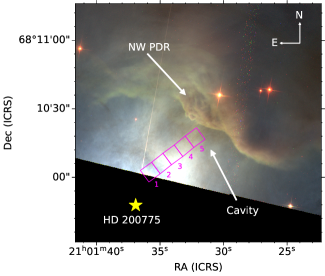
NGC 7023 is a bright well-studied reflection nebula located at a distance of 361 pc (Gaia Collaboration et al., 2016, 2018). It is illuminated by a spectroscopic binary Herbig B3Ve - B5 star HD 200775 having an effective temperature (Teff) of 17000 K (van den Ancker et al., 1997; Witt et al., 2006; Alecian et al., 2013). UV, optical, and IR observations have shown that the illuminating star blew away the surrounding gas, leaving an hourglass shaped cavity almost completely devoid of gas (Rogers et al., 1995; Fuente et al., 1996; Gerin et al., 1998). The edges of the cavity are delineated with PDRs 42′′ North-West (NW), 55′′ South-West (SW), and 150′′ East (E) of the illuminating star. Fig. 1 shows the NW PDR and the cavity blown by the illuminating star as observed in the three-colour Hubble Space telescope ACS image of NGC 7023. It is worth pointing out that the cavity shows a faint H glow, which rather than revealing the presence of ionized gas, is due to reflection by the dust of the H emission associated with accretion onto the central star (Witt et al., 2006).
NGC 7023 is one of the first objects in which both the mid-IR PAH and C60 emission was observed (Sellgren et al., 1983, 2010; Berné et al., 2013). While PAHs have been associated with both the cavity and the PDR of NGC 7023, C60 has only been observed in the cavity carved by the illuminating star (Berné et al., 2013). In this paper, we analyze the emission from PAHs and C60 using the mid-IR spectra obtained with the IR spectrograph (IRS, Houck et al., 2004) in the Short-Low (SL; spectral resolution 60–128, pixel scale 1.8′′; AORs:3871488 and 3871744) and Short-High (SH; spectral resolution 600, pixel scale 2.3′′; AOR:3871232) modules, onboard the Spitzer Space Telescope (Werner et al., 2004). We cleaned the data using cubism’s automatic bad pixel generation with and Minbad-fraction = 0.5 and 0.75 for the global and record bad pixels respectively. We did not apply background subtraction. We extracted spectra from five positions within the nebula at increasing distances from the illuminating star (see Fig. 1). The five positions are at projected distances of 13.2′′, 20.1′′, 27.4′′, 34.7′′, and 42.2′′ from the star with position 1 being the closest and position 5 being the farthest away from the star.
3 Application of the charge distribution based emission model to PAHs and fullerenes
In Paper I, we presented an emission model of PAHs that first calculates the charge distribution of a given PAH molecule and then uses it to calculate the emission spectrum in an astrophysical environment by weighing the spectrum of each charge state of a PAH molecule with its charge fraction and then summing them to obtain the total emission spectrum. By applying our emission model to five different PDRs with varying physical conditions, we demonstrated that the charge distribution emission model could successfully explain the characteristics of the PAH fluxes. In this paper, we extend the application of the charge distribution-based emission model to calculate the emission spectrum of C60. In this section, we first describe the calculation and the results of the charge distribution of C60 over a range of physical conditions characterized by the ionization parameter , followed by a discussion of the emission spectra of C60 in various charge states. We refer the reader to section 3 in Paper I for the analogous discussion on PAHs.
3.1 Charge distribution of C60
We calculated the charge distribution using the model described in Paper I. Essentially, the model calculates the charge distribution of molecular species using the principle of ionization balance between the photo-ionization rate and the electron recombination rate (or the electron attachment rate for anions), eventually yielding the following equation.
| (1) |
where is the fraction of molecular species in a charge state , and are the photo-ionization and electron recombination rates of a molecule in a charge state in units of s-1. For , is the electron attachment rate, . Applying the normalization condition, i.e. the sum of the fraction of all the charge states is equal to 1, yields the charge distribution of a molecule. For a detailed description of the model, see Paper I.
The charge distribution calculation relies on the various rates (, , and ), which depend on the molecular properties of chemical species as well as the physical conditions of the astrophysical environment. The specific rates adopted for PAHs are described in Paper I. Here we briefly describe our calculations of the rates for C60.
3.1.1 Photo-ionization rate
The photo-ionization rate () for C60 is calculated using the same expression as for PAHs using the molecular properties of C60 instead of PAHs. Calculating the ionization rate requires the following molecular parameters: the ionization potential (IP), the absorption cross-section, and the ionization yield.
The Ionization Potential: Table 1 lists the IPs of the C60 molecule adopted in this work. The IP dictates the number of charge states accessible to a molecule. Since we are applying the model to the cavity in NGC 7023 where hydrogen (H) ionizing photons (i.e. the photons with energy > 13.6 eV) are absent, the charge state will be accessible to C60 if the IP() is less than 13.6 eV. Based on the IPs listed in Table 1, the highest possible charge state accessible to C60 in the cavity of NGC 7023 is = 2.
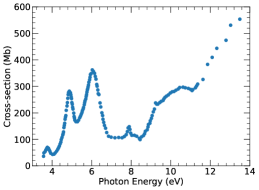
Absorption cross-section: Several experimental measurements of the photo-absorption cross-section exist in the literature (Berkowitz, 1999; Yasumatsu et al., 1996). These measurements, however, are inconsistent with one another. Kafle et al. (2008) identified and attributed the discrepancies to the use of inconsistent vapour pressure data of C60 in the analysis of these measurements. Kafle et al. (2008) compiled the photo-absorption cross-section data from 3.5-26 eV accounting for the necessary changes in the vapour pressure data, which we adopt in this work (see Fig. 9).
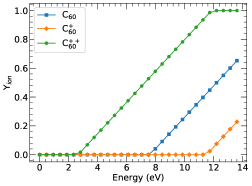
The ionization yield: The ionization yield for C60 has been calculated analytically by Yasumatsu et al. (1996) using their measurements of the photo-absorption cross-section. However, we did not use their ionization yield data because of the discrepancies in their photo-absorption cross-section, as stated above. Instead, we adopted the semi-empirical relation derived by Jochims et al. (1996) for calculating the ionization yield of PAHs to calculate the yield for C60 (see Fig. 10), assuming the ionization behaviour of C60 and PAHs is similar (Tielens, 2021).
3.1.2 Electron recombination rate
Since there is no experimentally measured value for the electron recombination rate coefficients for C60, we estimated it using the following expression (see equation 8.106 in Tielens (2021)) which is based on the collisional interaction between an electron and spherical species of radius = 0.9 N:
| (2) |
where NC = 60 are the number of the carbon atoms in a molecule, is the gas temperature in K, and is the density of electrons in an astrophysical environment in units of cm-3. We note that our adopted value of the electron recombination rate matches well with the recent theoretical estimates by Zettergren et al. (in preparation) using the models in Zettergren et al. (2012) and Lindén et al. (2016).
3.1.3 Electron attachment rate
The electron attachment rate coefficient has been determined experimentally as cm3 s-1 by Viggiano et al. (2010). We adopt this experimentally measured value and use the following expression to estimate the electron attachment rate in a given environment:
| (3) |
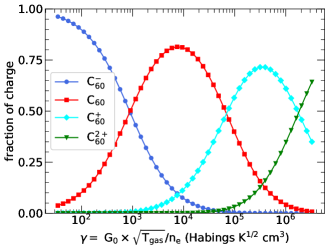
Fig. 2 shows the charge distribution of C60 as a function of the ionization parameter, = Habings K1/2 cm3. We point out that since the units of are long, we omit them for the remainder of our paper. The dense NW PDR in NGC 7023 is characterized by a radiation field of G0 = 2600 in the units of the Habings field (Chokshi et al., 1988), Tgas = 400 K (Fuente et al., 1999; Fleming et al., 2010), an electron abundance of 1.6 (Sofia et al., 2004) relative to the density of hydrogen, and gas density, ngas, of cm-3 (Chokshi et al., 1988; Joblin et al., 2010; Köhler et al., 2014; Bernard-Salas et al., 2015; Joblin et al., 2018), corresponding to a Habings K1/2 cm3. We expect the cavity region to have a higher FUV field, therefore higher G0, but to be much less dense. Hence, we have evaluated the charge distribution for ranging from 30 to Habings K1/2 cm3. We observe that anions dominate in low regions ( ), neutrals dominate in intermediate regions () and cations dominate in high regions (). It is worth pointing out that the general trend of the charge distribution of C60 is similar to that of PAHs (Figs. 2 and C1 in Paper I), although the precise numbers of the fraction of molecules in a given charge state vary.
3.2 Intrinsic Spectra of C60
| Charge state () | Eavg() [eV] |
|---|---|
| -1 | 5.65 |
| 0 | 6.22 |
| 1 | 6.47 |
| 2 | 6.50 |
We calculated the emission spectra of various charge states of C60 in NGC 7023 using the emission model presented in Paper I. We begin by calculating the average photon energy absorbed by the C60 molecule in different charge states (see equation 12 in Paper I). The resulting average energies are presented in Table 2. Following absorption of a photon, a molecule dissipates the absorbed energy by redistributing it across its various vibrational modes, eventually cascading down to the ground state by emitting in the IR. In our model, we include the possibility of the absorption of another photon while the molecule fully cascades down to the ground state. For a thorough description of the emission model, we refer the reader to section 2.2 of Paper I. Our model requires the photo-absorption cross-section and the frequencies and corresponding intensities of the vibrational modes of C60 in a given charge state as input molecular parameters to model the C60 emission in various charge states. The measurements of the photo absorption cross-section adopted in this work are described in section 3.1.1. We obtained the frequencies and the intensities of the vibrational modes of C60 in various charge states from Strelnikov et al. (2015). These authors measured the frequencies of the vibrational modes and the corresponding intrinsic intensities in a Neon matrix. Previous studies have shown that matrix interactions results in uncertainties in frequencies of 0.21% 0.63% (Jacox, 2002) and this accuracy is born out for PAHs (Mackie et al., 2018). Intensities of PAH vibrational transitions measured in matrix isolation studies agree within 18% 62% with the results of anharmonic density functional theory calculations (Mackie et al., 2018). We expect the uncertainties for C60 to be of the same order.
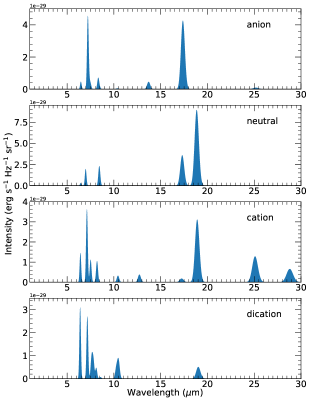
In Fig. 3, we present the calculated emission spectra of C60 in the anionic, neutral, cationic, and dicationic charge states for absorbed photon energies listed in Table 2. Here, we have convolved the modelled emission intensities with a Gaussian profile having a full width at half maximum, corresponding to a spectral resolution of 200, similar to Paper I. We note that the C60 anions, cations, and dications exhibit a rich spectrum with various features in the 5-30 m region. The relative intensities of the features in the 5-10 m versus 15-20 m range for all C60 charge states are quite interesting. While neutral C60 has weak features in the 5-10 m range compared to the 15-20 m range, the anionic, cationic, and dicationic C60 behave differently. The charged species have stronger features in the 5-10 m range compared to the features in the 15-20 m range, with the effect being most pronounced for C60 dications. This demonstrates that the charge state of C60 in the spectra observed in the interstellar medium can be probed by comparing the relative intensity of features in the 5-10 m range to those in the 15-20 m range. To this end, it is worth pointing out that PAHs also exhibit features in the mid-IR that are typically much stronger than the C60 features in interstellar spectra owing to the low abundance of C60 in the interstellar medium compared to PAHs (Berné & Tielens, 2012; Omont, 2016; Cami et al., 2018; Omont & Bettinger, 2021).
4 Comparison of the model results with the observations
 |
 |
In Paper I, we applied our emission model to a single position in a given PDR. Here, we apply our model to five different positions within one object. In this section, we compare our model results to the PAH and C60 observations in the cavity of NGC 7023. In particular, we compare the modelled intensities of the 6.2/11.2 ratio for PAHs and 7.0/19.0 for C60 to the observed ratios. First, in section 4.1, we describe the observations of PAHs and C60 in the cavity of NGC 7023 and the procedure we used to extract fluxes of the 6.2, 7.0, 11.2, and 19.0 m bands. We then compare the observed ratios to the model predictions in sections 4.2 and 4.3 for PAHs and C60 respectively.
4.1 Observations of PAHs and C60 in NGC 7023
| Position | PAH ratio 6.2/11.2 | C60 ratio 7.0/19.0 |
|---|---|---|
| 1 | 3.92 | 1.04 |
| 2 | 3.87 | 0.88 |
| 3 | 3.70 | – |
| 4 | 3.23 | – |
| 5 | 2.77 | – |
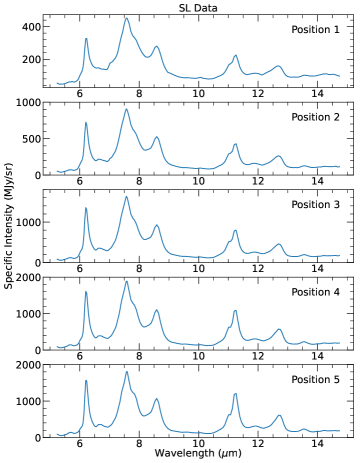
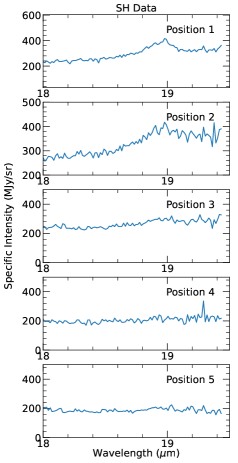
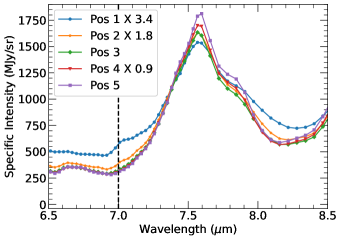
We considered five positions in the cavity of NGC 7023 at increasing distances from the illuminating star (see Fig. 1). In Figs. 4 and 5, we show the mid-IR spectra observed in the SL and the SH modules for the five positions. While the 6.2 and 11.2 m PAH bands are observed in all five positions, the 7.0 and 19.0 m C60 bands are only visible in positions 1 and 2. The 19.0 m C60 band is easily identified in positions 1 and 2 (see the right panel of Fig. 4); however, the 7.0 m band is blended with the 7.7 m PAH band and thus its characteristics are challenging to extract. To demonstrate the presence of the 7.0 m band in positions 1 and 2, we present a zoom-in of the spectra in the 6.5-8.5 m region for the five positions in Fig. 5. Furthermore, to distinguish the C60 band from the wing of the strong 7.7 m PAH band, we match the blue wing of the latter in the 7.35 - 7.5 m region by scaling the spectra of position 1, 2, and 4 by a factor of 3.4, 1.8, and 0.9 respectively. After scaling, we find that the spectra of positions 3, 4, and 5 match in the 6.5-7.5 m range, but not for positions 1 and 2, where we can now clearly observe the 7.0 m band of considerable and weak strength in positions 1 and 2 respectively.
To obtain the fluxes of the 6.2 and 11.2 m PAH bands, we first subtracted a spline continuum with anchor points roughly at 5.4, 5.8, 5.9, 6.9, 8.1, 8.9, 9.0, 9.1, 9.3, 9.5, 9.8, 10.2, 10.4, 11.6, 12.2, 13.2, 13.8 m. Then we integrated the continuum subtracted spectra in the 5.9-6.9 and 10.4-11.6 m regions to extract fluxes for the 6.2 and 11.2 m bands respectively. Table 3 shows the resulting PAH ratio of 6.2/11.2.
 |
 |
 |
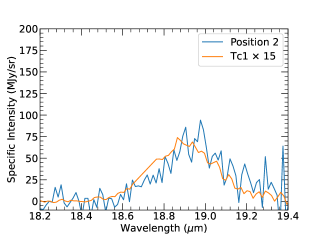 |
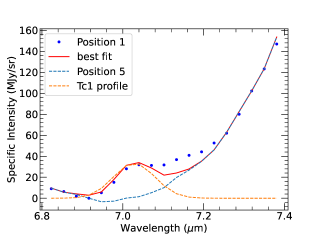
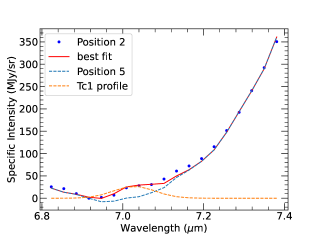
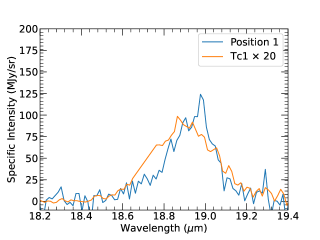
The flux of the 7.0 m C60 band is challenging to extract because it blends with the 7.7 m PAH band, which is lying on a rising continuum. Therefore, we first isolate the 7.0 m C60 band by subtracting the contribution from the PAHs and the continuum to the spectrum. To accomplish this, we fit the 6.8-7.4 m region in the continuum subtracted spectra with the profile of the 7.0 m C60 band as observed in the planetary nebula Tc1 by Cami et al. (2010) and the blue wing of the 7.7 m band from position 5 representing the contribution of PAHs (see top panels in Fig. 6). We note that in position 5, we do not observe any C60 band; thus, we interpret the 6.8-7.4 m region spectrum in position 5 as representing the contribution from PAHs. Finally, we integrate the fitted 7.0 m Tc1 profile to obtain the flux of the 7.0 m C60 band in positions 1 and 2. For the flux of the 19.0 m C60 band, we subtract a spline continuum with anchor points roughly at 15.1, 15.5, 15.9, 17.7, 18.5, and 19.4 m in the SH data. Then, we integrate the continuum subtracted spectra in the 18.5-19.4 m region to extract the flux of the 19.0 m C60 band. We also fitted the profile of the 19.0 m band as observed in Tc1, where PAHs are absent, to the SH data observed in NGC 7023. Fig. 6 shows the continuum subtracted 19.0 m band in NGC 7023 and the scaled 19.0 m band in Tc1. Table 3 lists the C60 ratio of 7.0/19.0 in positions 1 and 2.
Perusing the spectra in Fig. 4 and the intensity ratios in Table 3, we recognize that the variations in PAH emission features are very modest but systematic: as the positions approach the star, the 6.2/11.2 PAH ratio increases from 2.77 to 3.92. The 7.0/19.0 C60 ratio also increases from position 2 to 1 (Table 3). As we will discuss later, this suggests that the value in the cavity does not vary drastically.
4.2 Model results versus PAH observations
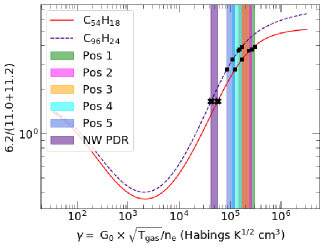
Following Paper I, we modelled the emission of circumcoronene (C54H18) and circumcircumcoronene (C96H24) in NGC 7023 and created curves of the 6.2/11.2 PAH ratio as a function of values. We chose these two compact PAH molecules to represent PAHs in the cavity of NGC 7023 because of their stability that can withstand harsh conditions closer to the star (Andrews et al., 2015; Croiset et al., 2016). Moreover, since PAHs undergo photoprocessing with changing physical conditions (e.g. Peeters et al., 2017; Murga et al., 2022), we chose two molecules to represent a range in the size of the molecules consistent with the determined PAH sizes for NGC 7023 derived by Croiset et al. (2016). Fig. 7 shows the modelled 6.2/11.2 vs curves with the observed values for the five positions studied in this paper. For reference, we also overplot the observed value of the 6.2/11.2 for the NW PDR (see Appendix C).
For each position, the comparison of the observed 6.2/11.2 PAH ratio with the theoretical curve results in two gamma values, one from circumcoronene and the other from circumcircumcoronene. The value derived from circumcoronene represents the upper limit, while that derived from circumcircumcoronene represents the lower limit. We find that, in the cavity, the observed values lie in the ranging from to 3 with position 1 exhibiting the highest value and position 5 exhibiting the lowest value. While the values predicted from the PAH observations systematically decrease as we go from position 1 to position 5, the change in the values is small given that the overall range of values is much wider. This result is consistent with the fact that the spectra of positions 1-5 in the cavity show modest variations (see Fig. 4).
We further note that the values in the five positions of the cavity do not differ significantly from the value of the dense NW PDR. The predicted values in the cavity are at most a factor of 7 larger than in the NW PDR, suggesting that the physical conditions in the NW PDR and the cavity do not differ significantly.
4.2.1 Physical conditions in NGC 7023
The comparison of the modelled 6.2/11.2 PAH ratio for circumcoronene with the observed ratio has shown that i) the values in the cavity only vary by a factor of 3 from position 5 to position 1 and ii) the values in the cavity and the dense NW PDR do not differ significantly from each other. However, these predicted values of in the cavity are not consistent with those estimated by Berné et al. (2015). These authors estimated values ranging from 4 to 7. Berné et al. (2015) adopted the projected distance as the location of the emitting PAHs, therefore upon approaching the star, the effect of geometric dilution diminishes (with ) and the radiation field, G0, increases from 7 Habings at 25′′ from the star to 2 Habings at 5′′ from the star. At the same time, the gas density, ngas, was assumed to drop from 104 cm-3 to 103 cm-3, and the higher abundance of C+ of 3 was assumed to calculate the electron abundance in the cavity. As a result, in their model, increases by a factor of 170 from 4 to 7 in the cavity.
To explain the significantly lower values of in the cavity derived in this work, we suggest that the emission from PAHs at the five positions between the dense PDR and the star does not originate from the projected distances. Therefore, the systematic increase in the radiation field, G0, caused by geometric dilution as positions approach the star and increase values, will not be relevant. Similarly, in this scenario, the gas density does not need to systematically decreases from position 1 to 5; the other assumption that resulted in higher values.
Finally, we note that the observations of C60 in positions 1 and 2 can reveal additional information about the change in the physical conditions in the cavity of NGC 7023. Andrews et al. (2016) modelled the dehydrogenation of circumcoronene and found that the PAH to carbon-cluster transition scales with . Assuming that C60 forms via dehydrogenation of PAHs, we can surmise that the change in the values from position 5 where only PAHs are observed, to position 1 where both PAHs and C60 are observed, is driven more by the changes in G0 than by changes in gas density.
4.3 Model results versus C60 observations
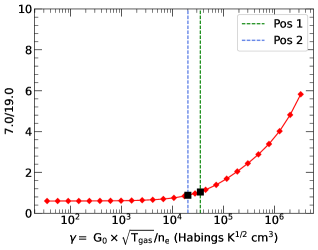
We next compare the C60 observations with the model calculations to investigate the charge state of C60 as well as to check if the values predicted from C60 observations are consistent with those predicted from PAH observations. Similar to PAHs, we create a curve of 7.0/19.0 C60 band ratio, and compare the observed values for two positions (see Fig. 8). We note that the values for positions 1 and 2 based on C60 ratios (3.5 for positions 1 and 2 for position 2) differ from those based on PAH observations by an order of magnitude. We discuss this disagreement between the values predicted from C60 and PAH ratios further in section 5. Nonetheless, the C60 predicted values are also much lower than the previous estimates (Berné et al., 2015) and similar to the NW PDR estimate, further confirming our conclusions that the emission in the cavity is not originating from projected distances (section 4.2.1).
For the values obtained in positions 1 and 2 based on C60 ratios, we use the Fig. 2 obtained from the charge distribution model to determine the charge fraction of C60 molecules in positions 1 and 2. We find that for positions 1 and 2, C60 is primarily neutral with 68% neutrals, 29% cations, and 2% anions in position 1 and 80 % neutrals, 14% cations, and 5% anions in position 2. In both positions, the dictations have negligible fractions. Berné et al. (2013) estimated an ionization fraction of 38% for C60 at a projected distance of 7.5′′ from the star in NGC 7023. In this work, positions 1 and 2 correspond to projected distances of 13.2′′ and 20.1′′ from the star. Thus, the theoretical prediction of the ionization fraction based on the charge distribution model matches well with the observations.
5 Discussion
The values in positions 1 and 2 predicted from C60 and PAH ratios differ by a factor of 10 (section 4.2 and 4.3). In this section, we will discuss two potential explanations for this discrepancy.
The first explanation is based on the uncertainties in the modelled 6.2/11.2 and 7.0/19.0 band ratios, which in turn are a result of the uncertainties in the charge distribution calculations. The charge distribution calculations depend on the ionization and electron recombination/attachment rates of PAHs and C60. While the molecular properties involved in the calculations of the ionization rate have been experimentally measured for both PAHs and C60, there is no such measurement for the recombination rate of astrophysically relevant PAHs and C60. Due to these gaps in laboratory data, we adopt theoretical expressions to calculate recombination/attachment rates. However, these theoretical expressions are only an approximation (Tielens, 2008). These approximations lead to uncertainties in the charge distribution calculations, which further translate into the band ratio calculations, and for this work, result in the systematic uncertainties in the derived values from the C60 and PAH observations. Therefore, similar to Paper I, we highlight that laboratory experiments to determine electron recombination and attachment rates of astrophysically relevant PAHs and C60 are highly desirable.
An alternate explanation is that PAHs and C60 emission are not co-spatial as the observed emission represents all emission along the line-of-sight, assuming that the uncertainty in the rates for our model calculations is not significant enough to account for the discrepancy in the values of a factor of 10. This interpretation is supported further by the fact that the C60 ionization fractions predicted using the C60 derived values agree well with the observations (see section 4.3), lending confidence in our C60 derived values. We note that the laboratory experiments to determine electron recombination and attachment rates will be useful in eliminating the uncertainty in the rates and validating the argument about the non-cospatial nature of PAH and C60 emission. In general, accurate molecular physics parameters carry the potential to transform PAHs and C60 observations into astronomers tools to study the Universe.
Finally, we note that, in principle, dehydrogenation can also affect the 6.2/11.2 ratio. However, Hony et al. (2001) concluded, based on the detailed analysis of the observed bands in the 11-14 m region in a wide variety of astronomical objects, that dehydrogenation has little influence on the bands in this region. This is because the transition from fully hydrogenated to fully dehydrogenated PAH species is very sharp in the G0/nHratio (Tielens, 2005; Andrews et al., 2016). Andrews et al. (2016) demonstrated that for G Habings (probable radiation field conditions in the cavity of NGC 7023), circumcoronene would fully dehydrogenate, while circumcircumcoronene would remain fully hydrogenated. It is worth pointing out that once the PAH is (almost) fully dehydrogenated, carbon loss and isomerization to fullerene cages occur (Berné & Tielens, 2012; Berné et al., 2015; Zhen et al., 2014). In that case, the interstellar PAH family in the cavity of NGC 7023 will be sharply bounded on the side of small-sized PAHs. At that (size) boundary, dehydrogenation will be important and may affect the 6.2/11.2 ratio. However, even only slightly larger PAHs will be fully hydrogenated, and our calculations well represent the expected 6.2/11.2 ratio. As the structures of the partially dehydrogenated PAHs and their IR characteristics have yet to be studied, we refrain from quantifying this aspect. However, we surmise that the effect will only be minor as - at any point - only a very limited range of PAH sizes will be affected.
6 Summary
We simulated the emission of polycyclic aromatic hydrocarbons (PAHs) and fullerene (C60) molecules in the cavity carved out by the star in the reflection nebula NGC 7023 using the charge distribution-based emission model presented in Paper I. The model first independently calculates the charge distribution of a given molecule and the emission spectrum in the various charge states of the molecule in an astrophysical environment using the experimentally measured or theoretically calculated molecular properties. The total IR emission from a molecule is then computed by weighting the spectrum of each charge state of a molecule with its corresponding charge fraction.
We discussed the results of our model’s application to PAHs in Paper I. In this paper, we discuss the results of our model’s application to C60 and compare the C60 results with the PAH results. The analysis of the charge distribution of C60 as a function of the ionization parameter demonstrates that the ionization behaviour of C60 is similar to that of PAHs, with anions dominating in low regions ( ), neutrals dominating in intermediate regions (), and cations dominating in high regions (). Using the emission spectrum of the C60 in the anionic, neutral, cationic, and dicationic states, we show that the relative intensity of the features in the 5-10 m versus 15-20 m range can be used as a tracer of the C60 charge state.
From the model calculations, we further computed the 6.2/11.2 band ratio for circumcoronene and circumcircumcoronene and 7.0/19.0 for C60 as a function of . We compared the modelled ratios to the observed ratios at five positions in the cavity of NGC 7023 and predicted the values at these positions. The values derived from PAH ratios at these five positions do not differ significantly. Furthermore, the PAH derived values are at most a factor of 7 higher than the value at the dense north-west (NW) PDR in NGC 7023 and much lower than the previous estimates in the cavity by Berné et al. (2015). Moreover, we find that the C60 derived values are also much lower than the previous estimate. Based on these findings, we propose that the PAH and C60 emission in the cavity does not originate from locations at the observed projected distances. Furthermore, if the C60 in positions 1 and 2 in the cavity form from the PAH dehydrogenation, the change in values in the cavity is driven more by G0 rather than by the gas density.
Finally, we note that our C60 derived values are a factor of 10 lower than the PAH derived values. We discuss two possible explanations for this discrepancy. In the first explanation, we attribute the differences in the two values to uncertainties in the electron recombination rates of PAHs and C60 for which we lack experimental measurements. In the second explanation, we argue that the PAHs and C60 are likely not co-spatial, resulting in different values from each model.
Acknowledgements
EP and JC acknowledge support from an NSERC Discovery Grant.
Data Availability
The data underlying this article will be shared on reasonable request to the corresponding author.
References
- Alecian et al. (2013) Alecian, E., et al. 2013, MNRAS, 429, 1001
- Allamandola et al. (1985) Allamandola, L. J., Tielens, A. G. G. M., & Barker, J. R. 1985, ApJ, 290, L25
- Andrews et al. (2015) Andrews, H., Boersma, C., Werner, M. W., Livingston, J., Allamandola, L. J., & Tielens, A. G. G. M. 2015, ApJ, 807, 99
- Andrews et al. (2016) Andrews, H., Candian, A., & Tielens, A. G. G. M. 2016, A&A, 595, A23
- Berkowitz (1999) Berkowitz, J. 1999, J. Chem. Phys., 111, 1446
- Bernard-Salas et al. (2015) Bernard-Salas, J., et al. 2015, A&A, 574, A97
- Berné et al. (2015) Berné, O., Montillaud, J., & Joblin, C. 2015, A&A, 577, A133
- Berné et al. (2013) Berné, O., Mulas, G., & Joblin, C. 2013, A&A, 550, L4
- Berné & Tielens (2012) Berné, O., & Tielens, A. G. G. M. 2012, Proceedings of the National Academy of Science, 109, 401
- Cami et al. (2010) Cami, J., Bernard-Salas, J., Peeters, E., & Malek, S. E. 2010, Science, 329, 1180
- Cami et al. (2018) Cami, J., Peeters, E., Bernard-Salas, J., Doppmann, G., & De Buizer, J. 2018, Galaxies, 6, 101
- Campbell et al. (2015) Campbell, E. K., Holz, M., Gerlich, D., & Maier, J. P. 2015, Nature, 523, 322
- Chokshi et al. (1988) Chokshi, A., Tielens, A. G. G. M., Werner, M. W., & Castelaz, M. W. 1988, ApJ, 334, 803
- Cordiner et al. (2019) Cordiner, M. A., et al. 2019, ApJ, 875, L28
- Croiset et al. (2016) Croiset, B. A., Candian, A., Berné, O., & Tielens, A. G. G. M. 2016, A&A, 590, A26
- Dresselhaus et al. (1996) Dresselhaus, M. S., Dresselhaus, G., & Eklund, P. C. 1996, Science of Fullerenes and Carbon Nanotubes: Their Properties and Applications (Academic Press)
- Fleming et al. (2010) Fleming, B., France, K., Lupu, R. E., & McCandliss, S. R. 2010, ApJ, 725, 159
- Fuente et al. (1996) Fuente, A., Martin-Pintado, J., Neri, R., Rogers, C., & Moriarty-Schieven, G. 1996, A&A, 310, 286
- Fuente et al. (1999) Fuente, A., Martín-Pintado, J., Rodríguez-Fernández, N. J., Rodríguez-Franco, A., de Vicente, P., & Kunze, D. 1999, ApJ, 518, L45
- Gaia Collaboration et al. (2016) Gaia Collaboration et al. 2016, A&A, 595, A1
- Gaia Collaboration et al. (2018) Gaia Collaboration et al. 2018, A&A, 616, A1
- Galliano et al. (2008) Galliano, F., Madden, S. C., Tielens, A. G. G. M., Peeters, E., & Jones, A. P. 2008, ApJ, 679, 310
- Gerin et al. (1998) Gerin, M., Phillips, T. G., Keene, J., Betz, A. L., & Boreiko, R. T. 1998, ApJ, 500, 329
- Hony et al. (2001) Hony, S., Van Kerckhoven, C., Peeters, E., Tielens, A. G. G. M., Hudgins, D. M., & Allamandola, L. J. 2001, A&A, 370, 1030
- Houck et al. (2004) Houck, J. R., et al. 2004, ApJS, 154, 18
- Huang et al. (2014) Huang, D.-L., Dau, P. D., Liu, H.-T., & Wang, L.-S. 2014, J. Chem. Phys., 140, 224315
- Jacox (2002) Jacox, M. E. 2002, Chem. Soc. Rev., 31, 108
- Joblin et al. (2010) Joblin, C., et al. 2010, A&A, 521, L25
- Joblin et al. (2018) Joblin, C., et al. 2018, A&A, 615, A129
- Jochims et al. (1996) Jochims, H. W., Baumgaertel, H., & Leach, S. 1996, A&A, 314, 1003
- Kafle et al. (2008) Kafle, B. P., Katayanagi, H., Prodhan, M. S. I., Yagi, H., Huang, C., & Mitsuke, K. 2008, Journal of the Physical Society of Japan, 77, 014302
- Köhler et al. (2014) Köhler, M., et al. 2014, A&A, 569, A109
- Leger & Puget (1984) Leger, A., & Puget, J. L. 1984, A&A, 500, 279
- Lindén et al. (2016) Lindén, F., Cederquist, H., & Zettergren, H. 2016, The Journal of Chemical Physics, 145, 194307
- Mackie et al. (2018) Mackie, C. J., et al. 2018, Phys. Chem. Chem. Phys., 20, 1189
- Murga et al. (2022) Murga, M. S., Kirsanova, M. S., Wiebe, D. S., & Boley, P. A. 2022, MNRAS, 509, 800
- Omont (2016) Omont, A. 2016, A&A, 590, A52
- Omont & Bettinger (2021) Omont, A., & Bettinger, H. F. 2021, A&A, 650, A193
- Peeters et al. (2017) Peeters, E., Bauschlicher, Charles W., J., Allamandola, L. J., Tielens, A. G. G. M., Ricca, A., & Wolfire, M. G. 2017, ApJ, 836, 198
- Rogers et al. (1995) Rogers, C., Heyer, M. H., & Dewdney, P. E. 1995, ApJ, 442, 694
- Sellgren et al. (1983) Sellgren, K., Werner, M. W., & Dinerstein, H. L. 1983, ApJ, 271, L13
- Sellgren et al. (2010) Sellgren, K., Werner, M. W., Ingalls, J. G., Smith, J. D. T., Carleton, T. M., & Joblin, C. 2010, ApJ, 722, L54
- Sidhu et al. (2022) Sidhu, A., Tielens, A. G. G. M., Peeters, E., & Cami, J. 2022, MNRAS, 514, 342
- Sofia et al. (2004) Sofia, U. J., Lauroesch, J. T., Meyer, D. M., & Cartledge, S. I. B. 2004, ApJ, 605, 272
- Støchkel & Andersen (2013) Støchkel, K., & Andersen, J. U. 2013, J. Chem. Phys., 139, 164304
- Strelnikov et al. (2015) Strelnikov, D., Kern, B., & Kappes, M. M. 2015, A&A, 584, A55
- Tielens (2005) Tielens, A. G. G. M. 2005, The Physics and Chemistry of the Interstellar Medium (Cambridge University Press)
- Tielens (2008) Tielens, A. G. G. M. 2008, ARA&A, 46, 289
- Tielens (2021) —. 2021, Molecular Astrophysics (Cambridge University Press)
- van den Ancker et al. (1997) van den Ancker, M. E., The, P. S., Tjin A Djie, H. R. E., Catala, C., de Winter, D., Blondel, P. F. C., & Waters, L. B. F. M. 1997, A&A, 324, L33
- Viggiano et al. (2010) Viggiano, A. A., Friedman, J. F., Shuman, N. S., Miller, T. M., Schaffer, L. C., & Troe, J. 2010, J. Chem. Phys., 132, 194307
- Werner et al. (2004) Werner, M. W., et al. 2004, ApJS, 154, 1
- Witt et al. (2006) Witt, A. N., Gordon, K. D., Vijh, U. P., Sell, P. H., Smith, T. L., & Xie, R.-H. 2006, ApJ, 636, 303
- Yasumatsu et al. (1996) Yasumatsu, H., Kondow, T., Kitagawa, H., Tabayashi, K., & Shobatake, K. 1996, J. Chem. Phys., 104, 899
- Yoo et al. (1992) Yoo, R. K., Ruscic, B., & Berkowitz, J. 1992, The Journal of Chemical Physics, 96, 911
- Zettergren et al. (2012) Zettergren, H., Forsberg, B. O., & Cederquist, H. 2012, Phys. Chem. Chem. Phys., 14, 16360
- Zhen et al. (2014) Zhen, J., Castellanos, P., Paardekooper, D. M., Linnartz, H., & Tielens, A. G. G. M. 2014, ApJ, 797, L30
Appendix A Absorption cross-section
Appendix B Ionization yield
Appendix C Spectrum at the NW PDR
Fig. 11 shows the spectrum observed in the SL module at the NW PDR front in reflection nebula NGC 7023. The PAH bands at 6.2 and 11.2 m are clearly observed in the spectrum. For this spectrum, the PAH ratio of 6.2/11.2 is 1.68.