Constraints on Magnetic Braking from the G8 Dwarf Stars 61 UMa and Cet
Abstract
During the first half of their main-sequence lifetimes, stars rapidly lose angular momentum to their magnetized winds, a process known as magnetic braking. Recent observations suggest a substantial decrease in the magnetic braking efficiency when stars reach a critical value of the Rossby number, the stellar rotation period normalized by the convective overturn timescale. Cooler stars have deeper convection zones with longer overturn times, reaching this critical Rossby number at slower rotation rates. The nature and timing of the transition to weakened magnetic braking has previously been constrained by several solar analogs and two slightly hotter stars. In this Letter, we derive the first direct constraints from stars cooler than the Sun. We present new spectropolarimetry of the old G8 dwarf Cet from the Large Binocular Telescope, and we reanalyze a published Zeeman Doppler image of the younger G8 star 61 UMa, yielding the large-scale magnetic field strengths and morphologies. We estimate mass-loss rates using archival X-ray observations and inferences from Ly measurements, and we adopt other stellar properties from asteroseismology and spectral energy distribution fitting. The resulting calculations of the wind braking torque demonstrate that the rate of angular momentum loss drops by a factor of 300 between the ages of these two stars (1.4–9 Gyr), well above theoretical expectations. We summarize the available data to help constrain the value of the critical Rossby number, and we identify a new signature of the long-period detection edge in recent measurements from the Kepler mission.
The Astrophysical Journal Letters
1 Introduction
Seven years after the suggestion that weakened magnetic braking (WMB) might explain the anomalously rapid rotation of old Kepler field stars (van Saders et al., 2016), the debate has shifted from whether this transition actually occurs, to the specific physical mechanisms that might drive it. Although the original sample included just 21 stars, the analysis was subsequently extended (van Saders et al., 2019) to reproduce the properties of 34,000 Kepler field stars with measured rotation periods (McQuillan et al., 2014). The truncated distribution of rotation periods that led to the WMB hypothesis has now been confirmed using a sample of 94 stars with rotation rates measured from asteroseismology (Hall et al., 2021), and the predicted overdensity of stars with a range of ages near the long-period edge of the distribution has been confirmed (David et al., 2022) using more than 10,000 stars with precise effective temperatures from LAMOST spectra (Xiang et al., 2019).
Evidence quickly surfaced that the interruption to stellar rotational evolution was probably caused by an underlying transition in stellar magnetism. The influence of magnetic morphology on the rate of angular momentum loss from stellar winds (Réville et al., 2015; Garraffo et al., 2015) led to the initial suggestion that WMB could be driven by a shift from a simple dipole to higher order fields (van Saders et al., 2016). Preliminary support for this interpretation was identified (Metcalfe et al., 2016) in measurements of the large-scale magnetic field strength and morphology from Zeeman Doppler imaging (Petit et al., 2008), and was reinforced by the associated changes in stellar activity cycles (Metcalfe & van Saders, 2017). Targeted observations for an evolutionary sequence of two stars slightly hotter than the Sun (Metcalfe et al., 2019, 2021), followed by a sequence of several solar analogs (Metcalfe et al., 2022), provided the first direct evidence of a magnetic morphology shift in older solar-type stars and placed new constraints on the relative importance of various contributions to the overall reduction in the wind braking torque. Such constraints may ultimately help to identify a corresponding transition in the stellar dynamo.
In this Letter, we present the first direct constraints on the nature and timing of WMB from stars that are cooler than the Sun. In Section 2, we describe spectropolarimetric observations for an evolutionary sequence of two G8 dwarf stars, and we adopt other stellar properties largely from published sources. In Section 3, we use the prescription of Finley & Matt (2018) to estimate the wind braking torque for each star, confirming a dramatic decrease in the rate of angular momentum loss as seen previously for solar analogs and slightly hotter stars. Finally, we summarize the available constraints and we identify a new signature of the long-period detection edge in recent measurements from the Kepler mission.
2 Observations
2.1 Spectropolarimetry
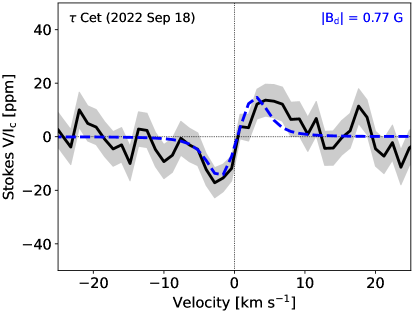
We observed Cet on 2022 September 18 from the 28.4 m Large Binocular Telescope (LBT) using the Potsdam Echelle Polarimetric and Spectroscopic Instrument (PEPSI; Strassmeier et al., 2015). The instrumental setup and data reduction methods were identical to those described in Metcalfe et al. (2019), and we employed the least-squares deconvolution technique (LSD; Kochukhov et al., 2010) to derive precise mean intensity and polarization profiles. We obtained the line data required for the LSD analysis from the VALD database (Ryabchikova et al., 2015), adopting stellar atmospheric parameters from Brewer et al. (2016) and km s-1 from Saar & Osten (1997). Because Cet has a 50 year record of constant chromospheric activity (Baum et al., 2022) and appears to have a nearly pole-on orientation that minimizes rotational modulation (Gray & Baliunas, 1994), we assume that our snapshot observation is representative of the mean stellar activity level. The value of for Cet is above recent solar minimum levels (Egeland et al., 2017), although the actual value may be slightly lower due to its sub-solar metallicity (Saar & Testa, 2012). There is no observational evidence to suggest that the low activity level of Cet represents a magnetic grand minimum, it appears similar to other constant activity stars like CrB and 16 Cyg A & B.
By combining the information from 1,463 metal lines deeper than 5% of the continuum, we obtained a mean Stokes profile with an uncertainty of 5.8 ppm (see Figure 1). The data yielded a statistically marginal detection of the circular polarization signature for Cet, with a mean longitudinal magnetic field = G. Following Metcalfe et al. (2019) we modeled the line profile assuming an axisymmetric dipole magnetic field with the inclination fixed at (see Section 2.2), yielding a formal best fit G. Note that the derived magnetic field strength does not depend strongly on the inclination (e.g., G for ).
| 61 UMa | Cet | Sources | |
|---|---|---|---|
| (K) | 1 | ||
| M/H (dex) | 1 | ||
| (dex) | 1 | ||
| (mag) | 2 | ||
| (dex) | 2 | ||
| (days) | 2 | ||
| (G) | 3 | ||
| (G) | 3 | ||
| (G) | 3 | ||
| ( erg s-1) | 4 | ||
| Mass-loss rate () | 4, 5 | ||
| Mass () | 4, 6 | ||
| Radius () | 4, 7 | ||
| Luminosity () | 4 | ||
| Age (Gyr) | 8, 9 | ||
| Torque ( erg) | 10 |
To complement the new LBT observations with another star along an evolutionary sequence, we reanalyzed a Zeeman Doppler imaging (ZDI) map for the younger G8 star 61 UMa (See et al., 2019), which was obtained near the minimum of its 4 yr activity cycle. This ZDI map was based on 21 Stokes measurements obtained in 2008 with the NARVAL spectropolarimeter on the 2.03 m Télescope Bernard Lyot. Folsom et al. (2018) provide details of the ZDI inversion procedure, while Jardine et al. (2013) discuss the connection between the resulting magnetic fields at the surface and in the corona. The wind braking prescription of Finley & Matt (2018) requires the polar strengths of axisymmetric dipole, quadrupole, and octupole magnetic fields () as input, but the observed ZDI map contains both axisymmetric and non-axisymmetric components. We followed the procedure described in Metcalfe et al. (2022) to calculate the equivalent polar field strengths for use with the wind braking prescription. This procedure captures the radial dependence of the magnetic flux for all components of the field, which is what matters for angular momentum loss. The results of this analysis for 61 UMa are shown in Table 2.1. There may be slight inconsistencies between the observed ZDI map and the equivalent polar field strengths derived in this way, but Jardine et al. (2013) demonstrated that the differences arise from non-radial components of the field, which induce near-surface magnetic stresses without altering the source surface of the stellar wind. Consequently, they are unimportant for our estimation of the wind braking torque.
2.2 Stellar Properties
In addition to the magnetic field strength and morphology, the wind braking prescription of Finley & Matt (2018) also depends on the mass-loss rate (), the rotation period (), and the stellar radius and mass (). For Cet we adopted the upper limit on the mass-loss rate from Wood (2018), which was obtained directly from Ly measurements. The rotation period was determined from time series observations of chromospheric activity by Baliunas et al. (1996), while the radius was inferred from interferometry (von Braun & Boyajian, 2017) and the mass was adopted from asteroseismology (Teixeira et al., 2009). The stellar age was derived from an analysis of these same asteroseismic observations by Tang & Gai (2011). Our estimate of the inclination in Section 2.1 was calculated from the values of , , and .
For 61 UMa, we determined the X-ray luminosity () from the ROSAT All-Sky Bright Source Catalog (Boller et al., 2016), following the approach described in Ayres & Buzasi (2022). When combined with the radius inferred from the spectral energy distribution (SED), following the procedures described in Stassun et al. (2017, 2018), this led to an X-ray flux per unit surface area that could be used to estimate the mass-loss rate from the empirical relation (Wood et al., 2021). The rotation period of 61 UMa was determined from chromospheric activity measurements (Baliunas et al., 1996), while the mass was estimated from the SED radius using the empirical mass-radius relation from eclipsing binaries (Torres et al., 2010). The age of 61 UMa was determined from the gyrochronology relation of Barnes (2007), which remains valid for younger stars.
3 Wind Braking Torque
We now have all of the observational inputs that are required to estimate the wind braking torque using the prescription of Finley & Matt (2018)111https://github.com/travismetcalfe/FinleyMatt2018. For 61 UMa we have the equivalent polar field strengths () from our reanalysis of the published ZDI map. For Cet we have the snapshot observation from LBT, which we model with an axisymmetric dipole field inclined at (below we assess the influence of adopting a different inclination or morphology). We estimate the mass-loss rate () from the X-ray flux for 61 UMa, but we infer it directly from Ly measurements for Cet (below we assess the influence of the higher mass-loss rate estimated from the X-ray flux for Cet). The remaining parameters () do not produce substantial uncertainties in the torque. Using the parameter values listed in Table 2.1 for our fiducial models, we find that the wind braking torque decreases by a factor of 300 between the ages of 61 UMa and Cet (1.4–9 Gyr).
By changing the wind braking prescription one parameter at a time between the values for 61 UMa and Cet, we can evaluate the relative importance of various contributions to the overall decrease in the torque. We find almost equal contributions from the evolutionary change in mass-loss rate (%) and the difference in magnetic field strength and morphology (%), with smaller contributions from the evolutionary change in rotation period (%) and differences in the stellar radius (%) and mass (%). Rotational evolution models use the Rossby number (Ro) to scale the mass-loss rate as and the magnetic field strength as , where is the photospheric pressure (van Saders & Pinsonneault, 2013), but they do not directly account for changes in magnetic morphology. Considering either WMB or standard spin-down, these models predict a decrease in the wind braking torque of less than a factor of 15, with a smaller contribution from the evolutionary change in the mass-loss rate (% to %), and a difference from the change in magnetic field strength (% to %) that suggests a substantial contribution from a shift in magnetic morphology.
The large decrease in wind braking torque between the ages of 61 UMa and Cet is robust against changes to our assumptions about the magnetic field and mass-loss rate. For example, Cet has a debris disk with a measured inclination (; Lawler et al., 2014). If we assume that the rotation axis of Cet shares this same inclination, the inferred dipole field would be slightly stronger ( G) and produce a corresponding increase in the wind braking torque (0.029 erg, %). If we keep but model the Stokes profile as an axisymmetric quadrupole or octupole field, enhanced geometric cancelation would lead us to infer a stronger field ( G or G). For a quadrupole field this ultimately leads to a lower wind braking torque (0.023 erg, %), because the stronger field does not compensate for the shorter effective lever-arm. By contrast, the much stronger octupole field would ultimately produce a higher torque (0.043 erg, %) despite the much shorter effective lever-arm, although this scenario is incompatible with the measured chromospheric activity level. Finally, if we use the X-ray flux of Cet to estimate its mass-loss rate (0.46 ) following the same approach as for 61 UMa, the wind braking torque would more than double (0.058 erg, %). However, even if we adopt both the octupole field and the higher mass-loss rate for Cet (contradicting the actual measurements of and shown in Table 2.1), the wind braking torque would still be 50 times weaker than for 61 UMa.
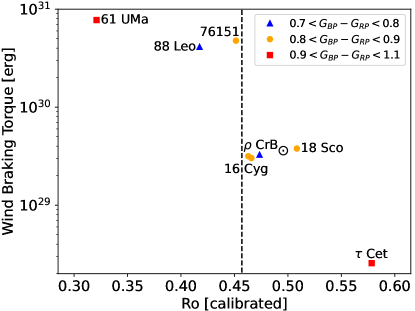
We can assess the empirical value of the critical Rossby number (Rocrit) by plotting the available estimates of wind braking torque on a common scale. We use the asteroseismic calibration of Corsaro et al. (2021) for the convective overturn timescale to calculate Ro for each star in our sample based on the Gaia color. The results are shown in Figure 2 with points grouped by Gaia color, corresponding to solar analogs (yellow circles), and hotter (blue triangles) or cooler stars (red squares). Our empirical constraint on the critical value of Ro on this scale (Ro) is shown with a vertical dashed line. Our new estimates of the wind braking torque for 61 UMa and Cet extend the range of Ro sampled by our spectropolarimetric targets, and show the highest and lowest torques of the ensemble. By construction, the more active stars in our sample (61 UMa, 88 Leo, HD 76151) are all below Rocrit while the less active stars (16 Cyg A & B, CrB, 18 Sco, Cet) are all above it. The Rossby numbers of HD 76151 (Ro = 0.451) and 16 Cyg A (Ro = 0.463) currently define the empirical constraint on the value of Rocrit shown above, falling slightly below the solar value (Ro⊙ = 0.496) where we plot the solar wind braking torque determined by Finley et al. (2018).
4 Discussion
Using spectropolarimetric constraints on the large-scale magnetic field, we have demonstrated that the rate of angular momentum loss due to stellar winds decreases by a factor of 300 between the ages of two stars that are cooler than the Sun, dominated by contributions from both the mass-loss rate and the magnetic field strength and morphology. Relative to previous comparisons for solar analogs and slightly hotter stars, there is a larger evolutionary gap between 61 UMa and Cet, which would naturally lead to a more substantial decrease in the strength of magnetic braking across Rocrit. On the other hand, the estimated wind braking torque for Cet could be even smaller because the mass-loss rate from Wood (2018) is an upper limit. For the solar analogs 16 Cyg A & B, Metcalfe et al. (2022) estimated a factor of 15–16 decrease in the wind braking torque relative to HD 76151, while for the slightly hotter star CrB, Metcalfe et al. (2021) estimated a factor of 13 decrease relative to 88 Leo. However, these estimates all adopted upper limits on the magnetic field strengths from statistical non-detections of the Stokes signatures, so the actual decreases could be larger. Our marginal detection of the Stokes signature for Cet was facilitated by lower noise levels and by the nearly pole-on orientation, which minimizes geometric cancelation for an axisymmetric dipole magnetic field.
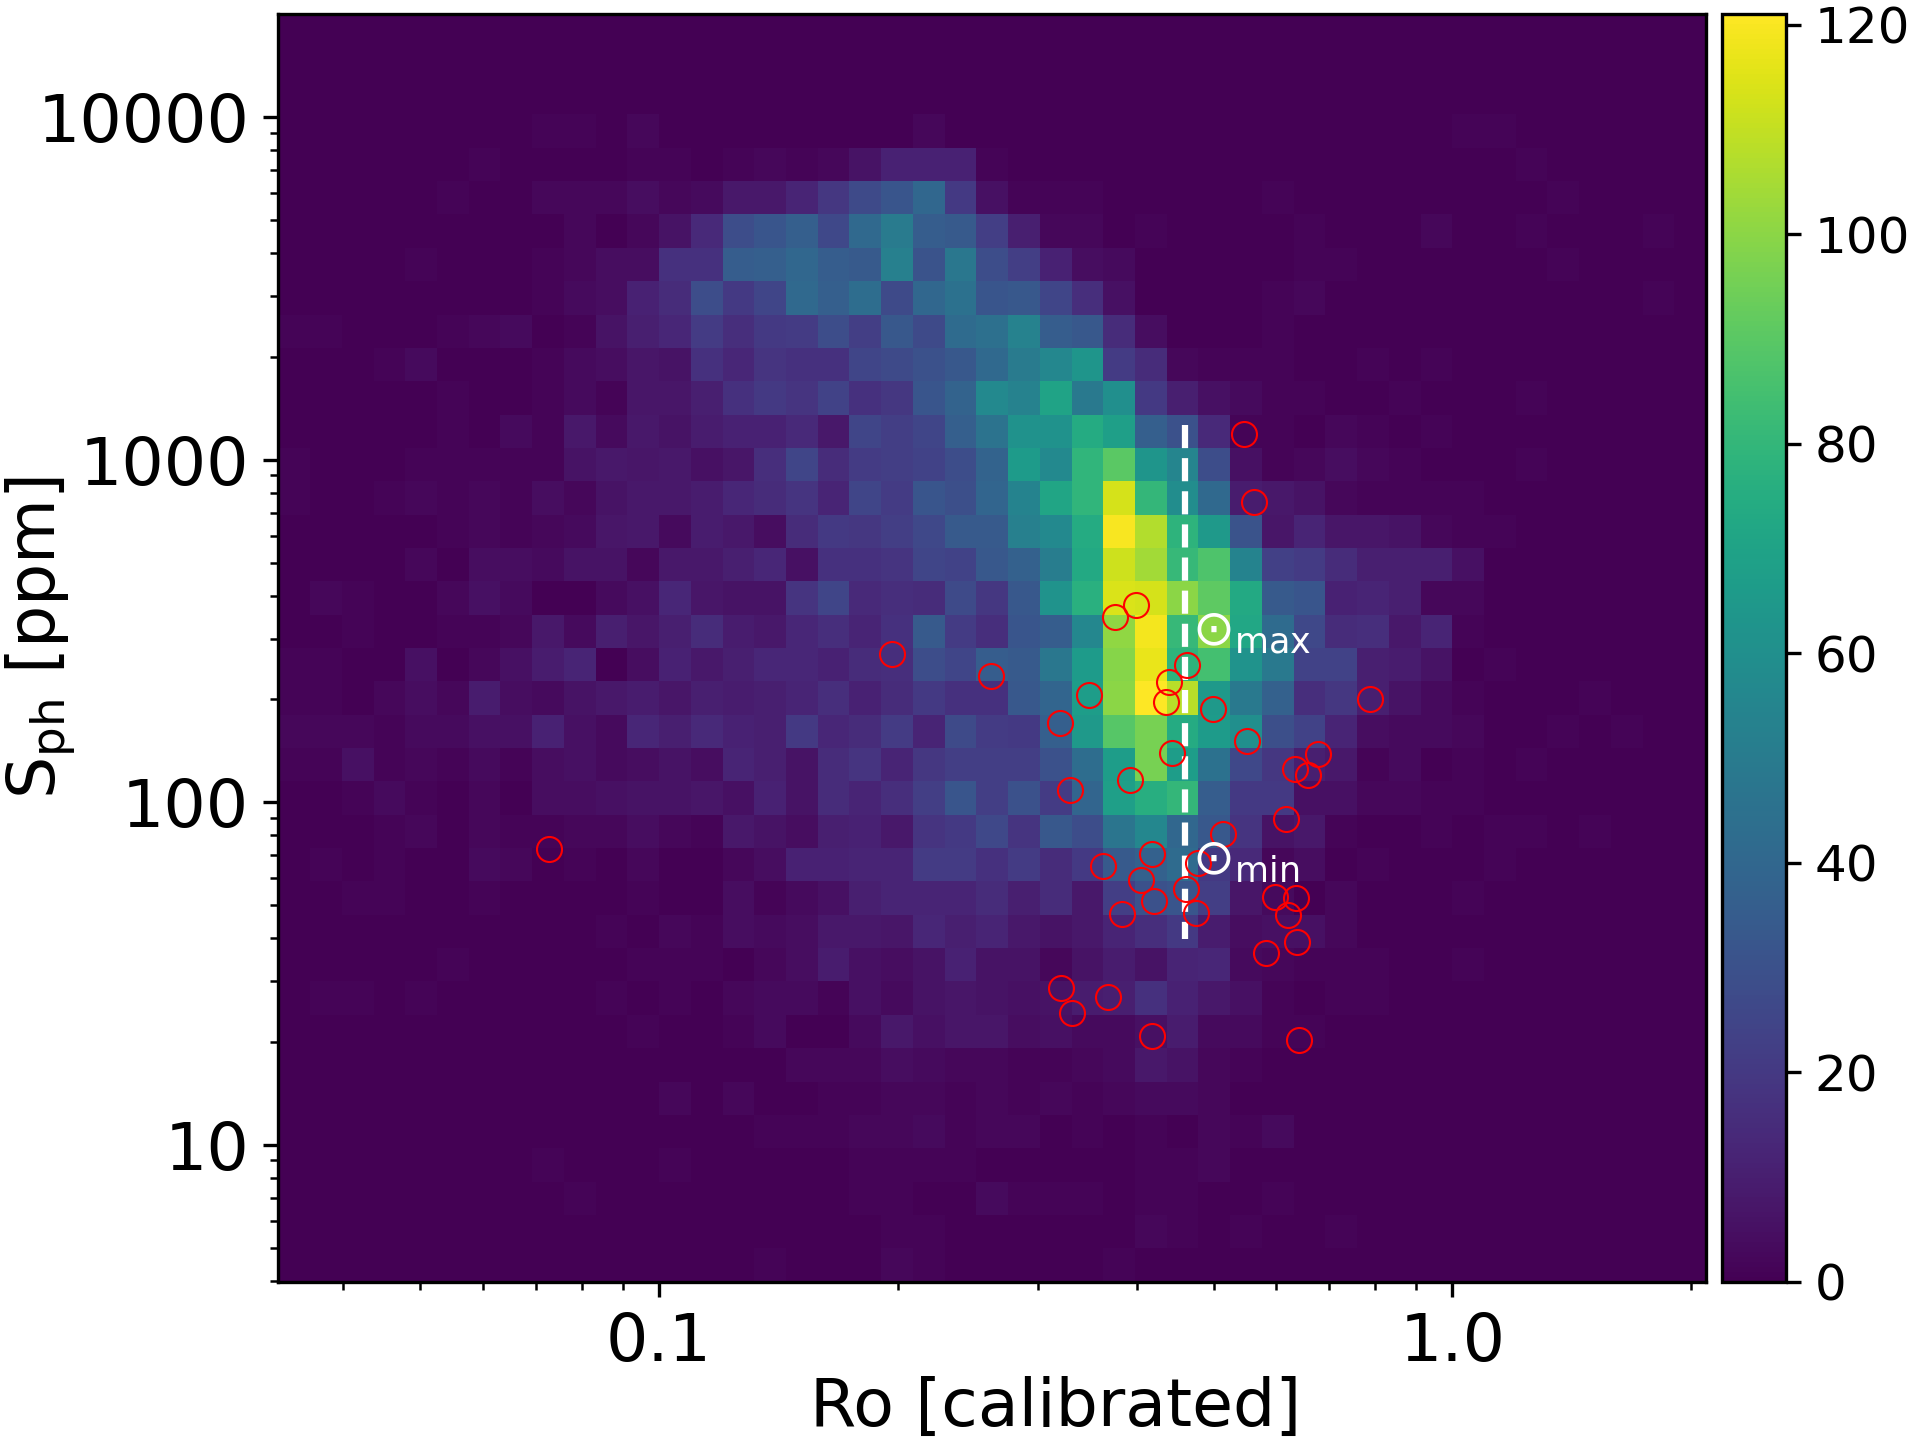
From a sample of 40,000 Kepler targets with measured rotation periods, Corsaro et al. (2021) plotted a photometric proxy for stellar activity (; Mathur et al., 2014) against the newly calibrated values of Ro (see Figure 3). Despite the vertical dispersion at all values of Ro due to activity cycles and inclination effects, the highest density of stars in their sample (yellow and green) appears at Ro slightly below the solar value, showing a broad range of stellar activity levels (Santos et al., 2019, 2021) at nearly constant Ro. This feature may correspond to the long-period edge of the Kepler sample (McQuillan et al., 2014; van Saders et al., 2019), where stellar activity gradually declines with age at roughly constant rotation period during the second half of main-sequence lifetimes (Metcalfe et al., 2016; Metcalfe & van Saders, 2017). However, the relatively uniform distribution of bright asteroseismic targets (red circles) across our empirical value of Rocrit and toward low values of suggests that the detection of rotational modulation may simply be less efficient at higher Ro and lower (van Saders et al., 2019; Masuda, 2022).
Future spectropolarimetry promises to extend our measurements to even cooler K-type stars, and provide additional constraints on the empirical value of Rocrit. Snapshot observations at LBT are already planned for HD 103095 and HD 166620. Although HD 103095 is an early K-type star, its extremely low metallicity (=; Valenti & Fischer, 2005) gives it the shallower convection zone of a late G-type star similar to Cet. With an activity cycle of 7.3 years and a measured rotation period of 31 days (Baliunas et al., 1995, 1996), it will sample intermediate conditions (Ro = 0.542) between 61 UMa and Cet and probe how the driving mechanisms of WMB change over time. Observations of HD 166620 will complement our existing measurements of the active star 40 Eri, probing the magnetic morphology of a K-type star that recently entered a grand magnetic minimum (Baum et al., 2022; Luhn et al., 2022). Archival ZDI maps of younger K-type stars like Eri (Jeffers et al., 2014) and 61 Cyg A (Boro Saikia et al., 2016) from the BCool collaboration will provide additional context for our understanding of how magnetic braking shapes the lives of other Sun-like stars.
Special thanks to Steve Saar, Ângela Santos, and Brian Wood for helpful exchanges. T.S.M. acknowledges support from the U.S. National Science Foundation (AST-2205919). A.J.F. and A.A.V. have received funding from the European Research Council (ERC) under the European Union’s Horizon 2020 research and innovation programme (grant agreements No 810218 WHOLESUN, and No 817540 ASTROFLOW). O.K. acknowledges support by the Swedish Research Council (project 2019-03548) and the Royal Swedish Academy of Sciences. V.S. acknowledges support from the European Space Agency (ESA) as an ESA Research Fellow. The LBT is an international collaboration among institutions in the United States, Italy and Germany. LBT Corporation partners are: The University of Arizona on behalf of the Arizona Board of Regents; Istituto Nazionale di Astrofisica, Italy; LBT Beteiligungsgesellschaft, Germany, representing the Max-Planck Society, The Leibniz Institute for Astrophysics Potsdam, and Heidelberg University; The Ohio State University, and The Research Corporation, on behalf of The University of Notre Dame, University of Minnesota and University of Virginia.
References
- Ayres & Buzasi (2022) Ayres, T., & Buzasi, D. 2022, ApJS, 263, 41
- Baliunas et al. (1996) Baliunas, S., Sokoloff, D., & Soon, W. 1996, ApJ, 457, L99
- Baliunas et al. (1995) Baliunas, S. L., et al. 1995, ApJ, 438, 269
- Barnes (2007) Barnes, S. A. 2007, ApJ, 669, 1167
- Baum et al. (2022) Baum, A. C., Wright, J. T., Luhn, J. K., & Isaacson, H. 2022, AJ, 163, 183
- Boller et al. (2016) Boller, T., Freyberg, M. J., Trümper, J., Haberl, F., Voges, W., & Nandra, K. 2016, A&A, 588, A103
- Boro Saikia et al. (2016) Boro Saikia, S., et al. 2016, A&A, 594, A29
- Brewer et al. (2016) Brewer, J. M., Fischer, D. A., Valenti, J. A., & Piskunov, N. 2016, ApJS, 225, 32
- Corsaro et al. (2021) Corsaro, E., Bonanno, A., Mathur, S., García, R. A., Santos, A. R. G., Breton, S. N., & Khalatyan, A. 2021, A&A, 652, L2
- David et al. (2022) David, T. J., Angus, R., Curtis, J. L., van Saders, J. L., Colman, I. L., Contardo, G., Lu, Y., & Zinn, J. C. 2022, ApJ, 933, 114
- Egeland et al. (2017) Egeland, R., Soon, W., Baliunas, S., Hall, J. C., Pevtsov, A. A., & Bertello, L. 2017, ApJ, 835
- Finley & Matt (2018) Finley, A. J., & Matt, S. P. 2018, ApJ, 854, 78
- Finley et al. (2018) Finley, A. J., Matt, S. P., & See, V. 2018, ApJ, 864, 125
- Folsom et al. (2018) Folsom, C. P., et al. 2018, MNRAS, 474, 4956
- Garraffo et al. (2015) Garraffo, C., Drake, J. J., & Cohen, O. 2015, ApJ, 813, 40
- Gray & Baliunas (1994) Gray, D. F., & Baliunas, S. L. 1994, ApJ, 427, 1042
- Hall et al. (2021) Hall, O. J., et al. 2021, Nature Astronomy, 5, 707
- Jardine et al. (2013) Jardine, M., Vidotto, A. A., van Ballegooijen, A., Donati, J. F., Morin, J., Fares, R., & Gombosi, T. I. 2013, MNRAS, 431, 528
- Jeffers et al. (2014) Jeffers, S. V., Petit, P., Marsden, S. C., Morin, J., Donati, J. F., & Folsom, C. P. 2014, A&A, 569, A79
- Kochukhov et al. (2010) Kochukhov, O., Makaganiuk, V., & Piskunov, N. 2010, A&A, 524, A5
- Lawler et al. (2014) Lawler, S. M., et al. 2014, MNRAS, 444, 2665
- Luhn et al. (2022) Luhn, J. K., Wright, J. T., Henry, G. W., Saar, S. H., & Baum, A. C. 2022, ApJ, 936, L23
- Masuda (2022) Masuda, K. 2022, ApJ, 937, 94
- Mathur et al. (2014) Mathur, S., et al. 2014, A&A, 562, A124
- McQuillan et al. (2014) McQuillan, A., Mazeh, T., & Aigrain, S. 2014, ApJS, 211, 24
- Metcalfe et al. (2016) Metcalfe, T. S., Egeland, R., & van Saders, J. 2016, ApJ, 826, L2
- Metcalfe et al. (2019) Metcalfe, T. S., Kochukhov, O., Ilyin, I. V., Strassmeier, K. G., Godoy-Rivera, D., & Pinsonneault, M. H. 2019, ApJ, 887, L38
- Metcalfe & van Saders (2017) Metcalfe, T. S., & van Saders, J. 2017, Sol. Phys., 292, 126
- Metcalfe et al. (2021) Metcalfe, T. S., et al. 2021, ApJ, 921, 122
- Metcalfe et al. (2022) —. 2022, ApJ, 933, L17
- Petit et al. (2008) Petit, P., et al. 2008, MNRAS, 388, 80
- Réville et al. (2015) Réville, V., Brun, A. S., Matt, S. P., Strugarek, A., & Pinto, R. F. 2015, ApJ, 798, 116
- Ryabchikova et al. (2015) Ryabchikova, T., Piskunov, N., Kurucz, R. L., Stempels, H. C., Heiter, U., Pakhomov, Y., & Barklem, P. S. 2015, Phys. Scr, 90, 054005
- Saar & Osten (1997) Saar, S. H., & Osten, R. A. 1997, MNRAS, 284, 803
- Saar & Testa (2012) Saar, S. H., & Testa, P. 2012, in Comparative Magnetic Minima: Characterizing Quiet Times in the Sun and Stars, ed. C. H. Mandrini & D. F. Webb, Vol. 286, 335–345
- Santos et al. (2021) Santos, A. R. G., Breton, S. N., Mathur, S., & García, R. A. 2021, ApJS, 255, 17
- Santos et al. (2019) Santos, A. R. G., García, R. A., Mathur, S., Bugnet, L., van Saders, J. L., Metcalfe, T. S., Simonian, G. V. A., & Pinsonneault, M. H. 2019, ApJS, 244, 21
- See et al. (2019) See, V., et al. 2019, ApJ, 876, 118
- Stassun et al. (2017) Stassun, K. G., Collins, K. A., & Gaudi, B. S. 2017, AJ, 153, 136
- Stassun et al. (2018) Stassun, K. G., Corsaro, E., Pepper, J. A., & Gaudi, B. S. 2018, AJ, 155, 22
- Strassmeier et al. (2015) Strassmeier, K. G., et al. 2015, Astronomische Nachrichten, 336, 324
- Tang & Gai (2011) Tang, Y. K., & Gai, N. 2011, A&A, 526, A35
- Teixeira et al. (2009) Teixeira, T. C., et al. 2009, A&A, 494, 237
- Torres et al. (2010) Torres, G., Andersen, J., & Giménez, A. 2010, A&A Rev., 18, 67
- Valenti & Fischer (2005) Valenti, J. A., & Fischer, D. A. 2005, ApJS, 159, 141
- van Saders et al. (2016) van Saders, J. L., Ceillier, T., Metcalfe, T. S., Silva Aguirre, V., Pinsonneault, M. H., García, R. A., Mathur, S., & Davies, G. R. 2016, Nature, 529, 181
- van Saders & Pinsonneault (2013) van Saders, J. L., & Pinsonneault, M. H. 2013, ApJ, 776, 67
- van Saders et al. (2019) van Saders, J. L., Pinsonneault, M. H., & Barbieri, M. 2019, ApJ, 872, 128
- von Braun & Boyajian (2017) von Braun, K., & Boyajian, T. 2017, Extrasolar Planets and Their Host Stars (New York: Springer)
- Wood (2018) Wood, B. E. 2018, in Journal of Physics Conference Series, Vol. 1100, Journal of Physics Conference Series, 012028
- Wood et al. (2021) Wood, B. E., et al. 2021, ApJ, 915, 37
- Xiang et al. (2019) Xiang, M., et al. 2019, ApJS, 245, 34