Jellyfish galaxies with the IllustrisTNG simulations – When, where, and for how long does ram pressure stripping of cold gas occur?
1Max-Planck-Institut für Astronomie, Königstuhl 17, D-69117 Heidelberg, Germany
2Zentrum für Astronomie der Universität Heidelberg, ITA, Albert Ueberle Str. 2, D-69120 Heidelberg, Germany
3Centre for Astrophysics and Planetary Science, Racah Institute of Physics, The Hebrew University, Jerusalem 91904, Israel
4University College London, Gower St, London WC1E 6BT, UK
Abstract
Jellyfish galaxies are the prototypical examples of satellite galaxies undergoing strong ram pressure stripping (RPS). We analyze the evolution of 535 unique, first-infalling jellyfish galaxies from the TNG50 cosmological hydrodynamical galaxy simulation. These have been visually inspected to be undergoing RPS sometime in the past 5 billion years (since ), have satellite stellar masses and live in hosts with at . We quantify the cold gas K) removal using the Lagrangian Monte Carlo tracer particles, confirming that for these jellyfish, RPS is the dominant driver of cold gas loss after infall (Friends-of-Friends halo membership). Half of these jellyfish are completely devoid of cold gas by , and these galaxies have earlier infall times and smaller satellite-to-host mass ratios than those that still have some gas today. RPS can act on jellyfish galaxies over long time scales of Gyr. Jellyfish in more massive hosts are impacted by RPS for a shorter time span and, at a fixed host halo mass, jellyfish with less cold gas at infall, lower stellar masses at , and fewer orbits by the time of total stripping have shorter RPS time spans. While RPS may act for long periods of time, the peak RPS period – where at least 50 per cent of the total RPS occurs – begins within Gyr of infall and lasts Gyr. During this period, the jellyfish are at host-centric distances between , illustrating that much of RPS occurs at large distances from the host galaxy. Interestingly, jellyfish continue forming stars until they have lost per cent of their cold gas. For groups and clusters in TNG50 , jellyfish galaxies deposit more cold gas () into halos than exist in them at , demonstrating that jellyfish, and in general satellite galaxies, are a significant source of cold gas accretion.
keywords:
galaxies: formation – galaxies: evolution – galaxies: haloes – methods: numerical1 Introduction
At a fixed galaxy stellar mass, observations show that there are a number of differences between field and satellite galaxies (satellites for short). Namely with the Sloan Digital Sky Survey (SDSS), it has been shown that the population of satellites has a higher quenched fraction, lower (specific) star-formation rates (SFR, or sSFR), and redder colors compared to central galaxies of the same stellar mass (Peng et al., 2010; Peng et al., 2012; Wetzel et al., 2012). Moreover, satellite galaxies exhibit on average lower neutral HI gas fractions, elevated gas metallicites, reduced circumgalactic X-ray emission, and suppressed active galactic nucleus (AGN) activity compared to their mass-matched analogs in the field (Giovanelli et al., 1985; Brown et al., 2016; Maier et al., 2019a, b).
These observational trends suggest that, in addition to the secular processes of galaxy evolution, satellite galaxies undergo additional environmental phenomena. It is generally accepted that ram-pressure stripping (RPS) is one of the most impactful among such environmental phenomena (Gunn et al., 1972, see Boselli et al., 2022 for a recent review).
Ram pressure is proportional to , where is the density of the surrounding ambient medium, and is the relative velocity of the infalling galaxy (or a given parcel of gas) and the ambient medium. This effect is expected to increase with host mass () because satellites in more massive hosts tend to fall in with higher velocities and more massive hosts tend to have denser circumgalactic media (CGM)111Throughout this paper, we define the CGM to be the entire multiphase gaseous medium around central galaxies regardless of their stellar or total host mass, unless explicitly referred to as intragroup medium (IGrM) for galaxy groups () or intracluster medium (ICM) for clusters ()., also depending on the stellar and AGN feedback of the central galaxy. Moreover for a given host, this pressure should increase with decreasing distance both because the surrounding medium is denser at smaller radii, and galaxies move faster when they are deeper into their hosts’ potential wells. These expected results are broadly consistent with observations (e.g., Maier et al., 2019b; Roberts et al., 2019) With respect to removing single parcels of gas from the infalling satellite, RPS acts against the satellite’s gravitational restoring force, dominated by the stellar body. Consequently the effectiveness of RPS is expected to increase with decreasing satellite stellar mass.
For a given satellite galaxy, ram pressure first strips the hot or less gravitationally-bound gas, a feature that has been inferred observationally (Balogh & Morris, 2000) and assumed in semi-analytic models (Cole et al., 2000; Somerville et al., 2008; Lagos et al., 2018; Ayromlou et al., 2019). With respect to the satellite’s intersteller medium (ISM), RPS is thought to work outside-in, as observationally inferred via truncated disks (Warmels et al., 1988; Cayatte et al., 1990, 1994; Vollmer et al., 2001; Lee et al., 2022a) and leading to outside-in quenching (Schaefer et al., 2017, 2019; Bluck et al., 2020; Vulcani et al., 2020; Wang et al., 2023, contra: Wang, 2022).
Ram pressure is also thought to compress the satellite’s gas, especially on the galaxy’s leading edge. This is inferred to cause temporary periods of enhanced star formation (Gavazzi et al., 2001; Vulcani et al., 2018; Roberts & Parker, 2020; Roberts et al., 2022) and AGN activity (Poggianti et al., 2017a; Maier et al., 2022; Peluso et al., 2022, contra: Roman-Oliveira et al., 2019). In turn, the feedback from star-formation and AGN may lower the binding energy of the ISM gas, potentially facilitating RPS (Garling et al., 2022). Thus the physical mechanism responsible for the loss of satellite ISM gas is likely a combination of RPS and stellar/AGN-driven outflows. However, despite these temporary periods of enhanced star-formation and AGN activity, RPS ultimately leads to the removal of ISM gas and and to the quenching en masse of satellites (e.g., Wetzel et al., 2013; Maier et al., 2019a; Boselli et al., 2022, see Cortese et al., 2021 for a recent review). We note, however, that the timescales related to environmental quenching are highly debated, ranging from short Myr to long Gyr times, typically but not always measured from the first crossing (Cortese et al., 2021, and references therein).
Conversely, satellite galaxies are not only affected by their environment, but they have the potential to perturb the ambient medium in a number of ways. First, the bulk motion of the satellites is thought to affect the CGM kinematics by inducing turbulence and by bringing in gravitational energy, which heats the CGM via dynamical friction and shocks (e.g., Dekel & Birnboim, 2008). As the infalling galaxies may travel faster than the ambient medium’s sound speed, some satellites are also expected to create bow shocks in CGM (Yun et al., 2019). This shock and the induced turbulence may act as perturbations, triggering the warm/hot K CGM to cool into K clouds. Moreover, the gas that has been ram-pressure stripped, namely the satellite’s cold ISM, is expected to be deposited into the host’s halo. For groups and clusters with many satellite galaxies, there could be a substantial amount of accreted halo gas originating from the stripped satellites. However, this has never been quantified. Finally, while currently still highly debated, such cold gas clouds in the CGM, regardless of their origin, could be long-lived (e.g., Li et al., 2020; Sparre et al., 2020; Gronke et al., 2022; Fielding & Bryan, 2022), and satellite-induced cold gas clouds may be a source of cold gas found in the CGM today (Nelson et al., 2020; Rodríguez et al., 2022).
Observed satellites that have been visually identified to be undergoing RPS have been called jellyfish galaxies (from now on, jellyfish for short), where their stellar bodies (the jellyfish heads) remain relatively unperturbed but their gaseous disks are being stripped in the direction opposite of motion, forming the jellyfish tails (e.g., Bekki, 2009; Ebeling et al., 2014; McPartland et al., 2016). These jellyfish and their stripped tails are multi-wavelength objects and have been observed in the X-ray, UV, optical, and radio (e.g., Gavazzi & Jaffe, 1987; Gavazzi et al., 2001; Kenney et al., 2004; Sun et al., 2006; Cortese et al., 2006; Smith et al., 2010; Jáchym et al., 2017; Poggianti et al., 2019; Ignesti et al., 2022). However, many of these studies have focused on single or a few objects. Observers have recently pushed for systematic surveys of jellyfish galaxies, where the largest uniform samples come from the GAs Stripping Phenomena in galaxies with MUSE (GASP; Poggianti et al., 2017b, 51 galaxies), the LOw-Frequency ARray (LOFAR; Shimwell et al., 2017; Roberts et al., 2021, 60), and the OSIRIS Mapping of Emission-line Galaxies (OMEGA; Chies-Santos et al., 2015; Roman-Oliveira et al., 2019, 70). The largest statistical studies of jellyfish galaxies come from Smith et al. (2022), who use 106 jellyfish with radio continuum emission, and from Peluso et al. (2022), who use 131 jellyfish with information on the central ionizing mechanism.
Despite these recent efforts, unanswered questions still remain, such as: when with respect to infall and where with respect to the host does RPS begin; for how long does RPS act; did the quenched, low gas-fraction galaxies we see today go through a jellyfish phase; what determines how long RPS will take to totally remove a jellyfish’s gas; how does the RPS of jellyfish galaxies compare to other satellites; where is the stripped gas being deposited, and more generally, how much cold gas do satellites bring into their hosts’ halos?
The answers to these questions can provide both insights into environmental quenching of satellites as well as important implications for the evolution of massive hosts and their surrounding halo gas in the context of the cosmic baryon cycle. While we have reached a general consensus that RPS is necessary to remove satellite cold gas and reproduce the aforementioned environmental trends, the timescales and locations of RPS and the associated satellite quenching remain highly debated. Thus, we turn to numerical simulations with temporal evolution to investigate the satellite-host interaction. Idealized simulations have been able to reproduce jellyfish by imposing an external wind, mimicking the RPS felt during infall through the CGM (e.g., Tonnesen & Bryan, 2009; Lee et al., 2020; Choi et al., 2022). With the perspective of satellite quenching, zoom-in and full cosmological hydrodynamical galaxy simulations have studied more or less explicitly the RPS of satellites, finding a wide range of quenching timescales that broadly agree with observational inference (e.g., Bahé & McCarthy, 2015; Jung et al., 2018; Wright et al., 2019; Yun et al., 2019; Oman et al., 2021; Rodríguez et al., 2022; Samuel et al., 2022; Pallero et al., 2022; Wright et al., 2022). However, quantitative and statistically-robust simulation predictions as to the timings and modalities of RPS are still missing. And so, to understand satellite quenching, we must first quantify the effects of perhaps its most relevant process: RPS.
In this work, we use the high-resolution, Mpc magneto-hydrodynamical simulation TNG50 from the IllustrisTNG project (TNG thereafter) to study the satellite-host interaction in a realistic, cosmological context. In particular, we aim at quantifying when, where, and for how long the RPS of cold gas occurs. We focus on cold gas as this is the source of star formation in galaxies and because its existence within the otherwise hot CGM of massive halos is a compelling open question. Moreover, we focus on jellyfish galaxies because these are satellites that, by identification and hence by construction, are surely undergoing RPS. Among its advantages, the TNG50 simulation produces thousands of galaxies and hosts ranging over 5 orders of magnitude in mass, and it naturally includes many environmental processes such as pre-processing, tidal stripping, harassment, strangulation, starvation, and RPS. The TNG simulations do not include possibly-relevant environmental processes such as viscous momentum transfer or thermal evaporation, and there is no explicit modelling of the multiphase ISM (Cowie et al., 1977; Nulsen et al., 1982, see Zinger et al., 2018 and Kukstas et al., 2022 for discussions). However, the TNG model has been shown to return satellite populations whose quenched fractions and gas content are broadly consistent with observations (e.g. Stevens et al., 2019; Donnari et al., 2021; Stevens et al., 2021).
In a companion paper, Zinger et al. (in prep.) visually inspect TNG satellites to identify jellyfish galaxies using the citizen science Cosmological Jellyfish project hosted on Zooniverse, yielding an unprecedented number of more than 500 unique, first-infalling jellyfish galaxies in the TNG50 volume alone. In another companion paper, Göller et al. (in prep.) study the star-formation activity of these jellyfish both temporally and across populations. In this paper, we employ the Monte Carlo Lagrangian tracer particles to follow the flows of gas in and out of satellite galaxies, quantifying the cold gas sources and sinks across cosmic time from when the galaxies were centrals, through their jellyfish phases, and in some cases until they have been completely stripped of all gas, existing as quenching, gas-poor satellites at .
We begin by introducing the methods (§ 2), namely by summarizing the TNG50 simulation (§ 2.1), the Cosmological Jellyfish project (§ 2.2), the tracking of galaxies across cosmic time (§ 2.3), how we employ the tracer particles (§ 2.5.1), and how we identify the onset and end of RPS (§ 2.5.2). We then present our main results (§ 3). We start by comparing the jellyfish galaxy population with that of the inspected and general satellite populations (§ 3.1), and then comment on the origin of the jellyfish gaseous tails (§ 3.2). After quantifying the strength of RPS post infall (§ 3.3) and determining a subsample of jellyfish that are devoid of cold gas at (§ 3.4), we answer when, where, and for how long RPS occurs (§ 3.5, 3.6). We then discuss how we can generalize our jellyfish results with all satellites (§ 4.1), connect the the cold gas loss via RPS with satellite quenching times (§ 4.2, and illustrate how much and where cold gas is deposited via RPS into halos (§ 4.3). We end by summarizing the main results and restating the conclusions (§ 5).
Unless otherwise noted, all analysis including the TNG simulations adopt a CDM cosmology consistent with the Planck Collaboration et al. (2016) results: , where is the Hubble parameter, and the subscript “0" denotes that the quantity is measured today.
2 Methods and TNG50 jellyfish galaxies
2.1 The TNG50 simulation
The IllustrisTNG project222https://www.tng-project.org/ (Pillepich et al., 2018b; Nelson et al., 2018; Naiman et al., 2018; Marinacci et al., 2018; Springel et al., 2018) consists of a series of cosmological volume CDM simulations, including gravity + magneto-hydrodynamics (MHD) and a galaxy formation model (see method papers for details: Weinberger et al., 2017; Pillepich et al., 2018a). Here we briefly summarize the TNG simulations.
The TNG production simulations come in three volumes of side lengths comoving Mpc, hereafter referred to as TNG50, TNG100, and TNG300 respectively. The TNG galaxy formation model was designed at the resolution of TNG100, which includes resolution elements with baryon mass resolution of . The large volume TNG300 has resolution elements with mass resolution . The high resolution TNG50 simulation has resolution elements with mass resolution (Nelson et al., 2019b; Pillepich et al., 2019). The minimum gas resolution in TNG50 at , i.e. the smallest non-vanishing gas mass in any given galaxy, is . These three simulations are publicly available in their entirety (Nelson et al., 2019a). In this paper, we work exclusively with the highest-resolution run TNG50.
The TNG simulations evolve gas, cold dark matter, stars, and super massive black holes (SMBHs) within an expanding universe, based on a self-gravity + MHD framework (Pakmor et al., 2011; Pakmor & Springel, 2013) using the Arepo code (Springel, 2010). The fluid dynamics employ a Voronoi tessellation to spatially discretize the gas. The TNG gas has a temperature floor at K, and the relationship between temperature and density for star-forming gas is determined via an effective equation of state from Springel & Hernquist (2003). For this analysis, we manually set the temperature of star-forming gas to K. The TNG galaxy evolution models includes the following processes: gas heating and cooling; star formation; stellar population evolution + chemical enrichment from AGB stars and type Ia + II supernovae; supernova driven outflows and winds (Pillepich et al., 2018a); formation, merging, and growth of SMBHs; and two main SMBH hole feedback modes: a thermal ‘quasar’ mode, and a kinetic ‘wind’ mode (Weinberger et al., 2017). The TNG simulations have reproduced many observational relations and properties across orders of magnitude in mass and spatial scales.
The group and galaxy catalogs consist of the dark matter halos and the dark matter plus baryonic galaxies. The dark matter halos are defined using the Friends-of-Friends (FoF) algorithm with a linking length , run only using the dark matter particles (Davis et al., 1985). Then the baryonic components are connected to the same halos as their closest dark matter particle. Throughout this paper, we use “FoF", “group", “FoF group", “halo" synonymously. The galaxies are identified using the subfind algorithm, which connect together all gravitationally bound particles (Springel et al., 2001; Dolag et al., 2009). We use the terms “subhalo" and “galaxy" synonymously even though, in general, subfind objects may contain no stars and/or gas whatsoever. Typically albeit not always, the most massive subhalo within a halo is the “main" or “primary subhalo", also called the “central galaxy"; all other subhalos within a halo are “satellites". In all cases, we only consider subhalos of a cosmological origin as defined by the SubhaloFlag in Nelson et al. (2019a).
2.2 The Cosmological Jellyfish project on Zooniverse
In this paper, we study jellyfish galaxies and identify them based on the classification of the Zooniverse Cosmological Jellyfish project333https://www.zooniverse.org/projects/apillepich/cosmological-jellyfish.
The Zooniverse Cosmological Jellyfish project presented images of TNG50 and TNG100 satellite galaxies on the Zooniverse platform for classification by citizen scientists. Here several thousand volunteers underwent a training session and classified whether the given galaxy resembles a jellyfish or not (Zinger et al., in prep.).
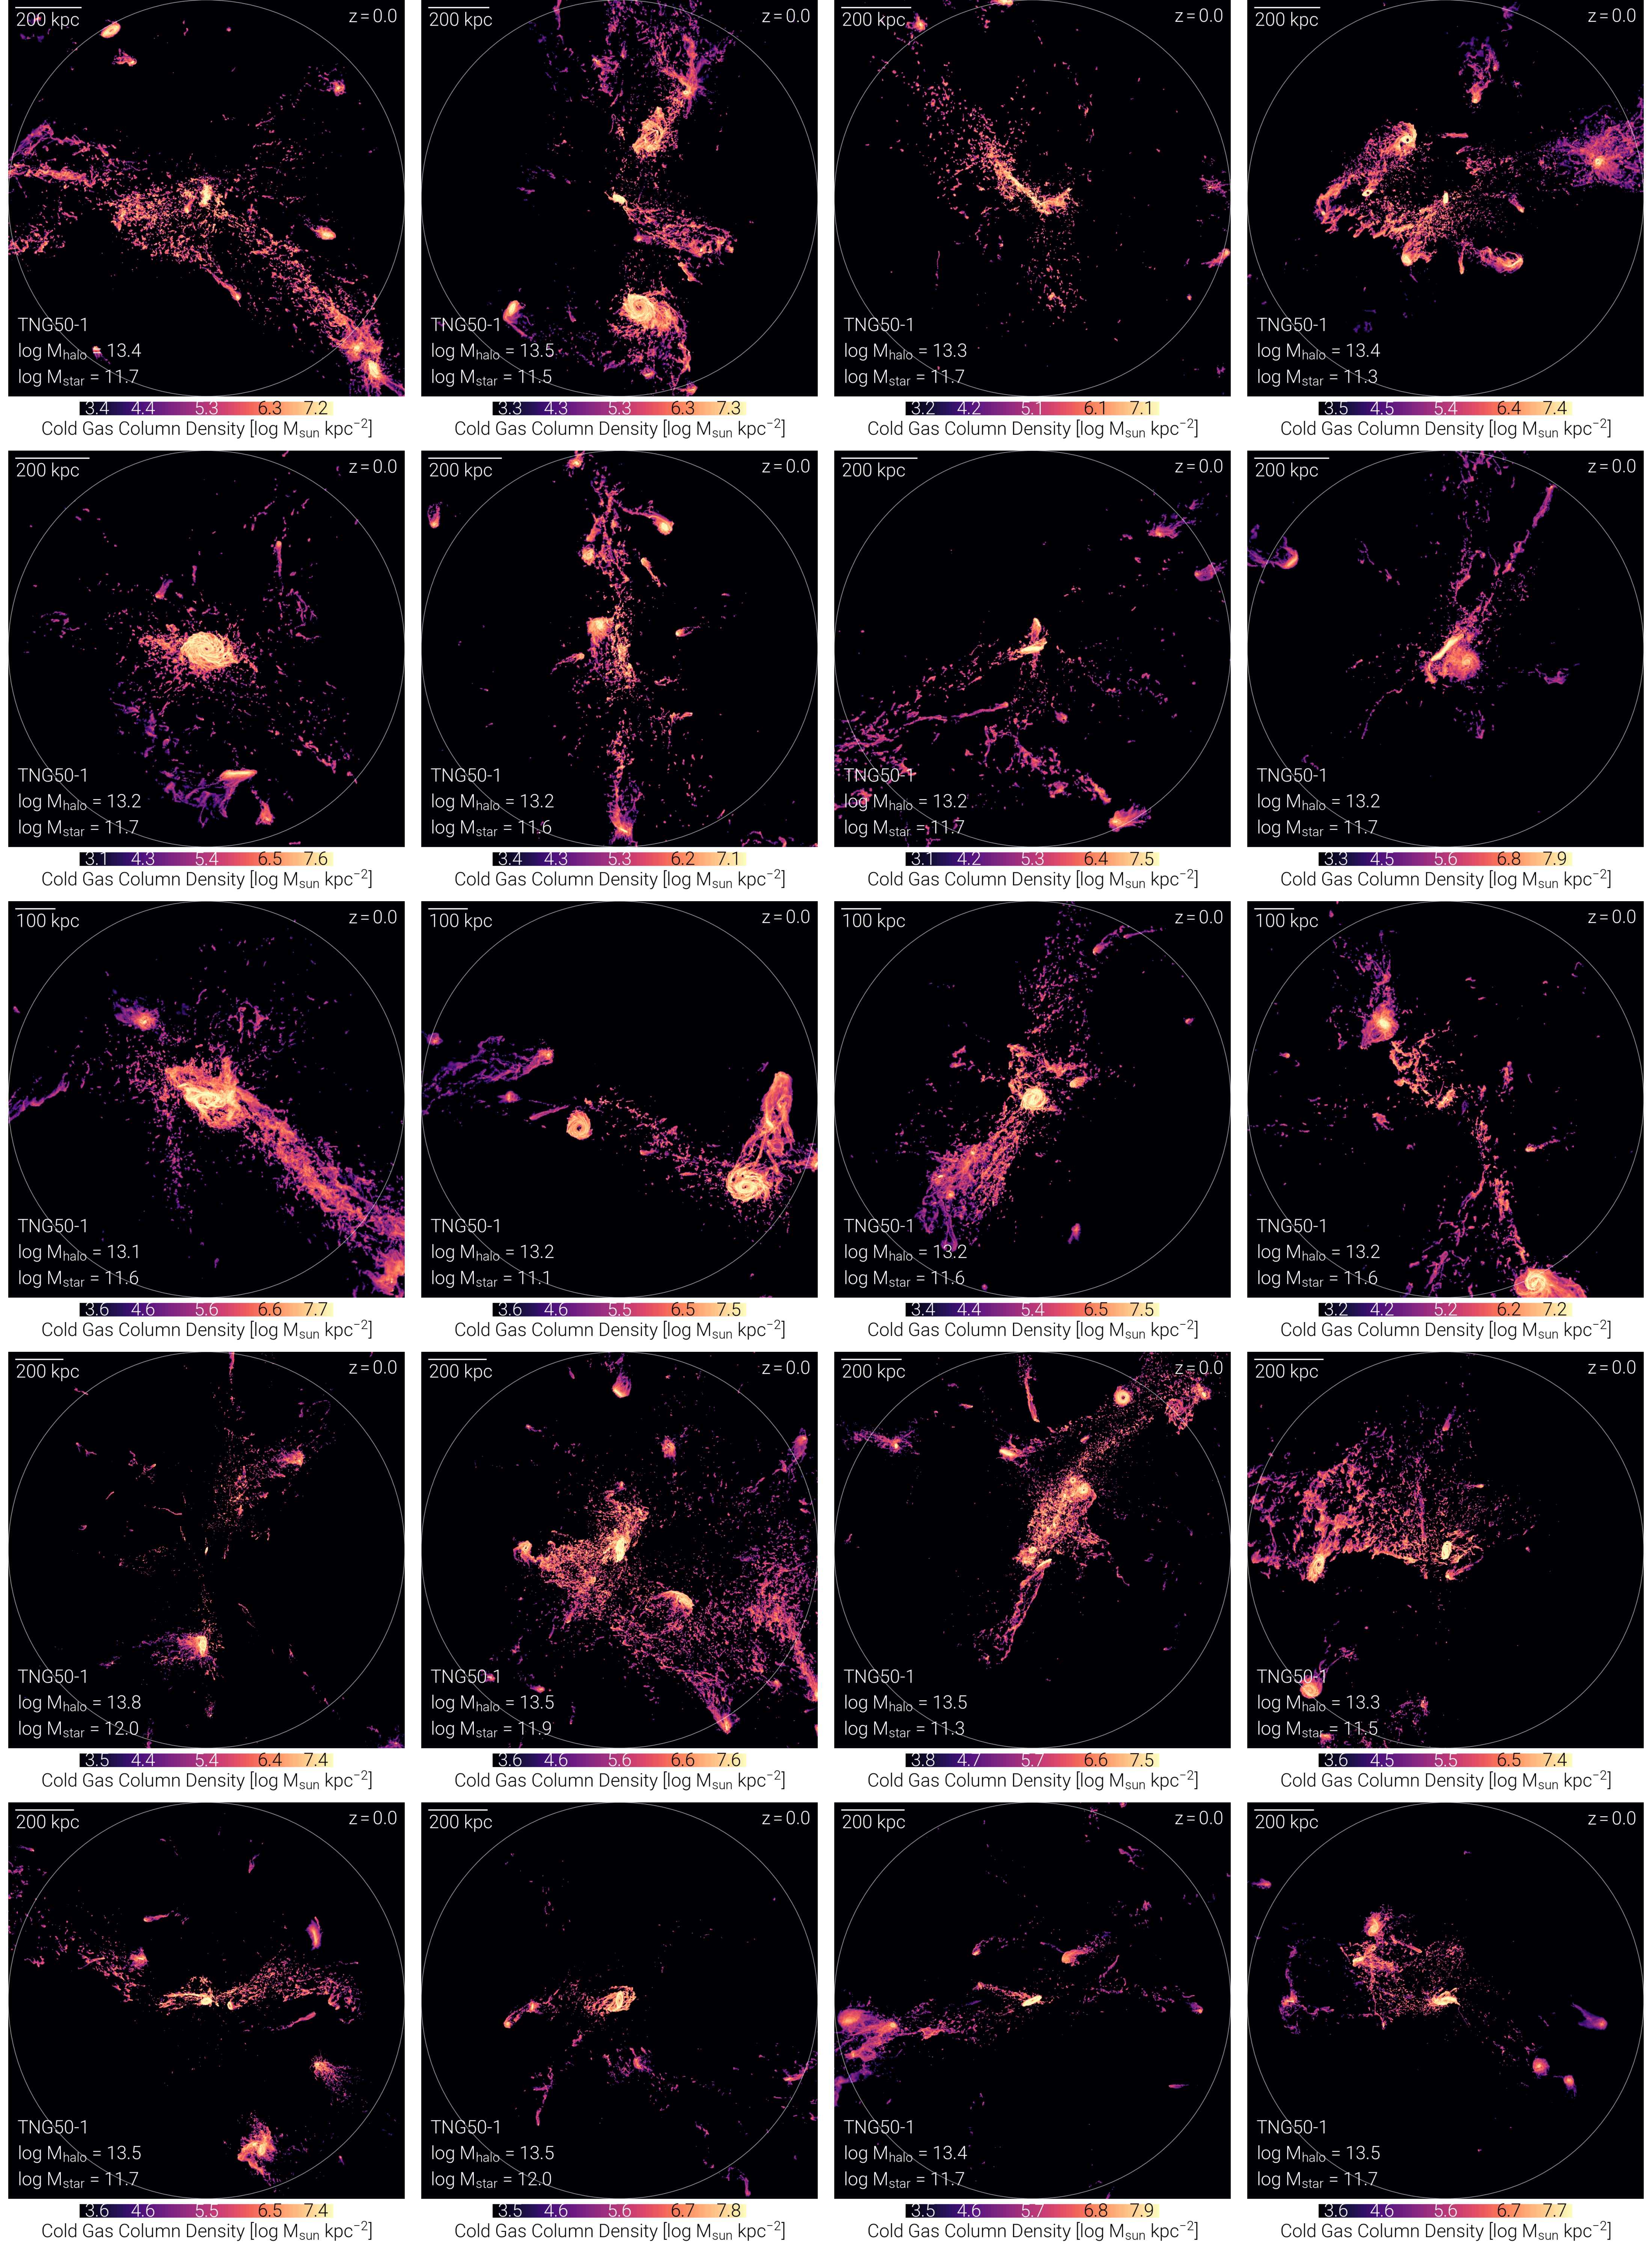
Following the pilot project that visually classified a subset of TNG100 satellites (Yun et al., 2019), the term “jellyfish galaxy" was associated with a satellite with a visually identifiable signature of RPS in the form of asymmetric gas distributions in one direction. The visual inspection is based on images of gas column density – i.e. all gas irrespective of phase, temperature, etc. – with stellar mass contours, projected in random orientations in a field of view of 40 times the 3D stellar half mass radius . Each image was classified by at least 20 inspectors (trained volunteers) whose proficiency was measured when tallying the votes. A galaxy image received a score between 0 and 1 based on these votes, whereby we employ a threshold of 0.8 and above to identify jellyfish galaxies, as recommended by Zinger et al. (in prep.).
Galaxies meeting the following criteria had their images posted for inspection for the Zooniverse project:
-
•
non central, i.e. satellite;
-
•
of cosmological origin, as defined by the SubhaloFlag in Nelson et al. (2019a);
-
•
or for TNG50 and TNG100, respectively;
-
•
, where is the satellite’s total (i.e. gravitationally-bound) gas mass.
For both TNG50 and TNG100, all galaxies satisfying the above criteria were inspected at the following redshifts: , (every Gyr in cosmic time), corresponding to TNG snapshots 99, 91, 84, 78, 72, 67, 59, 50, 40, 33. Additionally, TNG50 galaxies were inspected at each available snapshot since (every Myr in cosmic time), snapshots 67-99.
According to the results of the Zooniverse Cosmological Jellyfish project, for TNG50, 4,144 of the total 53,610 (7.7 per cent) galaxy images are jellyfish; for TNG100, 1,163 of the 27,094 (4.3 per cent) images are jellyfish. It is possible that the jellyfish tails are more identifiable in higher resolution simulations, potentially leading to the slightly higher percentage of jellyfish in TNG50 compared to TNG100. In total, 80,704 galaxy images were inspected, of which 5,307 (6.6 per cent) are jellyfish galaxies that we can use for scientific analysis across TNG50 and TNG100.
2.3 Tracking galaxies along the merger trees
Based on the selection for the Zooniverse Cosmological Jellyfish project, frequently an individual galaxy was inspected multiple times at different points in time along its evolutionary track.
In this paper, we connect the galaxies that were inspected at multiple times using sublink_gal (Rodriguez-Gomez et al., 2015). Briefly, sublink_gal constructs the merger trees at the subhalo level by searching for descendant candidates with common stellar particles and star-forming gas cells. Then sublink_gal chooses the descendant by ranking all candidates with a merit function that takes into account the binding energy of each particle/cell, and choosing the candidate with the highest score as the descendant.
In this paper, we chiefly work with and follow the unique evolutionary tracks of galaxies, branches, inspected in the Cosmological Jellyfish project. In total, there are 5,023 (9,052) unique galaxy branches in TNG50 (TNG100) among the inspected images. The analysis of these satellite galaxy populations along their evolutionary tracks requires following the merger tree branches both of the individual galaxies and their (sometimes temporary) hosts. We give results on this in §3.1 and more details in Appendix A.
2.4 Galaxy sample selection of this analysis
In this paper, we focus exclusively on TNG50 galaxies. As we are interested in ram pressure stripping quantitatively, using TNG50 ensures that we work with the highest-resolution simulation available of the IllustrisTNG project. Moreover, the tracer particle data and the jellyfish inspections are available at every snapshot (compared to only at the full snapshots or a handful of snapshots, respectively, in TNG100; more details in § 2.5.1).
With respect to the Zooniverse Cosmological Jellyfish project, we apply additional selection criteria to be able to start from a sample of satellites defined at that does not include backsplash and pre-processed galaxies. Please see Appendix A for details regarding how we classify the galaxies as backsplash and/or pre-processed.
Of the 5,023 inspected galaxy branches in TNG50, we apply the following sample selection criteria. At each criterion, we list the number of remaining branches in the simulation, and the number excised by this criterion in parentheses444The number excised is the number from the previous criterion. For example, criterion (ii) excises branches from the branches remaining after applying criterion (i). This now leaves branches after applying criterion (ii)..
-
1.
The galaxy must survive until the end of the simulation at . That is, the main descendant branch must track the subhalo until snapshot 99. TNG50: 3,018 (2,005 excised).
-
2.
There must be at least one snapshot since when the galaxy was inspected in the Zooniverse project (and therefore meeting the criteria outlined in §2.2). TNG50: 2,398 (620).
-
3.
The galaxy must be a satellite galaxy at , i.e., not a backsplash galaxy at snapshot 99. TNG50: 2,062 (336).
-
4.
The galaxy must not have been pre-processed by a host group other than its host. TNG50: 1,721 (341).
Thus our total number of cleaned, first-infalling inspected branches is 1,721 for TNG50. For TNG100, this number would be 3,307, due to the larger volume and higher-mass hosts, but we focus hereafter only on TNG50 galaxies. Of these branches, we separate them into those that have at least one jellyfish classification since , called “jellyfish" branches, and those without a jellyfish classification since then, called “non-jellyfish" branches. The numbers of jellyfish and of non-jellyfish branches in TNG50 are 535 and 1,186, respectively555In TNG50, there are 12 cleaned, inspected branches that have a jellyfish classification before but not afterwards. We exclude these galaxies from the jellyfish sample. (see §3.1 for additional results).
2.5 On cold gas, infall time, tracer particles, and measuring ram pressure stripping
In this work, we study the gravitationally-bound cold gas of TNG50 satellite galaxies: by cold gas, throughout this paper, we mean gas with a temperature K (including star-forming gas; see § 2.1 for more details).
Throughout this paper, we define infall as the first time in cosmic history that a galaxy becomes a satellite member of its FoF host, irrespective of distance.
2.5.1 Following the gas with tracer particles
As TNG50 is based on a moving-mesh code to follow the evolution of the underlying fluid field, we must employ the Monte-Carlo-Lagrangian tracer particles to follow the history and evolution of individual gas parcels (Genel et al., 2013; Nelson et al., 2013). Briefly, arepo treats the gas as a fluid field through a Voronoi mesh. There is no innate method to follow the flow of matter between the mesh elements and across time. Thus the tracers are introduced, acting as test particles within the fluid. TNG50 was run with one tracer per gas cell at the initial conditions. The tracers have a constant identifying number (ID) throughout the simulation, and at each snapshot each tracer has exactly one baryonic parent resolution element: a gas cell, a stellar or wind particle, or a SMBH. This means that any given tracer represents of baryonic mass with the properties of its parent. For example, if a single tracer has a gas parent at one time and a star parent at the next time, then the tracer represents of gas mass being converted into stars. In this way, one can track the flow of matter by following a given tracer and its parent’s properties across cosmic time. In TNG50 the parents of the tracers are output at each snapshot, describing the exchange of parcels of baryonic material across resolution elements at time intervals of Myr. As the tracer particles are Monte Carlo in nature, we make only statistical statements about the behavior of thousands to millions of tracers.
In practice, at each snapshot and for each galaxy of interest, we find all tracers whose parents are bound, cold gas cells. While not every gas cell necessarily has an associated tracer and some gas cells may have multiple child tracers, the total tracer cold gas mass (total number of tracers times ) agrees with the total amount of cold gas mass measured by gas cells (see Fig. 5 for an example). Then we follow the tracers and their parents across snapshots in order to measure the cold gas mass that is stripped or launched in an outflow, becomes hot, participates in star formation, transforms into a wind particle, and gets accreted into a SMBH.
We proceed as follows, on a galaxy by galaxy basis along its main descendant branch (MDB). Starting from the first snapshot that the galaxy is identified in the merger trees, we find all tracers whose parents are bound, cold gas cells of this galaxy. Then at the next snapshot for the galaxy along its MDB, we find which tracers belong to one of the following mutually exclusive and completely exhaustive groups:
-
1.
are recorded in both snapshots: bound, cold gas that remains bound, cold;
-
2.
are recorded in the current snapshot but not in the previous one: currently bound, cold gas that previously was either not bound or not cold;
-
3.
are recorded in the previous snapshot but not the current one: previously bound, cold gas that no longer is;
Potential physical origins of tracers in group (ii) include inflows, cooling, stellar mass return, or wind re-coupling. The group (iii) tracers could either a) go from cold gas cells into one of the following: star particles (star formation denoted SF, or SFR for star formation rate); SMBH sink particles (i.e. SMBH accretion); bound, warm/hot gas cells (heating); or b) be no longer bound gas cells (stripping + outflows). We denote the latter “RPS+outflows” and will be focusing on this quantity throughout the paper. We include tracers whose parents become unbound and hot in the same time step in this category. We note that tidal stripping may be included in RPS+outflows, although visual inspection shows that ram-pressure stripping is the dominant mechanism of jellyfish galaxies, and a majority of galaxies do not reach host-centric distances . Moreover, the Zooniverse inspectors were specifically asked not to classify an image as a jellyfish if there was a close companion or gaseous tails were visible on both sides of the galaxy (Zinger et al. in prep.).
2.5.2 Identifying the onset and end of ram pressure stripping
Throughout our analysis, prior to infall (host FoF membership; see above), we assume that the RPS + outflows category is dominated by outflows, namely outflows driven from stellar- and/or SMBH-feedback. As we further justify in § 3.3, for most jellyfish the amount of outflows before infall is approximately constant (see Fig. 5 for an individual example). Immediately after infall, there is commonly an increase in the RPS + Outflows category, indicating that another physical process has become present, namely RPS. Moreover between infall and pericenter, many satellites experience bursts of star formation and/or AGN accretion, which has also been seen in observations, reproduced by simulations, and thought to be caused by ram pressure compressing the ISM gas (Gavazzi & Jaffe, 1987; Bahé & McCarthy, 2015; Mistani et al., 2016; Zoldan et al., 2016; Vulcani et al., 2018; Roberts & Parker, 2020; Peluso et al., 2022; Garling et al., 2022, Göller et al.,in prep.). These bursts of star formation and/or AGN accretion would in turn induce turbulence in the ISM and drive outflows, which then facilitate ram-pressure stripping (e.g., Bahé & McCarthy, 2015). Attempting to distinguish the relative contributions from outflows and ram pressure becomes a chicken-and-egg problem. Thus, we consider the time of infall to be the onset of RPS, and after infall relabel the quantity “RPS+Outflows" as “RPS". We note that we have estimated the onset of RPS using two alternative methods, and find that for most jellyfish the difference between the various methods is Myr ( snapshots): see Appendix B and Fig. 14 for more details.
The end of ram-pressure stripping is either when the galaxy’s cold gas mass falls below our resolution limit (namely below i.e. for a galaxy at our minimum stellar mass of ), or the end of simulation at . In our sample, 261/535 ( per cent) galaxies lose all their cold gas at or before .
We denote the onset of RPS as the infall time and its end as (when 100 per cent of the RPS has occurred), so that the difference between these two times returns in principle the maximum time span over which RPS has acted on any given galaxy:
| (1) |
where are the ages of the universe at the given points. This RPS time span is the longest duration over which RPS has acted for the galaxies that have lost their cold gas prior to . On the other hand, for those satellites that still have some gas today, the above-defined timescale of RPS is likely a lower estimate, while we speculate that these galaxies would continue being stripped in the future. See §3.4 for differences between these two ending states.
Throughout the paper, we will compare the times of RPS with estimates of the quenching time, i.e. of the most recent and last time that a galaxy has fallen 1 dex below the star-forming main sequence (SFMS) for its mass and redshift, as per definitions of Pillepich et al. (2019) and catalogs from Joshi et al. (2021); Donnari et al. (2021).
3 Results
3.1 TNG jellyfish galaxies across their unique branches
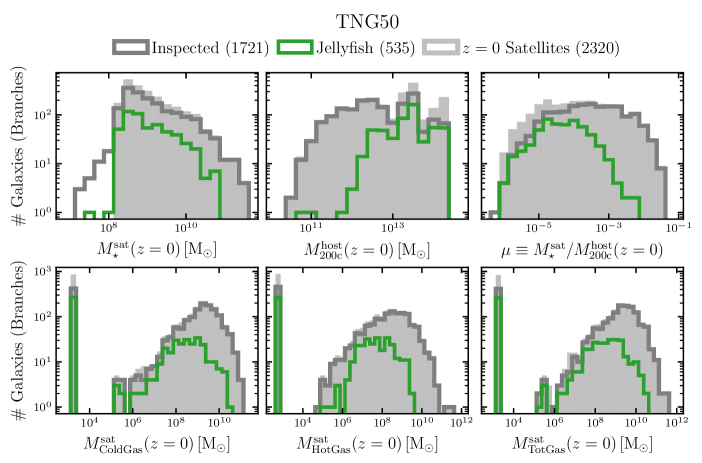
According to the Cosmological Jellyfish project on Zooniverse, 4,144 of the 53,610 images from TNG50 are jellyfish galaxies (7.7 per cent, Zinger et al. in prep.). Using the merger trees to identify when the same galaxies were imaged at multiple points in cosmic time in TNG50 and applying our selection criteria (§2.4), we now focus on our sample of 535 first-infalling unique jellyfish galaxies, among 1,721 unique, inspected branches (31 per cent).
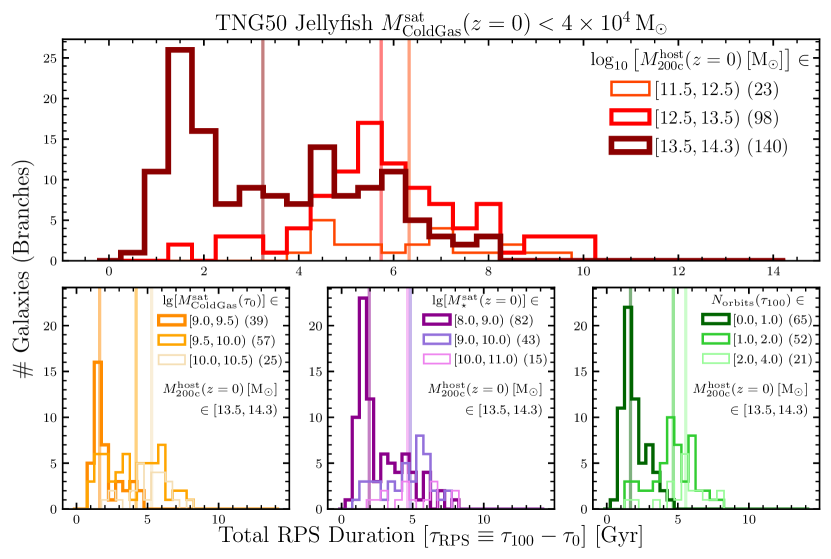
Fig. 1 shows our selection of jellyfish (green histograms) and inspected (dark gray histograms) satellites at . We now quote numbers in terms of unique branches such that Fig. 1 is the branch- or merger tree-based counterpart of similar histograms in Zinger+2023 (in prep., see their fig. 2). We include for comparison the general population of satellites with , which is generally similar to the Zooniverse inspected sample, except that the general satellite population includes pre-processed satellites. See § 4.1 for a more detailed discussion on how representative the jellyfish sample is compared to all satellites above stellar mass.
Firstly, Fig. 1 shows, thanks to TNG50, that we can study satellite galaxies, and hence jellyfish and RPS, in a rather extended range of stellar masses and host masses. Namely we study satellites with stellar masses orbiting in hosts with total masses at . However we cannot make statements about satellites in the most massive clusters .
As shown in the top left panel, jellyfish galaxies (green) tend towards lower stellar masses compared to the inspected galaxies (dark gray), and especially to the non-jellyfish galaxies that have been inspected (not shown, but would be dark gray minus green). Since the stellar body is the primary foil to RPS, providing the gravitational binding energy for the gas to remain in the galaxy, galaxies with a weaker restoring force are naturally more susceptible to RPS, in line with other studies of TNG jellyfish (Yun et al., 2019, Zinger et al., in prep.). Because we only inspect galaxies with at the time of inspection, we see a decrease in the number of galaxies at lower masses. This inspection criterion is only at the snapshot of inspection, so galaxies that later lose stellar mass due to tidal stripping may have stellar masses below this lower limit. The fact that only 2/535 (0.37 per cent) of jellyfish branches compared to 24/1186 (2.0 per cent) of non-jellyfish branches have stellar masses below the inspection criterion suggests that we are able to separate galaxies undergoing tidal vs ram-pressure stripping. At the high-mass end, there are only a few jellyfish galaxies. We speculate that this is a combination of two effects: more massive satellites in hosts of this mass range better retain their cold gas against stripping; at these stellar masses, the TNG kinetic mode of SMBHs expels much of the galaxy’s gas (e.g. Terrazas et al., 2020; Zinger et al., 2020), often at infall and before the peak effectiveness of RPS.
In the top middle panel, we see that jellyfish typically live in more massive hosts, and almost all inspected galaxies in massive hosts have been classified at some point since as jellyfish. The number of satellite galaxies increases with the host halo mass due to hierarchical structure formation. With increasing host mass the gravitational potential well deepens, which in turn leads to both better retention of stellar- and SMBH-driven outflows from the central and more cosmological gas accretion from the large scale structure. These effects generally lead to a denser CGM or ICM. Moreover, deeper potential wells increase the infall velocities of satellite galaxies, sometimes even to supersonic speeds (Yun et al., 2019). The denser ambient medium and the increased relative velocity both increase the strength of ram-pressure stripping (e.g. Yun et al., 2019). However in the past five billion years, MW-mass halos have also hosted a number of jellyfish galaxies.
In the top right panel Fig. 1, by combining the effects of satellite stellar mass and host mass, we see that jellyfish galaxies typically have small mass ratios , and nearly every inspected galaxy with a mass ratio is a jellyfish.
The satellite stellar mass distribution of the inspected galaxies (dark gray) is slightly below but quite similar to that of the satellites (light gray) for stellar masses (top left), and the distributions are nearly identical for masses . Compared to the satellites, the inspected galaxies have an under-population of high mass hosts (top middle) and low mass ratios (top right). We speculate that many of these satellites are pre-processed and therefore have been excluded from this analysis, but they may also have had too low of gas masses and their fractions to be inspected (bottom panels).
In the bottom panels of Fig. 1, we see that jellyfish galaxies typically exhibit, at lower amounts of gravitationally-bound cold gas with temperatures K (or star-forming; bottom left), hot gas with temperatures K (bottom middle) and total gas (bottom right) compared to the inspected branches. A somewhat larger fraction of jellyfish ( per cent) compared to non-jellyfish ( per cent) have gas masses below our resolution limit, plotted here at . We have explicitly checked that the non-jellyfish inspected galaxies with large gas reservoirs are typically late-infallers and have higher mass ratios, causing weaker ram-pressure stripping. Conversely, the non-jellyfish inspected satellites without any gas at are typically early-infallers, namely they joined their hosts when galaxies were inspected only every Gyr, compared to every Myr after . Additionally, there are a few cases of massive galaxy mergers where the FoF-identified central galaxy switches between the two galaxies; this means that these quasi-central galaxies meet the inspection criteria but are not truly classical satellites.
3.2 Jellyfish tails stem from the stripped, cold ISM
In this work, we study the ram-pressure stripping of cold gas because the long-lived jellyfish tails originate mostly from the cold ISM of satellite galaxies. We provide arguments for this as follows.
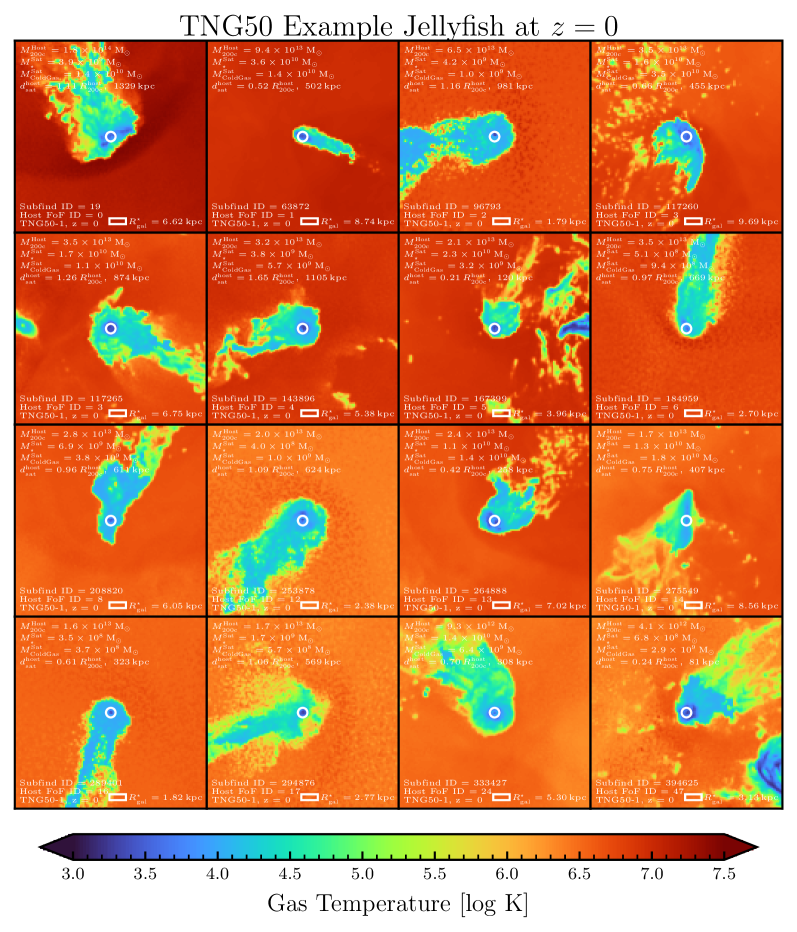
Firstly in Fig. 2 we show the gas temperature maps of 16 TNG50 jellyfish at . Each image is in size and depth, with pixels ( kpc sized pixels) in the same orientation as the jellyfish were posted to Zooniverse (i.e., random and along the -axis). We measure the mass-weighted-average temperature map of all (FoF i.e. ambient) gas within the cube, and overplot the jellyfish (i.e. gravitationally-bound) gas. In each image, the jellyfish tails’ temperature matches, or is at a similar temperature of, the ISM gas, which we roughly denote as the gas enclosed by the white circles of radius . In some cases, a bow shock is also present, which appears as a stark contrast in temperature in the opposite direction of the tails (e.g., top left; see also other manifestations of bow shocks in front of TNG100 jellyfish galaxies in fig. 10 of Yun et al., 2019).
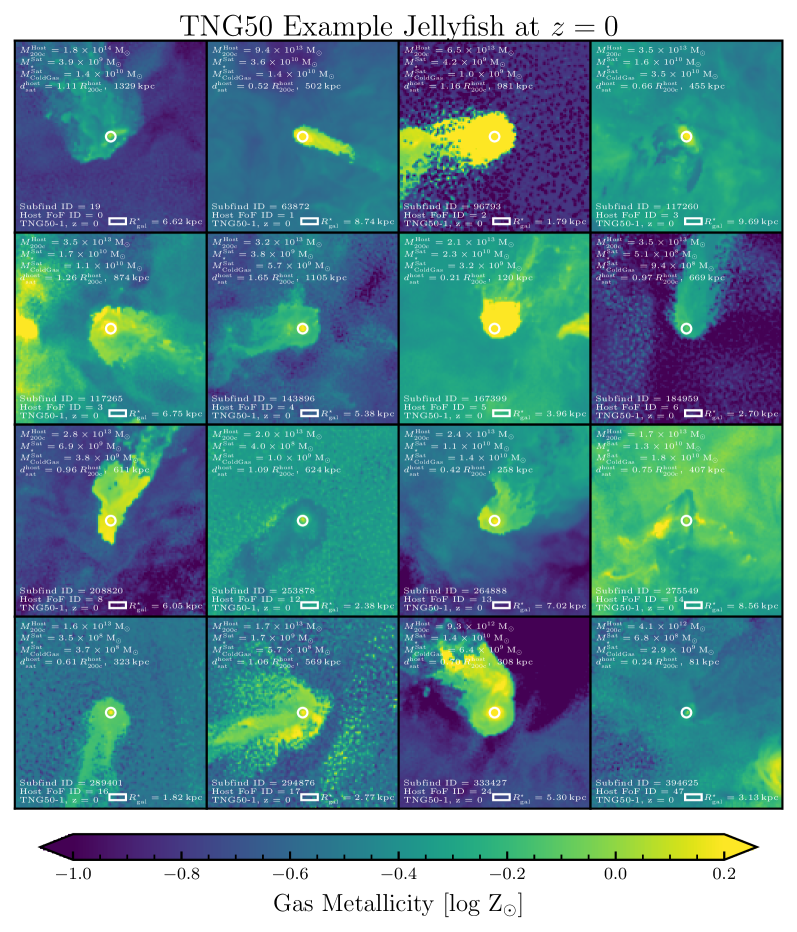
Fig. 3 showcases the metallicity maps for the same 16 TNG50 jellyfish galaxies. Generally, the metallicity of the jellyfish tails is similar to that of the main body of the galaxy (the jellyfish head). However, in some cases (e.g., top right), the jellyfish tails have lower metallicities than the stellar bodies, which is consistent with some observations and idealized simulations suggesting that a portion of the stripped ISM mixes with the surrounding medium (e.g., Franchetto et al., 2021; Choi et al., 2022; Lee et al., 2022b). Unlike the temperature, the metallicity of the background halo gas is not always so distinct from the jellyfish (e.g., bottom right), as it depends on the satellite-to-host mass ratio.
These images exemplify that, at least at the time when a RPS tail is identifiable in gas column density, the physical properties of the gas in the tails are mostly similar to those in the ISM in the main body of the satellite galaxy undergoing RPS. The tail gas is cold and is typically as metal enriched as the jellyfish head.
Furthermore, we have checked that, at the time of infall, per cent of the gravitationally-bound gas mass is cold for jellyfish galaxies with stellar masses at infall of .
As a note, this ISM-origin of the RPS’ed gas does not preclude the jellyfish tails to reveal themselves across a wide range of wavelengths (see § 1 for references). Namely, although the bulk of the tail gas is cold or cool according to TNG50, it can also manifest itself in e.g. soft X-ray (see fig. 12 from Kraft et al., 2022, for a mock 100 ks exposure from the Line Emission Mapper for an example TNG100 jellyfish galaxy in the soft X-ray continuum and at the OVII f line).
3.3 The majority of the cold gas loss after infall is due to ram-pressure stripping
According to TNG50, RPS is the dominant source of cold gas loss after infall for jellyfish galaxies. This is somewhat to be expected, given the jellyfish nature of the selected galaxies under inspection. However, we have demonstrated this for all 535 TNG50 jellyfish galaxies, using the tracer particle analysis described in Section 2.5.1. We showcase this result with one example galaxy below.
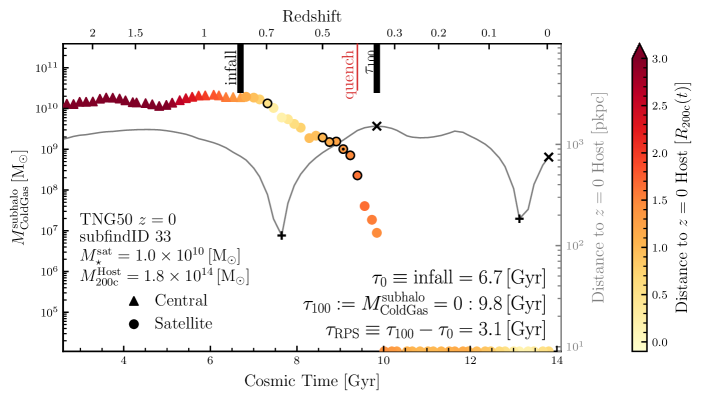
Fig. 4 shows the time evolution of the gravitationally-bound cold gas mass for one example TNG50 jellyfish galaxy. Prior to infall (at cosmic times Gyr) and at large distances ( kpc), the cold gas associated to the galaxy is approximately constant. After infall, decreases significantly through the first pericentric passage until the satellite has effectively no cold gas remaining, which we denote as (see §2.5.2 for more details). The galaxy quenches its star formation for the last time shortly before , at Gyr after infall.
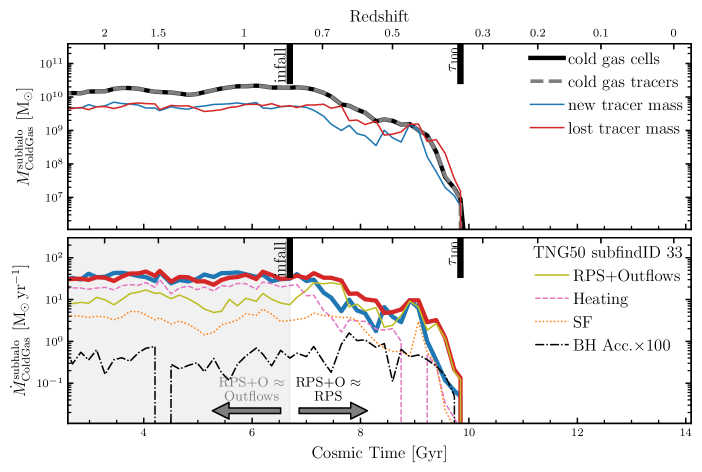
Fig. 5 graphs the evolution of cold gas mass and the associated tracers for the same galaxy as in Fig. 4. In the top panel, measured using the gas cell data (thick black curve) is identical to that in Fig. 4; moreover, measured using the tracers (dashed gray curve; the number of tracers with cold gas parents times the baryonic mass resolution) closely matches the cold gas mass measured using subfind at all times. This affirms that the tracers robustly measure the cold gas mass (see § 2.5 and Appendix A for more details).
In the top panel of Fig. 5, while the galaxy is a central before infall at cosmic times Gyr, the net new (thin blue curve) and lost (thin red curve) cold gas tracers roughly balance each other, leading to the approximately constant total . This likely reflects a quasi-equilibrium galactic fountain scenario, where inflows and outflows approximately cancel out to yield a constant , at least for the depicted galaxy. At infall, there is an immediate drop in new cold gas – the cold gas that the galaxy acquired via cold gas inflows or gas cooling – which qualitatively agrees with the results from the EAGLE simulation (Wright et al., 2019, 2022). The lost cold gas mass remains approximately constant for Gyr after infall before eventually declining. After infall, the lost cold gas is always similar to or higher than the new cold gas, leading to the net decline in cold gas mass until . However it is interesting that the new cold gas remains nonzero for Gyrs after infall, including during the pericenter passage.
In the bottom panel of Fig. 5, we show again the net new (thick blue curve) and lost (thick red curve) tracers of cold gas, now shown as cold gas mass rates normalized by the time between snapshots. Further, we split the lost tracers into the various sinks of RPS+outflows (solid olive), gas heating (dashed pink), star-formation (SF; dotted orange) and SMBH accretion multiplied by 100 (BH acc.; black dot-dashed). See § 2.5.1 for additional technical inputs.
Before infall, gas heating is the dominant mechanism of cold gas loss, followed by RPS+outflows and SF. During this time, the shapes of the RPS+outflows, SF and SMBH accretion100 are quite similar, suggesting that SF and/or SMBH accretion are the primary drivers of outflows for this galaxy. For the first Gyr after infall, the SF remains roughly constant while the RPS+outflows increases, confirming the onset of RPS. Moreover there is a simultaneous net gas loss, translating into an increase in the “efficiency" of RPS+outflows and SF, where efficiency here denotes RPS+outflows or SF normalized by . During this period, the cold gas lost via heating also decreases significantly. SMBH accretion is the least dominant cold gas sink at all times, at least for this galaxy. This galaxy has in fact experienced little to no kinetic AGN feedback, though in general 47 of the 535 ( per cent) of jellyfish galaxies have and have experienced kinetic AGN feedback. Through pericenter until the jellyfish has a gas mass below our resolution limit, RPS+outflows remains the dominant physical mechanism of cold gas removal.
As discussed and anticipated in §2.5.1, outflows and RPS are closely intertwined, for example as outflowing gas is less gravitationlly bound and therefore more susceptible to RPS. We hence avoid distinguishing between cold gas that is lost (and becomes unbound) because of RPS or because of a combination of RPS and high velocities, and we conclude that that RPS (+outflows) is the dominant source of cold gas loss after infall for jellyfish galaxies in TNG50.
3.4 Why do half of the TNG50 jellyfish have, or not have, cold gas today?
The 535 jellyfish galaxies provided by TNG50 span orders of magnitude in their stellar mass, host mass, and importantly their (cold) gas mass (Fig. 1). Why do half of the jellyfish galaxies retain significant amounts of cold gas until , while the others do not?
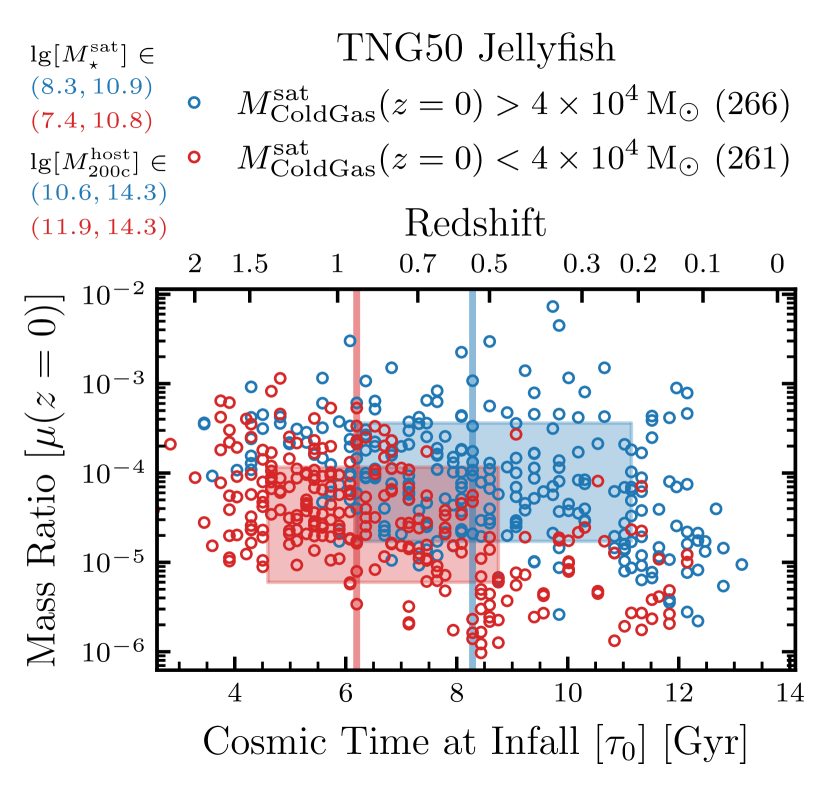
As a reminder, in this paper we analyse TNG50 satellite galaxies that survive, in terms of their galaxy stellar mass, through (see §2.2 and §2.4 for more details). In Fig. 6, we show the satellite-to-host mass ratio vs. the infall time for the population of jellyfish branches that end up with cold gas masses above (blue circles) or below (red circles) our resolution limit () at . Here, the 16/84th percentiles and medians are marked with the shaded regions and vertical lines respectively. We note that the results remain qualitatively similar when using the satellite-to-host mass ratio at infall rather than at .
The average infall occurs Gyr earlier for those jellyfish galaxies with little to no cold gas remaining than for those that still retain some cold gas at . While the host halo masses might have not had as much time to grow at earlier times and the mass ratios are , most of the early infallers (with infall times more than 5 Gyr ago) have had enough time until to undergo secular and environmental processes to lose their cold gas. Even if these galaxies required multiple pericentric passages to lose their gas, they have had enough time before to have done so. Conversely, the largest majority of late-infalling jellyfish (i.e. with infall times as recent as a few Gyr ago) that have lost their gas by exhibit very low mass ratios (in the range ), whereas those with cold gas today typically have , either because they are more massive or because they orbit in less massive hosts.
We speculate that the galaxies with non-vanishing cold gas masses that remain satellites (i.e. do not become backsplash galaxies) would eventually lose all their cold gas, i.e. if the simulation ran longer in time.
Whereas the characterization of Fig. 6 is not surprising, it reminds us that, the longer a satellite has interacted with its host, the more time environmental processes, such as RPS, have had to act upon it. And even though some secondary effects may be in place – such as galaxy selection, orbital trajectories, numbers of pericentric passages, edge-on vs. face-on orientation of the satellite as it falls into the host, and/or satellite-satellite interactions – this zeroth-order picture is in line with what has already been quantified by Donnari et al. (2021); Joshi et al. (2021) for all TNG simulations: satellites that have spent more time in their hosts are more likely to be quenched compared to those that are still infalling or on their first infalling trajectory.
3.5 For how long is ram pressure stripping in action?
We are hence ready to quantify for how long RPS acts or has acted on TNG50 jellyfish galaxies.
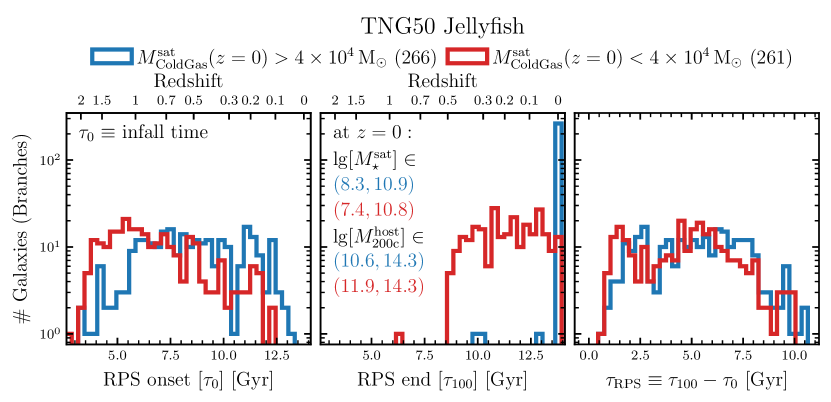
Fig. 7 shows the distributions of the onset of RPS ( i.e. infall time; left), the end of RPS (; middle), and the duration of RPS (; right), for TNG50 jellyfish with cold gas masses below (red) and above (blue) our resolution limit () at the current epoch.
As we have seen in Fig. 6 and now again in the left panel, the jellyfish with little to no cold gas at are typically early infallers, with a majority falling in at Gyr after the Big Bang and a tail of late infallers at Gyr after the Big Bang. After the RPS onset, the TNG50 jellyfish continue losing cold gas until sometime in the past few billion years ( Gyr). We only select galaxies which have been jellyfish since , so we exclude galaxies that have been totally stripped of cold gas before .
Finally, according to TNG50, the distribution of the RPS duration (, right panel) can be very wide, even for both subsets of jellyfish galaxies. For the jellyfish with cold gas masses below our resolution limit at , the distribution appears somewhat bimodal (see below for more details). Among these jellyfish, a fraction have undergone RPS for about Gyr and a larger fraction has undergone RPS for as long as Gyr. As a reminder, these numbers represent the maximum time span over which RPS has acted (§2.5.2); we see in the next Sections whether RPS may be more effective on shorter timescales. Also for the jellyfish with still some cold gas at the current epoch, environmental effects, and hence also RPS, have acted on them for as many as billions of years.
3.5.1 Physical origin of the diversity of RPS duration
What are the important factors in determining how long a given jellyfish needs to be stripped of its cold gas? We focus from now on only on those jellyfish that have cold gas masses below our resolution limit at the current epoch .
In the top panel of Fig. 8, we extract the distribution of the duration of RPS for the TNG50 jellyfish without substantial cold gas today, stacked by halo mass of their current host. The number of jellyfish (not the number of hosts) belonging to each host mass bin is in parentheses in the upper right corner.
Jellyfish in clusters (, dark red histogram) exhibit the shortest median RPS duration (vertical dark red line), although the distribution peaks at even shorter time spans: Gyr. Then there is a valley at intermediate stripping times Gyr, followed by a slight increase from Gyr. The longest timescale for any jellyfish in this host mass bin is 8 Gyr. The jellyfish in groups (, red histogram) show RPS timescales that are single-peaked, with the median and mode coinciding at Gyr. While not shown but explicitly checked, jellyfish in group-mass hosts typically require at least 2 pericenteric passage to become fully stripped of cold gas. There are only ( per cent) galaxies in this host mass bin with stripping times shorter than 4 Gyr. This agrees with our earlier argument that RPS is more effective in higher host masses. Moreover, the jellyfish in approximately Milky-Way mass halos (, light red) require at least 4 Gyr, or in some cases much longer, to be fully stripped of their cold gas today. However, even for these MW-mass hosts, the satellite-to-satellite variation is very large: there are TNG50 jellyfish that undergo RPS for as long as 10 billion years in both group- and MW-mass hosts, and as long as 8 billion years for cluster-mass hosts.
The trend whereby shorter RPS time spans occur, on average, for satellites in more massive hosts is consistent with expectations described in § 1. However, here we quantify it for the first time with a large number of jellyfish across a wide range of host and satellite masses. Moreover, this trend is in place (physically vs. hierarchical growth of structure) even though more massive hosts exhibit in fact overall more recent infall times of their satellites than less massive hosts (not shown but explicitly checked).
In the bottom row of Fig. 8, we focus on the TNG50 jellyfish with no remaining cold gas at in the 8 cluster hosts () to investigate which additional physical properties imprint secondary trends on the duration of RPS. In practice, we show the distributions binned by the satellites’ cold gas mass at infall (left), stellar mass at (middle), and number of apocentric passages by (right).
In the bottom left panel of Fig. 8, we see that satellites with the smallest (dark orange) and largest (light orange) amount of cold gas at infall are both single peaked at and Gyr respectively. Conversely, the intermediate bin (orange) has an approximately uniform distribution from Gyr. Galaxies with less strippable material at infall tend to have shorter stripping durations.
In the bottom middle panel, lower mass jellyfish (dark purple) are typically stripped of all their cold gas faster, on average in Gyr, although a non-negligible fraction of them still require Gyr to be fully stripped of their cold gas. The intermediate (purple) and high (light purple) bins of satellite’s stellar mass have similarly flat distributions with both a median RPS duration of Gyr.
Lastly in the bottom right panel of Fig. 8, we show that satellites with the shortest RPS durations are those with the fewest orbits by being totally stripped , where is the number of apocentric passages before . The jellyfish with the shortest RPS duration are those that get stripped of all their cold gas before or immediately after their first pericentric passage (dark green), whereas satellites that require longer RPS time spans to be fully stripped of their cold gas are characterized by more than one apocentric passage (green and light green histograms).
3.6 When and where does ram pressure strip most of a jellyfish’s cold gas?
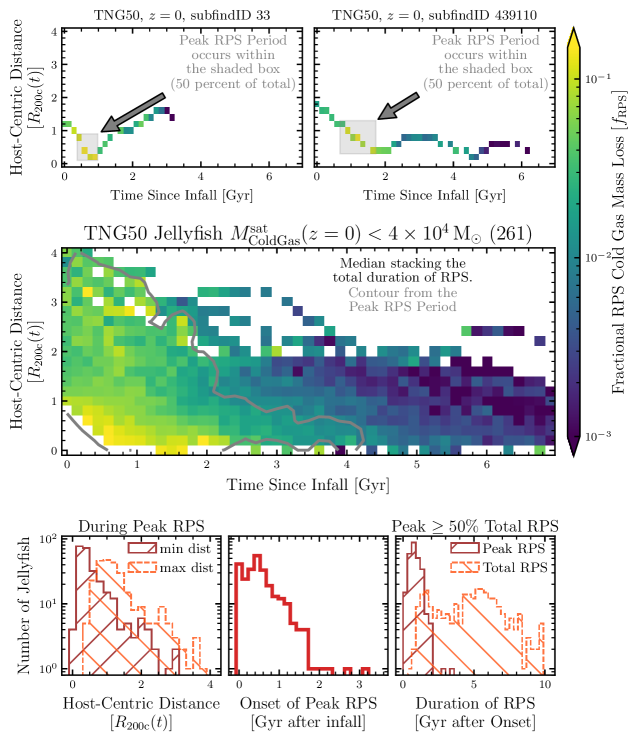
While most TNG50 jellyfish are stripped of their cold gas within Gyr after infall (Fig. 7 right panel; Fig. 8 top panel), the amount of gas being stripped is not constant throughout this period. The halo gas is denser at closer distances to the central galaxy, and jellyfish move faster at closer distances while they are deeper in their host’s potential well. Both of these effects increase the ram pressure stripping acting on satellites at closer distances. We quantify this increase in RPS with decreasing distance in Fig. 9. In the top panels for two example galaxies, we show the fractional RPS loss – the amount of cold gas lost due to RPS since the last snapshot , normalized by the total amount of cold gas lost due to RPS in the satellite’s life:
| (2) |
where and define the total time span of satellite RPS. In general, the fractional RPS increases as a jellyfish approach pericenter, followed by a decrease as it approaches apocenter. For galaxy with SubhaloID 439110 (right panel), the fraction of total gas lost is higher during the first pericentric passage compared to the second because – the total amount of cold gas able to be stripped – is an order of magnitude higher at infall than after its first orbit (at apocenter). There is still an increase in fractional RPS during the second pericentric passage compared to at apocenter, but the majority of RPS for this jellyfish occurs during the first infall through pericentric passage.
We characterize the period of most effective RPS, the peak RPS period, by finding the minimum amount of time required for 50 per cent of the total cold gas loss via RPS to occur. That is, we minimize the difference in bounds such that the integral of the fractional RPS is at least 50 percent:
| (3) |
We highlight the peak RPS periods for the two examples galaxies in Fig. 9, top, with gray boxes, which in both cases occur during the first infall towards pericenter.
In the central panel of Fig. 9, we stack all 261 TNG50 jellyfish with , taking the median fractional RPS loss in the bins with more than one galaxy. Additionally, the gray contour denotes the phase space region obtained when stacking only the peak RPS periods of the jellyfish. Based on the fractional RPS loss (color of bins) and the peak RPS contour, a majority of the RPS occurs within the first few Gyrs after infall and over a wide range of host-centric distances. At a fixed time since infall (single column), there is a higher fractional RPS loss at closer distances. However and especially at times Gyr after infall, there is a significant amount of RPS occurring at large host-centric distances, up to . At later times Gyr after infall, the peak RPS only occurs at closer host-centric distances . The smallest host-centric bin is largely unpopulated (no color) or with few galaxies (not shown but checked). This means that their pericentric passages are at distances , and that they are being stripped of their cold gas in the halos rather than directly into central galaxy. This again supports the claim that tidal stripping is likely not a significant mechanism for cold gas removal for this jellyfish sample.
In the bottom panels of Fig. 9, we show the distributions of the peak RPS period quantities. In the bottom left panel, we show the minimum (dark red, ’/’ hatch, solid outline) and maximum (light red, ’\’ hatch, dashed outline) host-centric distances during the peak RPS periods. The minimum peak RPS distance distribution has its peak (mode) at , and the median (16, 84 percentiles) are . The maximum peak RPS distance distribution peaks at , with median (16, 84 percentiles) at . These distributions reflect that the peak RPS period starts at large distances in the halo (which has been discussed in, e.g., Bahé et al., 2013; Zinger et al., 2018) and continues until approximately the pericentric approach, which for our sample of jellyfish that lose all cold gas by tends to be at (see Zinger et al. in prep., for more details about TNG jellyfish at large distances ). The cold gas is being stripped in, and thereby deposited into, the host halos; we extensively expand on this in § 4.3 and Fig. 10.
In the bottom center panel, we see that the onset of the peak RPS occurs at or just after ( Gyr) infall. Only per cent of these jellyfish galaxies begin their peak RPS period Gyr after infall, suggesting that the infall time is a reasonable definition for the start of the total RPS time span.
In the bottom right panel, we show the peak RPS (dark red, ’/’ hatch, solid outline) and total RPS (light red, ’\’ hatch, dashed outline) time spans. The two distributions here have different times of onset; the peak RPS onset is that given in the bottom center panel, while the total RPS onset is the infall time, which would be 0 in the bottom center panel. The total RPS time span is identical to that in Fig. 7. While the total RPS duration spans a broad range of times Gyr, the peak RPS period is much narrower, spanning only Gyr after onset. Thus while the total RPS time span may be quite long, a majority of the RPS occurs in a relatively short period. While not shown here, the distribution of peak to total RPS time span ranges from , with the mode and median at and respectively.
We note an alternative method for characterizing the effectiveness or peak RPS as the specific RPS (sRPS): RPS / . Typically for the TNG50 jellyfish without cold gas at , the specific RPS + outflows is approximately constant before infall. At infall, the sRPS typically increases through pericenter and near apocenter either plateaus or decreases, sometimes to its pre-infall value. For the galaxies that lose all their cold gas only at or after second pericenter (subfindID 439110 in the top right panel of Fig. 9 for example), the sRPS increases again and always reaches its maximum value at or shortly before . See Appendix B for more details and Fig. 13 for an example.
4 Discussion
4.1 How do these jellyfish-based results generalize to all satellite galaxies?
Throughout this paper, we have focused on jellyfish galaxies, as these are satellites with manifest signs of ongoing RPS. In particular, we have followed satellites along their evolutionary tracks through cosmic epochs and dubbed the inspected galaxies as jellyfish only if they have at least one jellyfish classification since . This is when the temporal sampling of the images on Zooniverse transitioned from every Gyr to every Myr. We also restate that the images posted to Zooniverse used a fixed gas column density colorbar in the range and did not include background subtraction, mimicking a surface brightness limited sample. Hence to have been classified as a jellyfish galaxy, the stripped tails must have been dense enough to have been distinguishable against the background. Lastly, we expect that at any given snapshot, we miss per cent of jellyfish galaxies due to projection effects (Yun et al., 2019, Zinger et al., in prep.).
As shown in Fig. 1 and discussed in § 3.1, jellyfish galaxies tend towards lower stellar masses , higher host masses , and lower satellite-to-host mass ratios at compared to the inspected galaxies and the general population of satellites. Conversely, the inspected galaxies that were not identified as jellyfish tend towards the opposite. First 187 of the 1,186 ( per cent) non-jellyfish galaxies have stellar masses , and may have experienced phases of kinetic AGN feedback, ejecting much of their gas. Of the lower mass non-jellyfish galaxies , we affirm that many of these satellite galaxies are still undergoing or have undergone RPS (see Figure 11), and the question becomes why have they not been identified as jellyfish. These non-jellyfish galaxies have a median satellite-to-host mass ratio , times higher than that for the jellyfish . We generally expect and have shown in Fig. 8 that with increasing satellite-to-host mass ratio RPS is weaker and acts over longer time spans. Accordingly, some of the gaseous tails may not have been identifiable in gas column density compared to the ambient medium. Moreover, the non-jellyfish galaxies have an average infall time at 9.2 Gyr, Gyr later than that of the jellyfish galaxies at 7.5 Gyr. So it is also possible that these late-infalling non-jellyfish have not yet had enough time to undergo enough RPS to form the recognizable tails, although the timescales associated with the appearance and disappearance of the jellyfish tails is largely unconstrained (Smith et al., 2022).
While 261/535 ( per cent) of the jellyfish galaxies have cold gas masses below our resolution limit at , this is only the case for 141/1186 ( per cent) of the non-jellyfish galaxies. Then how can these 141 gas-less satellites have lost all of their cold gas without being identified as jellyfish? Of the galaxies with , the RPS duration for jellyfish includes both short and long time spans Gyr, while for the non-jellyfish the time spans are only long Gyr. Again, this demonstrates that the RPS for the non-jellyfish with higher mass ratios is slower, potentially causing the gaseous tails to be unidentifiable. Furthermore, these gas-less non-jellyfish tend to have even earlier infall times than their jellyfish counterparts. In fact, almost all of the non-jellyfish have infall times before , before the temporal sampling of the images on Zooniverse transitioned from every Gyr to every Myr. So before , we may be missing some jellyfish simply by not inspecting their images often enough. Based on the statistical, physical differences between the general jellyfish and non-jellyfish galaxies, and that we may be missing some high-redshift, jellyfish-like galaxies, we conclude that our primary sample of jellyfish galaxies is pure, but perhaps not complete. And when generalizing the results of the RPS time spans from the jellyfish to all satellites, the time spans would only increase. We have also checked that the peak RPS periods are slightly longer and still occur in the halos for the non-jellyfish galaxies. However, our results only apply to first-infalling galaxies, i.e not to pre-processed galaxies, which is more significant for less massive satellites in more massive hosts. Extending this analysis to pre-processed galaxies would require distinguishing how much RPS occurs in each host, and when the infalling group’s intragroup medium gets stripped.
4.2 The connection between ram pressure stripping and quenching timescales
The 261 TNG50 jellyfish that are gas-poor at were star forming galaxies – on the star forming main sequence (SFMS) – before infall and are instead quenched at – at least than one dex below the SFMS. The question becomes, when between the RPS onset at infall and its end at do these jellyfish quench. We calculate the amount of RPS that has already occurred by the time of last quenching via
| (4) |
where the fractional RPS is defined in equation (2), and is the last time that the galaxy falls at least 1 dex below the SFMS for the last time (Pillepich et al., 2019; Joshi et al., 2021; Donnari et al., 2021).
On average, the jellyfish do not quench until per cent of the total RPS has occurred. Only 3/261 ( per cent) of the jellyfish quench before per cent. Moreover, these jellyfish have already lost per cent of their cold gas by the time they quench. Of the 267 jellyfish galaxies with ), only 83 ( per cent) have quenched whereas the others are still forming stars (see also Göller et al. in prep). These quenched jellyfish also have already lost per cent of their cold gas before quenching. While the peak period of RPS typically occurs during the first infall through pericenter, lasting Gyr, the jellyfish do not quench for the last time until nearly all of their cold gas has been stripped on time spans that can be Gyr after infall. This does not necessarily imply that the galaxies are on the SFMS for the entire duration between infall and , but instead that they quench for the last time only after being stripped of almost all of their cold gas. Jellyfish galaxies are able to continue forming stars well after infall and after they have lost almost all of their cold gas due mostly to RPS.
To define a quenching timescale, one also needs to define the onset of quenching (See Cortese et al., 2021, for a review of various definitions used in the literature). If we assume the infall time as the onset of quenching, then the distribution of quenching timescales is approximately the same as the RPS timescale distribution in Fig. 7 (right panel, red histogram). Thus, the quenching timescales for the TNG50 jellyfish studied here and without cold gas at range from Gyr after infall. However, we note that many of these jellyfish undergo brief ( Gyr) bursts of star-formation between infall and first pericentric passage (Göller et al., in prep.). While it may seem counter-intuitive for the onset of quenching – in this case, infall – to be directly before a burst of star-formation, this starburst coincides exactly with the time span that most jellyfish incur their peak gas loss due to RPS (Fig. 9). Thus the RPS and burst of star-formation may act together, perhaps even enhancing each other, to remove the cold gas from the jellyfish, eventually quenching them.
4.3 RPS deposits satellites’ ISM into the halo
In addition to being stripped of their cold gas, jellyfish galaxies, and more generally satellite galaxies, also provide a source of cold gas to the halo. For a given host, how much cold gas comes directly from ram-pressure stripped jellyfish galaxies?
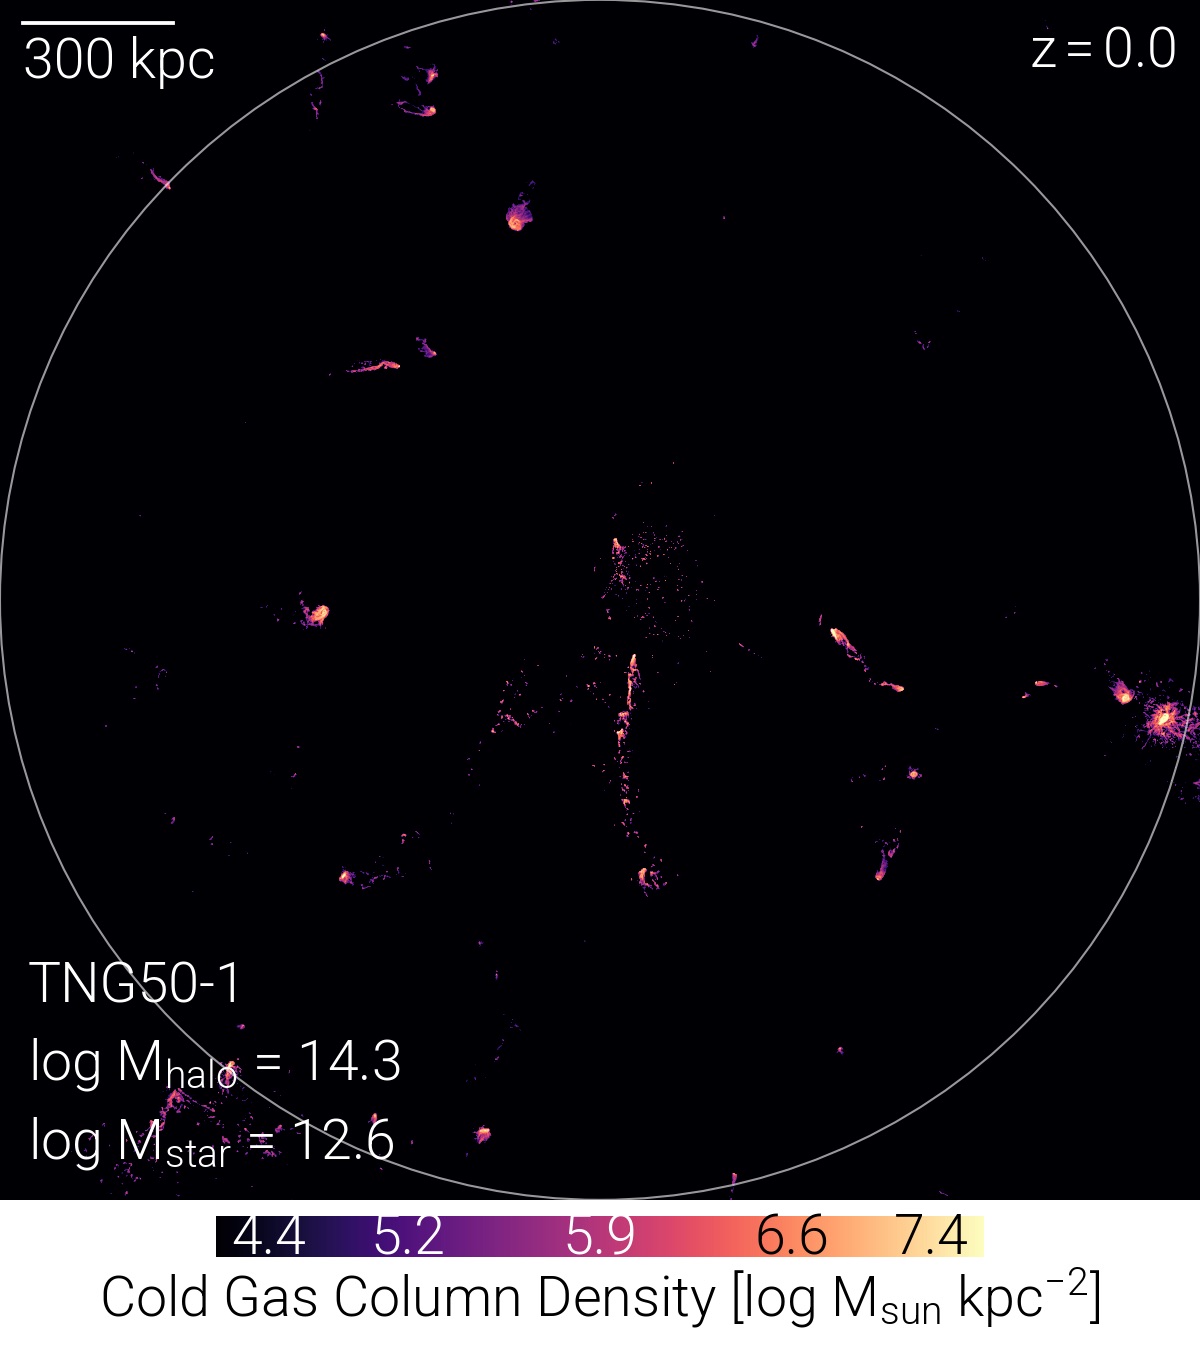
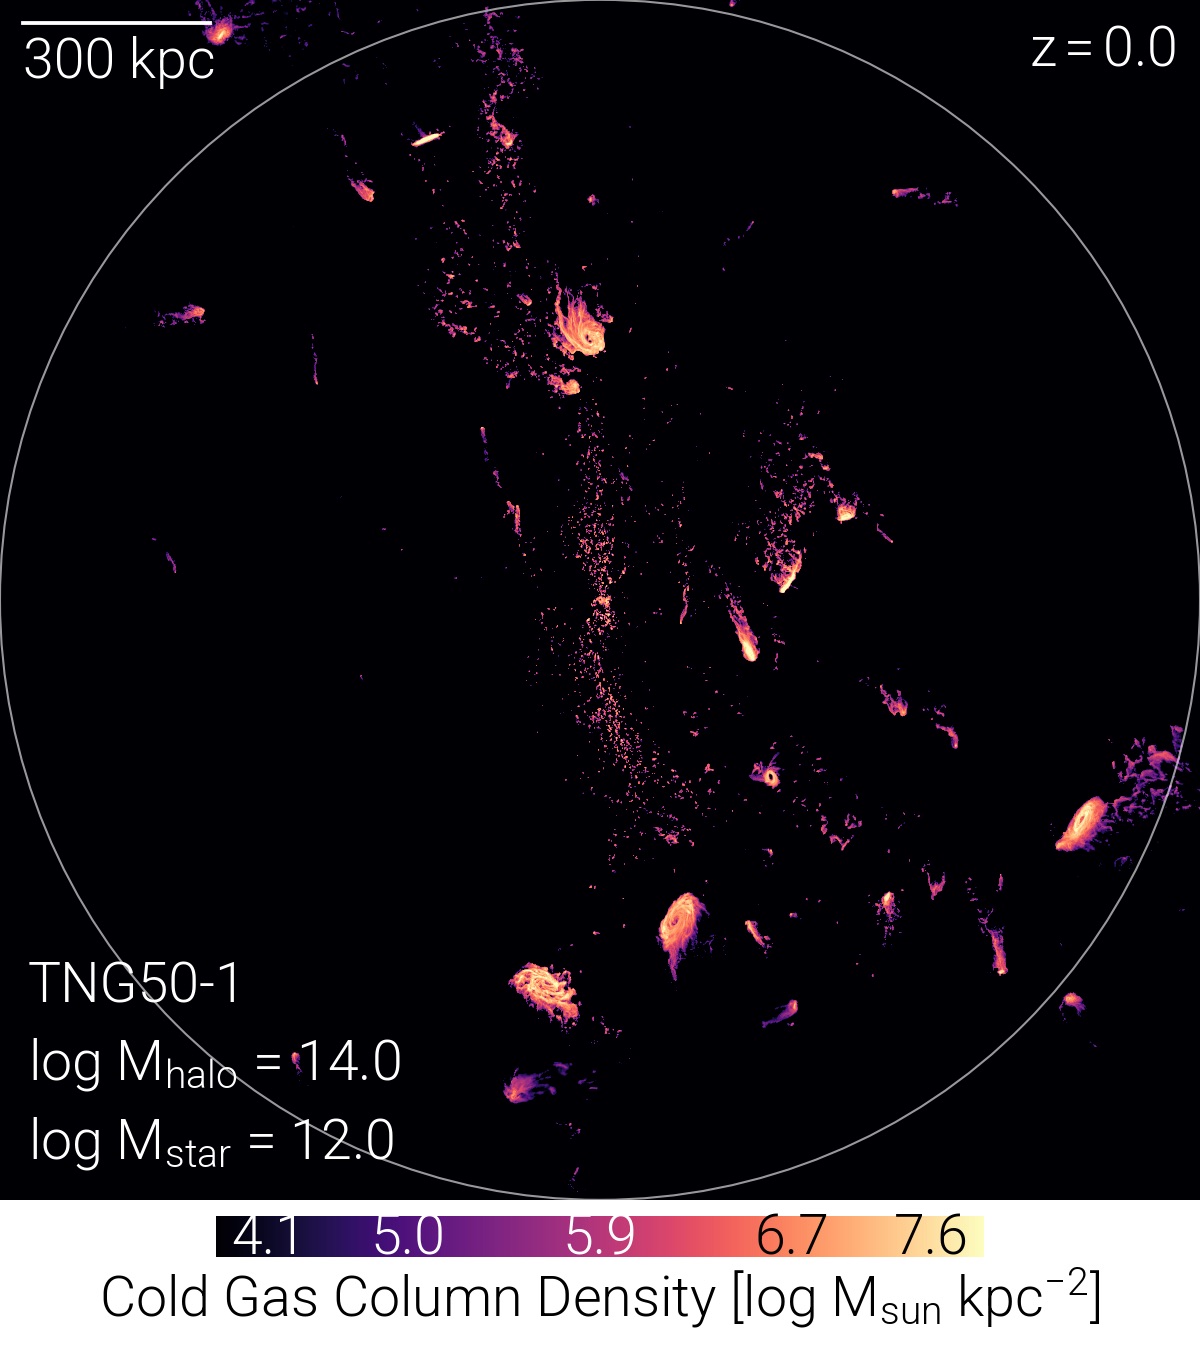
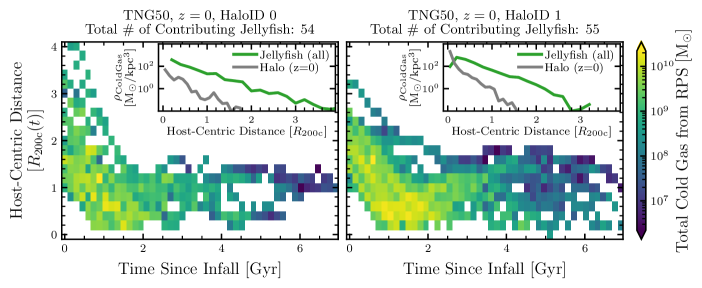
In Fig. 10, we combine all jellyfish galaxies (regardless if they have substantial cold gas at or not) in the the two most massive clusters in TNG50, and show the total amount of deposited cold gas in the time since infall – host-centric distance space, similarly to Fig. 9. We also show the cold gas column density maps for these clusters for reference. Please see Fig. 15 for similar maps of group-mass hosts (), where there are clear features of cold gas clouds that are not gravitationally bound to any satellites. The two clusters have hosted 54 and 55 total contributing jellyfish since approximately , depositing a total of of cold gas mass into the hosts. This is a substantial amount of cold gas: it is about one tenth of the total amount of gas in these halos at any given time, it is of a similar order of magnitude as the stellar mass of the central galaxy of the host at , and it is orders of magnitude more than the amount of ionized and molecular gas that have been recently observed around several brightest central galaxies (e.g. McNamara et al., 2014; Russell et al., 2019).
We can integrate the contributed cold gas along the host-centric distance, yielding the 1D distribution of the deposited cold gas from RPS in time since infall. For the most massive halo in TNG50, the median (16/84 percentiles) of the cold gas from RPS distribution occurs Gyr after infall; for the second most massive halo, Gyr after infall. Again, while some jellyfish contribute cold gas to the hosts over long periods Gyr, a majority of the RPS occurs shortly after infall, qualitatively agreeing with the results discussed in § 3.6 shown in Fig. 9 (bottom center and right panels).
Additionally, we can integrate the contributed cold gas along the time since infall, yielding the host-centric radial distribution of deposited gas from RPS. For the most massive halo in TNG50, the median (16/84 percentiles) of the cold gas from RPS distribution occurs at ; for the second most massive halo, . Thus, we see that the majority of contributed cold gas from RPS is deposited into the outskirts of the gaseous halos (i.e., CGM or ICM) of these most massive hosts in TNG50. In the figure insets, we compare the radial-density distributions of cold gas deposited via RPS from all jellyfish (green) with the cold gas that exists in the halos at (gray, excluding cold gas bound to satellites). For these two cluster-mass hosts, more cold gas has been brought into their halos via RPS over the last many billion years than exists in their intra-cluster media today.
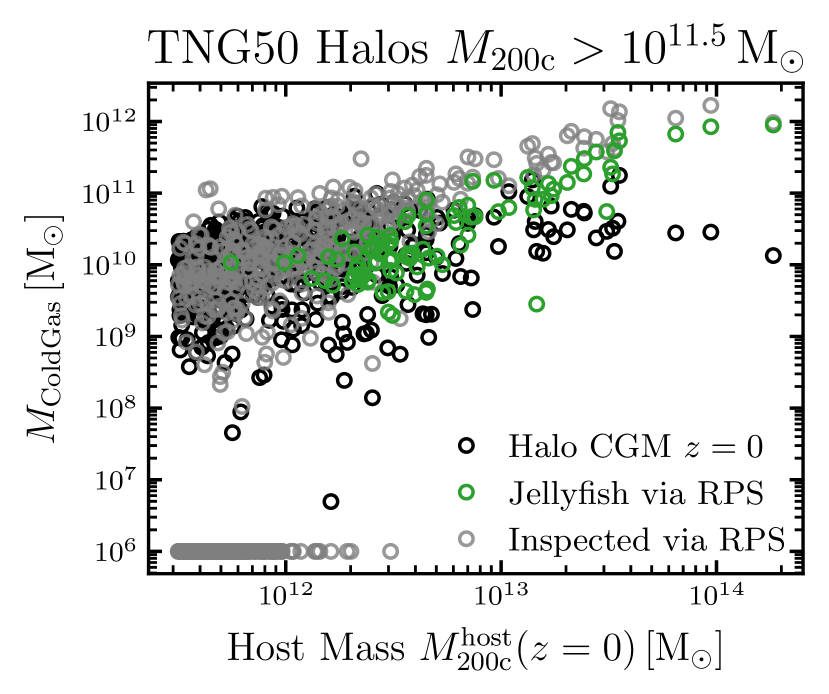
We extend this analysis in Fig. 11 now to include all inspected satellite branches (gray circles) and group- () and Milky-Way-mass () hosts. According to our analysis and to TNG50, over the past billion years satellite galaxies have deposited more than of cold gas mass via RPS in the CGM of halos more massive than . The amount of cold gas in the CGM at (black circles) increases with halo mass until , and afterwards is approximately constant. The amount of cold gas deposited by inspected galaxies in low mass hosts is bimodal, where many hosts have 0 inspected branches. Of the low-mass hosts with inspected branches, the amount of cold gas deposited by ram pressure stripping (RPS) increases with halo mass, which continues with all studied halo masses.
Of the amount of cold gas deposited by RPS of the inspected galaxies, the relative contribution of jellyfish galaxies increases with halo mass, reflecting the trend that a higher percentage of inspected galaxies are jellyfish at the higher host masses (see Fig. 1). At host masses , the inspected galaxies have brought more cold gas into the halos over the past billion years than exists in the CGM today.
Thereby, we claim that jellyfish, and the more generally inspected or satellite galaxies, bring a significant amount of cold gas in the CGM/ICM of massive halos. The question then becomes, what happens to the stripped cold gas between being deposited and . We speculate that this gas could either (i) remain cold in the CGM, (ii) remain cold and rain down on the central galaxy, (iii) mix and heat up with the surrounding hot medium, and/or (iv) be heated up and/or pushed outside of the halo by kinetic AGN feedback (e.g., Ayromlou et al., 2022). Conversely, one could start with the cold CGM clouds at and follow their histories back in time, quantifying how much came from satellites (Nelson et al., 2020). We postpone the task of quantifying the fate of the cold gas brought by satellites into the CGM around galaxies for a future work.
5 Summary and Conclusions
In this work, we use the high-resolution, Mpc magneto-hydrodynamical simulation TNG50 from the IllustrisTNG project to study the satellite-host interaction in a cosmological context for orders of magnitude in satellite stellar and host total mass. In particular, we quantify when, where, and for how long the ram pressure stripping (RPS) of cold gas occur, by focusing on jellyfish galaxies, i.e. satellites with manifest signs of RPS.
We use the results from Zinger et al. (in prep.), which is a follow up from the pilot Zooniverse study from Yun et al. (2019), to identify jellyfish galaxies via visual inspection. Namely, Zinger et al. (in prep.) report and discuss the visual inspection via Zooniverse of 53,610 and 27,094 satellite galaxies from TNG50 and TNG100 with and , for TNG50 and TNG100 respectively. For this paper, in TNG50, we track the 53,610 inspected images across cosmic time, finding a total of 5,023 unique galaxy branches. In the main analysis of this work, we focus on the galaxy branches that survive until , were inspected in the Zooniverse project since , are satellites at , and have not been pre-processed; this returns a pure sample of 1721 galaxies. 535 of these 1721 branches ( per cent) are jellyfish galaxies, meaning that they were classified as a jellyfish galaxy for at least one snapshot since .
Compared to the inspected galaxies and general satellites with , the TNG50 jellyfish galaxies tend to have lower stellar masses, higher host masses, lower satellite-to-host mass ratios, and less gas (Fig. 1). The tails of the jellyfish galaxies are made up of mostly cold gas K) stemming from the jellyfish interstellar media (Figs. 2, 3), though the jellyfish tails may also be observable in, e.g., soft x-rays.
We employ the Monte-Carlo-Lagrangian tracer particles to quantify the relative importance of each cold gas sink, namely SMBH accretion, star-formation (SF), gas heating, and ram-pressure stripping (RPS) + outflows. As individual galaxy tracks suggest, we assume that before infall, i.e. the first time the galaxy becomes a member of its Friends-of-Friends (FoF) host group, RPS+outflows category is dominated by outflows, and after infall RPS is dominant. Then we define the onset of RPS as the infall time and the end of RPS as either when the galaxy’s cold gas mass falls below our resolution limit of () or at the end of the simulation at ; then the total RPS time span is the difference between . With this sample of 535 jellyfish and method to measure RPS, here are main results:
-
•
For an individual example, we show that a single jellyfish branch loses all of its cold gas between infall and apocenter (Fig. 4), and during this period RPS is the dominant channel of cold gas loss (Fig. 5). We check and find that RPS dominates the post-infall cold gas loss for all other jellyfish in the sample.
- •
-
•
For the 261 jellyfish galaxies without cold gas at , the total RPS durations span Gyr (Fig. 7). The dominant factor for determining the RPS time span is the host mass, whereby jellyfish in higher-mass hosts have shorter RPS durations (Fig. 8, top panel). Secondarily, RPS durations decrease with satellite cold gas mass at infall, the stellar mass at , and the number of orbits by (Fig. 8, bottom panels respectively).
-
•
While the total RPS duration may be quite long, most jellyfish incur a majority of their cold gas mass loss via RPS within a short peak RPS period, beginning Gyr after infall and lasting Gyr (Fig. 9 top, bottom center, and bottom right panels). Typically this peak RPS period occurs within of the host and during the first infall.
-
•
jellyfish galaxies continue forming stars for billions of years after infall, until they have lost per cent of their cold gas mass. They quench for the last time only after per cent of the RPS has occurred (§ 4.2).
-
•
In the two most massive halos in TNG50, jellyfish galaxies contribute of cold gas into the intra-cluster medium over the past billion years (ICM; Fig. 10). The radial distribution of cold gas brought in via jellyfish RPS is significantly higher than the amount of cold gas existing in the ICM today. In fact, satellite galaxies deposit over the past billion years of cold gas in the CGM of TNG50 halos (Figs. 11 and 15). For massive hosts, this cold gas contribution is of the same order of magnitude as the stellar mass in the central galaxy today. Therefore, jellyfish galaxies, and the more general population of satellites, bring a significant amount of cold gas into the CGM/ICM of massive hosts.
In summary, we have shown that, according to TNG50, RPS is the dominant cause of loss of cold gas in satellites after they start to interact with their hosts and that satellite galaxies are significant contributors of cold gas to the CGM and ICM. RPS acts on infalling galaxies for very long periods of time, i.e. many billion years on average, even though the majority of the cold gas mass loss occurs faster, with half of the cold gas of satellites being stripped in the span of about 2 billion years or less. This cold gas is typically deposited by the satellites all the way from intermediate host-centric distances to beyond the virial radii of their hosts.
We note that these results apply only to the satellite stellar and total host masses studied in this work, within the TNG model of galaxy formation. For the most massive satellites, , it is possible that their stellar potential is deep enough to retain some of their own CGM post-infall, shielding some of their ISM gas. At these masses, the TNG kinetic mode of SMBH feedback also becomes important, and is thought to dominate, along with RPS, the quenching of these satellites (Donnari et al., 2020). In a future work, we extend these results to more massive satellite and host masses using the upcoming TNG-Cluster project that focuses on massive hosts using the TNG galaxy formation model.
Acknowledgements
ER is a fellow of the International Max Planck Research School for Astronomy and Cosmic Physics at the University of Heidelberg (IMPRS-HD). ER would like to acknowledge the following friends and colleagues (in alphabetical order) for useful comments and discussions that improved the quality of the manuscript: Luca Cortese, Morgan Fouesneau, Junia Göller, Max Häberle, Iva Momcheva, Nhut Truong, Hans-Walter Rix, Nico Winkel.
DN and MA acknowledge funding from the Deutsche Forschungsgemeinschaft (DFG) through an Emmy Noether Research Group (grant number NE 2441/1-1).
GJ acknowledges funding from the European Union’s Horizon 2020 research and innovation programme under grant agreement No. 818085 GMGalaxies.
The TNG50 simulation was run with compute time granted by the Gauss Centre for Supercomputing (GCS) under Large-Scale Projects GCS-DWAR on the GCS share of the supercomputer Hazel Hen at the High Performance Computing Center Stuttgart (HLRS).
This publication uses data generated via the Zooniverse.org platform, development of which is funded by generous support, including a Global Impact Award from Google, and by a grant from the Alfred P. Sloan Foundation. We wish to extend our thanks to the team at Zooniverse with their advice and assistance in building and running this project. We also thank the thousands of volunteers who invested their time and effort to assist us in this project.
Data Availability and Software Used
All TNG simulations are publicly available at https://www.tng-project.org/ and described in Nelson et al. (2019a). The data underlying this article will be shared on reasonable request to the corresponding author. The underlying code will be made publicly available on GitHub upon paper acceptance.
Software used: Python (Van Der Walt et al., 2011); IPython (Pérez & Granger, 2007); Numpy (Van Der Walt et al., 2011; Harris et al., 2020); Scipy (Virtanen et al., 2020); Matplotlib (Hunter, 2007); Jupyter (Kluyver et al., 2016).
This work made extensive use of the NASA Astrophysics Data System and arXiv.org preprint server.
References
- Ayromlou et al. (2019) Ayromlou M., Nelson D., Yates R. M., Kauffmann G., White S. D., 2019, MNRAS, 487, 4313
- Ayromlou et al. (2022) Ayromlou M., Nelson D., Pillepich A., 2022, arXiv, p. arXiv:2211.07659
- Bahé & McCarthy (2015) Bahé Y. M., McCarthy I. G., 2015, MNRAS, 447, 969
- Bahé et al. (2013) Bahé Y. M., McCarthy I. G., Balogh M. L., Font A. S., 2013, MNRAS, 430, 3017
- Balogh & Morris (2000) Balogh M. L., Morris S. L., 2000, MNRAS, 318, 703
- Bekki (2009) Bekki K., 2009, MNRAS, 399, 2221
- Bluck et al. (2020) Bluck A. F., et al., 2020, MNRAS, 499, 230
- Boselli et al. (2022) Boselli A., Fossati M., Sun M., 2022, The Astronomy and Astrophysics Review, 30, 1
- Brown et al. (2016) Brown T., et al., 2016, MNRAS, 466, 1275
- Cayatte et al. (1990) Cayatte V., van Gorkom J. H., Balkowski C., Kotanyi C., Cayatte V., van Gorkom J. H., Balkowski C., Kotanyi C., 1990, AJ, 100, 604
- Cayatte et al. (1994) Cayatte V., Kotanyi C., Balkowski C., van Gorkom J. H., Cayatte V., Kotanyi C., Balkowski C., van Gorkom J. H., 1994, AJ, 107, 1003
- Chies-Santos et al. (2015) Chies-Santos A. L., et al., 2015, MNRAS, 450, 4458
- Choi et al. (2022) Choi W., Kim C.-G., Chung A., 2022, arXiv
- Cole et al. (2000) Cole S., Lacey C. G., Baugh C. M., Frenk C. S., 2000, MNRAS, 319, 168
- Cortese et al. (2006) Cortese L., Gavazzi G., Boselli A., Franzetti P., Kennicutt R. C., O’Neil K., Sakai S., 2006, A&A, 453, 847
- Cortese et al. (2021) Cortese L., Catinella B., Smith R., 2021, PASP, 38, e035
- Cowie et al. (1977) Cowie L. L., Binney J., Cowie L. L., Binney J., 1977, ApJ, 215, 723
- Davis et al. (1985) Davis M., Efstathiou G., Frenk C. S., White S. D. M., Davis M., Efstathiou G., Frenk C. S., White S. D. M., 1985, ApJ, 292, 371
- Dekel & Birnboim (2008) Dekel A., Birnboim Y., 2008, MNRAS, 383, 119
- Dolag et al. (2009) Dolag K., Borgani S., Murante G., Springel V., 2009, MNRAS, 399, 497
- Donnari et al. (2020) Donnari M., et al., 2020, MNRAS, 500, 4004
- Donnari et al. (2021) Donnari M., Pillepich A., Nelson D., Marinacci F., Vogelsberger M., Hernquist L., 2021, MNRAS, 506, 4760
- Ebeling et al. (2014) Ebeling H., Stephenson L. N., Edge A. C., 2014, ApJL, 781, L40
- Fielding & Bryan (2022) Fielding D. B., Bryan G. L., 2022, ApJ, 924, 82
- Franchetto et al. (2021) Franchetto A., et al., 2021, ApJL, 922, L6
- Garling et al. (2022) Garling C. T., Peter A. H. G., Spekkens K., Sand D. J., Hargis J., Crnojević D., Carlin J. L., 2022, MNRAS, 000, 1
- Gavazzi & Jaffe (1987) Gavazzi G., Jaffe W., 1987, A&A, 186, L1
- Gavazzi et al. (2001) Gavazzi G., Boselli A., Mayer L., Iglesias-Paramo J., Vilchez J. M., Carrasco L., 2001, ApJL, 563, L23
- Genel et al. (2013) Genel S., Vogelsberger M., Nelson D., Sijacki D., Springel V., Hernquist L., 2013, MNRAS, 435, 1426
- Giovanelli et al. (1985) Giovanelli R., Haynes M. P., Giovanelli R., Haynes M. P., 1985, ApJ, 292, 404
- Gronke et al. (2022) Gronke M., Oh S. P., Ji S., Norman C., 2022, MNRAS, 511, 859
- Gunn et al. (1972) Gunn J. E., Gott J. Richard I., Gunn J. E., Gott J. Richard I., 1972, ApJ, 176, 1
- Harris et al. (2020) Harris C. R., et al., 2020, Nature, 585, 357
- Hunter (2007) Hunter J. D., 2007, Computing in Science and Engineering, 9, 90
- Ignesti et al. (2022) Ignesti A., et al., 2022, ApJ, 924, 64
- Jáchym et al. (2017) Jáchym P., et al., 2017, ApJ, 839, 114
- Joshi et al. (2021) Joshi G. D., Pillepich A., Nelson D., Zinger E., Marinacci F., Springel V., Vogelsberger M., Hernquist L., 2021, MNRAS, 508, 1652
- Jung et al. (2018) Jung S. L., Choi H., Wong O. I., Kimm T., Chung A., Yi S. K., 2018, ApJ, 865, 156
- Kenney et al. (2004) Kenney J. D. P., van Gorkom J. H., Vollmer B., 2004, AJ, 127, 3361
- Kluyver et al. (2016) Kluyver T., et al., 2016, in Positioning and Power in Academic Publishing: Players, Agents and Agendas - Proceedings of the 20th International Conference on Electronic Publishing, ELPUB 2016. IOS Press, pp 87–90, doi:10.3233/978-1-61499-649-1-87, https://ebooks.iospress.nl/doi/10.3233/978-1-61499-649-1-87
- Kraft et al. (2022) Kraft R., et al., 2022, arXiv, p. arXiv:2211.09827
- Kukstas et al. (2022) Kukstas E., et al., 2022, MNRAS, 518, 4782
- Lagos et al. (2018) Lagos C. d. P., Tobar R. J., Robotham A. S., Obreschkow D., Mitchell P. D., Power C., Elahi P. J., 2018, MNRAS, 481, 3573
- Lee et al. (2020) Lee J., Kimm T., Katz H., Rosdahl J., Devriendt J., Slyz A., 2020, ApJ, 905, 31
- Lee et al. (2022a) Lee S., Sheen Y. K., Yoon H., Jaffé Y., Chung A., 2022a, MNRAS, 517, 2912
- Lee et al. (2022b) Lee J., Kimm T., Blaizot J., Katz H., Lee W., Sheen Y.-K., Devriendt J., Slyz A., 2022b, ApJ, 928, 144
- Li et al. (2020) Li Z., Hopkins P. F., Squire J., Hummels C., 2020, MNRAS, 492, 1841
- Maier et al. (2019a) Maier C., Ziegler B. L., Haines C. P., Smith G. P., 2019a, A&A, 621, A131
- Maier et al. (2019b) Maier C., Hayashi M., Ziegler B. L., Kodama T., 2019b, A&A, 626, A14
- Maier et al. (2022) Maier C., Haines C. P., Ziegler B. L., 2022, A&A, 658, A190
- Marinacci et al. (2018) Marinacci F., et al., 2018, MNRAS, 480, 5113
- McNamara et al. (2014) McNamara B. R., et al., 2014, arXiv, 3, arXiv:1403.4249
- McPartland et al. (2016) McPartland C., Ebeling H., Roediger E., Blumenthal K., 2016, MNRAS, 455, 2994
- Mistani et al. (2016) Mistani P. A., et al., 2016, MNRAS, 455, 2323
- Naiman et al. (2018) Naiman J. P., et al., 2018, MNRAS, 477, 1206
- Nelson et al. (2013) Nelson D., Vogelsberger M., Genel S., Sijacki D., Kereš D., Springel V., Hernquist L., 2013, MNRAS, 429, 3353
- Nelson et al. (2018) Nelson D., et al., 2018, MNRAS, 475, 624
- Nelson et al. (2019a) Nelson D., et al., 2019a, Computational Astrophysics and Cosmology, 6, 1
- Nelson et al. (2019b) Nelson D., et al., 2019b, MNRAS, 490, 3234
- Nelson et al. (2020) Nelson D., et al., 2020, MNRAS, 498, 2391
- Nulsen et al. (1982) Nulsen P. E. J., Nulsen J. P. E., 1982, MNRAS, 198, 1007
- Oman et al. (2021) Oman K. A., Bahé Y. M., Healy J., Hess K. M., Hudson M. J., Verheijen M. A., 2021, MNRAS, 501, 5073
- Pakmor & Springel (2013) Pakmor R., Springel V., 2013, MNRAS, 432, 176
- Pakmor et al. (2011) Pakmor R., Bauer A., Springel V., 2011, MNRAS, 418, 1392
- Pallero et al. (2022) Pallero D., Gómez F. A., Padilla N. D., Bahé Y. M., Vega-Martínez C. A., Torres-Flores S., 2022, MNRAS, 511, 3210
- Peluso et al. (2022) Peluso G., et al., 2022, ApJ, 927, 130
- Peng et al. (2010) Peng Y.-j., et al., 2010, ApJ, 721, 193
- Peng et al. (2012) Peng Y. J., Lilly S. J., Renzini A., Carollo M., 2012, ApJ, 757, 4
- Pérez & Granger (2007) Pérez F., Granger B. E., 2007, Computing in Science and Engineering, 9, 21
- Pillepich et al. (2018a) Pillepich A., et al., 2018a, MNRAS, 473, 4077
- Pillepich et al. (2018b) Pillepich A., et al., 2018b, MNRAS, 475, 648
- Pillepich et al. (2019) Pillepich A., et al., 2019, MNRAS, 490, 3196
- Planck Collaboration et al. (2016) Planck Collaboration et al., 2016, A&A, 594, A13
- Poggianti et al. (2017a) Poggianti B. M., et al., 2017a, Nature, 548, 304
- Poggianti et al. (2017b) Poggianti B. M., et al., 2017b, ApJ, 844, 48
- Poggianti et al. (2019) Poggianti B. M., et al., 2019, ApJ, 887, 155
- Roberts & Parker (2020) Roberts I. D., Parker L. C., 2020, MNRAS, 495, 554
- Roberts et al. (2019) Roberts I. D., Parker L. C., Brown T., Joshi G. D., Hlavacek-Larrondo J., Wadsley J., 2019, ApJ, 873, 42
- Roberts et al. (2021) Roberts I. D., et al., 2021, A&A, 650, A111
- Roberts et al. (2022) Roberts I. D., et al., 2022, arXiv
- Rodriguez-Gomez et al. (2015) Rodriguez-Gomez V., et al., 2015, MNRAS, 449, 49
- Rodríguez et al. (2022) Rodríguez S., Lambas D. G., Padilla N. D., Tissera P., Bignone L., Dominguez-Tenreiro R., Gonzalez R., Pedrosa S., 2022, MNRAS, 000, 1
- Roman-Oliveira et al. (2019) Roman-Oliveira F. V., Chies-Santos A. L., Pino B. R. D., Aragón-Salamanca A., Gray M. E., Bamford S. P., 2019, MNRAS, 484, 892
- Russell et al. (2019) Russell H. R., et al., 2019, Monthly Notices of the Royal Astronomical Society, 490, 3025
- Samuel et al. (2022) Samuel J., Pardasani B., Wetzel A., Santistevan I., Boylan-Kolchin M., Moreno J., Faucher-Giguere C.-A., 2022, MNRAS, 000, 1
- Schaefer et al. (2017) Schaefer A. L., et al., 2017, MNRAS, 464, 121
- Schaefer et al. (2019) Schaefer A. L., et al., 2019, MNRAS, 483, 2851
- Shimwell et al. (2017) Shimwell T. W., et al., 2017, A&A, 598, A104
- Smith et al. (2010) Smith R. J., et al., 2010, MNRAS, 408, 1417
- Smith et al. (2022) Smith R., et al., 2022, arXiv
- Somerville et al. (2008) Somerville R. S., Hopkins P. F., Cox T. J., Robertson B. E., Hernquist L., 2008, MNRAS, 391, 481
- Sparre et al. (2020) Sparre M., Pfrommer C., Ehlert K., 2020, MNRAS, 499, 4261
- Springel (2010) Springel V., 2010, MNRAS, 401, 791
- Springel & Hernquist (2003) Springel V., Hernquist L., 2003, MNRAS, 339, 289
- Springel et al. (2001) Springel V., White S. D., Tormen G., Kauffmann G., 2001, MNRAS, 328, 726
- Springel et al. (2018) Springel V., et al., 2018, MNRAS, 475, 676
- Stevens et al. (2019) Stevens A. R. H., et al., 2019, MNRAS, 483, 5334
- Stevens et al. (2021) Stevens A. R. H., et al., 2021, MNRAS, 502, 3158
- Sun et al. (2006) Sun M., Jones C., Forman W., Nulsen P. E. J., Donahue M., Voit G. M., 2006, ApJL, 637, L81
- Terrazas et al. (2020) Terrazas B. A., et al., 2020, MNRAS, 493, 1888
- Tonnesen & Bryan (2009) Tonnesen S., Bryan G. L., 2009, ApJ, 694, 789
- Van Der Walt et al. (2011) Van Der Walt S., Colbert S. C., Varoquaux G., 2011, Computing in Science and Engineering, 13, 22
- Virtanen et al. (2020) Virtanen P., et al., 2020, Nature Methods, 17, 261
- Vollmer et al. (2001) Vollmer B., Cayatte V., Balkowski C., Duschl W. J., 2001, ApJ, 561, 708
- Vulcani et al. (2018) Vulcani B., et al., 2018, ApJ, 866, L25
- Vulcani et al. (2020) Vulcani B., et al., 2020, ApJ, 892, 146
- Wang (2022) Wang B., 2022, MNRAS, 516, 4293
- Wang et al. (2023) Wang D., Lagos C. D. P., Croom S. M., Wright R. J., Bahé Y. M., Bryant J. J., van de Sande J., Vaughan S. P., 2023, MNRAS, 000, 1
- Warmels et al. (1988) Warmels R. H., Warmels H. R., 1988, A&AS, 72, 427
- Weinberger et al. (2017) Weinberger R., et al., 2017, MNRAS, 465, 3291
- Wetzel et al. (2012) Wetzel A. R., Tinker J. L., Conroy C., 2012, MNRAS, 424, 232
- Wetzel et al. (2013) Wetzel A. R., Tinker J. L., Conroy C., van den Bosch F. C., 2013, MNRAS, 432, 336
- Wright et al. (2019) Wright R. J., Lagos C. D. P., Davies L. J., Power C., Trayford J. W., Ivy Wong O., 2019, MNRAS, 487, 3740
- Wright et al. (2022) Wright R. J., Lagos C. d. P., Power C., Stevens A. R. H., Cortese L., Poulton R. J. J., 2022, MNRAS, 000, 1
- Yun et al. (2019) Yun K., et al., 2019, MNRAS, 483, 1042
- Zinger et al. (2018) Zinger E., Dekel A., Kravtsov A. V., Nagai D., Zinger E., Dekel A., Kravtsov A. V., Nagai D., 2018, MNRAS, 475, 3654
- Zinger et al. (2020) Zinger E., et al., 2020, Ejective and preventative: The illustristng black hole feedback and its effects on the thermodynamics of the gas within and around galaxies, doi:10.1093/mnras/staa2607, http://www.tng-project.org/
- Zoldan et al. (2016) Zoldan A., De Lucia G., Xie L., Fontanot F., Hirschmann M., 2016, MNRAS, 465, 2236
Appendix A Tracking individual galaxies across epochs
In the Cosmological Jellyfish project, whose results we use here and are summarized and discussed by Zinger (et al., in prep.), gas-map images were posted of TNG50 (and TNG100, though not discussed here) satellite galaxies meeting the criteria summarized in § 2.2 at all 33 snapshots since (snapshots 99-67), plus at four additional snapshots corresponding to redshifts (snapshots 59, 50, 40, 33). Many galaxies were inspected at multiple snapshots. However, for this work we focus on the unique evolutionary tracks, or branches, of individual galaxies using sublink_gal (Rodriguez-Gomez et al., 2015). In practice, we load the main progenitor branch (MPB) of every galaxy inspected at (snapshot 99), saving the galaxies’ subfindIDs at all previous snapshots. Then at each earlier inspection snapshot (98, 98, …, 67, 59, 50, 40, 33), we check which galaxies’ MPB have already been saved. If not, then we save the MPB and continue to the next snapshot. Within the 53610 inspected galaxy images in TNG50, there 5023 are unique branches.
As summarized in § 2.4, throughout this work we exclude galaxies if they do not exist at , are backsplash galaxies at , or have been pre-processed. For each branch that is not inspected at (snapshot 99), we load the main descendent branch (MDB). With the MDB, we find the last snapshot at which the galaxy exists, typically either when the galaxy merges with another more massive galaxy (subhalo coalescence) or at . We are interested only in galaxies that exist as satellites at , so we exclude 2341 branches that do not exist as satellites at . To determine whether the remaining galaxies that are satellites at are have been pre-processed, we examine both the galaxies’ and their hosts’ MPBs (technically the MPBs of their hosts’ main subhalos). Then at each snapshot, we classify each galaxy’s Friends-of-Friends (FoF) group membership into exactly one of three categories:
-
•
the main (central) subhalo of the group;
-
•
a satellite of its host;
-
•
a satellite of a group other its host.
Then using these categorizations across the snapshots, we can determine if the galaxy was pre-processed; if the galaxy spent at least consecutive snapshots as a satellite in a host – other than its host – of mass . If the galaxy instead spent these snapshots in its host, then spent some snapshots as a central galaxy, before eventually being a satellite in the same group, then we do not consider the galaxy to be pre-processed and include the galaxy in the analysis. We exclude a total of 341 TNG50 pre-processed galaxies666The most massive TNG50 halo accretes a group at , and we therefore exclude many of this group’s pre-processed jellyfish..
In general, we classify all TNG50 galaxies at all snapshots as one of the three above categories. Then for all systems, we further flag and exclude current backsplash galaxies, i.e. galaxies that have spent consecutive snapshots in a host of mass before eventually being a central galaxy at . This definition is nearly equivalent to that used by Zinger et al. (2020), except that they use and (i.e., no criterion for host mass). Additionally we note that, especially during massive mergers, subfind may confuse which galaxy is actually the central and which is the satellite. Consequently some galaxies (such as central galaxy of the most massive cluster in TNG50) may be classified as a backsplash galaxy due to this “swapping problem", so we recommend using caution when physically interpreting these backsplash galaxies.
Further, we check whether each satellite subhalo was pre-processed or previously a backsplash galaxy. The pre-processing definition is above. A galaxy was previously a backsplash galaxy if it spent at least in any host of mass , then spent at least consecutive snapshots as a central, before eventually being a satellite at . A given satellite may be a previous backsplash but not pre-processed if the previous host is also the host; pre-processed but not previously a backsplash if the galaxy falls into a pre-processing host and this pre-processing host falls into the host; both a previous backsplash and pre-processed; or neither. Previously Donnari et al. (2021) combined these two flags – pre-processed and previous backsplash – as one general “pre-processing" flag, while in this analysis we include previous backsplash galaxies. Additionally, Donnari et al. (2021) use and , and the catalogs utilize sublink rather than sublink_gal (Rodriguez-Gomez et al., 2015).
Appendix B Comparisons of the Onset of RPS
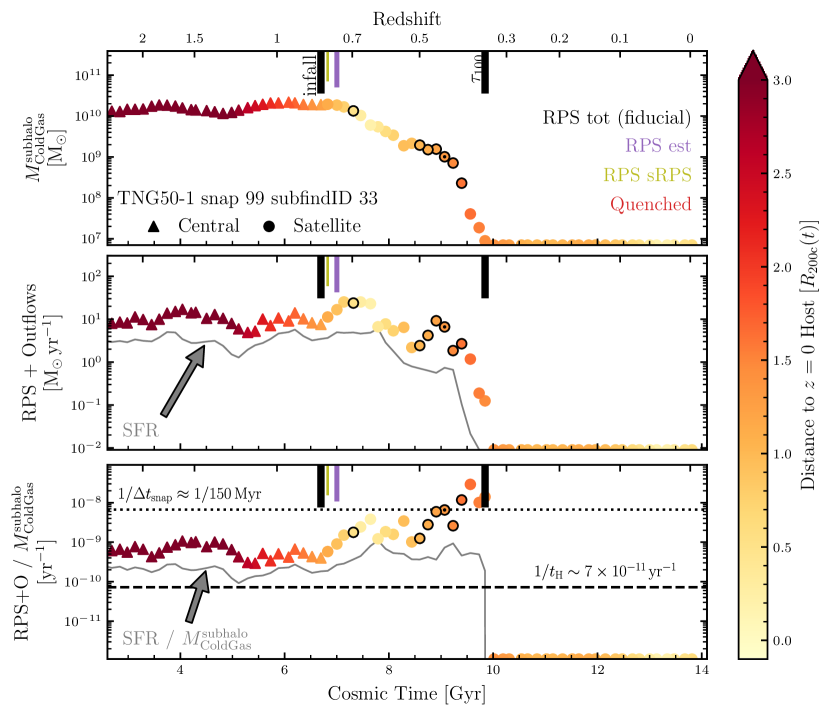
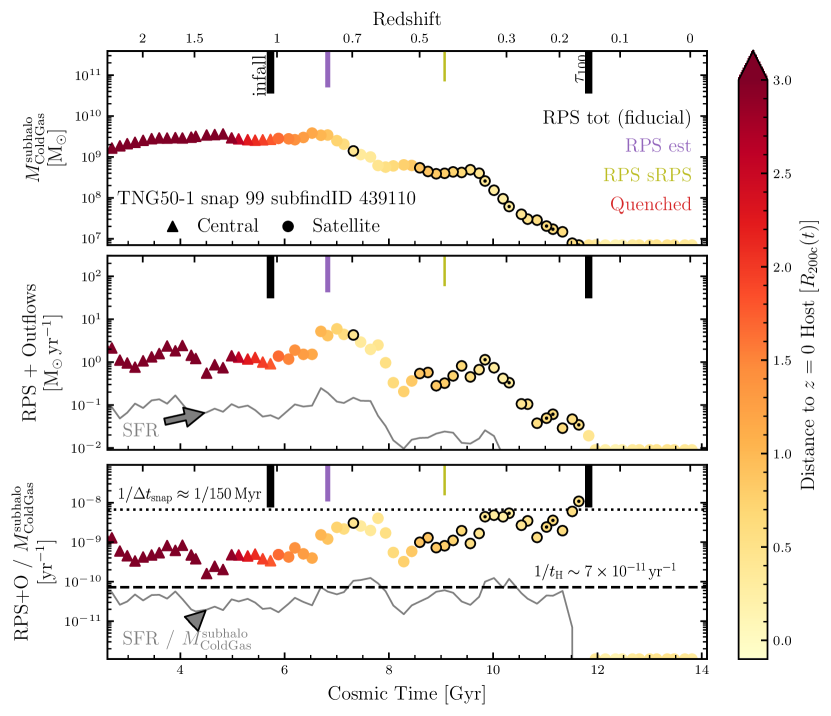
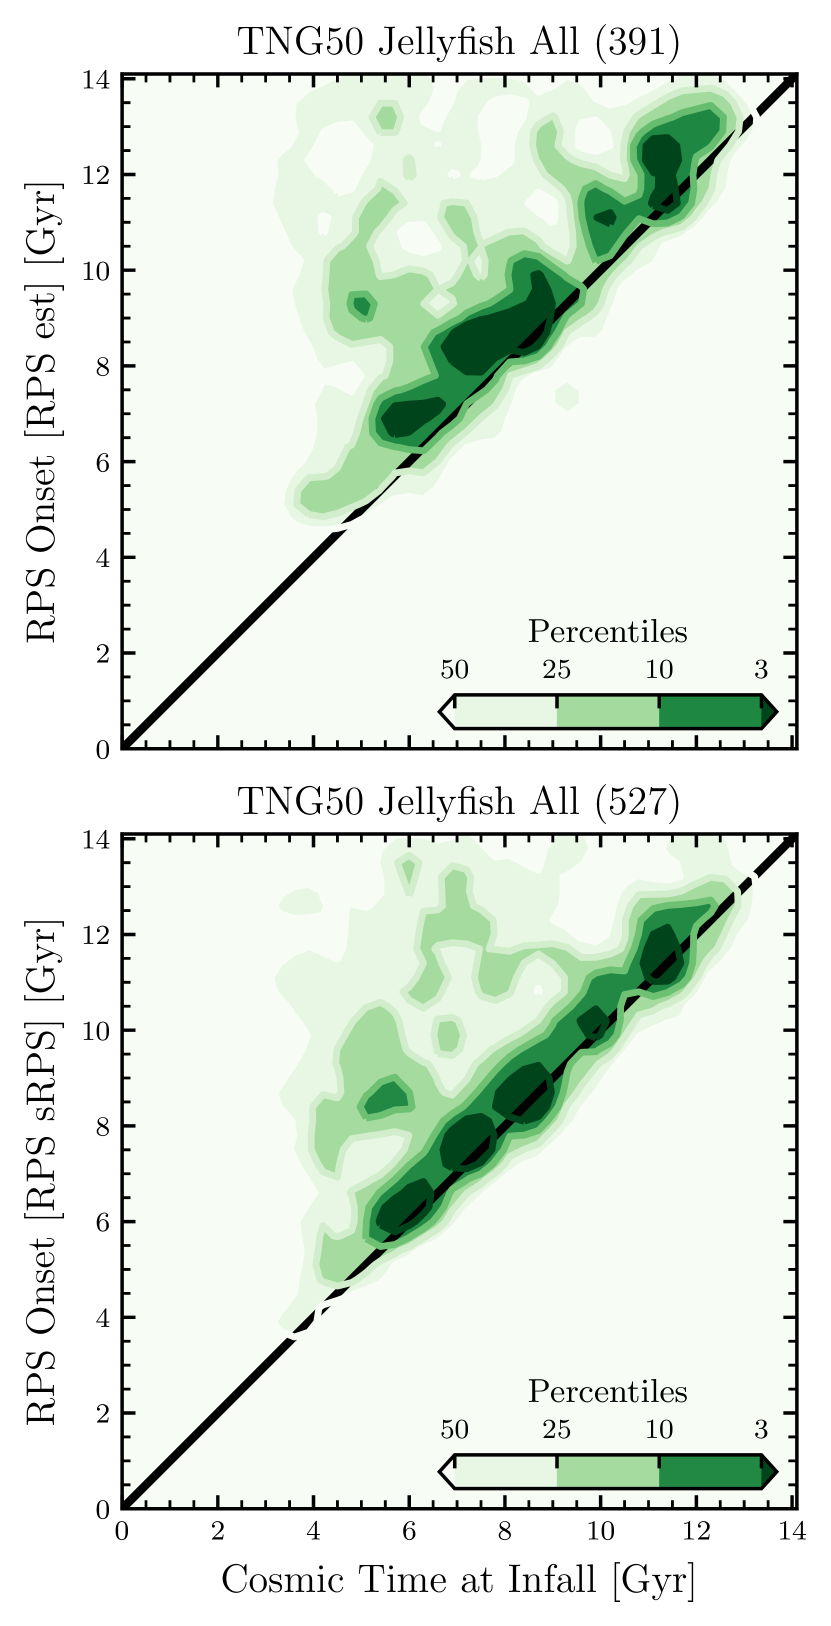
Throughout the paper, we define the onset of ram-pressure stripping (RPS) as the infall time, as the first time a galaxy becomes a member of its Friends-of-Friends (FoF) host group. The FoF algorithm decides group membership based on the relative positions of dark matter particles, and there are a-priori no constraints on the shape or total size of the halo; that is, we do not assume spherical halos where galaxies become satellite members upon crossing the virial radius . Consequently, there is a range of infall distances , ranging from (see Fig. 9, middle panel). Throughout this paper, we consider this FoF infall time to be onset of environmental effects for these first-infalling, not pre-processed jellyfish. Moreover, using this infall time as the onset and the time when galaxies lose all cold gas as the end of RPS allows us to measure the entire RPS time span , at least for the galaxies that lose all cold gas by the end of the simulation at .
We have checked our results using two additional definitions for measuring the onset of RPS . First, we assume that the pre-infall outflows are primarily star-formation-driven outflows. Then we measure each galaxy’s cold gas loading factor as the median cold gas loss due to outflows divided by the star-formation rate (SFR)
| (5) |
where “Outflows" is the (RPS + Outflows) total cold gas mass loss from RPS + outflows directly measured using the tracer particles, before infall assumed to be entirely outflows. Then after infall, we estimate the amount of star-formation-driven outflows as the product of and the SFR. Thus, we attempt to separate the measured RPS+Outflows into the two components:
| (6) |
where “RPS est" is the estimated RPS and (RPS + outflows) is the quantity measured using the tracer particles. Then we find the peak of “RPS est" and go backwards in time until the this estimated RPS vanishes, i.e. until the (RPS + outflows) can be fully estimated by just star-formation-driven outflows. In practice, we calculate the running median of the estimated outflows and total RPS + outflows over consecutive snapshots ( Gyr), and find where the difference, the estimated RPS, peaks. Then we go backwards in time until the running median of the estimated RPS vanishes, where this time marks the onset of RPS. In Fig. 12, the onset of RPS using this “RPS est" is shown with a purple tick, where this estimated onset of RPS is 2 snapshots ( Myr) after the infall time. In the middle panel after infall, there is an increase in the total RPS + outflows (triangles and circles) while the SFR (gray) remains approximately constant. Thus, the “RPS est"-onset is similar to the infall time.
While this method attempts to separate the relative amounts of cold gas loss via (RPS + outflows) into RPS and outflows, there are a number of disadvantages. First, this method assumes that the cold gas mass loading factor – which varies with galaxy stellar mass, cold gas mass, and SFR – is approximately constant before and after infall. Then as a number of galaxies experience a burst of star-formation between infall and first pericentric passage, the approximations of may break down. For the example jellyfish in Fig. 13, there is both an increase in the RPS + outflows and in the SFR after infall, delaying the “RPS est"-onset of RPS by 7 snapshots ( Gyr). In fact, for 137/535 ( per cent) jellyfish galaxies, the -estimated outflows account for the entire budget of cold gas mass loss via (RPS + outflows), meaning that the estimated RPS is null. For this sample of visually-inspected galaxies to be undergoing RPS, we conclude that this method overestimates the contribution from outflows and thereby may inaccurately determine the onset of RPS.
The increased star-formation in jellyfish galaxies during infall may be caused by the RPS-induced compression of gas, especially on the leading side (e.g., Roberts et al., 2022). Then the star-formation-driven outflows fight against the gravity of the stellar body, making the gas more susceptible to RPS (e.g., Garling et al., 2022). In this context, separating the total RPS and outflows may be futile. Both outflows and RPS work to remove the galaxy’s cold gas, the fuel for star-formation, and deposit the galaxy’s ISM into the halo.
In spite of this, for the remaining 391 jellyfish galaxies with non-vanishing estimated RPS contributions, the “RPS est" onset of RPS is typically snapshots ( Myr) later than the infall time (Fig. 14, top panel). The difference between this and the fiducial onset is significantly shorter than the total RPS time span, where the end of RPS is the same for both definitions (when ). Thus, when attempting to capture the entire duration of RPS, we choose infall time over the “RPS est" start as the fiducial onset of RPS.
As a second alternative, we use the specific RPS and outflows (sRPS+O), namely the cold gas mass loss due to RPS and outflows (RPS+O) divided by the total amount of cold gas . Here, the units are , where the inverse yields the timescale to lose all cold gas to RPS+O (at constant RPS+O). We calculate the median pre-infall sRPS+O, and find where the sRPS+O peaks. For all 261 jellyfish without cold gas at , the maximum sRPS+O (shortest timescale) occurs at one of the last 3 snapshots that the galaxy has some cold gas. This peak value is typically , which is approximately the inverse time between snapshots . Then we go backwards from this peak until the running median of the sRPS+O over ( Gyr) returns to the pre-infall average, and this time defines the onset of RPS. In Figs. 12, 13, this “RPS sRPS" onset is marked with olive ticks.
For galaxies that lose all cold gas approximately within the first orbit or by the first pericentric passage, such as the example in Fig. 12, the “RPS sRPS" onset is typically snapshots ( Myr) of the infall time (Figure 14, top panel). While the sRPS+O generally increases between infall and pericentric passage, the sRPS+O may plateau or decrease near apocenter. Sometimes this apocentric decrease may bring the sRPS+O back to the pre-infall average. In these cases, then the “RPS sRPS" onset occurs on the second infall, such as for the example in Fig. 13. This leads to a number of galaxies with “RPS sRPS" onsets significantly after infall, shown in Fig. 14 (bottom panel). This definition estimates that these galaxies actually undergo multiple periods of ram-pressure stripping. However for determining the entire duration of RPS, splitting the entire RPS process into multiple periods is not helpful. Thus, we choose the infall time as the onset of RPS.
Appendix C Cold gas in massive groups of TNG50 today
Fig. 15 shows the column density maps of the cold gas (all halo gas with temperatures K, including gas gravitationally bound to satellites) in the twenty most massive halos of TNG50 at beyond those shown in Fig. 10. Lots of cold gas may be found at amid gaseous halos of K, as quantitatively shown in Fig. 11.