Ultrafast Relaxation Dynamics of Spin-Density Wave Order
in BaFe2As2 under High Pressures
Abstract
BaFe2As2 is the parent compound for a family of iron-based high-temperature superconductors as well as a prototypical example of the spin-density wave (SDW) system. In this study, we perform an optical pump-probe study of this compound to systematically investigate the SDW order across the pressure-temperature phase diagram. The suppression of the SDW order by pressure manifests itself by the increase of relaxation time together with the decrease of the pump-probe signal and the pump energy necessary for complete vaporization of the SDW condensate. We have found that the pressure-driven suppression of the SDW order at low temperature occurs gradually in contrast to the thermally-induced SDW transition. Our results suggest that the pressure-driven quantum phase transition in BaFe2As2 (and probably other iron pnictides) is continuous and it is caused by the gradual worsening of the Fermi-surface nesting conditions.
I Introduction
Iron pnictide high- superconductors have become one of the most intensively studied material systems since their discovery in 2008 [1]. In contrast to superconducting cuprates, they demonstrate a high sensitivity to the applied stress, for instance, to the hydrostatic pressure. The magnetic spin-density wave (SDW) order in a parental compound for these materials can be suppressed not only by chemical doping, but also by pressure [2]. Moreover, since parental iron pnictides are metallic even in the absence of doping, they can undergo pressure-induced SDW-to-superconductor quantum phase transition (QPT) at low temperatures [3, 4]. Exploring the mechanism of this transition, the competition and coexistence of the magnetic order and the superconducting condensate is crucial for the understanding of high- superconductivity in iron pnictides.
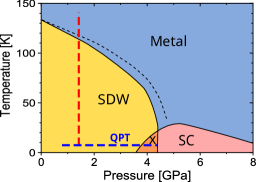
For the present study we have chosen BaFe2As2 as a prime example of a well-known parental iron pnictide compound, in which the electronic state can be controlled by external pressure. At ambient pressure the onset of the magnetic SDW order occurs simultaneously with the structural transition from tetragonal to orthorhombic phase at =137 K [5]. A chemical doping or an external pressure application cause a decrease of the transition temperature [6]. The - phase diagram of BaFe2As2 depicted in Fig. 1 is qualitatively similar to the one of chemically doped compounds: at low temperatures the system is in the SDW state that is gradually suppressed by increasing the doping level or pressure until the superconductivity (SC) sets in [7]. Upon applying high pressures, the structural properties of BaFe2As2 change the same way as in the chemically doped materials [2]. The structural changes are correlated with the reduction of the Fermi-surface nesting between the inner hole and electron pockets, which results in the SDW state suppression above a pressure of 3 GPa (depending on the experimental conditions) [2, 8, 3]. This suppression results in the quantum critical behavior [9] indicating that the pressure- or doping-driven SDW phase transition should be of the second-order in contrast to the first-order temperature-induced SDW transition [10].
Measuring the pressure dependence of the SDW or superconducting energy gaps poses a significant challenge, because it has to be performed on a sample inside a diamond anvil cell (DAC). This precludes the use of angle-resolved photoemission spectroscopy (ARPES), which requires a direct access to the sample’s surface in vacuum. Tunneling spectroscopy under high pressures was demonstrated for conventional superconductors [12]. However, it has not been applied to high- iron-based superconductors yet. Nevertheless, a recent tunneling spectroscopy study demonstrates a strong impact of the local surface strain on the superconducting gap in LiFeAs [13]. Up to now, the SDW and the superconducting energy gaps in BaFe2As2 under high pressure have been determined using infrared spectroscopy [14]. That study reveals the coexistence of the SDW and SC orders at 3.6 GPa since the spectral weight of the SDW gap excitation is not significantly affected by the emergence of the superconductivity.
Besides infrared spectroscopy that probes the linear optical response of a material, nonlinear pump-probe spectroscopy provides another way to estimate the energy gaps in high- superconductors via the analysis of quasiparticle relaxation dynamics [15]. The main advantage of pump-probe spectroscopy is its high sensitivity to the evolution of electronic order in close vicinity of phase transitions. Numerous pump-probe spectroscopy studies of iron pnictides have demonstrated that the suppression of the SDW or SC order around the transition temperatures is accompanied by a critical slowing down of the relaxation dynamics for the given electronic order [16, 17, 18]. Near-infrared pump – mid-infrared probe spectroscopy of parental BaFe2As2 has shown that the coherent lattice oscillation that modulates the Fe-As-Fe bonding angle can periodically induce transient SDW ordering, even at temperatures above [19].
Here we report a study of the SDW order in BaFe2As2 across the phase diagram. Our results demonstrate a critical slowing down of the SDW relaxation time caused by the suppression of SDW order both by temperature or pressure. However, in contrast to the abrupt change across the temperature-driven first-order transition, the increase of the relaxation time caused by pressure at 8 K is gradual, indicating the second-order character of the quantum phase transition.
II Experimental Results
II.1 Sample preparation and experimental setup
The studied BaFe2As2 monocrystals were grown by a self-flux high temperature solution growth technique [20, 5]. The sample, 100m 85m in size and a thickness of about 30m, was initially cleaved from the BaFe2As2 monocrystal, so that it can fit into the sample chamber of the DAC. The commercial closed-cycle cryostat system with integrated DAC (Diacell CCS-DAC from AlmaxeasyLab) enabled us to perform in situ control of pressure and temperature independently due to the gas membrane-driven DAC system. A Ti:sapphire amplifier system operating at the repetition rate of 250 kHz generates 60 fs long laser pulses utilized in the experiment. The pump and the probe beams (both with the wavelength of 800 nm) are focused onto the sample inside the DAC, and the reflected probe signal is collected using a confocal microscopy scheme. A ruby chip was placed inside the sample chamber, next to the sample, and used for external pressure calibration [21]. We chose CsI powder as the pressure-transmitting medium in order to ensure a direct contact between the sample and the diamond anvil.
II.2 Temperature dependence at fixed pressure
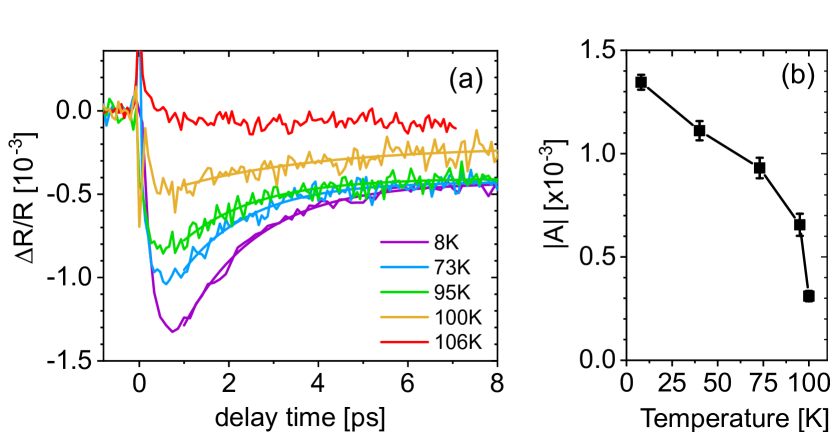
Figure 2(a) shows a set of photoinduced differential reflectivity measurements, obtained at pump fluence of J/cm2, and fixed pressure of 1.4 GPa. Together these measurement points correspond to the vertical path in the - diagram, marked by the broken red line in Fig. 1. At lower temperatures BaFe2As2 is in the SDW phase, and the photoinduced reflectivity change reaches its negative maximum quickly after the photoexcitation at the zero delay time. Then, the signal decays within few picoseconds to a nearly constant level corresponding to a thermalized hot state. We assign this monoexponential, fast-decaying part of the signal to the relaxation of the SDW phase. Its amplitude is proportional to the concentration of photoexcited quasiparticles: [22, 23, 24]. With increasing temperature decreases substantially, and near 100 K the relaxation process slows down. Finally, the pump-probe response at K (red line) does not contain the SDW relaxation signature anymore and demonstrates only a small signal with opposite sign with a much faster decay. We assign it to the hot-electron cooling process typical for metals.
Figure 2(b) shows the temperature dependence of the exponential decay amplitude. Its strong drop around 100 K is related to the SDW phase transition to the non-magnetic metallic phase. Naturally, this transition temperature determined for the pressure of 1.4 GPa is lower than K at atmospheric pressure. Simultaneously, we observe indications of the critical slowing down of the relaxation dynamics that was previously reported for SmFeAsO [18], SrFe2As2 [17] and BaFe2As2 [16, 25]. However, it was not possible to reliably quantify this effect since close to , where the slowing down is expected, the signal amplitude becomes very small and the fitting uncertainty is too large.
At temperatures well below the relaxation time ps remains nearly constant. This behavior contradicts the bimolecular recombination model: , where is the bimolecular recombination coefficient and and are the densities of thermally and photoexcited quasiparticles, respectively. Here the first term corresponds to the recombination of a photoexcited quasiparticle with a thermally populated one, and the second term represents the recombination of the two photoexcited quasiparticles [26]. At low temperatures the bimolecular model predicts that the initial recombination rate should increase with , which strongly depends on temperature. Similar to our observations, the studies of SmFeAsO [18] and SrFe2As2 [17] also report that does not increase with decreasing temperatures. It is interpreted as a hint for an additional relaxation channel besides the bimolecular recombination at the SDW gap; namely, an interband scattering of quasiparticles to other, ungapped electronic bands [17]. Such scattering should be temperature independent and it should result in an additional, dominating monomolecular recombination term in the rate equation.
II.3 Suppression of the SDW relaxation by pressure and temperature
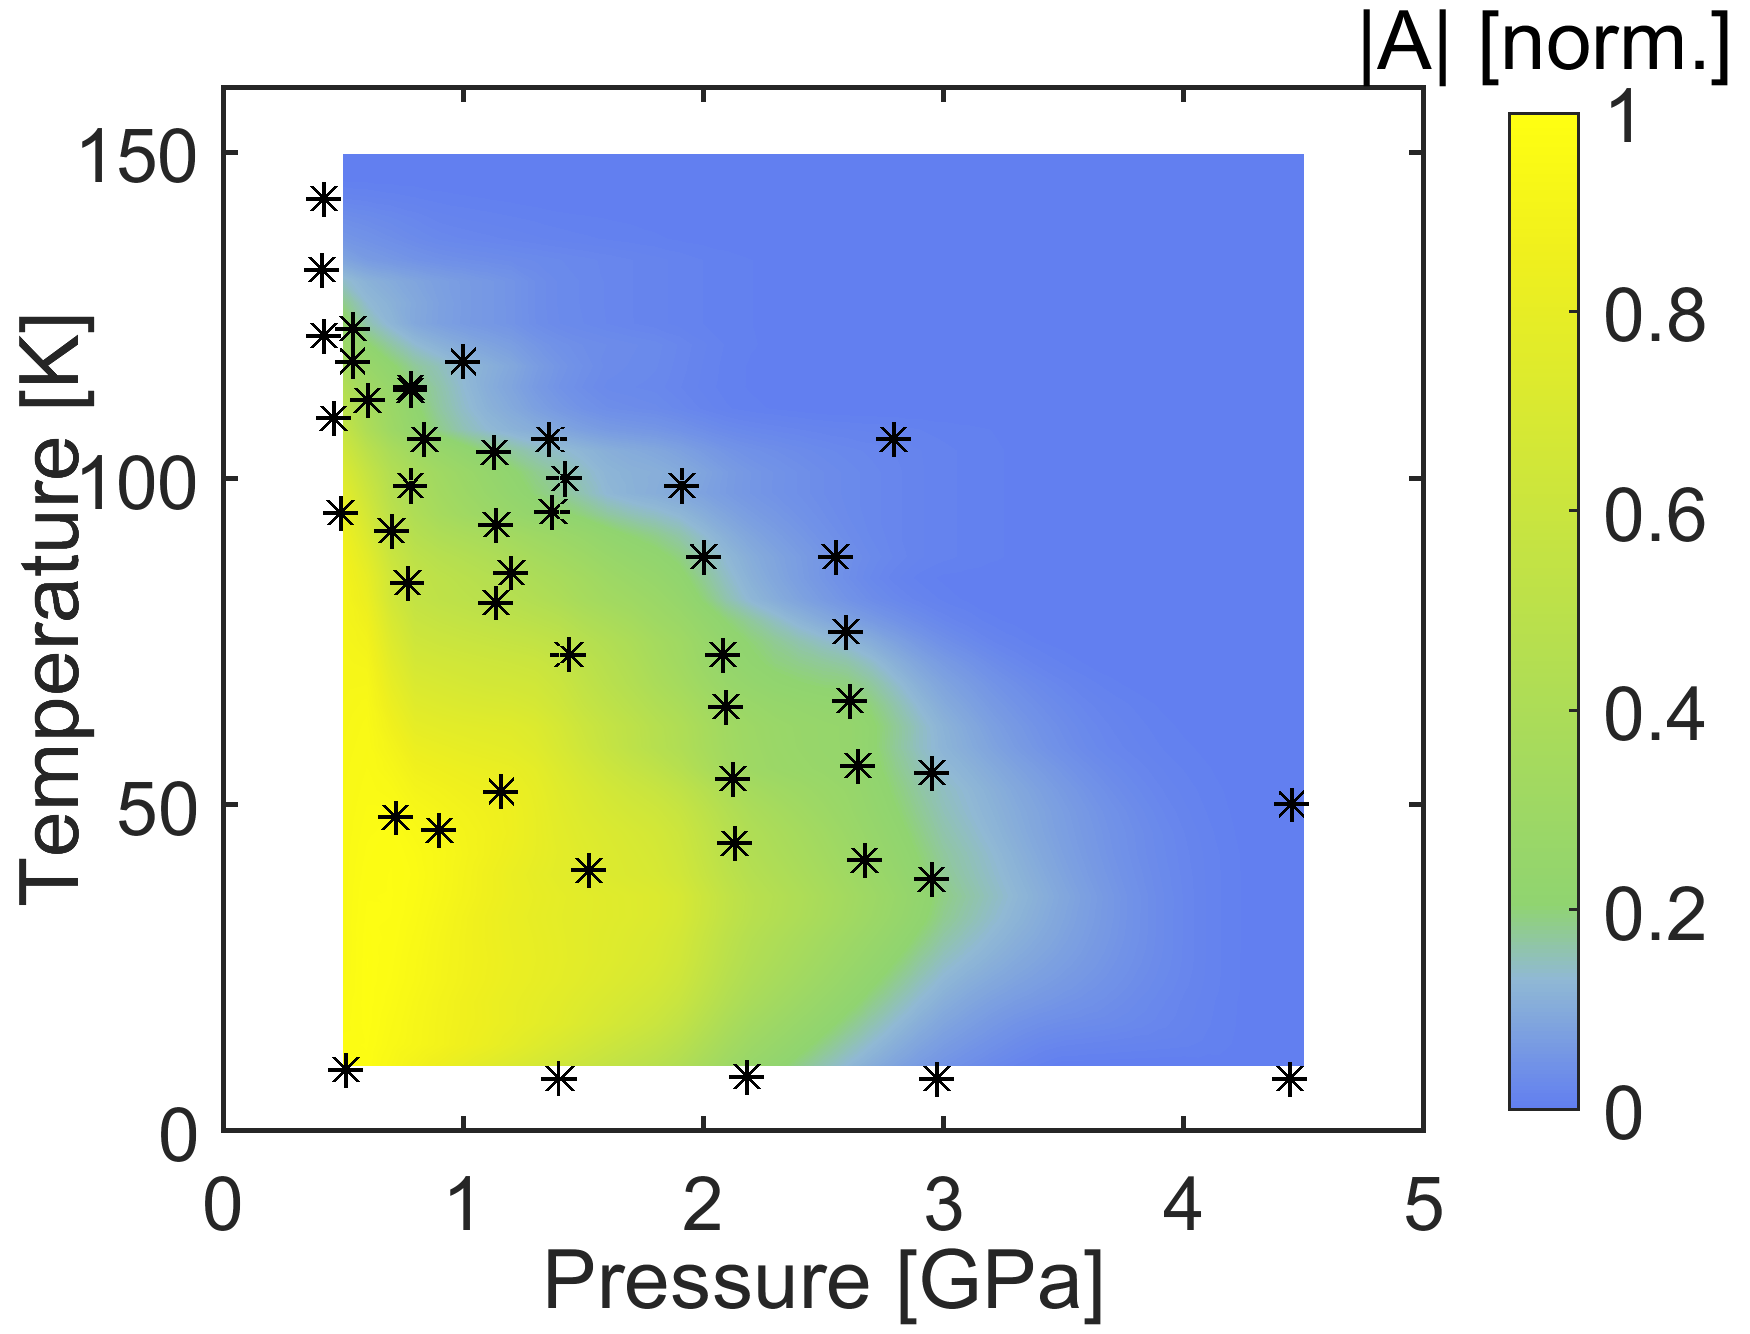
The data from all temperature-dependent measurements at fixed pressures from 0.5 to 4.4 GPa (vertical scans of the - diagram) are combined in a diagram, depicted in Fig. 3. The color represents the amplitude of the normalized monoexponential signal : from yellow for 1, to blue for 0. Therefore, the metallic phase corresponds to the blue region of the diagram and the density of the SDW condensate is displayed by the brightness of the yellow color. As expected from Fig. 1, the temperature at which the amplitude vanishes, i.e. the SDW transition temperature , decreases with pressure, and at high pressures the SDW state gets completely suppressed. From the 4.4 GPa measurements we could not identify SDW transients anymore, so we assigned zeros to the amplitude of those points.
As shown in Figs. 2(b) and 3, upon increasing temperature the amplitudes approach smoothly and monotonically zero at the corresponding for each pressure, which was also reported in Ref. 16. This is in contrast to the other two studies of iron pnictides [17, 18], where the temperature dependence of exhibits a small increase relatively close to , before starting to drop rapidly: a characteristic feature of the bottleneck model [27]. However, the pump fluences used in the present study are much larger than in the other three reports, making the direct comparison harder.
II.4 Relaxation dynamics and its fluence dependence at 8 K
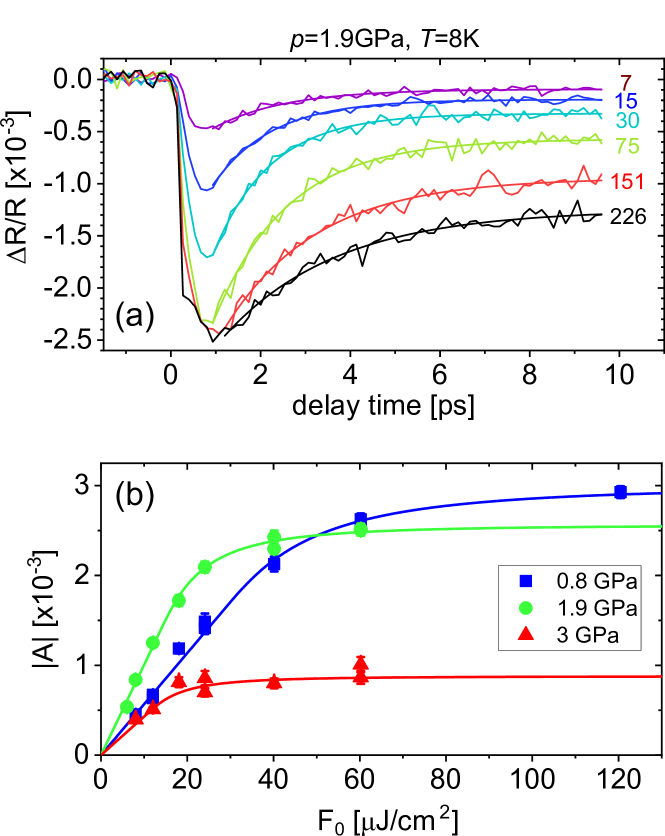
Now let us examine the suppression of the SDW order by pressure in the ground state, i.e., the path of the quantum phase transition as it is depicted in Fig. 1. In order to gain more reliable information about the SDW phase we measured pump-probe response for various pump fluences at each pressure in the range from 0.8 to 3 GPa. Figure 4(a) presents a set of measurements taken at different pump fluences at pressure of 1.9 GPa and temperature of 8 K. Starting from J/cm2 the amplitude grows linearly with pump fluence , roughly up to J/cm2, after which it completely saturates. This happens because the proportionality between the number of the photoexcited quasiparticles and the number of the pump photons , which is valid in the low-fluence regime, breaks down when the pump fluence becomes high enough for a noticeable depletion of the SDW condensate. Finally, at a certain threshold vaporization fluence the SDW condensate is completely suppressed, and consequentially no more quasiparticles can be excited. As a result, and the pump-probe signal get saturated.
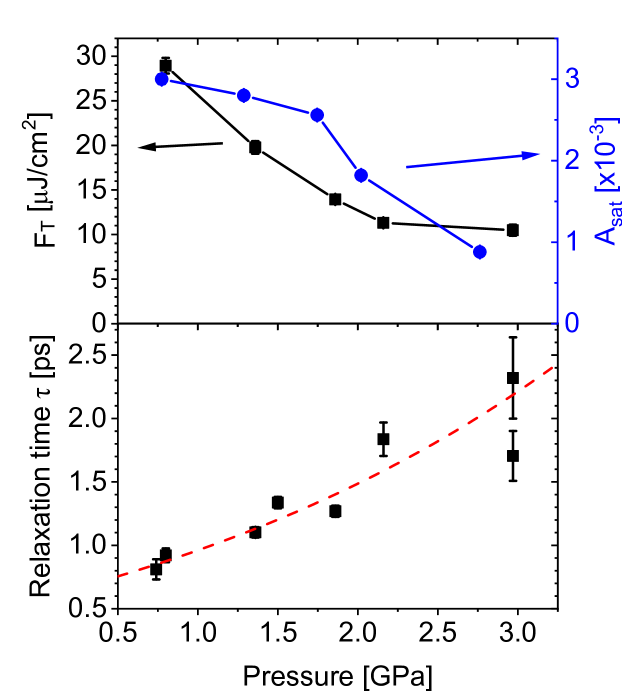
The saturation curves measured at a few chosen pressures are shown in Fig. 4(b). Here is the part of the pump fluence which penetrates the sample, after the reflection from its surface. is the reflectivity of BaFe2As2 (at 800 nm) with respect to the diamond that is almost independent on pressure and temperature [14]. Although the curves look qualitatively similar, the saturation fluence as well as the saturation amplitude decrease with pressure. We have extracted both parameters from the fits based on the model introduced in Ref. 28, which takes into account the lateral Gaussian and exponential depth profiles of the pump and probe beams. The fitting curves are represented by lines in Fig. 4(b). The obtained values of and for all measured pressures are presented in Fig. 5(a) with black squares and blue circles, respectively.
Besides the suppression of the pump-probe signal and the decrease of the saturation fluence, the applied pressure also affects the relaxation time . Figure 5(b) shows its pressure dependence , for a fixed =8 K and =30 J/cm2. Similarly to the temperature-dependent measurements [16, 25] the increasing signalizes the vicinity of the phase transition. As the system approaches the transition pressure, the gap gets smaller, and consequently the SDW recovery time slows down. It is known that near the transition point the relaxation time is inversely proportional to the gap [29, 30, 15]. Thus, all these observations indicate the gradual suppression of the SDW state by the external pressure leading to the quantum phase transition in BaFe2As2. Since at 4.4 GPa we do not observe any SDW relaxation signature (see Appendix A), the pressure of the QPT should be between 3 and 4.4 GPa.
III Discussion
Similar to the case of the superconducting condensate in cuprates [28] it is useful to compare the energy deposited at the saturation fluence with the thermodynamical condensation energy that can be obtained from the specific heat measurements [31]. For the lowest pressure measurement at GPa the threshold fluence is J/cm2 (Fig. 5(a)). In order to estimate the absorbed energy density we use the optical penetration depth of BaFe2As2 at eV (800 nm) to be nm. This calculation is based on the reported real parts of dielectric constant and conductivity cm-1 taken from Ref. 32. Strictly speaking, the mentioned values of and were measured on the optimally doped compound, but since the reflectivity is the same at 1.55 eV for the doped and parent compounds [33], we assume that this is also holds for and , and consequently, . Therefore, the absorbed energy density at the vaporization threshold is J/cm3. On the other hand, the thermodynamic SDW condensation energy is estimated to be J/cm3, using the specific heat data for the parent BaFe2As2 (GPa) [31]. Thus, the pump energy necessary for the vaporization of the SDW condensate is about 5 times larger than the condensation energy density of BaFe2As2. A similar result was reported for La2-xSrxCuO4 cuprate superconductors, and interpreted as the evidence that a large portion of the pump energy goes to the phonon subsystem and does not affect the electronic condensate [28]. Therefore, the saturation amplitude that is related to the full depletion of the SDW condensate appear to be more reliable parameters for the estimation of the SDW gap energy.
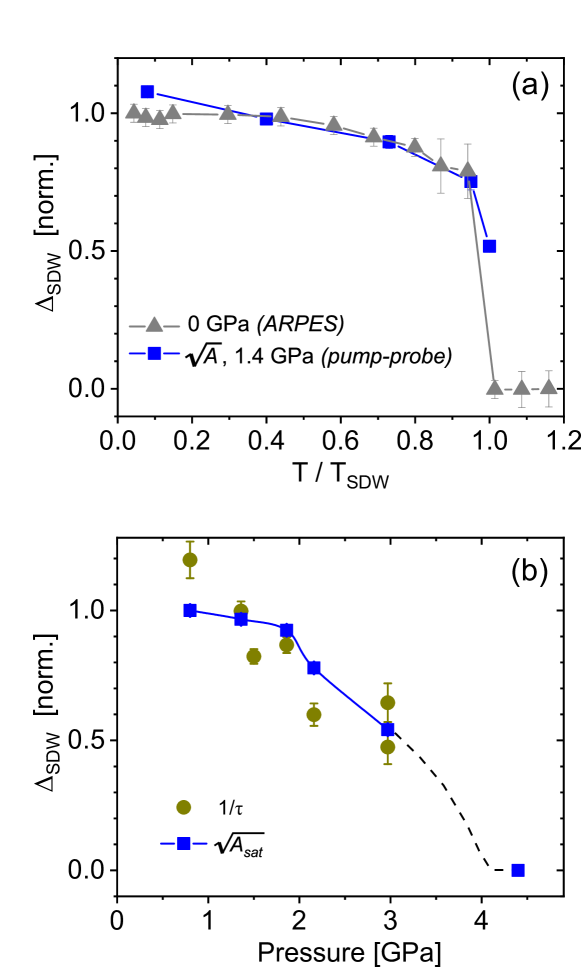
According to the Ginzburg-Landau theory the order parameter scales as ( is the condensate density) and , when . Figure 6(a) shows the normalized dependence at GPa and J/cm2 (blue squares). Based on the results in Fig. 5(a), this fluence value corresponds to the saturation regime and, thus, we expect that . For comparison, Figure 6(a) also shows the normalized SDW gap (gray triangles), extracted from the angle-resolved photoemission spectroscopy (ARPES) measurements [34]. Since in contrast to the ARPES study, the depicted pump-probe results were recorded under high pressure (GPa), the corresponding SDW transition temperatures are different: for our data 100 K and for the ARPES study 138 K. In order to compare both data sets, the horizontal axis in Fig. 6(a) is normalized to . Both match quite well demonstrating that the relation is fulfilled in broad range of temperatures below the SDW transition. Some deviation is observed far from the phase transition () where the Ginzburg-Landau theory is no longer fully applicable.
Now we apply the same method to evaluate the SDW gap as a function of pressure. Figure 6(b) shows the pressure dependence of at =8 K estimated as using the saturation amplitude values from Fig. 5(a). In addition, the evaluated relaxation time for J/cm2 (Fig. 5(b)) are reliable enough to use them for another estimation of the SDW gap as , which are depicted in Figure 6(b) as dark yellow circles. In general, all data in Fig. 6(b) indicate the trend of a gradual decrease of by about 50% on the pressure increase up to 3 GPa. This corresponds to taking into account that GPa according to our results. If we compare Figs. 6(a) and (b), it is apparent that the phase transition achieved by increasing pressure happens much more gradually compared to the first-order thermally-driven phase transition. Possibly, this indicates the second-order character of the pressure-induced QPT in BaFe2As2 that we schematically depicted by the dashed line in Fig. 6(b). This conclusion agrees with the observation of quantum fluctuations near the quantum critical point in isovalently doped BaFe2(AsxP1-x)2 [9]. Microscopically the gradual character of the pressure-induced changes can be understood as the result of a gradual failure of the Fermi-surface nesting that causes the suppression of the SDW order [2].
Finally, we discuss the possible pressure-induced superconducting phase. Our data demonstrate that for pressures well above 3 GPa the SDW order is fully suppressed and, according to the phase diagram (Fig. 1), one expects the onset of the superconductivity. In order to verify that, we have measured pump-probe traces at 8 K and 4.4 GPa (see Appendix A). All pump-probe taken at various pump fluences show the same relaxation dynamics, which is much faster than in the SDW state. The absence of fluence-dependent relaxation dynamics and saturation behavior leads us to the conclusion that the fast dynamics observed at 4.4 GPa does not come from the superconducting or SDW state, but rather from the cooling of the hot electrons in the metallic phase.
IV Conclusion
We have performed a systematic temperature- and pressure-dependent pump-probe study in order to investigate the evolution of the SDW order in BaFe2As2. Measuring the amplitude of the relaxation process has enabled us to construct the phase diagram that depicts the variation of the SDW order across the whole range of the applied pressures and temperatures. The comparison of the saturation fluence with the thermodynamic condensation energy of the SDW state shows that the absorbed pump energy required for the suppression of the magnetic order largely exceeds the condensation energy indicating that a large portion of the absorbed pump energy is transferred to the phonon bath. Using the parameters of the SDW relaxation process we have estimated the variation of the SDW gap as a function of temperature and pressure. Our results demonstrate an apparent difference in the character of the thermally-induced phase transition and the pressure-driven quantum phase transition. The former is of the first-order and occurs rather abruptly near , whereas the latter occurs gradually and the SDW gap starts to decrease for pressures well below the critical pressure . This behavior suggests a second-order character of the quantum phase transition in BaFe2As2 in agreement with previous studies of quantum fluctuations in this material [9].
Acknowledgements.
We would like to thank Jure Demsar and Ece Uykur for fruitful discussions. This work was supported by the Deutsche Forschungsgemeinschaft DFG through the project PA 2113/1-2 and the Priority Programme SPP1458.Appendix A Pump-probe signal at 4.4 GPa
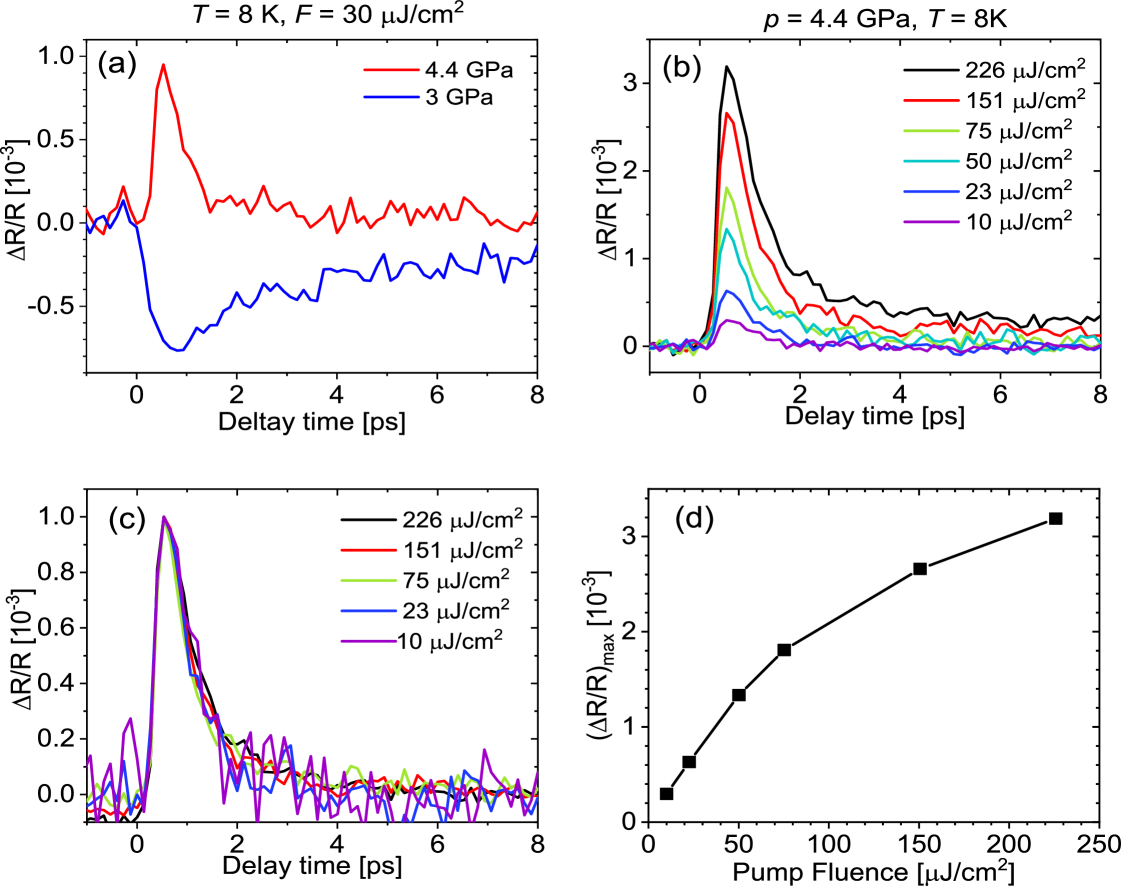
Figure 7(a) shows the change in reflectivity measured at 8 K and 4.4 GPa (red line). According to the - diagram, BaFe2As2 is expected to be in the superconducting phase at that pressure. For the sake of comparison, we have plotted also the SDW relaxation transient at 3 GPa (blue line), which was recorded at the same fluence and temperature. Already the sign flip and much shorter lifetime of the 4.4 GPa measurement suggest that the SDW phase has been indeed suppressed, i.e. the phase transition occurred. The fluence dependence of transients, recorded at 8 K and 4.4 GPa, are shown in Fig. 7(b). The same data, normalized after subtracting the offsets, are presented in Fig. 7(c). Fig. 7(d) shows maxima of the relfectivity transients from Fig. 7(b).
In the fluence range of J/cm2, the initial relaxation time is practically constant: ps, and, although growing linearly up to J/cm2, and sub-linearly at higher fluences, the amplitudes did not saturate. On the contrary, the characteristic feature of many superconductors is the decrease of with , which can be explained using the bimolecular recombination model. Torchinsky et al. [24] found for the optimally hole-doped Ba0.6K0.4Fe2As2 that at 7 K and the fluences in the range of 1.4–37 J/cm2, the relaxation time decreases by about two orders of magnitude with increasing fluence. Furthermore, they reported that this initial, fast relaxation component is always followed by a slow relaxation process caused by a boson bottleneck, lasting for more than 100 ps [24], which we also did not observe in our high-pressure experiment. For the optimally doped Ba0.6K0.4Fe2As2, the saturation fluence of the superconducting state was estimated to be already at J/cm2, at 7 K [26]. The absence of fluence-dependent relaxation dynamics and saturation behavior (in the fluence range characteristic for the SDW state) leads us to the conclusion that the observed relaxation process is not related to the superconducting or SDW state, but perhaps rather stems from the relaxation of the hot electrons in the metallic phase.
References
- Kamihara et al. [2008] Y. Kamihara, T. Watanabe, M. Hirano, and H. Hosono, Iron-Based Layered Superconductor La[O1-xFx]FeAs (x = 0.05 - 0.12) with Tc = 26 K, Journal of the American Chemical Society 130, 3296 (2008).
- Kimber et al. [2009] S. A. J. Kimber, A. Kreyssig, Y.-Z. Zhang, H. O. Jeschke, R. Valentí, F. Yokaichiya, E. Colombier, J. Yan, T. C. Hansen, T. Chatterji, R. J. McQueeney, P. C. Canfield, A. I. Goldman, and D. N. Argyriou, Similarities between structural distortions under pressure and chemical doping in superconducting BaFe2As2, Nature Materials 8, 471 (2009).
- Colombier et al. [2009] E. Colombier, S. Bud’ko, N. Ni, and P. Canfield, Complete pressure-dependent phase diagrams for SrFe2As2 and BaFe2As2, Physical Review B 79, 224518 (2009).
- Nakai et al. [2010] Y. Nakai, T. Iye, S. Kitagawa, K. Ishida, H. Ikeda, S. Kasahara, H. Shishido, T. Shibauchi, Y. Matsuda, and T. Terashima, Unconventional superconductivity and antiferromagnetic quantum critical behavior in the isovalent-doped BaFe2(As1-xPx)2, Physical Review Letters 105, 31 (2010).
- Aswartham et al. [2012] S. Aswartham, M. Abdel-Hafiez, D. Bombor, M. Kumar, A. U. B. Wolter, C. Hess, D. V. Evtushinsky, V. B. Zabolotnyy, A. A. Kordyuk, T. K. Kim, S. V. Borisenko, G. Behr, B. Büchner, and S. Wurmehl, Hole doping in BaFe2As2: The case of Ba1-xNaxFe2As2 single crystals, Physical Review B 85, 224520 (2012).
- Chu et al. [2009] J.-H. Chu, J. G. Analytis, C. Kucharczyk, and I. R. Fisher, Determination of the phase diagram of the electron-doped superconductor Ba(Fe1-xCox)2As2, Phys. Rev. B 79, 014506 (2009).
- Paglione and Greene [2010] J. Paglione and R. L. Greene, High-temperature superconductivity in iron-based materials, Nature Physics 6, 645 (2010).
- Alireza et al. [2009] P. L. Alireza, Y. T. C. Ko, J. Gillett, C. M. Petrone, J. M. Cole, G. G. Lonzarich, and S. E. Sebastian, SrFe2As2 and BaFe2As2, Journal of Physics: Condensed Matter 21, 012208 (2009).
- Kasahara et al. [2010] S. Kasahara, T. Shibauchi, K. Hashimoto, K. Ikada, S. Tonegawa, R. Okazaki, H. Shishido, H. Ikeda, H. Takeya, K. Hirata, T. Terashima, and Y. Matsuda, Evolution from non-Fermi to Fermi-liquid transport via isovalent doping in BaFe2(As1-xPx)2 superconductors, Physical Review B 81, 184519 (2010).
- Sachdev and Keimer [2011] S. Sachdev and B. Keimer, Quantum criticality, Physics Today 64, 29 (2011), 1102.4628 .
- Wu et al. [2013] J. J. Wu, J. F. Lin, X. C. Wang, Q. Q. Liu, J. L. Zhu, Y. M. Xiao, P. Chow, and C. Jin, Pressure-decoupled magnetic and structural transitions of the parent compound of iron-based 122 superconductors BaFe2As2, Proceedings of the National Academy of Sciences of the United States of America 110, 17263 (2013).
- Zhu et al. [2015] J. Zhu, Z.-X. Yang, X.-Y. Hou, T. Guan, Q.-T. Zhang, Y.-Q. Li, X.-F. Han, J. Zhang, C.-H. Li, L. Shan, G.-F. Chen, and C. Ren, Tunneling spectroscopy of Al/AlOx/Pb subjected to hydrostatic pressure, Applied Physics Letters 106, 202601 (2015).
- Cao et al. [2021] L. Cao, W. Liu, G. Li, G. Dai, Q. Zheng, Y. Wang, K. Jiang, S. Zhu, L. Huang, L. Kong, F. Yang, X. Wang, W. Zhou, X. Lin, J. Hu, C. Jin, H. Ding, and H.-J. Gao, Two distinct superconducting states controlled by orientations of local wrinkles in LiFeAs, Nature Communications 12, 6312 (2021).
- Uykur et al. [2015] E. Uykur, T. Kobayashi, W. Hirata, S. Miyasaka, S. Tajima, and C. A. Kuntscher, Optical study of BaFe2As2 under pressure: Coexistence of spin-density-wave gap and superconductivity, Physical Review B 92, 245133 (2015).
- Demsar [2020] J. Demsar, Non-equilibrium Phenomena in Superconductors Probed by Femtosecond Time-Domain Spectroscopy, Journal of Low Temperature Physics 201, 676 (2020).
- Chia et al. [2010] E. E. M. Chia, D. Talbayev, J.-X. Zhu, H. Q. Yuan, T. Park, J. D. Thompson, C. Panagopoulos, G. F. Chen, J. L. Luo, N. L. Wang, and a. J. Taylor, Ultrafast Pump-Probe Study of Phase Separation and Competing Orders in the Underdoped (Ba,K)Fe2As2 Superconductor, Physical Review Letters 104, 027003 (2010).
- Stojchevska et al. [2010] L. Stojchevska, P. Kusar, T. Mertelj, V. V. Kabanov, X. Lin, G. H. Cao, Z. A. Xu, and D. Mihailovic, Electron-phonon coupling and the charge gap of spin-density wave iron-pnictide materials from quasiparticle relaxation dynamics, Physical Review B 82, 012505 (2010).
- Mertelj et al. [2010] T. Mertelj, P. Kusar, V. V. Kabanov, L. Stojchevska, N. D. Zhigadlo, S. Katrych, Z. Bukowski, J. Karpinski, S. Weyeneth, and D. Mihailovic, Quasiparticle relaxation dynamics in spin-density-wave and superconducting SmFeAsO1-xFx single crystals, Physical Review B 81, 224504 (2010).
- Kim et al. [2012] K. W. Kim, A. Pashkin, H. Schäfer, M. Beyer, M. Porer, T. Wolf, C. Bernhard, J. Demsar, R. Huber, and A. Leitenstorfer, Ultrafast transient generation of spin-density-wave order in the normal state of BaFe2As2 driven by coherent lattice vibrations, Nature Materials 11, 497 (2012).
- Aswartham et al. [2011] S. Aswartham, C. Nacke, G. Friemel, N. Leps, S. Wurmehl, N. Wizent, C. Hess, R. Klingeler, G. Behr, S. Singh, and B. Büchner, Single crystal growth and physical properties of superconducting ferro-pnictides Ba(Fe, Co)2As2 grown using self-flux and Bridgman techniques, Journal of Crystal Growth 314, 341 (2011).
- Jayaraman [1983] A. Jayaraman, Diamond anvil cell and high-pressure physical investigations, Reviews of Modern Physics 55, 65 (1983).
- Demsar et al. [1999] J. Demsar, K. Biljaković, and D. Mihailovic, Single Particle and Collective Excitations in the One-Dimensional Charge Density Wave Solid K0.3MoO3 Probed in Real Time by Femtosecond Spectroscopy, Physical Review Letters 83, 800 (1999).
- Gedik et al. [2004] N. Gedik, P. Blake, R. C. Spitzer, J. Orenstein, R. Liang, D. A. Bonn, and W. N. Hardy, Single-quasiparticle stability and quasiparticle-pair decay in YBa2Cu3O6.5, Physical Review B 70, 014504 (2004).
- Torchinsky et al. [2010] D. H. Torchinsky, G. F. Chen, J. L. Luo, N. L. Wang, and N. Gedik, Band-dependent quasiparticle dynamics in single crystals of the Ba0.6K0.4Fe2As2 superconductor revealed by pump-probe spectroscopy, Physical Review Letters 105, 027005 (2010).
- Stojchevska et al. [2012] L. Stojchevska, T. Mertelj, J.-H. Chu, I. R. Fisher, and D. Mihailovic, Doping dependence of femtosecond quasiparticle relaxation dynamics in Ba(Fe,Co)2As2 single crystals: Evidence for normal-state nematic fluctuations, Physical Review B 86, 024519 (2012).
- Torchinsky et al. [2011] D. H. Torchinsky, J. W. McIver, D. Hsieh, G. F. Chen, J. L. Luo, N. L. Wang, and N. Gedik, Nonequilibrium quasiparticle relaxation dynamics in single crystals of hole- and electron-doped BaFe2As2, Physical Review B 84, 104518 (2011).
- Kabanov et al. [1999] V. V. Kabanov, J. Demsar, B. Podobnik, and D. Mihailovic, Quasiparticle relaxation dynamics in superconductors with different gap structures: theory and experiments on YBa2Cu3O7-δ, Physical Review B 59, 1497 (1999).
- Kusar et al. [2008] P. Kusar, V. V. Kabanov, J. Demsar, T. Mertelj, S. Sugai, and D. Mihailovic, Controlled vaporization of the superconducting condensate in cuprate superconductors by femtosecond photoexcitation, Physical Review Letters 101, 227001 (2008).
- Schmid and Schön [1975] A. Schmid and G. Schön, Linearized kinetic equations and relaxation processes of a superconductor near , Journal of Low Temperature Physics 20, 207 (1975).
- Schuller and Gray [1976] I. Schuller and K. E. Gray, Experimental Observation of the Relaxation Time of the Order Parameter in Superconductors, Physical Review Letters 36, 429 (1976).
- Rotter et al. [2008] M. Rotter, M. Tegel, D. Johrendt, I. Schellenberg, W. Hermes, and R. Pöttgen, Spin-density-wave anomaly at 140 K in the ternary iron arsenide BaFe2As2, Physical Review B 78, 020503 (2008).
- Barišić et al. [2010] N. Barišić, D. Wu, M. Dressel, L. J. Li, G. H. Cao, and Z. A. Xu, Electrodynamics of electron-doped iron pnictide superconductors: Normal-state properties, Physical Review B 82, 054518 (2010).
- Lucarelli et al. [2010] A. Lucarelli, A. Dusza, F. Pfuner, P. Lerch, J. G. Analytis, J.-H. Chu, I. R. Fisher, and L. Degiorgi, Charge dynamics of Co-doped BaFe2As2, New Journal of Physics 12, 073036 (2010).
- Yi et al. [2014] M. Yi, Y. Zhang, Z.-K. Liu, X. Ding, J.-H. Chu, A. Kemper, N. Plonka, B. Moritz, M. Hashimoto, S.-K. Mo, Z. Hussain, T. Devereaux, I. Fisher, H. Wen, Z.-X. Shen, and D. Lu, Dynamic competition between spin-density wave order and superconductivity in underdoped Ba1-xKxFe2As2, Nature Communications 5, 3711 (2014).