Multi-Tone Microwave Frequency Locking to a Noisy Cavity via Real-Time Feedback
Abstract
Microwave cavities are commonly used in many experiments, including optomechanics, magnetic field sensing, magnomechanics and circuit quantum electrodynamics. Noise, such as variations in magnetic field or mechanical vibrations, can cause fluctuations of the cavity’s natural frequency, creating challenges in operating them in experiments. To overcome these challenges, we demonstrate a dynamic feedback system implemented by the locking of a microwave drive to the noisy cavity. A homodyne interferometer scheme monitors the cavity resonance fluctuations due to low-frequency noise, which is mitigated by frequency-modulating the microwave generator. The feedback has a bandwidth of Hz, with a reduction of cavity fluctuations by integrating up to a bandwidth of kHz. Moreover, the cavity resonance frequency fluctuations are reduced by . This scheme can be scaled to enable multi-tone experiments locked to the same feedback signal. As a demonstration, we apply the feedback to an optomechanical experiment and implement a cavity-locked, multi-tone mechanical measurement. As low-frequency cavity frequency noise can be a limiting factor in many experiments, the multi-tone microwave locking technique presented here is expected to be relevant for a wide range of microwave cavity experiments.
I Introduction
Low-frequency noise is often the limiting factor in mechanical and magnetic experiments [1, 2, 3, 4, 5, 6, 7, 8, 9], arising, for example, from variations in magnetic field or vibrations in cryogenic experiments. These sources of noise can cause fluctuations in a microwave cavity’s resonance. There are two common ways to counteract this noise: the first is to dampen the noise before it reaches the device under test. While a mass-on-a-spring low-pass filter can suppress high-frequency vibrations for mechanical experiments [10, 11], the lowest frequencies can often introduce considerable noise. In this sense, the mechanical filter is not optimal: it is effective at blocking high frequencies but not low frequencies. The second method actively counters noise by applying dynamic feedback to the system [12, 13]. As a feedback system is limited by its feedback bandwidth and response time, it acts as a high-pass filter: it cannot react at high frequencies but is very effective at low frequencies. Combining these two complementary techniques, therefore, gives an opportunity for noise reduction over the entire spectrum.
In this work, we present an active feedback system based on the cavity stabilization method introduced by Pound in Ref. [14]. Here, the inverse of the Pound-Drever-Hall technique [15, 16, 17, 18] is applied using active feedback to adjust a microwave generator frequency, locking it to a cavity whose resonance frequency fluctuates in time. This scheme not only locks a single microwave signal to the cavity, but also enables the active locking of multiple tones using the same feedback signal, demonstrated in Section. V.
Since any source of low-frequency cavity noise can be mitigated, this technique has applications in various fields. It can be used to modulate magnetic flux to stabilize SQUID cavities [13, 19], and magnomechanical experiments [20, 21, 22, 23], which are also known to suffer from magnetic field noise. As we demonstrate in Section. VI, our technique can be directly applied to an optomechanical system experiencing mechanical noise [24]. As identified in previous work, cavity frequency noise from vibrations can be a limiting factor in ground state cooling of mechanical resonators [25].
II Experimental Setup
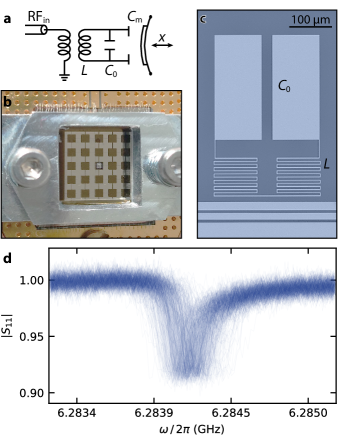
To demonstrate the feedback system, we apply it to a radio frequency (RF) circuit in an optomechanical flip-chip setup, similar to Ref. [26, 27]. The microwave cavity consists of a meander inductor and a pair of capacitor plates etched into a NbTiN film, onto which a mechanically compliant capacitor is positioned micron above. A circuit schematic of the device and optical images are shown in Fig. 1(a-c). The top capacitor plate consists of aluminum deposited on a thin silicon nitride membrane, embedded within a patterned silicon substrate etched to form a phononic shield; for example, see Ref. [27, 28]. The primary purpose of the phononic crystal structure is to reduce unwanted mechanical noise at MHz and to suppress the radiative loss of mechanical energy through the substrate, as shown in Ref. [25]. However, the phononic crystal has the unwanted side effect of increasing the mechanical susceptibility of the top chip to low-frequency (kHz) vibrations in the setup [29].
The resonance frequency of the flip-chip cavity is given by GHz. Vibrations drive low-frequency modes of the top chip, resulting in a time-dependent capacitance . Therefore, these low-frequency mechanical vibrations of the top chip modulate the cavity resonance frequency . The fluctuations in the cavity resonance frequency can be seen in Fig. 1(d), where many repeated VNA sweeps demonstrate the noise imparted on the microwave resonator. These measurements were performed on the base plate of a dilution refrigerator held at mK. The pulse tube cooler is the primary source of vibrations within a dry dilution refrigerator; therefore, the pulse tube was switched off during measurements to reduce vibrations within the experimental setup. However, we still observed that the resonance frequency fluctuations are on the order of the linewidth of the cavity. To compensate for these fluctuations, we implemented an active feedback system to track the cavity’s resonance frequency.
III Feedback System
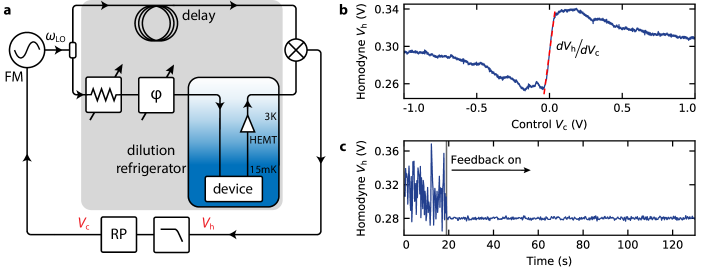
To compensate for the fluctuating cavity frequency, we have developed a feedback system similar to the Pound-Drever-Hall technique [15, 16, 17, 18]. While the Pound-Drever-Hall technique is usually used to stabilize a noisy laser by locking it to a stable optical cavity, here we apply its inverse role: we lock a stable generator to the resonance frequency of a noisy cavity. In our system, the microwave frequency of the drive tone is locked to the fluctuating resonance frequency of the cavity. Locking the drive tone is accomplished by producing an error signal depending on the time-dependent resonance frequency of the cavity. The error signal is then used in an active feedback loop to frequency-modulate (FM) the microwave generator’s output, producing a drive tone that tracks the shifting cavity resonance frequency. A schematic diagram of the feedback system is shown in Fig. 2(a).
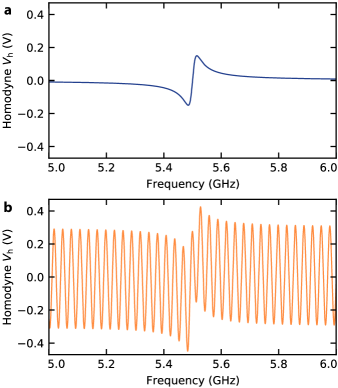
The scheme starts by splitting the local oscillator signal into two paths: one of which goes directly to the microwave cavity, then it is directed into the RF port of a mixer. The other path goes through a path length matched reference arm to the LO port of the same mixer, making the system a balanced homodyne microwave interferometer. Small fluctuations in the resonance frequency of the microwave cavity result in a linear response at the output of the mixer, as seen in Fig. 2(b). This downconverted homodyne signal, which we call the homodyne voltage , depends on the detuning of the cavity resonance frequency relative to the current microwave drive frequency. When the system is unlocked, the homodyne voltage fluctuations follow the fluctuations in the cavity’s resonance frequency. In this experiment, the cavity fluctuations are larger than the linear region of the homodyne downconversion. Thus, the local oscillator frequency is updated in real-time by modulation using a control voltage to track the cavity resonance frequency.
Sweeping the local oscillator’s frequency , a linear dependency between the control voltage and the measured homodyne voltage was observed around the cavity resonance, as seen in Fig. 2(b). Notice that if an unbalanced homodyne detection scheme were used, the path length difference would result in phase-winding fringes in the homodyne voltage signal, which could result in a loss of cavity lock. Thus, using a balanced homodyne scheme ensures a frequency-independent homodyne voltage signal regardless of the instantaneous local oscillator frequency, see Appendix A.
To maintain constant power arriving at the LO port of the mixer while having dynamic control over the power incident on the microwave resonator under test, a variable attenuator was added to the device arm. Moreover, the phase difference between the local oscillator and device arm was set to out of phase, so the quadrature signal was measured. The homodyne voltage is then low-pass filtered and led to a proportional-integral (PI) controller programmed in the field-programmable gate array (FPGA) of a Red Pitaya [30]. The output control voltage of the PI controller continuously modulates the local oscillator’s frequency to remain resonant with the cavity frequency . Ideally, the homodyne voltage is zero at resonance; however, a slight DC offset was present in the experiment, which determined the setpoint in the PI controller.
To optimize our feedback system, the proportional and integral gain of the PI controller needed to be tuned for optimal noise suppression. As the gain is increased, low-frequency noise is suppressed; however, a too-aggressive PI setting results in added noise at higher frequencies. The optimal value for all experimental implementations of our feedback system depends on the specific configuration; therefore, each system must be calibrated to find the optimal PI gains. Turning on the feedback system stabilizes the homodyne voltage, as can be seen in Fig. 2(c). It should be noted that the feedback did not lose the lock during the measurements over a time of approximately minutes (the period that the pulse tube could be turned off).
IV Noise Reduction
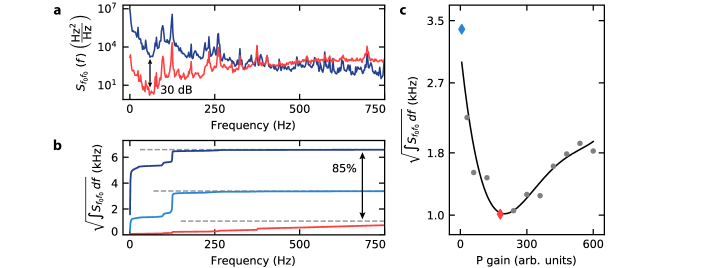
We can quantitatively analyze the suppressed frequency noise in the reference frame of the cavity by considering the power spectral density of frequency fluctuations (Hz2/Hz) [29]. The power spectral density can be calculated by taking the Fourier transform of the measured homodyne voltage and is shown in Fig. 3(a). The power spectral density of the locked homodyne voltage (V2/Hz) was calibrated using the slope of the homodyne voltage versus control voltage, shown in Fig. 2(b). However, the unlocked homodyne signal’s power spectral density cannot be calibrated this way, since the region of linear response is narrower than the fluctuations of the cavity resonance frequency. Therefore, the detected homodyne signal does not contain information of large frequency fluctuations. An extra calibration has been applied to the unlocked spectra, as discussed in Appendix B.
We find that when we turn the feedback on, even with a small gain, the large frequency shifts of the cavity are compensated for, and the cavity fluctuations remain within the linear regime of the homodyne signal. This indicates that low-frequency fluctuations dominate the cavity noise. We identified that for our system the optimal proportional and integral gain ratio is . Figure 3(a) shows the power spectral density of the cavity unlocked and locked with the optimal feedback loop gain. It can be seen that for low frequencies, the noise is suppressed up to dB. The spectra cross around Hz, indicating the feedback bandwidth. Above this frequency, the system adds noise to the measurement, due to feedback of the added noise by the amplification chain used. At kHz and above, the two spectra overlap, suggesting no additional high-frequency noise is being added by our feedback system. Taking the square root of the integrated power spectral densities , we obtain the root mean square (rms) value for the noise power in units of Hz. Even though there is added noise at intermediate frequencies, in Fig. 3(b) it can be seen that the total frequency noise is reduced. The integrated spectra show a noise reduction of at kHz, as indicated by the asymptotes shown in Fig. 3(b). Again, this suggests that low-frequency fluctuations were most detrimental in our system. Since the feedback loop acts as a high-pass filter, these low frequencies are compensated most efficiently.
Finally, the total gain of the feedback loop was varied by increasing the PI gain while keeping their ratio the same. Increasing the gain initially results in additional noise suppression until the feedback increases the total noise power, as shown in Fig. 3(c). This provides an optimal feedback loop gain for this system.
V Multi-Tone Locking
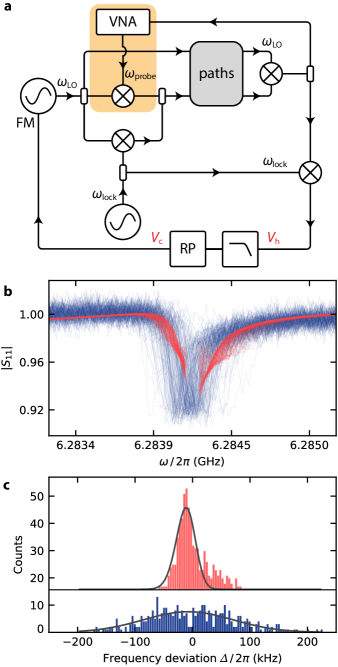
Thus far, all measurements were done using a single tone on cavity resonance. However, many experiments require multiple tones or, in fact, frequency sweeps. Since the local oscillator follows the cavity’s resonance frequency, the feedback circuit can easily be scaled up by adding additional generators to the same feedback setup. For example, an extra stage of up- and downconversion was added to the circuit, as shown in Fig. 4(a). The gray box corresponds with that shown in Fig. 2(a). The local oscillator signal is now split into three paths: two paths in parallel are upconverted, to a lock signal and a probe signal generated by a VNA; the third path goes to the reference arm as before. The signal coming from the cavity is first downconverted using , producing two tones at and . The signal at can be measured by the VNA as long as is not within the IF bandwidth of the measurement. The other path (at ) is downconverted a second time to DC, resulting, as before, in a voltage containing the frequencies of the cavity resonance fluctuations. This signal will also contain fluctuations at the frequency . If is within the feedback bandwidth of the cavity lock, it will need to be filtered out not to modulate the local oscillator with this frequency. Again, the downconverted signal is then led to the Red Pitaya to generate an error signal to frequency modulate the local oscillator.
Figure 4(b) shows VNA measurements with the feedback off and on, where the same number of traces were used. Note that these measurements were performed with an IFBW of and kHz, respectively, and with feedback gains , . The locked measurement was performed on the left and right sides of the cavity separately to avoid the lock tone entering the VNA measurement, as discussed above. However, if a measurement requires a VNA sweep on cavity resonance, it is also possible to lock off-resonant, see Appendix A.
The individual traces have been fit using a Lorentzian function to determine the resonance frequency for each trace. The extracted resonance frequency of the unlocked and locked traces are compared in Fig. 4(c). The left and right datasets are fit separately, using a fixed asymmetry due to the Fano effect [31] extracted from the unlocked measurement. Here is the deviation from the average value of the fit resonance frequency. The fits give skewed Gaussian distributions with a standard deviation kHz and kHz, which is a decrease of for the locked measurement.
VI Optomechanical Experimental Validation
As a demonstration of the applicability of the feedback system, it is used in an optomechanical experiment [24]. The metal film of the capacitor is located on a high-tensile stress silicon nitride membrane, parametrically coupling the membrane to the cavity [26]. The membrane is isolated from its surroundings as it is located in a phononic shield [25]. However, implementing this lattice structure also poses difficulties, as low-frequency modes are excited by vibrations in the dilution refrigerator. Although the energy of these lattice vibrations will mostly not be transferred to the vibrational mode of the membrane, it does mean that the membrane is located on a moving structure. As these modes alter the distance between the two chips by an amount larger than the amplitude of the vibrational mode of the membrane, this noise will change , and thus also , significantly.
As introduced in Section V, multiple microwave tones can be sent to the device while locked to the same local oscillator. Simply by multiplexing generators and mixers after the local oscillator, more drive frequencies can be added. Repeating the elements inside the orange box Fig. 4(a). offers continual scaling.
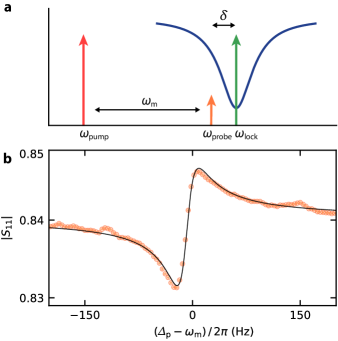
Figure 5(a) shows the scheme for a multi-tone measurement. By applying a drive tone detuned from the red sideband of the cavity and probing close to resonance the mechanical resonance appears from optomechanically induced transparency (OMIT) [32, 33, 34]. While having the local oscillator locked, a measurement of the mechanical resonance is presented in Fig. 5(b). Note that the asymmetry of the OMIT peak is due to the detuning kHz of the pump and probe with respect to the lock tone. However, it is equally possible to instead apply the detuning to the lock tone by adjusting the setpoint of the feedback circuit, see Appendix A.
VII Conclusions
In conclusion, we have presented a dynamic feedback system locking multiple microwave tones to an unstable microwave cavity. A local oscillator’s frequency was modulated to follow the cavity resonance frequency by calibrating the homodyne signal to a control voltage. The power spectral density of the homodyne voltage has been analyzed, revealing a noise reduction of at kHz. Optimization of the feedback loop and the PI controller resulted in an optimal response for our system with a feedback bandwidth of Hz. Furthermore, we extended the feedback system to enable multi-tone experiments. Additional microwave tones were implemented by upconversion with the same locked tone of the local oscillator. Moreover, VNA measurements probing the cavity showed that fluctuations in the cavity resonance frequency when locked had a standard deviation of kHz, as opposed to an unlocked measurement with kHz, which is an improvement of .
Finally, we demonstrated the applicability of the feedback system by performing an optomechanical experiment. We observed OMIT using another locked tone from a third generator without losing the cavity lock. Our feedback system provides continual scaling for adding tones to the same lock by multiplexing generators and mixers after the local oscillator. Besides optomechanics [35, 36], the feedback system presented here has applications in various fields, as any source of low-frequency cavity noise can be reduced. For example, other potential applications include reducing TLS noise [37], locking to coplanar waveguide resonators [38], SQUID cavities [19], gravitational wave detectors [6], axion dark-matter detectors [39], and magnomechanical experiments [20, 21, 22, 23].
Acknowledgements.
This work was supported by the European Union’s Horizon 2020 research and innovation programme under grant agreements 681476 - QOM3D and the Dutch Research Council (NWO) through a Vici award from the NWO Talent Programme. C.A. Potts acknowledges the support of the Natural Sciences and Engineering Research Council of Canada (NSERC).Appendix A Homodyne Phase Matching
It is worth discussing the effect of the balanced interferometer. As mentioned in Section III, the path length of the reference arm of the interferometer is matched to that of the signal arm. In contrast to the most common use of an interferometer, where the absolute phase difference of the two signals is not important, here we need to match the phases exactly. Because the noise in the system fluctuates the resonance frequency of the cavity, our feedback system continually changes the frequency of the drive tone and, thereby, its wavelength. Therefore, the signals arriving at the mixer will have a frequency-dependent phase difference unless the two path lengths are identical.
Figure 6 shows the calculated homodyne voltage for a balanced and a m unbalanced interferometer. In both cases, the incoming signals are set to be out of phase to measure the quadrature signal. It is clearly visible that in the unbalanced case, there is a sinusoidal profile superimposing the frequency response of the cavity, known as phase-winding fringes. The linear regime has decreased significantly, increasing the chance for the lock to fringe hop to the next slope. This would result in an unstable feedback signal.
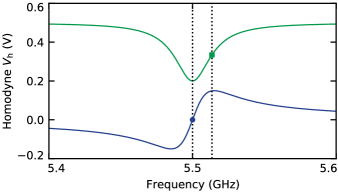
Moreover, it is possible to send the lock tone off-resonant from the cavity by adjusting the setpoint as long as the tone is within the linear regime of the homodyne response. However, one advantage of the homodyne voltage locking, in contrast to the conventional Pound-Drever-Hall technique [15, 16, 17, 18], is that one can also choose to lock at other points in the cavity. Doing so will sacrifice some stability, which will reduce the quality of the lock, but choosing the right phase difference at the mixer allows one lock on the other quadrature, as demonstrated in Figure 7. The dashed lines show examples of setpoints that allow locking on- and off-resonant, while still remaining on an unidirectional slope, using the other quadrature. Note that moving the setpoint further from resonance can decrease the stability of the lock.
Appendix B Spectral Density Calibration
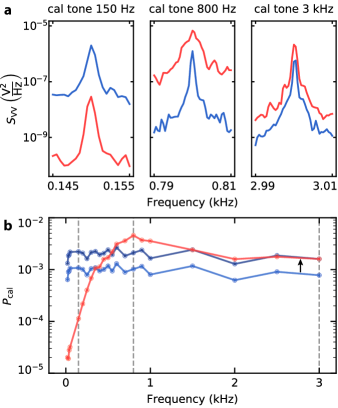
The fluctuations of the unlocked cavity resonance frequency were greater than the region of linear response of the homodyne voltage, as shown in Fig. 2(b). As a result, the measured homodyne voltage did contain information about large frequency fluctuations. To compare the unlocked and locked noise spectra, separate calibration measurements had to be performed. With the Red Pitaya, an additional modulation was applied to the local oscillator at different frequencies for the cavity unlocked and locked. The amplitude of this tone caused a frequency fluctuation of the drive tone that was well within the linear regime of the locked homodyne response and resulted in a sharp peak in the measured power spectral density at the modulation frequency. For the locked cavity, when the frequency of this tone was within the feedback bandwidth, the feedback would create a control voltage to compensate for this artificially added noise. However, for frequencies greater than the feedback bandwidth, the feedback could not compensate this. Therefore, for the tones that were well outside the feedback bandwidth, the integrated area of the calibration tonne is equal for the locked and unlocked spectra. By comparing the integrated areas of these measured peaks, we found the correction factor to scale the unlocked power spectral density accurately. Figure 8(a) shows three added modulation peaks of the measured homodyne voltage, both for the unlocked and locked cavity: one within, one just outside, and one well outside the feedback bandwidth. Figure 8(b) shows the total measured power of the calibration tones applied. It can be seen that the feedback produces a high-pass filter behavior as expected. For the locked cavity, the powers of the calibration tones well outside the feedback bandwidth show a flat relation, indicating that the feedback did not reduce their noise power. The correction factor was then determined by the difference of the powers at the highest frequency, and the corrected unlocked trace was shown. Amending the unlocked data with this calibration enabled us to compare the unlocked and locked measurements fairly.
References
- Den Haan et al. [2014] A. M. Den Haan, G. H. Wijts, F. Galli, O. Usenko, G. J. Van Baarle, D. J. Van Der Zalm, and T. H. Oosterkamp, Atomic resolution scanning tunneling microscopy in a cryogen free dilution refrigerator at 15 mK, Rev. Sci. Instrum. 85, 035112 (2014).
- Niepce et al. [2021] D. Niepce, J. J. Burnett, M. Kudra, J. H. Cole, and J. Bylander, Stability of superconducting resonators: Motional narrowing and the role of landau-zener driving of two-level defects, Sci. Adv. 7, eabh0462 (2021).
- Learn et al. [2022] R. T. Learn, E. Varga, V. Vadakkumbatt, and J. P. Davis, Precision measurements of the zero-temperature dielectric constant and density of liquid , Phys. Rev. B 106, 214509 (2022).
- Brock et al. [2020] B. L. Brock, M. P. Blencowe, and A. J. Rimberg, Frequency fluctuations in tunable and nonlinear microwave cavities, Phys. Rev. Appl. 14, 054026 (2020).
- Müller et al. [2015] C. Müller, J. Lisenfeld, A. Shnirman, and S. Poletto, Interacting two-level defects as sources of fluctuating high-frequency noise in superconducting circuits, Phys. Rev. B 92, 035442 (2015).
- Vadakkumbatt et al. [2021] V. Vadakkumbatt, M. Hirschel, J. Manley, T. J. Clark, S. Singh, and J. P. Davis, Prototype superfluid gravitational wave detector, Phys. Rev. D 104, 082001 (2021).
- Buters et al. [2017] F. M. Buters, K. Heeck, H. J. Eerkens, M. J. Weaver, F. Luna, S. De Man, and D. Bouwmeester, High-Q nested resonator in an actively stabilized optomechanical cavity, Appl. Phys. Lett. 110, 104104 (2017), 1701.04212 .
- Regal et al. [2008] C. A. Regal, J. D. Teufel, and K. W. Lehnert, Measuring nanomechanical motion with a microwave cavity interferometer, Nat. Phys. 4, 555 (2008), arXiv:0801.1827 .
- Clark et al. [2018] T. J. Clark, V. Vadakkumbatt, F. Souris, H. Ramp, and J. P. Davis, Cryogenic microwave filter cavity with a tunability greater than 5 ghz, Rev. Sci. Instrum. 89, 114704 (2018).
- De Wit et al. [2019] M. De Wit, G. Welker, K. Heeck, F. M. Buters, H. J. Eerkens, G. Koning, H. Van der Mee, D. Bouwmeester, and T. H. Oosterkamp, Vibration isolation with high thermal conductance for a cryogen-free dilution refrigerator, Rev. Sci. Instrum. 90, 015112 (2019).
- Lee et al. [2018] C. Lee, H. Jo, C. S. Kang, G. B. Kim, I. Kim, Y. H. Kim, H. J. Lee, and J. So, Vibration mitigation for a cryogen-free dilution refrigerator for the amore-pilot experiment, J. Low Temp. Phys. 193, 786 (2018).
- Kanhirathingal et al. [2022] S. Kanhirathingal, B. Thyagarajan, B. L. Brock, J. Li, E. Jeffrey, M. P. Blencowe, J. Y. Mutus, and A. J. Rimberg, Feedback stabilization of the resonant frequency in a tunable microwave cavity with single-photon occupancy, Phys. Rev. Appl. 18, 064033 (2022).
- Vepsäläinen et al. [2022] A. Vepsäläinen, R. Winik, A. H. Karamlou, J. Braumüller, A. D. Paolo, Y. Sung, B. Kannan, M. Kjaergaard, D. K. Kim, A. J. Melville, et al., Improving qubit coherence using closed-loop feedback, Nat. Commun 13, 1932 (2022).
- Pound [1946] R. V. Pound, Electronic frequency stabilization of microwave oscillators, Rev. Sci. Instrum. 17, 490 (1946).
- Drever et al. [1983] R. W. P. Drever, J. L. Hall, F. V. Kowalski, J. Hough, G. M. Ford, A. J. Munley, and H. Ward, Laser phase and frequency stabilization using an optical resonator, Appl. Phys. B 31, 97 (1983).
- Bjorklund et al. [1983] G. C. Bjorklund, M. D. Levenson, W. Lenth, and C. Ortiz, Frequency modulation (fm) spectroscopy: theory of lineshapes and signal-to-noise analysis, Appl. Phys. B 32, 145 (1983).
- Black [2001] E. D. Black, An introduction to Pound–Drever–Hall laser frequency stabilization, Am. J Phys. 69, 79 (2001).
- Carmon et al. [2005] T. Carmon, T. J. Kippenberg, L. Yang, H. Rokhsari, S. Spillane, and K. J. Vahala, Feedback control of ultra-high-Q microcavities: application to micro-Raman lasers and microparametric oscillators, Opt. Express 13, 3558 (2005).
- Bothner et al. [2021] D. Bothner, I. C. Rodrigues, and G. A. Steele, Photon-pressure strong coupling between two superconducting circuits, Nat. Phys. 17, 85 (2021).
- Potts et al. [2021] C. A. Potts, E. Varga, V. A. S. V. Bittencourt, S. Viola-Kusminskiy, and J. P. Davis, Dynamical backaction magnomechanics, Phys. Rev. X 11, 031053 (2021).
- Potts et al. [2022] C. A. Potts, Y. Huang, V. A. S. V. Bittencourt, S. Viola-Kusminskiy, and J. P. Davis, Dynamical backaction evading magnomechanics, arXiv preprint arXiv:2211.13766 (2022).
- Zhang et al. [2016] X. Zhang, C.-L. Zou, L. Jiang, and H. X. Tang, Cavity magnomechanics, Sci. Adv. 2, e1501286 (2016).
- Shen et al. [2022] R.-C. Shen, J. Li, Z.-Y. Fan, Y.-P. Wang, and J. Q. You, Mechanical bistability in kerr-modified cavity magnomechanics, Phys. Rev. Lett. 129, 123601 (2022).
- Aspelmeyer et al. [2014] M. Aspelmeyer, T. J. Kippenberg, and F. Marquardt, Cavity optomechanics, Rev. Mod. Phys. 86, 1391 (2014).
- Peiter [2022] S. R. Peiter, Delft University of Technology, Ph.D. thesis (2022).
- Noguchi et al. [2016] A. Noguchi, R. Yamazaki, M. Ataka, H. Fujita, Y. Tabuchi, T. Ishikawa, K. Usami, and Y. Nakamura, Ground state cooling of a quantum electromechanical system with a silicon nitride membrane in a 3d loop-gap cavity, New J. Phys. 18, 103036 (2016).
- Brubaker et al. [2022] B. M. Brubaker, J. M. Kindem, M. D. Urmey, S. Mittal, R. D. Delaney, P. S. Burns, M. R. Vissers, K. W. Lehnert, and C. A. Regal, Optomechanical ground-state cooling in a continuous and efficient electro-optic transducer, Phys. Rev. X 12, 021062 (2022).
- Delaney et al. [2022] R. D. Delaney, M. D. Urmey, S. Mittal, B. M. Brubaker, J. M. Kindem, P. S. Burns, C. A. Regal, and K. W. Lehnert, Superconducting-qubit readout via low-backaction electro-optic transduction, Nature 606, 489 (2022).
- Fedorov et al. [2020] S. A. Fedorov, A. Beccari, A. Arabmoheghi, D. J. Wilson, N. J. Engelsen, and T. J. Kippenberg, Thermal intermodulation noise in cavity-based measurements, Optica 7, 1609 (2020).
- Red [2023] See https://redpitaya.com/ for information. (2023), accessed: 2023-03-09.
- Rieger et al. [2022] D. Rieger, S. Günzler, M. Spiecker, A. Nambisan, W. Wernsdorfer, and I. M. Pop, Fano interference in microwave resonator measurements, arXiv preprint arXiv:2209.03036 (2022).
- Weis et al. [2010] S. Weis, R. Rivière, S. Deléglise, E. Gavartin, O. Arcizet, A. Schliesser, and T. J. Kippenberg, Optomechanically induced transparency, Science 330, 1520 (2010).
- Safavi-Naeini et al. [2011] A. H. Safavi-Naeini, T. M. Alegre, J. Chan, M. Eichenfield, M. Winger, Q. Lin, J. T. Hill, D. E. Chang, and O. Painter, Electromagnetically induced transparency and slow light with optomechanics, Nature 472, 69 (2011).
- Teufel et al. [2011] J. D. Teufel, D. Li, M. Allman, K. Cicak, A. J. Sirois, J. D. Whittaker, and R. W. Simmonds, Circuit cavity electromechanics in the strong-coupling regime, Nature 471, 204 (2011).
- Teufel et al. [2016] J. D. Teufel, F. Lecocq, and R. W. Simmonds, Overwhelming Thermomechanical Motion with Microwave Radiation Pressure Shot Noise, Phys. Rev. Lett. 116, 013602 (2016).
- Suh et al. [2013] J. Suh, A. J. Weinstein, and K. C. Schwab, Optomechanical effects of two-level systems in a back-action evading measurement of micro-mechanical motion, Appl. Phys. Lett. 103, 052604 (2013).
- Lindström et al. [2011] T. Lindström, J. Burnett, M. Oxborrow, and A. Y. Tzalenchuk, Pound-locking for characterization of superconducting microresonators, Review of Scientific Instruments 82, 10.1063/1.3648134 (2011), arXiv:1106.5396 .
- Gao et al. [2007] J. Gao, J. Zmuidzinas, B. A. Mazin, H. G. Leduc, and P. K. Day, Noise properties of superconducting coplanar waveguide microwave resonators, Applied Physics Letters 90, 10.1063/1.2711770 (2007).
- Khatiwada et al. [2021] R. Khatiwada, D. Bowring, A. S. Chou, A. Sonnenschein, W. Wester, D. V. Mitchell, T. Braine, C. Bartram, R. Cervantes, N. Crisosto, et al., Axion dark matter experiment: Detailed design and operations, Rev. Sci. Instrum. 92, 124502 (2021).