A rich hydrocarbon chemistry and high C to O ratio in the inner disk around a very low-mass star
Abstract
Carbon is an essential element for life but how much can be delivered to young planets is still an open question. The chemical characterization of planet-forming disks is a crucial step in our understanding of the diversity and habitability of exoplanets. Very low-mass stars () are interesting targets because they host a rich population of terrestrial planets. Here we present the JWST detection of abundant hydrocarbons in the disk of a very low-mass star obtained as part of the MIRI mid-INfrared Disk Survey (MINDS). In addition to very strong and broad emission from C2H2 and its 13C12CH2 isotopologue, C4H2, benzene, and possibly CH4 are identified, but water, PAH and silicate features are weak or absent. The lack of small silicate grains implies that we can look deep down into this disk. These detections testify to an active warm hydrocarbon chemistry with a high C/O ratio in the inner 0.1 au of this disk, perhaps due to destruction of carbonaceous grains. The exceptionally high C2H2/CO2 and C2H2/H2O column density ratios suggest that oxygen is locked up in icy pebbles and planetesimals outside the water iceline. This, in turn, will have significant consequences for the composition of forming exoplanets.
keywords:
Protoplanetary disks, Astrochemistry, Young Stars, Infrared SpectroscopyM dwarfs are the most common stars in the Galaxy and are known to host exoplanets in abundance [1, 2]. However, the terrestrial planet-forming zones of the disks around M dwarfs have been largely inaccessible with previous observations due to limited spatial and spectral resolution and the dim nature of these objects. The source 2MASS-J16053215-1933159 (hereafter denoted as J160532) is a member of the 3–11 Myr old Upper Scorpius star forming region at a distance of 1521 pc [3], with an age of Myr [4]. Its spectral type of M4.75 points to a very low-mass young star (=0.14 M⊙, =0.04 L⊙) [5, 6, 7] that is still undergoing accretion at a rate of M⊙ yr-1. Its broadband infrared spectral energy distribution (SED) indicates the presence of circumstellar material in the form of a disk-like structure in which planets could originate. The non detection of millimeter continuum emission [8] suggests that the current disk mass in millimeter-sized grains is less than 0.75 MEarth. For a standard gas/dust ratio of 100, this would imply a gas mass that is less than 20% of that of Jupiter.
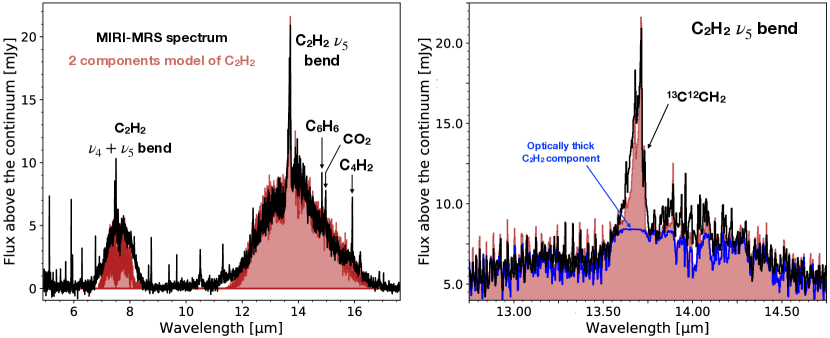
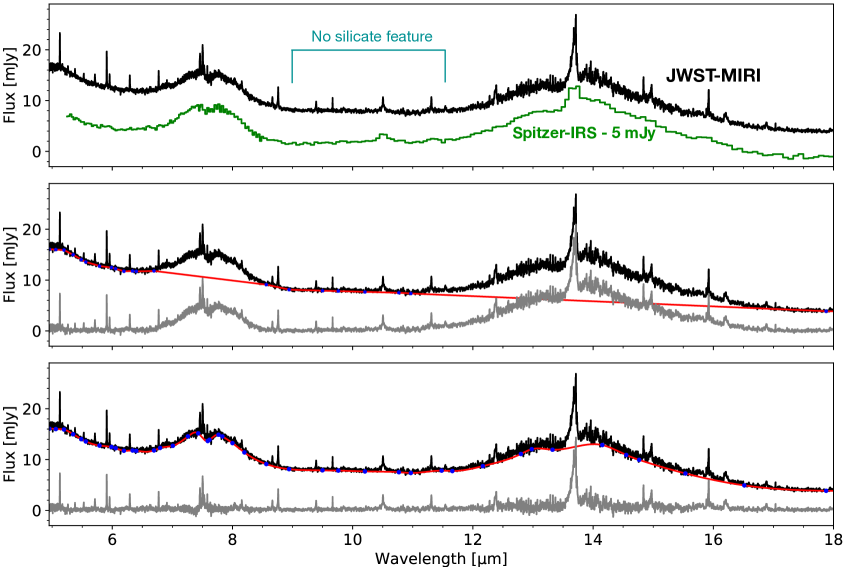
We observed J160532 with the JWST MIRI[9] Medium Resolution Spectrometer (MRS) with a spectral resolving power 1500–4000 covering 5–28 m as part of the guaranteed time MIRI mid-INfrared Disk Survey (MINDS) (see Methods section for more details). The continuum subtracted 5–18 m part of the MIRI spectrum is presented in Figure 1. Compared with mid-infrared spectra of other disks around low-mass stars obtained with the Spitzer Space Telescope [10, 11, e.g.,], its shape is unusual [7]. The broad wavelength spectrum clearly shows two strong, broad bumps centered at 7.7 m and 13.7 m, not seen toward any other disk so far[12]. In contrast, no clear silicate emission features are found at 10 m and 18 m, nor any features due to Polycyclic Aromatic Hydrocarbons (PAHs) at 6.2, 7.7, 8.6 or 11.3 m (see spectrum in Extended Data Fig. 5). These broadband characteristics suggest that the J160532 disk is settled and evolved, with silicate grains in the disk atmosphere that must have grown to at least 5 m.
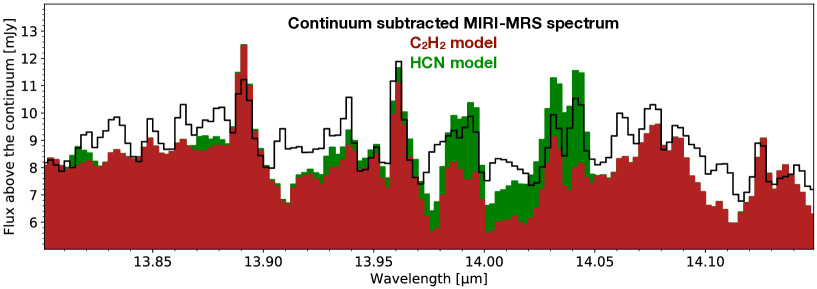
The much higher spectral resolution of MIRI-MRS compared with previous Spitzer data reveals numerous narrow hydrogen recombination lines as well as molecular features on top of the continuum (Figure 1). C2H2 emission at 13.7 m is particularly strong, consistent with earlier findings that this molecule is enhanced in disks around brown dwarfs and very low-mass stars [13, 12, 7]. We focus here on the analysis of the molecular lines and demonstrate that they can be ascribed to a mix of small aliphatic and aromatic hydrocarbon molecules plus CO2 but that any water lines are weak. Column density ratios are found to be very different from those found in disks around the more massive T Tauri stars.
Results
Molecular species were identified by matching the most prominent features in the continuum subtracted JWST-MIRI spectrum with synthetic spectra (see Methods section for more details). Most of the bands involve vibration-rotation transitions. The synthetic spectrum of each molecule is calculated from a plane-parallel slab model, where the gas is assumed to have a uniform temperature and the excitation of the molecules to be in Local Thermodynamic Equilibrium (LTE) at a single excitation temperature equal to [14, 15] . The other fitting parameters are the line of sight column density within a projected emitting area given by its radius . Note that does not need to correspond to a disk radius, but could also represent a ring with the same area. The best fitting parameters are summarized in Table 1.
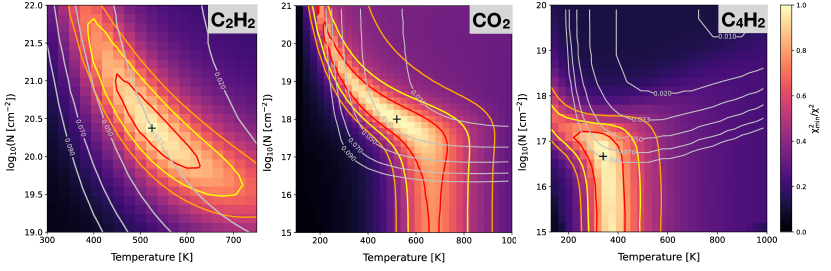
The shape and position of any branch, where lines with zero change in rotational quantum number pile up, are particularly sensitive to temperature. The full ro-vibrational bands of all considered species but H2O require a treatment of line overlap in the optically thick case. For most species with only a single feature, there is often a degeneracy between a high , low optically thin solution and a lower , high optically thick case. Uncertainties and degeneracies associated to the fits are evaluated using a approach following earlier studies [14, 15] (see Extended Data Figure 7).
– C2H2 and 13C12CH2: The -branch of C2H2 at 13.7 m associated with the bending mode on top of the broad continuum is the most prominent feature in the entire MIRI-MRS spectrum (Figure 1). At 3000, MIRI-MRS also reveals a series of and branches on top of both the 13.7 m and 7.7 m broad bumps. The fact that these bumps coincide in location with emission from gaseous C2H2 suggests that the carrier may be due to hot and very abundant C2H2 itself. No solid material can be identified that coincides with these broad bumps, and the spacing between the features is too broad to be due to silicate absorption in a near edge-on system suggested based on Spitzer data [7]. We demonstrate here that both the broad and narrow components are well reproduced by a two-component model consisting of highly optically thick and more optically thin C2H2 emission.
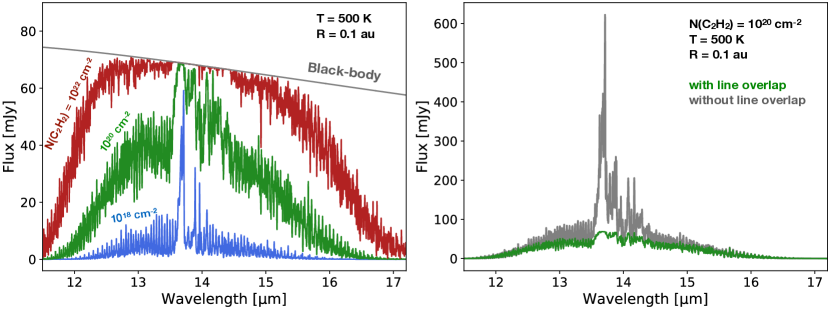
Figure 1 shows that the overall shape of the 13.7 m continuum bump can be well fit by a slab of gas at K with a column density of (C2H2)= cm-2 within an emitting area of (i.e, au). Our fit includes the contribution of 13C12CH2, assuming a C2H2/13C12CH2 ratio of 35 [16]. In the following, this highly optically thick and compact component is called component I. Such an exceptionally high column density of C2H2 is required to fully saturate the blended molecular lines and produce a pseudo-continuum that masks any prominent features like the -branch (see Extended Data Figure 6). Some fraction of the 7.7 m combination band is also recovered, but with a too high contrast between the amplitude of the narrow features and the level of the pseudo-continuum. At such high column densities, hot bands of 13C12CH2 that are not included in spectroscopic databases such as HITRAN should contribute significantly as well to the 7.7 m bump and result in a blending of the individual lines. Proper modeling must await more complete 13C12CH2 molecular spectroscopy including highly excited bands.
The presence of a prominent branch at 13.7 m indicates a second physical component, called component II, producing less optically thick C2H2 emission. Our MIRI-MRS data allow to distinguish also the shortward peaks at 13.63 m and 13.68 m due to hot bands that were blended with the main peak in lower resolution Spitzer spectra [13, 7] (see Figure 1, right). These features are not tracing the bulk reservoir of C2H2 but can either unveil the hotter layer at the surface of the thick component or a more radially extended emission. As an illustration, these features are indeed well reproduced by a somewhat more extended lower column density of (C2H2)=cm-2 with au at a temperature of 400 K. This component would then trace a physically distinct region, at the outer boundary of the C2H2-rich region of the disk. This is the assumption that we make for the analysis of most of the other molecules, which allows us to subtract the contribution of the two C2H2 bumps in the spectra (see Methods section and Extended Data Figure 5) and fit their features without taking into account the masking of the features by optically thick C2H2 lines from component I.
The branch of 13C12CH2 is also detected at 13.73 m above the optically thick component I. If this emission would originate from the optically thinner component II, a C2H2/13C12CH2 abundance ratio of about 3 would be required to match the peak intensity, a value that is an order of magnitude lower than the interstellar 12C/13C ratio. More likely, this indicates a more complex layered structure than the slab model can simulate. Sophisticated models including radial and vertical gradients of temperature and a more complete spectroscopy of 13C12CH2 are needed to consistently interpret the prominent peaks of C2H2 and 13C12CH2 .
– C4H2: The emission features at 15.92 m highlighted in Figure 2 correspond to the branch of the fundamental bending mode of di-acetylene, C4H2. As for other molecules, the shape of this feature depends strongly on temperature, becoming broader at higher . Interestingly, an origin within a small emitting area of au is excluded as line overlap would mask the prominent features. This supports the scenario that the C4H2 features originate from the optically thinner component II. This also motivates the choice of our reference emitting area for the thin component to au. A model with K is able to reproduce the feature at 15.92 m as well as that at 15.88 m. Moreover, the two emission features between 15.7–15.8 m are well reproduced.
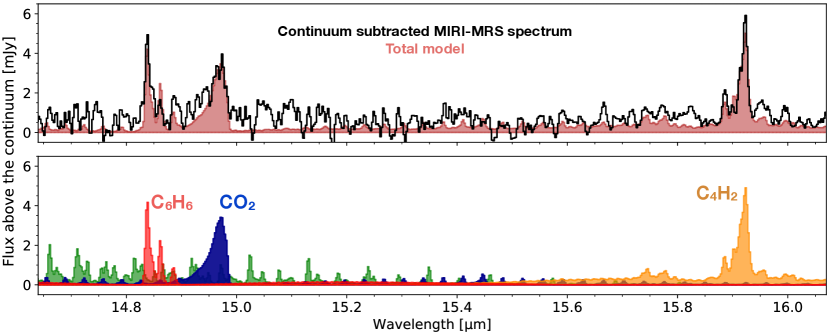
– C6H6: We identified three features around 14.85 m to be the branches of the fundamental and hot bending mode of benzene, C6H6, presented in Figure 2. Their relative intensity is sensitive to temperature and indicates K. As for C4H2, compact emission (au) is excluded.
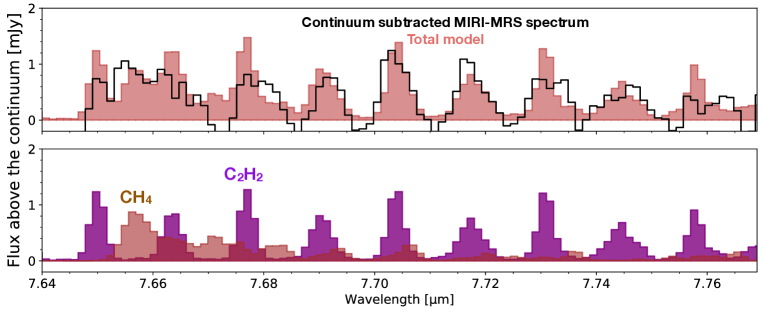
– CH4: Extended Data Figure 8 shows possible indications of CH4 emission. CH4 was previously seen in the GV Tau N disk [17], but only in absorption. We observe emission lines at 7.65–7.67 m that are aligned with the branch of the mode of CH4. C2H2 also has many emission lines in this region, but cannot reproduce by itself this broad feature.
– HCN: The ro-vibrational band from the fundamental bending mode of HCN is severely blended with the strong emission lines of C2H2. Extended Data Figure 9 shows the maximum amount of HCN that could be present in the optically thinner C2H2 component II. If present in the C2H2 thick component I, HCN emission features would be severely masked and its column density in that region cannot be robustly constrained.
– CO2: Figure 2 includes the fit to the CO2 bending mode at 14.98 m that is clearly detected. Assuming that CO2 emission originates from the C2H2 thin component II, the shape of its branch indicates a high temperature around 650 K. Interestingly, the fit points also toward a smaller emitting area very close to that for the optically thick C2H2 component I with similar temperature and a column density as high as 21018 cm-2. In the latter case, C2H2 can partially mask CO2 emission but we checked that the fitted column density is then underestimated by less than a factor of 2. The -branch of 13CO2 at m is not detected, in line with the column densities reported in Table 1.
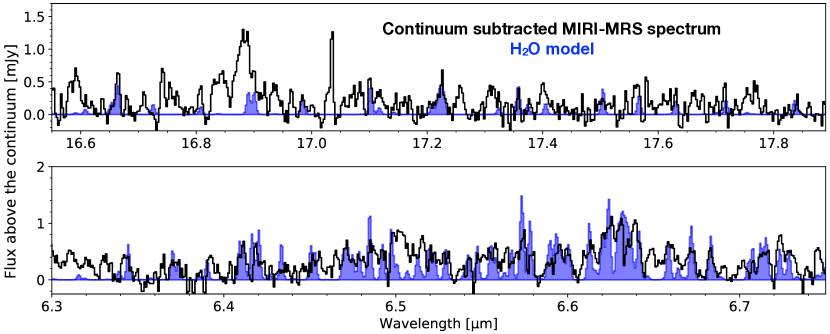
– H2O: Extended Data Figure 10 presents blow-ups of the regions of the MIRI spectrum where water can be observed: at 6 m through the ro-vibrational lines, and at 10 m through highly excited pure rotational transitions [18, 15]. In the J160532 spectrum, neither set of lines are clearly seen but there are a few weak features around 17 m that could potentially be consistent with water emission. In those spectral regions, C2H2 cannot mask H2O emission. The values listed in Table 1 could also be viewed as an upper limit on the amount of water hidden in this spectrum. No OH lines are found.
- H2: Several H2 pure rotational lines are clearly seen in the MIRI-MRS spectrum, which will be analyzed in detail elsewhere. For a temperature of 550 K, indicated by the (1)/(3) line ratio, the total mass of warm H2 is about MJup.
– Other species: At the shortest MIRI wavelength range, between 4.9 and 5.1 m, several CO -branch lines are found, indicative of high temperature gas (K) that will be analyzed elsewhere. Several other hydrocarbon species (C2H4, HC3N) were searched for in the J160532 spectrum, but not identified. Also, NH3, whose mode at 8.8 m can be observed with MIRI, was not found in the current spectrum. The [Ne II] line at 12.8 m is not detected.
| Component Ia | Component II | |||
| Molecule | ||||
| (K) | (1017 cm-2) | (K) | (1017 cm-2) | |
| C2H2 | 525 | 400 | 2.5 | |
| C4H2 | - | - | 330 | 0.7 |
| C6H6 | - | - | 400 | 0.7 |
| CH4 | - | - | 400b | 1.5 |
| CO2 | 430 | 20 | 650 | 0.36 |
| HCN | - | - | 400b | 1.5 |
| H2O | 525b | 400b | ||
Note a: for H2O and CO2, the reported values correspond to an alternative fit to component II assuming that all the emission originates from the C2H2 thick component I ().
Note b: fit performed by fixing the temperature to that of the corresponding C2H2 component.
Uncertainties on the column densities correspond to the confidence interval obtained by fixing the emitting area and are only valid in the framework of our simple slab modelling. For clarity, uncertainties smaller than 0.5 dex are not reported.
Discussion
The most striking feature of the J160532 MIRI spectrum is the dominance of hydrocarbon emission, most notably C2H2, but also C4H2, C6H6 (benzene), and possibly CH4. In contrast, at best weak H2O emission is found, and CO2 has a similar column density as most hydrocarbons in component II (Table 1). Hydrocarbon molecules like C4H2 and benzene have been found previously in some astrophysical environments, including asymptotic giant branch stars, comets and moons in our own Solar System [19, 20, 21], but not yet in the planet-forming zones of disks. These detections therefore highlight that the inner disks around very low-mass objects are indeed very rich in carbon-bearing molecules as suggested based on Spitzer data [12, 13, 7]. The high column densities point toward being able to probe deep down layers, likely due to a lack of grains in the inner disk.
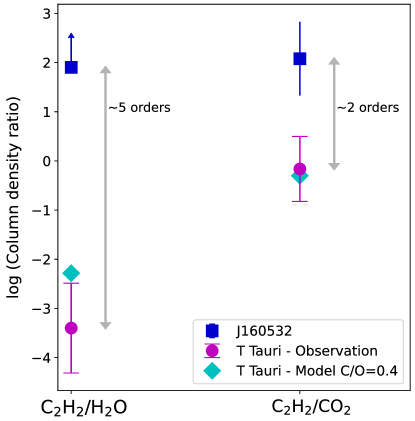
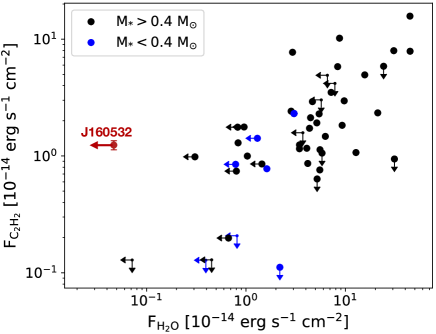
Figure 3 summarizes the observed column density ratios of key molecules in J160532 with those found in disks around more massive T Tauri stars [15]. For the latter, the sources listed in Table 8 of Salyk et al. [15] with detected C2H2 and H2O are taken. The C2H2/H2O ratio for the optically thick component I is up to 5 orders of magnitude higher in the J160532 disk than for T Tauri disks, and even more if H2O is treated as an upper limit. Similarly, the C2H2/CO2 ratio is 2 orders of magnitude higher. These ratios are much higher than just the flux ratios shown in Extended Data Figure 11 since our analysis, including the hot bands and a detailed treatment of line overlap, clearly demonstrates that the C2H2 emission is highly optically thick boosting its column density by orders of magnitude. Note that these column density ratios should not be viewed as local abundance ratios since each molecular band may originate from a different part of the disk, with abundances known to vary radially and vertically [22].
Nevertheless, the J160532 disk is clearly rich in hydrocarbon molecules and the observed chemical differences indicate that hydrocarbon molecules either form more efficiently in disks around very low-mass stars, or that the conditions for their survival are more favorable there. One difference is the UV spectrum of the central star, which has many fewer high energy photons that can photodissociate molecules for an M-type star than for an early K- or G-type star. However, J160532 still does have some accretion consistent with its relatively young age of 2.5 Myr; its estimated FUV luminosity of log()=–3.59 L⊙ [7] is comparable to that of T Tauri stars. As an M star, J160532 may also have chromospheric activity and flares producing enhanced UV and X-rays, the latter estimated [7] at log()=28.8 erg s-1.
The alternative possibility is enhanced C2H2 production. Carbonaceous grains and PAHs can be destroyed in the inner disk due to UV radiation, chemical processes or sublimation producing abundant C2H2 [23, 24]. Interestingly, the so-called hydrocarbon “soot” line as defined by the sublimation front of refractory carbon is estimated to lie at 500 K [25], the temperature found for the abundant optically thick C2H2 component I. The exact location of the “soot” line is however uncertain and depends on the type of carbonaceous material, with some laboratory data putting sublimation of amorphous carbon grains at higher temperatures, up to 1200 K [26]. One possibility is therefore that we are witnessing carbon grain destruction in the inner disk. Is carbon grain destruction observable in other disks? This remains an open question to be tackled with the upcoming JWST data. If carbon grains are destroyed by UV photolysis, it could be dramatically enhanced in J160532 due to dust growth and settling which increase the penetration depth of the UV. Alternatively, carbon grain destruction could be happening primarily in the high temperature midplane that is uniquely visible in the J160532 disk but hidden from our view in most disks due to the presence of dust with high infrared optical depth.
Further insight into the hydrocarbon chemistry can be obtained from comparison of our observed column density ratios with those found in thermo-chemical models [27] of disks around low-mass stars (see Methods section for more details). Interestingly, both benzene and C4H2 were predicted to be abundant in inner disk regions [28, 16]. For the optically thin C2H2 component II in which these molecules are not masked by optically thick C2H2, we find relatively good agreement with the models even though benzene is underestimated by the models (see Extended Data Table 2). Under these conditions – warm dense gas with high C2H2 abundance – one would expect also efficient PAH formation up to temperatures where erosion starts to take over [29, 30]. To what extent the absence of PAH features in the J160532 spectrum also implies absence of PAHs, or whether there is simply not enough UV radiation to excite and make them visible [31], needs to be quantified. A detailed comparison using a physical-chemical model appropriate for the J160532 disk is postponed to a future study.
An additional source of C2H2 production due to carbon grain destruction in the J160532 disk would also be consistent with the fact that the observed C2H2/H2O ratio is four orders of magnitude higher than what is found in those models. CO2 is underabundant as well by two orders of magnitude. This conclusion holds irrespective of the stellar mass and adopted UV field in the models [27].
Najita et al. [32, 33] suggested that the range in observed HCN/H2O ratios for T Tauri stars implies different C/O ratios in the inner disk. High HCN/H2O ratios would indicate that H2O is locked up in non-migrating pebbles and planetesimals in the outer disk beyond the water iceline. In the J160532 disk, the HCN/H2O ratio cannot be robustly constrained but the C2H2/H2O ratio is much higher than for T Tauri disks. [34]. In fact, thermochemical disk models of cool M-type stars predict a low H2O abundance due to the lower temperature of their disks driving much of the oxygen into O2[27]. Still, for solar C/O ratios, CO2 is predicted to be one of the main oxygen carriers after CO and O2, in stark contrast with our estimates of the CO2/C2H2 ratio. Such high abundance ratios as found here can therefore only be reproduced if the C/O ratio of the gas in the inner disk is significantly increased compared with standard values of C/O=0.4 [7]. In fact, the models of Najita et al.[32], Woitke et al.[22] and Anderson et al. [35] show that values of C/O1 are needed to ensure that the bulk of the volatile oxygen is contained in CO leaving little room for H2O and CO2 production, and permitting the formation of abundant C2H2.
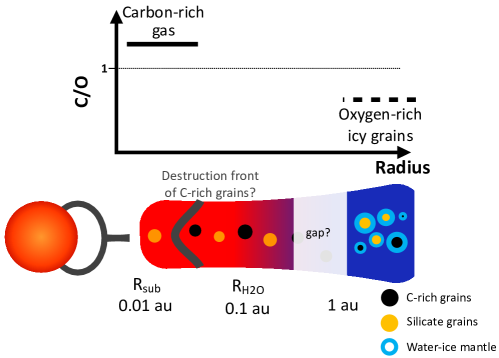
What could cause the inner disk to be depleted in oxygen compared to carbon? Destruction of carbon-rich grains helps to boost carbon and thus the gas-phase C/O ratio by about a factor of 2 compared to the volatile carbon in the interstellar medium (about 50 of the total elemental carbon), enough to put the C/O ratio close to unity. However, the very high C/O ratio inferred for the inner disk of J160532 may also point toward a depletion of oxygen. To deplete the inner disk of oxygen the most plausible mechanism would be to lock most of it up in water ice in pebbles and planetesimals in the outer disk, beyond the water snowline, which for such a low mass star is around 0.1 au [36]. Gas with high C/O, as often found in the outer disk [37], could still be able to cross the gap. Little is known about the small scale structure of disks around very low mass stars like J160532, but our findings would imply that such dust disks are not smooth but must have significant substructure with dust and ice traps on (sub)au scales [38, 39], as illustrated in Figure 4. To avoid much oxygen crossing these traps, they must develop early in the disk’s evolution, perhaps due to a companion that has formed there. ALMA observations of the outer disk, and analysis of H2 and ro-vibrational CO emission from the inner disk, combined with detailed modelling, are required to constrain the gas-phase C/O and O/H elemental ratios in the inner versus outer disk and further quantify the destruction of carbon grains and the efficiency of oxygen trapping in the outer disk.
What are the implications for any planets forming around J160532? The current amount of solid material contained in millimeter-sized grains in its disk after 2.5 Myr of evolution is less than an Earth mass [8], but the system could have started forming planetesimals and building planets earlier in its lifetime. In fact, there is ample evidence for efficient terrestrial planet formation around very low-mass objects. The occurrence rate per M-dwarf is 2.50.2 planets with radii of 1–4 and periods 200 days [1] . Surveys also find that short-period (10 days) planets around stars with 0.34 M⊙ are significantly overabundant relative to more massive stars [2]. Our JWST data reveal that the chemistry in disks around such very low-mass stars may have an even higher gaseous C/O ratio in the planet-forming zones than thought before. This, in turn, could significantly affect the composition of planets that may form around them.
To what extent the planets inside 0.1 au are also carbon rich will depend on whether they are formed mostly from “dry” planetesimals in this inner disk, or whether their bulk composition and atmospheres result primarily from impacting icy planetesimals from the outer disk, as found in scenarios for making terrestrial planets [40, 41]. In fact, it is not clear whether planetesimals formed in the inner disk are carbon rich: our data indicate the presence of some warm silicate refractory dust producing continuum mid-infrared emission, whereas a significant fraction of the carbon may be in the gas-phase and even refractory carbon grains may have been destroyed. This carbon-rich gas could be lost from the system over time, with only a small fraction of carbon eventually included in planets [42]. Such a scenario likely holds for our own Earth which is known to be very carbon poor [25]. These two competing scenarios — making carbon-rich versus carbon-poor terrestrial planets— can be tested by comparing high sensitivity JWST observations of the chemical composition of significant samples of disks around very low-mass young stars with that of the atmospheres of terrestrial-sized planets around mature M stars like the Trappist I system[43] and brown dwarfs.
Methods
Observations and data reduction
J160532 was observed with the JWST Mid-InfraRed Instrument (MIRI) [44, 9, 45] in Medium Resolution Spectroscopy mode (MRS) [46] on 2022 August 1, from 05:50:01 UT, for a total observation time of 2.22 hours. The observation is number 47 of the Cycle 1 Guaranteed Time Observation (GTO) program 1282 (PI: Thomas Henning). Following target acquisition, the three grating settings Short (A), Medium (B) and Long (C) were used in each of the four channels observations carried out in parallel, providing full coverage of the MIRI spectral window m. For each of the three sub-bands, the FASTR1 readout pattern was adopted with a point source 4-point dither pattern, an exposure time of 308 s and an integration time of 74.9 s.
For the reduction of the uncalibrated raw data, we used the version 1.8.4 of the JWST Science Calibration Pipeline [47] and the CRDS context jwst_1017.pmap. The uncal files were first processed with the default class of the pipeline Detector1. Next, we performed a background correction by subtracting each dither pattern from the other associated pattern (1 from 4, 2 from 3 and vice-versa). We then applied the default class Spec2, skipping the residual fringe correction. The data were then processed by the Spec3 class, which combines the calibrated data from the different dither observations into a final level3 spectral cube. We skipped the outlier_detection and master_background methods of the class, since we already performed the background subtraction after Detector1. We set Spec3 to produce one spectral cube for each sub-band, from which we extracted the spectrum using the pipeline method extract1d. This was done in order to provide the best input for a residual fringe correction that we applied at the spectrum level.
Local continuum fit
Extended Data Figure 5 shows the baseline fit used to produce the spectrum in Figures 1 and 2. Starting from the original spectrum, first a low-order continuum due to warm dust emission has been removed over the entire 5-20 m range, producing Figure 1. Subsequently, the two broad bumps at 7.7 m and 13.7 m have been subtracted in Figures 2, 8, and 10 to further analyse all the molecular features except that of the very optically thick bumps of C2H2 (component I).
Slab model fits
The molecular lines are analysed using a slab approach that takes into account optical depth effects. The level populations are assumed to be in local thermodynamical equilibrium (LTE) and the line profile function to be Gaussian with an intrinsic broadening of km s-1 (FWHM of km s-1) to include the effect of turbulence. We note that for optically thin lines, the inferred column densities are independent of the value of whereas for optically thick emission, the inferred column densities scale approximatively as . The line emission is assumed to originate from a layer of gas with a temperature and a line of sight column density of . Because most of the species analysed here produce lines that are close to each other in frequency, we adopt a detailed treatment of line overlap by first computing the wavelength dependent opacity over a fine grid of wavelength ()
| (1) |
where is the line index, is the rest wavelength of line , is the intrinsic broadening of the line in m, and is the optical depth at the center of line given by
| (2) |
In this equation, and denote the population level of the upper and lower states, and their respective statistical weights, and the spontaneous downward rate of the transition. The flux density is then computed assuming an emitting area of and a distance to the source as:
| (3) |
and convolved at MIRI-MRS spectral resolution. This special treatment, though computationally expensive, is particularly crucial at high column densities for which overlapping lines can form an effectively optically thick continuum across a relatively broad spectral range (see Extended Data Figure 6). Our code has been benchmarked against the publicly available code slabspec[48].
The molecular data, i.e., line positions, Einstein coefficients, statistical weights, and partition functions, were taken from the HITRAN 2020 database [49], except for C6H6 for which the molecular parameters were provided based on the GEISA database [50]. We provide further details about the C6H6 line list used in the next section.
Protoplanetary disks are obviously not isothermal (vertically or radially), but previous studies have shown that the LTE assumption is a good first step approximation to determine the relative column densities of molecules and physical parameters of the line-emitting regions [14, 15]. Non-LTE effects can play a role for the higher excited energy levels [51] if the local density is less than cm-3. Differences up to factors of 3 in inferred column densities have been found in LTE vs non-LTE comparisons for the case of HCN ro-vibrational lines [52]. Since non-LTE effects are expected to be comparable and in the same direction for different molecules, the effect on column density ratios is expected to be smaller than such a factor of 3.
Given the overwhelming presence of the C2H2 band in the MIRI spectrum, we first fit the broad continuum bump (component I) between 12 and 17 m using a approach (see Extended Data Figure 7, left) and including the contribution of 13C12CH2 with a C2H2/13C12CH2 ratio of 35, half of the interstellar medium value to account for two carbon atoms [16]. In order to avoid the contribution of the other molecular features, the fit is computed using 4 spectral windows (m, m, m, and m). We then find a more optically thin model that reproduces well the main branches of C2H2 and 13C12CH2, assuming that this second component II originates from a different region of the disk. This model, with an emitting area corresponding to au, is only illustrative since the accuracy of this fit is limited by the lack of spectroscopic data of 13C12CH2. Excited states of the band of 13C12CH2 are indeed missing in the molecular databases whereas the contribution of those states to the branch of C2H2 is expected to be significant.
The resulting C2H2 models for both component I and II are then subsequently used in the analysis of the other species to identify spectral windows that are free of contamination by narrow C2H2 features (see e.g., Extended Data Figure 8). However, in order to subtract the contribution of optically thick C2H2 (component I), we do not use the best fit model but subtract a spline fit through the two broad C2H2 bumps. This strategy avoids artefacts in the subtracted spectra that would be due to the imperfect C2H2 model.
When subtracting the prominent C2H2 bumps prior to the fit of the other features, we implicitly neglect mutual line overlap between C2H2 and the other species which can be relevant if the emission of the species originates from the optically thick C2H2 component I. In fact, as discussed in the main text, only the analyses of CO2 and HCN are affected by C2H2 opacity. This is because CO2 and HCN features could originate from component I and are located close to prominent C2H2 lines. For HCN, masking by C2H2 is too significant to put constraints on the amount of HCN in component I. For CO2, we conducted additional tests and find that the derived column densities of CO2 for component I change by only a factor of less than two when including mutual shielding of the lines.
The best fit slab model parameters (, , emitting area characterized by ) for the species other than C2H2 are then estimated by a approach (see Extended Data Figure 7). Extensive grids of models varying the column density from up to cm-2, in steps of 1.26 in log10-space and temperature from 100 up to 1500 K in steps of 25 K were computed. Given that C2H2 emission is highly optically thick, the fit of the 13.7 m bump allows us to determine the emitting radius of au. Interestingly, the fit of the CO2 feature points toward a similarly small emitting area. In contrast, for the C4H2 and benzene prominent features, a compact emission with au is excluded. When the cannot constrain the emitting size (optically thin lines), the same emitting radius of au is used to evaluate or place upper limits on column densities (CH4, C6H6, C4H2, HCN). For H2O, the emitting area is unconstrained and we provide (upper limit) column densities for either component I or II in Table 1.
In the calculation of the , specific spectral windows are chosen to avoid contamination by other molecular features. The 1, 2, and 3 confidence intervals are estimated by drawing the contours of corresponding to values of 2.3, 6.2, and 11.8, respectively, and using a representative noise level of mJy, where is the reduced obtained by fitting the emitting area for a given value of [53, see e.g.,].
Benzene spectroscopy
Benzene is included in the GEISA database[50], but the existing line list does not provide Einstein A coefficients nor statistical weights and involves only the cold band centered at 14.837 m (673 .975 cm-1). Therefore, the missing spectroscopic parameters that are necessary for the present study have been generated.
For the cold band, we completed the line list, in terms of nuclear spin statistical weights and Einstein coefficients, using the method described in ref.[54], and the available spectroscopic constants[55]. For the partition function, that involves a vibrational and a rotational contribution, we used the empirical equations of ref.[55]. Before this, we made extensive calculations to check that these equations are usable for the K K temperature range with an error that is less than 0.5%. The contribution of hot bands at 14.9 m is missing in the GEISA line list. For this heavy molecule, these hot bands contribute about 45 to the infrared activity at 14.9 m at room temperature. To account for these contributions, we generated empirical line lists, using the cold band as a “guide list” and the cross-section measurements of benzene performed at high resolution and for different temperatures[56].
Details of disk models
The observational results are compared with a number of state-of-the-art thermochemical disk models in Extended Data Table 2. In this comparison, we show two observational values of the ratios; assuming either an emitting region corresponding to the highly optically thick component I of C2H2, or from the less optically thick component II. The thermochemical models assume a gas surface density structure, often taken to be the self-similar solution of a viscously evolving disk. Since we are only interested in the inner few au of the disk, the precise shape and size of the outer disk are not relevant. The gas distribution in the vertical direction is characterized by a scale height and flaring index. The disk is irradiated by the star whose FUV spectrum is given by its effective temperature and strength by its luminosity. Extra UV due to accretion is modelled by adding a K black body with a strength proportional to the observed accretion rate or . X-rays and cosmic rays are also included, the latter usually at a generic rate of s-1.
The models first solve for the dust temperature given the source’s luminosity, and then either assume that the gas temperature is equal to the dust temperature or solve explicitly for the gas temperature by iterating over the heating and cooling balance with a small chemical network. Typical gas temperatures in the inner ( au) disk are a few thousand K at the top of the atmosphere, dropping to several hundred K deeper in the disk where most of the molecular emission originates [22]. Such temperatures are consistent with our inferred values of 300–600 K for C2H2 and other molecules. Finally, the 2D abundance distribution of each molecule can be determined by solving the chemistry at each grid point using a more extensive chemical network. Details can be found in refs.[32, 57, 22].
Most relevant for comparison with our observations are those models that include a large hydrocarbon network. In particular, Woods & Willacy [16] have developed a detailed chemical model appropriate for a disk around a T Tauri star including not just 12C but also 13C isotopologues. We take the column densities at 1 au from their Table 3 for comparison in Figure 3. Walsh et al. [27] have run chemical models for disks around a M dwarf, a T Tauri star and a Herbig star, to investigate how the chemistry differs across the stellar mass range. We focus here on their results for the M-dwarf disk. Walsh et al. show not only total column densities as function of disk radius, but also the column densities above the dust surface at 14 m, since mid-infrared observations do not probe down to the midplane. We take the latter for our comparison. None of these models vary the input volatile C and O abundances (i.e., the amount of carbon and oxygen that can cycle between gas and ice), which are usually taken such that oxygen is more abundant than carbon at C/O=0.4.
Najita et al. [32] have also presented sophisticated inner disk models focusing on smaller molecules up to C2H2, HCN and H2O to investigate trends with disk parameters and C/O. Their models include accretional heating and stellar X-rays, but not FUV radiation in the heating and chemistry. Their model abundances of hydrocarbon molecules are clearly increased when C/O is increased. The same is found in more recent models by Woike et al. [22] and Anderson et al.[35].
1 Extended Data
| Ratio | Observationsa | TTauri model | BD model | |
|---|---|---|---|---|
| Component I | Component II | WW 092 | WNvD153 | |
| C4H2/C2H2 | - | 0.3 | 0.18 | - |
| CH4/C2H2 | - | 0.6 | 0.18 | - |
| C6H6/C2H2 | - | 0.3 | 0.024 | - |
| CO2/C2H2 | 0.14 | 2.0 | - | |
| H2O/C2H2 | 3 | 192 | 100 | |
1. Assuming that the emission is either confined to the C2H2 highly optically thick component I or the optically thinner component II. The prominent features of the small hydrocarbons are associated to the extended component II only whereas the CO2 emission originates more likely from the thick component I (see main text). 2. Woods & Willacy (2009). 3. Walsh, Nomura & van Dishoeck (2015). 4. Woods & Willacy (2007).
Data Availability
The original data analysed in this work are part of the GTO-MIRI programme "MIRI EC Protoplanetary and Debris Disks Survey" (ID 1282) with number 47 and will become public on August 1 2023 on the MAST database https://archive.stsci.edu/.
The continuum-subtracted spectra presented in Figure 1 (right) and in Figure 2 will be made available on Zenodo upon publication.
The spectroscopic data for all the species but benzene are available on the HITRAN database (https://hitran.org/). For benzene, the data will be shared on request
to the corresponding author.
Code Availability
The slab model used in this work is a private code developed by BT and collaborators. It is available from the corresponding author upon request. The synthetic spectra presented in this work can be reproduced using the slabspec code, which is publicly available at https://doi.org/10.5281/zenodo.4037306.
Acknowledgements
The MINDS team would like to thank the entire MIRI European and US instrument team. Support from StScI is also appreciated. The following National and International Funding Agencies funded and supported the MIRI development: NASA; ESA; Belgian Science Policy Office (BELSPO); Centre Nationale d’Etudes Spatiales (CNES); Danish National Space Centre; Deutsches Zentrum fur Luftund Raumfahrt (DLR); Enterprise Ireland; Ministerio De Economiá y Competividad; Netherlands Research School for Astronomy (NOVA); Netherlands Organisation for Scientific Research (NWO); Science and Technology Facilities Council; Swiss Space Office; Swedish National Space Agency; and UK Space Agency.
B.T. is a Laureate of the Paris Region fellowship program, which is supported by the Ile-de-France Region and has received funding under Marie Sklodowska-Curie grant agreement No. 945298. G.B. thanks the Deutsche Forschungsgemeinschaft (DFG) - grant 325594231, FOR 2634/2. E.v.D. acknowledges support from the EU ERC grant 101019751 MOLDISK and the Danish National Research Foundation through the Center of Excellence “InterCat” (DNRF150). D.G. would like to thank the Research Foundation Flanders for co-financing the present research (grant number V435622N). T.H. and K.S. acknowledge support from the ERC Advanced Grant Origins 83 24 28. I.K., A.A., and E.v.D. acknowledge support from grant TOP-1614.001.751 from the Dutch Research Council (NWO). I.K. and J.K. acknowledge funding from H2020-MSCA-ITN- 2019, grant no. 860470 (CHAMELEON). O.A. and V.C. acknowledge funding from the Belgian F.R.S.-FNRS. I.A. and D.G. thank the European Space Agency (ESA) and the Belgian Federal Science Policy Office (BELSPO) for their support in the framework of the PRODEX Programme. D.B. has been funded by Spanish MCIN/AEI/10.13039/501100011033 grants PID2019- 107061GB-C61 and No. MDM-2017-0737. A.C.G. has been supported by PRIN-INAF MAIN-STREAM 2017 and from PRIN-INAF 2019 (STRADE). T.P.R acknowledges support from ERC grant 743029 EASY. D.R.L. acknowledges support from Science Foundation Ireland, grant number 21/PATH-S/9339. L.C. acknowledges support by grant PIB2021-127718NB-I00, from the Spanish Ministry of Science and Innovation/State Agency of Research MCIN/AEI/10.13039/501100011033.
Author contributions
BT and GB did the analysis using molecular data files created by AA and AP and a model developed by BT and JB. GB, SG and DG performed the data reduction, supported by IA, JS, MS, GP, VC, and JB. EvD, BT, and GB wrote the manuscript. TH and IK planned and co-led the MIRI guaranteed time project on disks. All authors participated in either the development and testing of the MIRI instrument and its data reduction, in the discussion of the results, and/or commented on the manuscript.
Competing Interests
The authors declare no competing financial interests.
Correspondence
Correspondence and requests for materials should be addressed to Benoit Tabone, benoit.tabone@universite-paris-saclay.fr.
References
- [1] Dressing, C. D. & Charbonneau, D. The Occurrence of Potentially Habitable Planets Orbiting M Dwarfs Estimated from the Full Kepler Dataset and an Empirical Measurement of the Detection Sensitivity. \JournalTitleApJ 807, 45 (2015).
- [2] Sabotta, S. et al. The CARMENES search for exoplanets around M dwarfs. Planet occurrence rates from a subsample of 71 stars. \JournalTitleA&A 653, A114 (2021).
- [3] Gaia Collaboration et al. Gaia Data Release 3: Summary of the content and survey properties. \JournalTitlearXiv e-prints (2022).
- [4] Miret-Roig, N. et al. The star formation history of Upper Scorpius and Ophiuchus. A 7D picture: positions, kinematics, and dynamical traceback ages. \JournalTitleA&A 667, A163 (2022).
- [5] Carpenter, J. M., Ricci, L. & Isella, A. An ALMA Continuum Survey of Circumstellar Disks in the Upper Scorpius OB Association. \JournalTitleApJ 787, 42 (2014).
- [6] Luhman, K. L., Herrmann, K. A., Mamajek, E. E., Esplin, T. L. & Pecaut, M. J. New Young Stars and Brown Dwarfs in the Upper Scorpius Association. \JournalTitleAJ 156, 76 (2018).
- [7] Pascucci, I., Herczeg, G., Carr, J. S. & Bruderer, S. The Atomic and Molecular Content of Disks around Very Low-mass Stars and Brown Dwarfs. \JournalTitleApJ 779, 178 (2013).
- [8] Barenfeld, S. A., Carpenter, J. M., Ricci, L. & Isella, A. ALMA Observations of Circumstellar Disks in the Upper Scorpius OB Association. \JournalTitleApJ 827, 142 (2016).
- [9] Wright, G. S. et al. The Mid-Infrared Instrument for the James Webb Space Telescope, II: Design and Build. \JournalTitlePASP 127, 595 (2015).
- [10] Kessler-Silacci, J. et al. c2d Spitzer IRS Spectra of Disks around T Tauri Stars. I. Silicate Emission and Grain Growth. \JournalTitleApJ 639, 275–291 (2006).
- [11] Furlan, E. et al. A Survey and Analysis of Spitzer Infrared Spectrograph Spectra of T Tauri Stars in Taurus. \JournalTitleApJS 165, 568–605 (2006).
- [12] Dahm, S. E. & Carpenter, J. M. Spitzer Spectroscopy of Circumstellar Disks in the 5 Myr Old Upper Scorpius OB Association. \JournalTitleAJ 137, 4024–4045 (2009).
- [13] Pascucci, I. et al. The Different Evolution of Gas and Dust in Disks around Sun-Like and Cool Stars. \JournalTitleApJ 696, 143–159 (2009).
- [14] Carr, J. S. & Najita, J. R. Organic Molecules and Water in the Inner Disks of T Tauri Stars. \JournalTitleApJ 733, 102 (2011).
- [15] Salyk, C., Pontoppidan, K. M., Blake, G. A., Najita, J. R. & Carr, J. S. A Spitzer Survey of Mid-infrared Molecular Emission from Protoplanetary Disks. II. Correlations and Local Thermal Equilibrium Models. \JournalTitleApJ 731, 130 (2011).
- [16] Woods, P. M. & Willacy, K. Carbon Isotope Fractionation in Protoplanetary Disks. \JournalTitleApJ 693, 1360–1378 (2009).
- [17] Gibb, E. L. & Horne, D. Detection of CH4 in the GV Tau N Protoplanetary Disk. \JournalTitleApJ 776, L28 (2013).
- [18] Carr, J. S. & Najita, J. R. Organic Molecules and Water in the Planet Formation Region of Young Circumstellar Disks. \JournalTitleScience 319, 1504 (2008).
- [19] Cernicharo, J. et al. Infrared Space Observatory’s Discovery of C4H2, C6H2, and Benzene in CRL 618. \JournalTitleApJ 546, L123–L126 (2001).
- [20] Coustenis, A. et al. The composition of Titan’s stratosphere from Cassini/CIRS mid-infrared spectra. \JournalTitleIcarus 189, 35–62 (2007).
- [21] Schuhmann, M. et al. Aliphatic and aromatic hydrocarbons in comet 67P/Churyumov-Gerasimenko seen by ROSINA. \JournalTitleA&A 630, A31 (2019).
- [22] Woitke, P. et al. Modelling mid-infrared molecular emission lines from T Tauri stars. \JournalTitleA&A 618, A57 (2018).
- [23] Kress, M. E., Tielens, A. G. G. M. & Frenklach, M. The ‘soot line’: Destruction of presolar polycyclic aromatic hydrocarbons in the terrestrial planet-forming region of disks. \JournalTitleAdvances in Space Research 46, 44–49 (2010).
- [24] Anderson, D. E. et al. Destruction of Refractory Carbon in Protoplanetary Disks. \JournalTitleApJ 845, 13 (2017).
- [25] Li, J., Bergin, E. A., Blake, G. A., Ciesla, F. J. & Hirschmann, M. M. Earth’s carbon deficit caused by early loss through irreversible sublimation. \JournalTitleScience Advances 7, eabd3632 (2021).
- [26] Gail, H.-P. & Trieloff, M. Spatial distribution of carbon dust in the early solar nebula and the carbon content of planetesimals. \JournalTitleA&A 606, A16 (2017).
- [27] Walsh, C., Nomura, H. & van Dishoeck, E. The molecular composition of the planet-forming regions of protoplanetary disks across the luminosity regime. \JournalTitleA&A 582, A88 (2015).
- [28] Woods, P. M. & Willacy, K. Benzene Formation in the Inner Regions of Protostellar Disks. \JournalTitleApJ 655, L49–L52 (2007).
- [29] Frenklach, M. & Feigelson, E. D. Formation of Polycyclic Aromatic Hydrocarbons in Circumstellar Envelopes. \JournalTitleApJ 341, 372 (1989).
- [30] Morgan, J., W. A., Feigelson, E. D., Wang, H. & Frenklach, M. A new mechanism for the formation of meteoritic kerogen-like material. \JournalTitleMeteoritics 26, 374 (1991).
- [31] Geers, V. C. et al. C2D Spitzer-IRS spectra of disks around T Tauri stars. II. PAH emission features. \JournalTitleA&A 459, 545–556 (2006).
- [32] Najita, J. R., Ádámkovics, M. & Glassgold, A. E. Formation of Organic Molecules and Water in Warm Disk Atmospheres. \JournalTitleApJ 743, 147 (2011).
- [33] Najita, J. R. et al. The HCN-Water Ratio in the Planet Formation Region of Disks. \JournalTitleApJ 766, 134 (2013).
- [34] van Dishoeck, E. F. et al. Water in star-forming regions: physics and chemistry from clouds to disks as probed by Herschel spectroscopy. \JournalTitleA&A 648, A24 (2021).
- [35] Anderson, D. E. et al. Observing Carbon and Oxygen Carriers in Protoplanetary Disks at Mid-infrared Wavelengths. \JournalTitleApJ 909, 55 (2021).
- [36] Mulders, G. D., Ciesla, F. J., Min, M. & Pascucci, I. The Snow Line in Viscous Disks around Low-mass Stars: Implications for Water Delivery to Terrestrial Planets in the Habitable Zone. \JournalTitleApJ 807, 9 (2015).
- [37] Bosman, A. D. et al. Molecules with ALMA at Planet-forming Scales (MAPS). VII. Substellar O/H and C/H and Superstellar C/O in Planet-feeding Gas. \JournalTitleApJS 257, 7 (2021).
- [38] Pinilla, P. et al. Explaining millimeter-sized particles in brown dwarf disks. \JournalTitleA&A 554, A95 (2013).
- [39] Kurtovic, N. T. et al. Size and structures of disks around very low mass stars in the Taurus star-forming region. \JournalTitleA&A 645, A139 (2021).
- [40] Morbidelli, A., Lunine, J. I., O’Brien, D. P., Raymond, S. N. & Walsh, K. J. Building Terrestrial Planets. \JournalTitleAnnual Review of Earth and Planetary Sciences 40, 251–275 (2012).
- [41] Ormel, C. W., Liu, B. & Schoonenberg, D. Formation of TRAPPIST-1 and other compact systems. \JournalTitleA&A 604, A1 (2017).
- [42] Lee, J.-E., Bergin, E. A. & Nomura, H. The Solar Nebula on Fire: A Solution to the Carbon Deficit in the Inner Solar System. \JournalTitleApJ 710, L21–L25 (2010).
- [43] Greene, T. P. et al. Thermal emission from the Earth-sized exoplanet TRAPPIST-1 b using JWST. \JournalTitlearXiv e-prints (2023).
- [44] Rieke, G. H. et al. The Mid-Infrared Instrument for the James Webb Space Telescope, I: Introduction. \JournalTitlePASP 127, 584 (2015).
- [45] Labiano, A. et al. Wavelength calibration and resolving power of the JWST MIRI Medium Resolution Spectrometer. \JournalTitleA&A 656, A57 (2021).
- [46] Wells, M. et al. The Mid-Infrared Instrument for the James Webb Space Telescope, VI: The Medium Resolution Spectrometer. \JournalTitlePASP 127, 646 (2015).
- [47] Bushouse, H. et al. spacetelescope/jwst: JWST 1.6.2. Zenodo (2022).
- [48] Salyk, C. slabspec: Python code for producing LTE slab model molecular spectra. Zenodo (2020).
- [49] Gordon, I. et al. The hitran2020 molecular spectroscopic database. \JournalTitleJournal of Quantitative Spectroscopy and Radiative Transfer 277, 107949 (2022).
- [50] Delahaye, T. et al. The 2020 edition of the geisa spectroscopic database. \JournalTitleJournal of Molecular Spectroscopy 380, 111510 (2021).
- [51] Meijerink, R., Pontoppidan, K. M., Blake, G. A., Poelman, D. R. & Dullemond, C. P. Radiative Transfer Models of Mid-Infrared H2O Lines in the Planet-Forming Region of Circumstellar Disks. \JournalTitleApJ 704, 1471–1481 (2009).
- [52] Bruderer, S., Harsono, D. & van Dishoeck, E. F. Ro-vibrational excitation of an organic molecule (HCN) in protoplanetary disks. \JournalTitleA&A 575, A94 (2015).
- [53] Avni, Y. Energy spectra of X-ray clusters of galaxies. \JournalTitleApJ 210, 642–646 (1976).
- [54] Šimečková, M., Jacquemart, D., Rothman, L. S., Gamache, R. R. & Goldman, A. Einstein A-coefficients and statistical weights for molecular absorption transitions in the HITRAN database. \JournalTitleJ. Quant. Spec. Radiat. Transf. 98, 130–155 (2006).
- [55] Dang-Nhu, M. & Plíva, J. Intensities in the 4, 12, 13, and 14 bands of benzene. \JournalTitleJournal of Molecular Spectroscopy 138, 423–429 (1989).
- [56] Sung, K., Toon, G. C. & Crawford, T. J. N2- and (H2+He)-broadened cross sections of benzene (C6H6) in the 7-15 m region for the Titan and jovian atmospheres. \JournalTitleIcarus 271, 438–452 (2016).
- [57] Bruderer, S. Survival of molecular gas in cavities of transition disks. I. CO. \JournalTitleA&A 559, A46 (2013).
- [58] Lebouteiller, V. et al. CASSIS: The Cornell Atlas of Spitzer/Infrared Spectrograph Sources. \JournalTitleApJS 196, 8 (2011).
- [59] Banzatti, A. et al. The Kinematics and Excitation of Infrared Water Vapor Emission from Planet-forming Disks: Results from Spectrally Resolved Surveys and Guidelines for JWST Spectra. \JournalTitleAJ 165, 72 (2023).
- [60] Banzatti, A. et al. Hints for Icy Pebble Migration Feeding an Oxygen-rich Chemistry in the Inner Planet-forming Region of Disks. \JournalTitleApJ 903, 124 (2020).