——Appendix 2418——
| Modality | Site | Original Dataset |
|
Annotation Type |
|
Manufactor | ||||
|---|---|---|---|---|---|---|---|---|---|---|
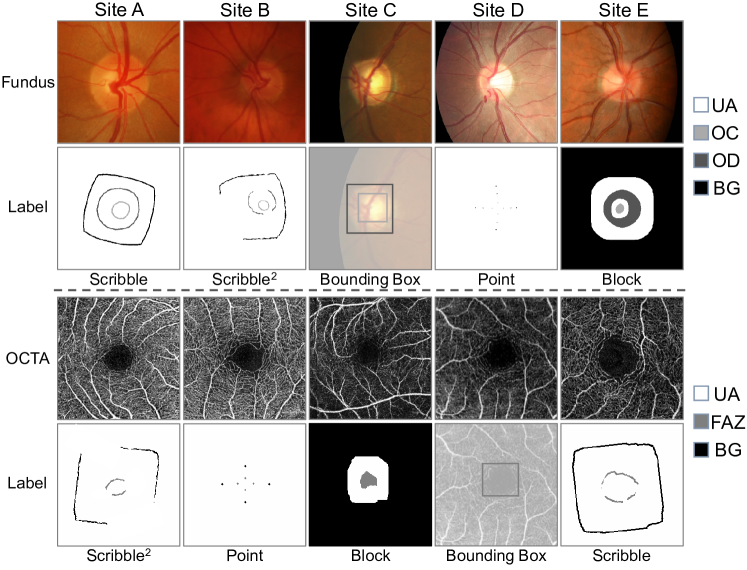
| Fundus | A | Drishti-G | 50:51 | Scribble | 384×384 | (Aravind eye hospital) | ||||
| B | RIM-ONE-r | 99:60 | Scribble2 | Nidek AFC-210 | ||||||
| C | REFUGE-train | 320:80 | Bounding box | Zeiss Visucam 500 | ||||||
| D | REFUGE-val | 320:80 | Point | Canon CR-2 | ||||||
| E | GAMMA | 100:100 | Block | KOWA camera & Topcon TRC-NW400 | ||||||
| OCTA | A | FAZID | 244:60 | Scribble | 256×256 | Cirrus 5000 Angioplex | ||||
| B | OCTA500-3M | 150:50 | Point | RTVue-XR, Optovue, CA | ||||||
| C | OCTA500-6M | 200:100 | Block | RTVue-XR, Optovue, CA | ||||||
| D | OCTA-25K (sOCTA-3x3) | 708:304 | Bounding box | Triton DRI-OCT, Topcon Inc | ||||||
| E | ROSE | 30:9 | Scribble2 | RTVueXR Avanti SD-OCT system, Optovue |
| HD95 (OD) | HD95 (OC) | Overall | |||||||||||
| Methods | Site A | Site B | Site C | Site D | Site E | Avg. | Site A | Site B | Site C | Site D | Site E | Avg. | |
| FedAvg | 13.17±8.04 | 24.10±26.68 | 9.28±7.23 | 20.80±43.31 | 24.59±33.12 | 18.39 | 18.56±12.99 | 23.98±28.08 | 11.19±9.99 | 22.42±47.48 | 16.80±32.37 | 18.59 | 18.49 |
| FedProx | 8.38±4.17 | 15.72±21.67 | 10.64±14.23 | 16.02±27.82 | 20.36±31.30 | 14.22 | 14.17±6.91 | 12.82±7.34 | 13.36±13.58 | 13.91±25.36 | 16.10±30.24 | 14.07 | 14.15 |
| FT | 10.07±8.96 | 22.26±25.08 | 8.51±7.58 | 40.12±53.19 | 20.36±31.19 | 20.26 | 19.96±12.44 | 22.24±27.52 | 11.68±9.94 | 31.60±51.63 | 14.59±26.15 | 20.02 | 20.14 |
| FedBN | 8.78±4.77 | 18.06±28.02 | 19.54±32.51 | 10.72±25.22 | 17.68±28.85 | 14.96 | 15.70±7.14 | 12.08±6.79 | 17.24±32.24 | 9.96±24.07 | 11.96±13.18 | 13.39 | 14.17 |
| FedAP | 9.19±6.18 | 21.59±14.86 | 8.96±12.14 | 5.77±2.61 | 16.80±29.82 | 12.46 | 15.69±7.47 | 14.68±19.84 | 12.66±14.05 | 7.05±3.19 | 14.49±25.30 | 12.91 | 12.69 |
| FedRep | 17.39±28.48 | 21.59±27.13 | 23.56±34.86 | 54.10±68.55 | 31.00±39.85 | 29.53 | 27.61±37.21 | 18.90±21.65 | 17.89±29.64 | 50.60±79.80 | 17.71±28.70 | 26.54 | 28.03 |
| MetaFed | 41.99±52.18 | 28.19±44.51 | 119.84±70.20 | 33.57±55.59 | 23.06±20.78 | 49.33 | 34.82±43.31 | 13.86±7.60 | 32.83±53.45 | 9.37±14.39 | 14.56±16.37 | 21.09 | 35.21 |
| FedICRA (Ours) | 7.83±5.20 | 10.36±18.40 | 10.10±9.81 | 10.87±20.65 | 9.02±10.84 | 9.64 | 15.47±10.27 | 11.86±6.37 | 8.61±3.88 | 6.13±3.10 | 8.47±9.29 | 10.11 | 9.87 |
| LT (Weak) | 26.91±42.21 | 44.05±59.07 | 74.35±74.73 | 151.71±54.14 | 19.53±23.93 | 63.31 | 16.51±8.51 | 35.98±58.07 | 24.93±43.10 | 19.27±33.63 | 16.45±22.63 | 22.62 | 42.97 |
| CT (Weak) | 9.32±5.86 | 12.25±7.00 | 7.29±3.23 | 11.97±15.68 | 14.52±23.10 | 11.07 | 15.55±7.30 | 13.79±7.13 | 10.73±4.32 | 9.83±16.04 | 12.15±19.02 | 12.41 | 11.74 |
| LT (Full) | 9.27±10.42 | 6.26±4.83 | 7.55±6.05 | 5.38±2.63 | 11.07±20.82 | 7.91 | 13.34±7.13 | 12.62±8.56 | 9.18±5.43 | 6.30±3.48 | 11.51±16.56 | 10.59 | 9.25 |
| CT (Full) | 6.40±3.48 | 8.95±7.34 | 6.13±2.53 | 4.62±2.01 | 8.92±18.19 | 7.00 | 12.31±5.45 | 11.28±6.95 | 8.47±4.47 | 5.74±2.70 | 8.48±11.91 | 9.26 | 8.13 |