Do We Train on Test Data? The Impact of Near-Duplicates on License Plate Recognition
Abstract
This work draws attention to the large fraction of near-duplicates in the training and test sets of datasets widely adopted in License Plate Recognition (LPR) research. These duplicates refer to images that, although different, show the same license plate. Our experiments, conducted on the two most popular datasets in the field, show a substantial decrease in recognition rate when six well-known models are trained and tested under fair splits, that is, in the absence of duplicates in the training and test sets. Moreover, in one of the datasets, the ranking of models changed considerably when they were trained and tested under duplicate-free splits. These findings suggest that such duplicates have significantly biased the evaluation and development of deep learning-based models for LPR. The list of near-duplicates we have found and proposals for fair splits are publicly available for further research at https://raysonlaroca.github.io/supp/lpr-train-on-test/.
I Introduction
Research into Automatic License Plate Recognition (ALPR) has gained significant attention in recent years due to its practical applications, including toll collection, vehicle access control in restricted areas, and traffic law enforcement [3, 4, 5].
ALPR is commonly divided into two tasks: License Plate Detection (LPD) and License Plate Recognition (LPR). The first task refers to locating the license plates (LPs) in the input image, while the second refers to recognizing the characters on those LPs. Recent developments in deep neural networks have led to advancements in both tasks, but current research has mostly focused on LPR [6, 7, 8, 9, 10] since general-purpose object detectors (e.g., Faster-RCNN and YOLO) have already achieved notable success in LPD for some time now [11, 12, 13].
LPR methods are typically evaluated using images from public datasets, which are divided into disjoint training and test sets using standard splits, defined by the datasets’ authors, or following previous works (when there is no standard split). In most cases, such an assessment is carried out independently for each dataset [12, 3, 4, 9, 14].
Although the images for training and testing belong to disjoint sets, the splits traditionally adopted in the literature were defined without considering that the same LP may appear in multiple images (see Section II-A). As a result, we found that there are many near-duplicates (i.e., different images of the same LP) in the training and test sets of datasets widely explored in ALPR research. In this study, to evaluate the impact of such duplicates on LPR, we focus our analysis on the AOLP [1] and CCPD [2] datasets, as they are the most popular datasets in the field. Nevertheless, Section IV clarifies the existence of near-duplicates in several other datasets and gives examples of how it has been overlooked in the literature.
Considering that recent ALPR approaches rectify (unwarp) the detected LPs before feeding them to the recognition model [15, 16, 17, 5, 18], the presence of duplicates in the training and test sets means that LPR models are, in many cases, being trained and tested on essentially the same images (see Fig. 1). This is a critical issue for accurate scientific evaluation [19, 20]. Researchers aim to compare models in terms of their ability to generalize to unseen data [21, 22]. With a considerable number of duplicates, however, there is a risk of comparing the models in terms of their ability to memorize training data, which increases with the model’s capacity [19, 23].
In light of this, we create fair splits for the AOLP and CCPD datasets (see Section III-A) and compare the performance of six well-known Optical Character Recognition (OCR) models applied to LPR under the original (adopted in previous works) and fair protocols. Our results indicate that the presence of duplicates greatly affects the performance evaluation of these models. Considering the experiments under the AOLP-B protocol as an example, the model that reached the best results under the traditional split ranked third under the fair one. Such results imply that the duplicates have biased the evaluation and development of deep learning-based models for LPR.
This work is inspired by [19], where duplicates in the CIFAR-10 and CIFAR-100 datasets were identified, and motivated by recent studies that demonstrated the existence of bias in the ALPR context. An example worth mentioning is [6], where the authors observed significant drops in LPR performance when training and testing state-of-the-art models in a leave-one-dataset-out experimental setup.
In summary, this paper has two main contributions:
-
•
We unveil the presence of near-duplicates in the training and test sets of datasets widely adopted in the ALPR literature. Our analysis, using the AOLP and CCPD datasets, shows the impact of such duplicates on the evaluation of six well-known OCR models applied to LPR.
-
–
Our results on the AOLP dataset indicate that the high fraction of near-duplicates in the splits traditionally employed in the literature may have hindered the development and acceptance of more efficient LPR models that have strong generalization abilities but do not memorize duplicates as well as other models;
-
–
Our experiments on the CCPD dataset give a clearer picture of the true capabilities of LPR models compared to prior evaluations using the standard split, in which the test set has duplicates in the training set. Results revealed a decrease in the average recognition rate from % to % when the experiments were conducted under a fair split without duplicates.
-
–
-
•
We create and release fair splits for these datasets where there are no duplicates in the training and test sets, and the key characteristics of the original partitions are preserved as much as possible (see details on Section III-A).
This paper is structured as follows. We describe the AOLP and CCPD datasets in Section II, detailing the protocols often adopted for each and how many near-duplicates they have. Section III details the experiments performed. The presence of duplicates in other popular datasets is discussed in Section IV. Finally, conclusions are provided in Section V.
II The AOLP and CCPD datasets
The two most popular datasets for ALPR (in terms of the number of works that explored them) are AOLP [1] and CCPD [2]. While most authors explored at least one of these two datasets in their experiments (e.g., [24, 25, 17, 5]), there are many works in which the experiments were performed exclusively on them (e.g., [26, 27, 28, 14]).
AOLP was created to verify that ALPR is better handled in an application-oriented way. It is categorized into three subsets: access control (AC), traffic law enforcement (LE), and road patrol (RP). The subsets have , and images, respectively. All images were acquired in the Taiwan region.
As the AOLP dataset does not have a standard split, it has been divided in various ways in the literature. For instance, some authors (e.g., [26, 25, 28]) randomly divided its images into training and test sets with a : ratio (we refer to this protocol as AOLP-A), whereas other authors (e.g., [24, 9, 5]) used images from different subsets for training and testing, for example, the authors of [15, 29, 16] used images from the AC and LE subsets to train the proposed models and tested them on the RP subset (we refer to this protocol as AOLP-B). Zhuang et al. [3] evaluated their method under both the AOLP-A and AOLP-B protocols. As commonly done in previous works, we consider that 20% of the training images are allocated for validation in both protocols.
In 2018, Xu et al. [2] claimed that the ALPR datasets available at the time (including AOLP) either lacked quantity (i.e., they had less than K images) or diversity (i.e., they were collected by static cameras or in overly controlled settings). Thus, to assist in better benchmarking ALPR approaches, they presented the CCPD dataset.
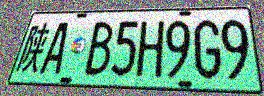
CCPD comprises images taken with handheld cameras by workers of a roadside parking management company on the streets of a capital city in mainland China. The dataset was updated/expanded twice after being introduced in 2018111 CCPD’s latest version: https://github.com/detectRecog/CCPD/. It originally consisted of K images, divided into subsets (e.g., Blur, Challenge, Rotate, Weather, among others) according to their characteristics [2]. Then, in 2019, the authors released a new version – much more challenging than the previous one – containing over K images, refined annotations222 While the annotations were refined in the first update to CCPD (in 2019), there are still significant inaccuracies in the coordinates of the LP corners., and a standard split protocol. In summary, in this protocol, the K images in the “Base” subset are split into training and validation sets (50%/50%), while all images from the other subsets are employed for testing. Finally, in 2020, the authors included a new subset (Green) with images of electric vehicles, which have green LPs with eight characters (all the other subsets have images of vehicles with blue LPs containing seven characters). These updates to the CCPD dataset are precisely why some works claim that it has K images [27, 15, 28], others claim that it has -K [9, 7, 5], while the current version has images11footnotemark: 1.
II-A Duplicates
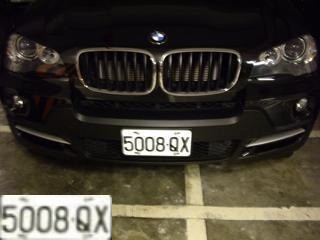
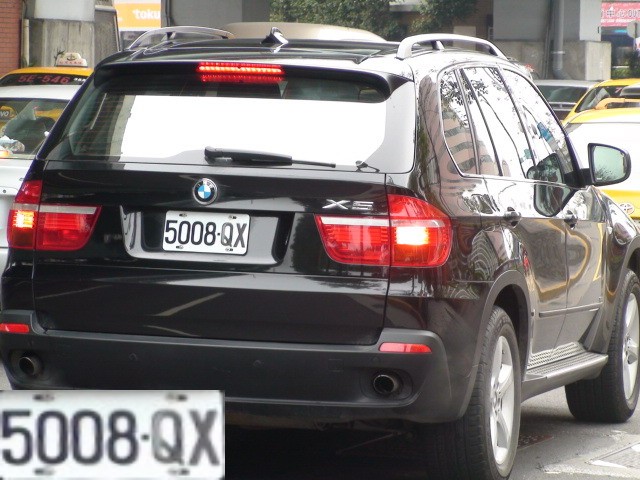
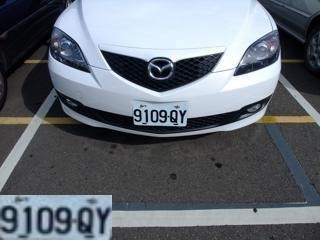
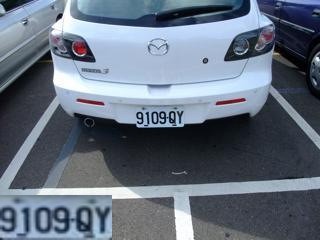
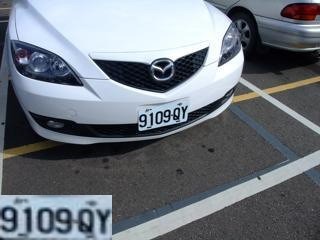
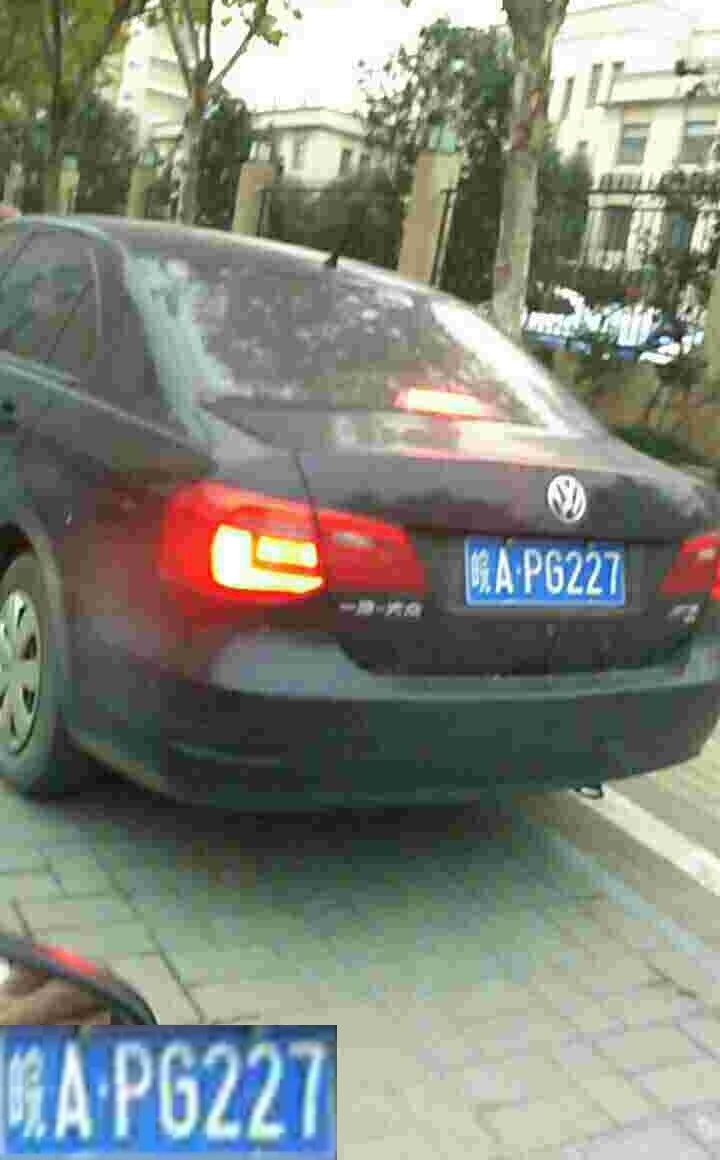
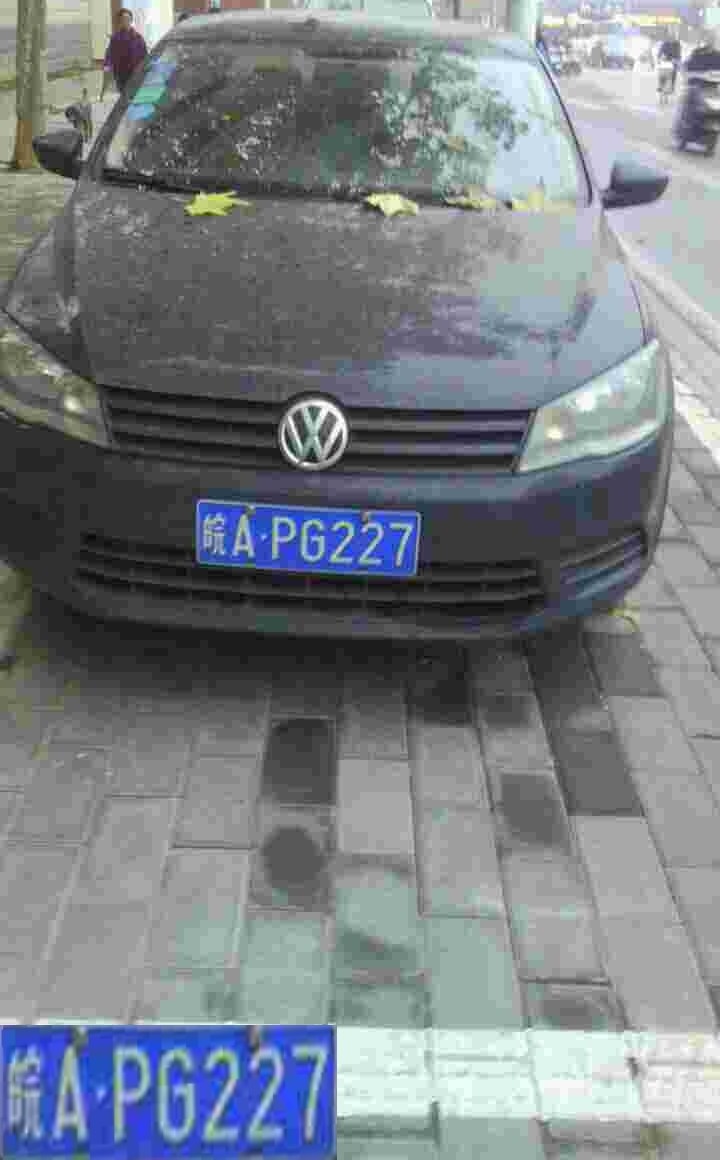
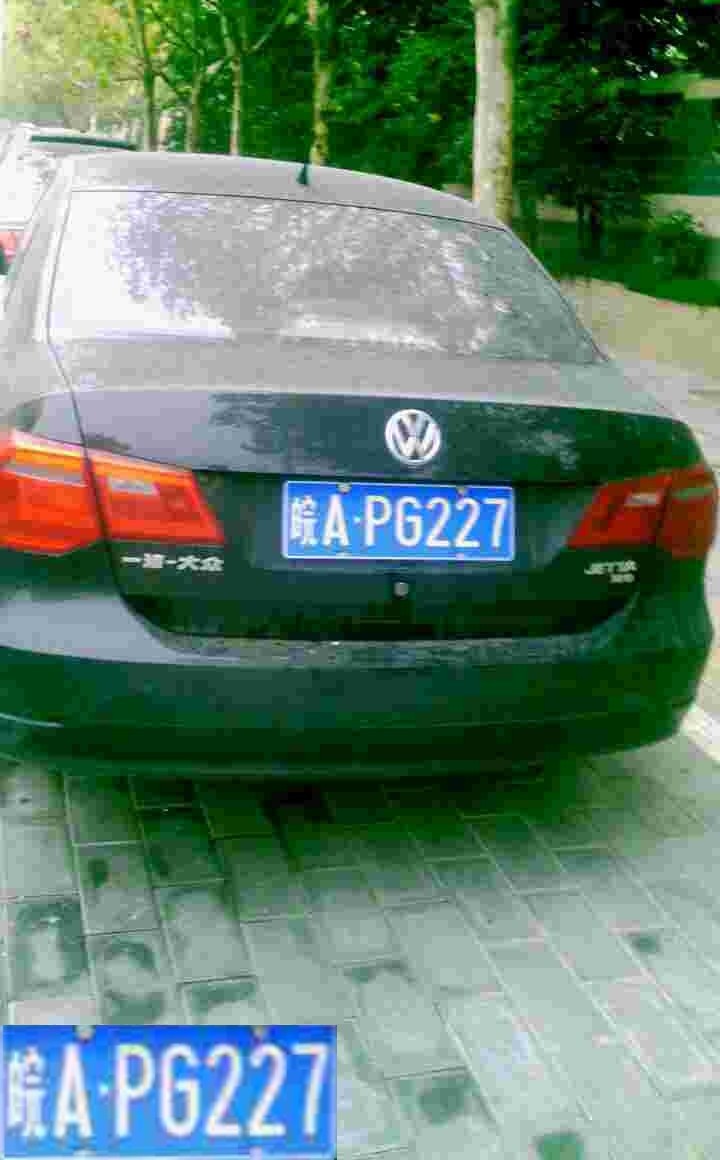
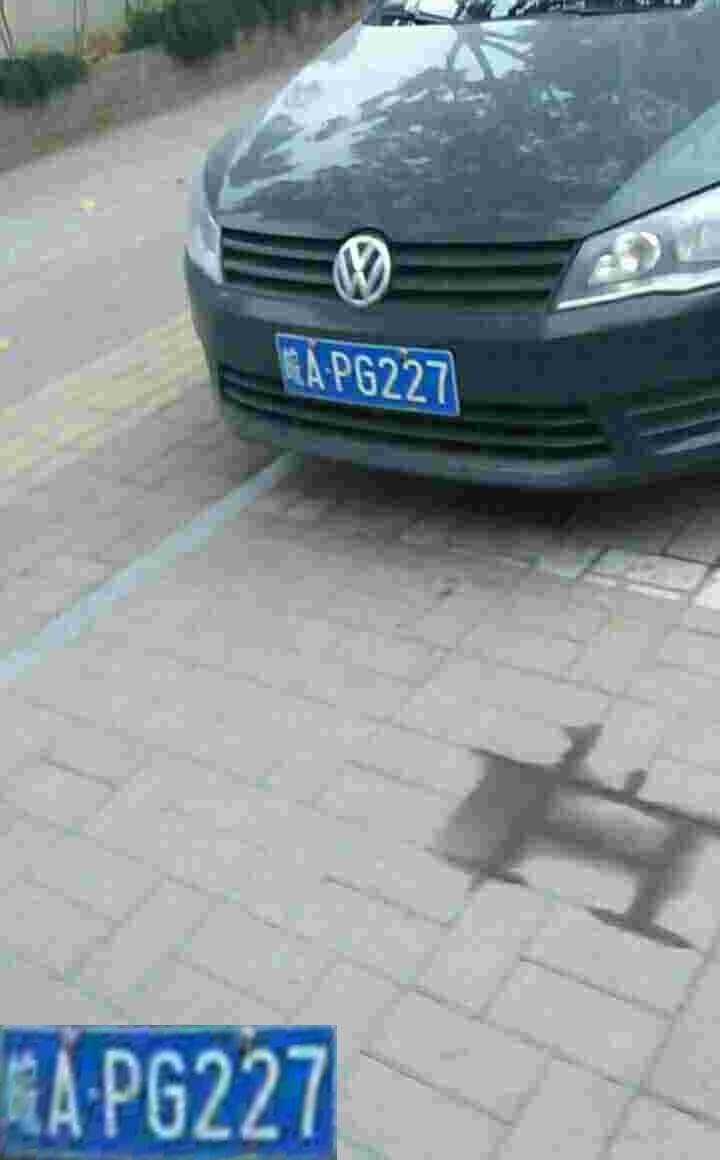
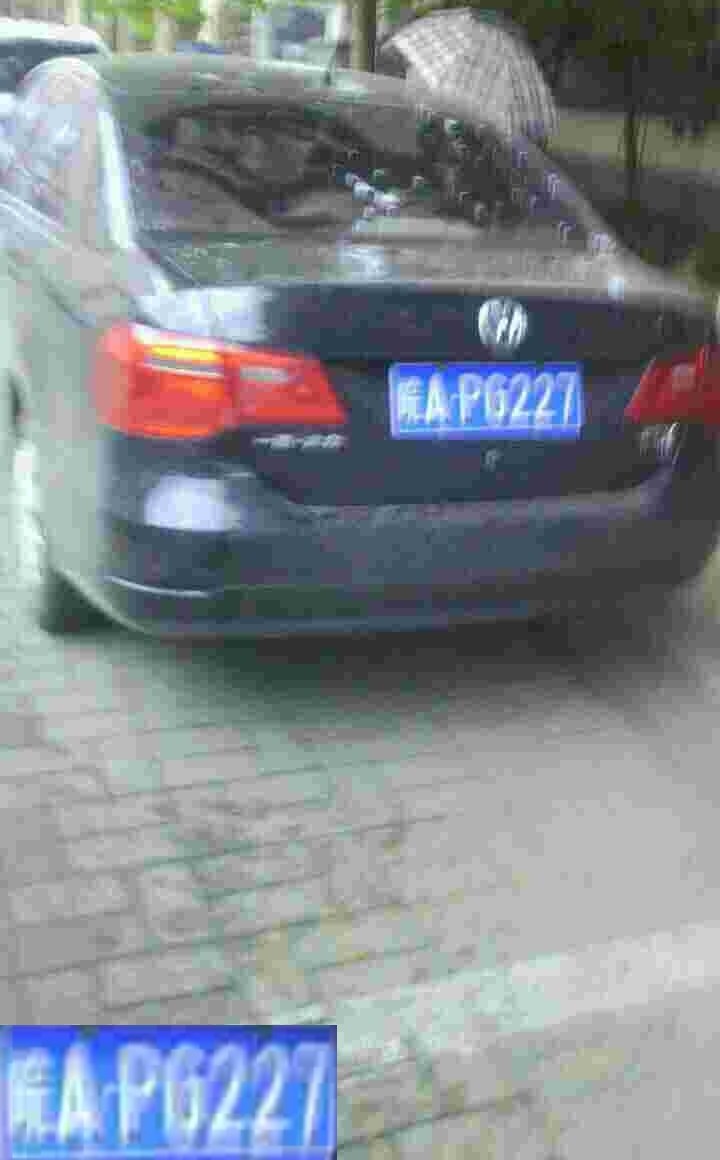
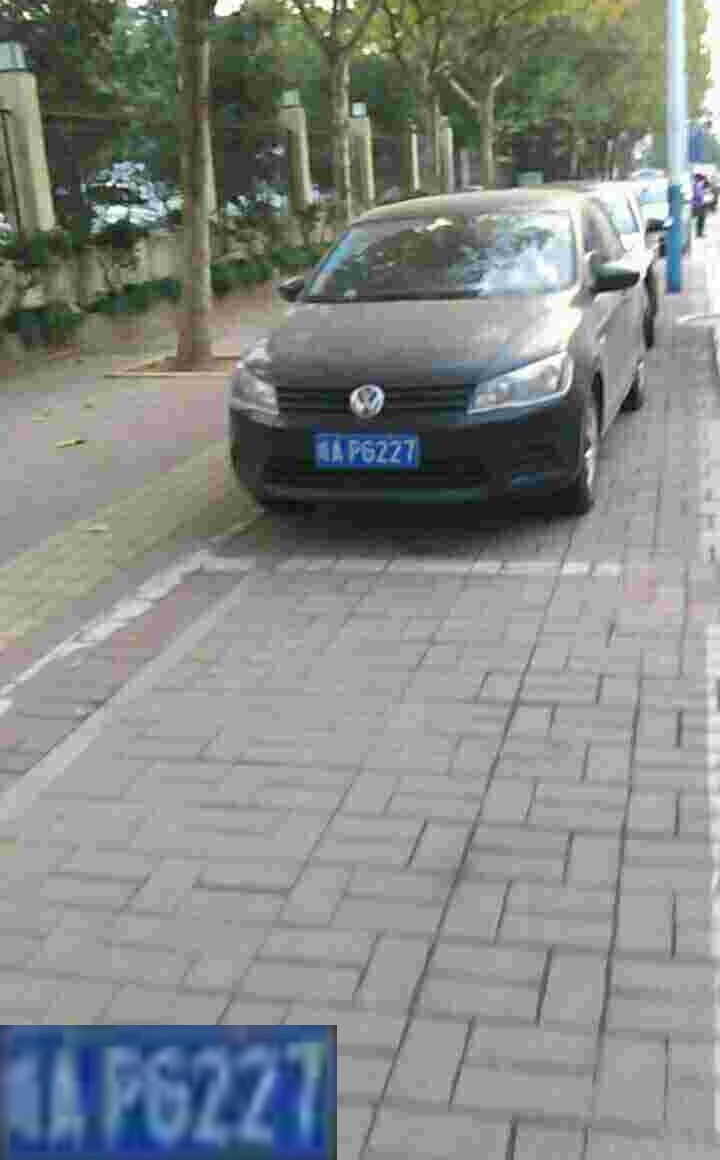
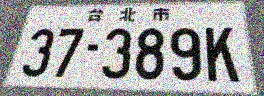
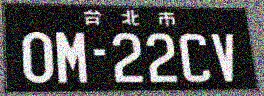
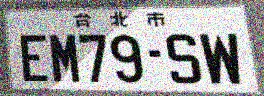
The problem with these split protocols is that they do not account for the same vehicle/LP appearing in multiple images, including images from different subsets, as shown in Fig. 2 and Fig. 3. While one may claim that such images have enough variety to be used both for training and testing LP detectors, as they are fed the entire images, not just the LP region, it seems reasonable to consider that such images should not be employed in the same way (i.e., for both training and testing) in the recognition stage, as the LPs look very similar after being cropped and rectified. In fact, they can look very similar even without rectification (e.g., see (d) and (e) in Fig. 2).

[][Subset Base]
[][Subset Base]
[][Subset Base]
[][Subset Base]
[][Subset Challenge]
[][Subset Challenge]
[][Subset Weather]

[][Subset Weather]
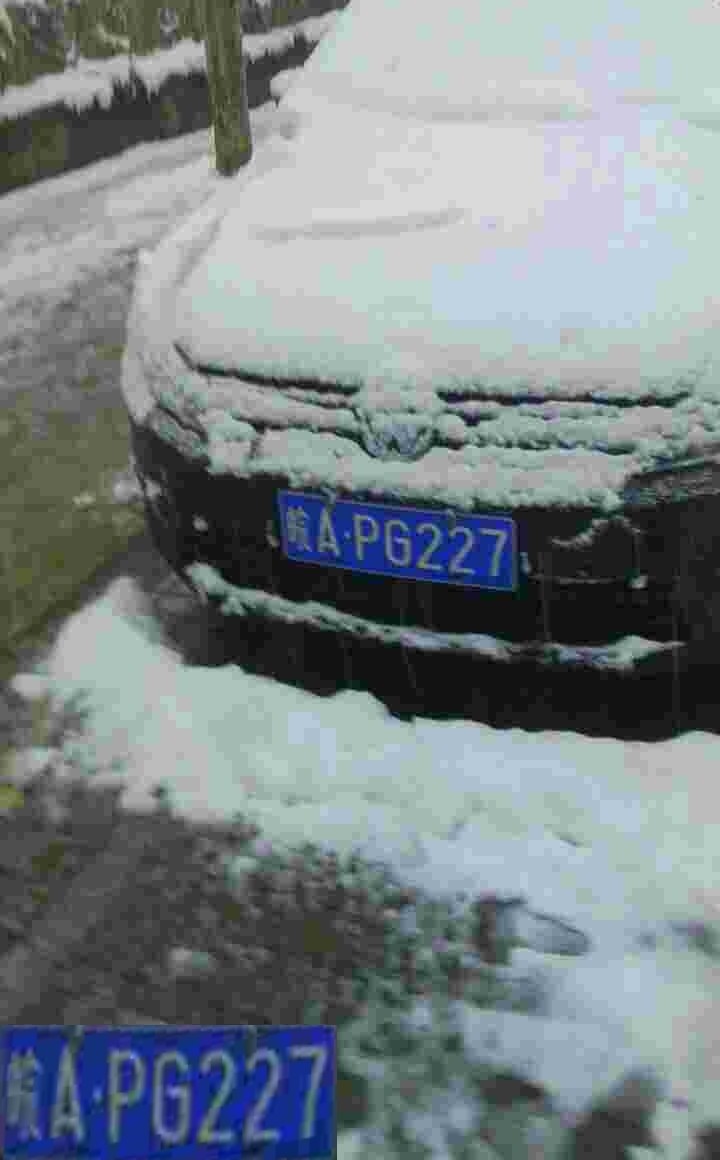
Fig. 1 shows some examples of near-duplicates from the AOLP and CCPD datasets, where we picked the th, th, and th percentile image pair for each dataset, according to their Euclidean distance in pixel space. We found that this metric works reasonably well for this purpose, as images containing the same vehicle are already filtered by the LP text.
In the AOLP dataset, considering the AOLP-A split protocol333 We replicated the division made in [25, 6] of the dataset’s images into training, validation and test sets using the split files provided by the authors., there are duplicates from the test set in the training one. As there are test images in this protocol, 46.9% of them have duplicates. Startlingly, the number of duplicates is even higher in the AOLP-B split protocol, where of the test images (67.6%) have duplicates in the training set.
The situation is less severe – albeit still concerning – for the CCPD dataset, where we found duplicates from the test set in the training set. Despite the much higher number of duplicates in absolute terms, CCPD’s current version has K images with labeled LPs in the test set; that is, the duplicates amount to 19.1% of the test images.
III Experiments
This section presents the experiments conducted for this work. We first describe the duplicate-free splits we propose for the AOLP and CCPD datasets. Then, we provide a list of the OCR models explored in our assessments, detailing the framework used to implement them as well as relevant hyperparameters. Afterward, we briefly describe the process of creating synthetic images to avoid overfitting in training the models. Finally, we report and discuss the results obtained.
III-A Duplicate-Free Splits for the AOLP and CCPD Datasets
As the AOLP and CCPD datasets do not have data scraped from the internet (as CIFAR-10 and CIFAR-100 do, for example), we cannot replace the duplicates with new images due to the risk of selection bias or domain shift [30, 31, 19, 32]. Therefore, we present fair splits for each dataset where there are no duplicates of the test images in the training set. As detailed next, we attempted to preserve the key characteristics of the original splits in the new ones as much as possible.
The AOLP-Fair-A split was created as follows. Following previous works [26, 25, 28], we randomly divided the images of the AOLP dataset into training and test sets with a : ratio. Nevertheless, we ensured that distinct images showing the same vehicle/LP (as those shown in Fig. 2) were all in the same set. Afterward, we allocated % of the training images for validation. In this way, the AOLP-A (adopted in previous works) and AOLP-Fair-A protocols have the same number of images for training, testing and validation.
The core idea of the AOLP-B protocol is to train the approaches on the AC and LE subsets and test them on the RP subset [15, 16, 29]. Thus, we created the AOLP-Fair-B protocol in the following way. We kept the original training and validation sets and removed the duplicates from the test set; otherwise, one could ask whether a potential drop in recognition rate is solely due to the reduction in the number of training examples available [19]. In other words, the test sets for the AOLP-B and AOLP-B-Fair splits are different, with the AOLP-B-Fair’s test set being a duplicate-free subset of the AOLP-B’s test set. However, the training and validation sets are exactly the same in both splits.
As mentioned in Section II-A, CCPD’s standard split randomly divides the K images of the Base subset into training (K) and validation (K) sets. All images from the other subsets are used for testing (except Green, which was introduced later and has its own split). In order to maintain such distribution, we created the CCPD-Fair split as follows. The Base subset was divided into training and validation sets with K images each, as in the original split. Nevertheless, instead of making this division completely random, we made the training set free of duplicates by allocating all duplicates to the validation set444 We trained the OCR models with and without duplicates in CCPD-Fair’s validation set, which is used for early stopping and choosing the best weights. As the results achieved in the test set were essentially the same, we kept the same number of validation images (K-K) as in the original division. . Similarly, we followed the original split for the Green subset as closely as possible, just reallocating the duplicates from the training set to the validation set. The test set has not changed. In essence, the original and CCPD-Fair splits use the same K images for testing but have different images in the training and validation sets (each with K images – about K from Base and K from Green).
III-B OCR models
In this work, we explore six deep learning-based OCR models widely adopted in the literature [33, 34, 6]. Three of them are multi-task networks proposed specifically for LPR: CNNG [15], Holistic-CNN [35] and Multi-Task [36], while the other three are Connectionist Temporal Classification (CTC)-, attention- and Transformer-based networks originally proposed for scene text recognition: STAR-Net [37], TRBA [38] and ViTSTR-Base [39], respectively.
Following [36, 40, 6], we implemented the multi-task models using Keras (TensorFlow backend). For the models originally proposed for scene text recognition, following [34, 39, 6], we used a fork555 https://github.com/roatienza/deep-text-recognition-benchmark/ (PyTorch) of the repository used to record the first place of ICDAR2013 focused scene text and ICDAR2019 ArT and third place of ICDAR2017 COCO-Text and ICDAR2019 ReCTS (task1) [38].
Here we list the hyperparameters used in each framework for training the OCR models. These hyperparameters were determined through experiments on the validation set. In Keras, we used the Adam optimizer, initial learning rate = - (with ReduceLROnPlateau’s patience = and factor = -), batch size = , max epochs = , and patience = . Patience refers to the number of epochs with no improvement, after which decay is applied or training is stopped. In PyTorch, we adopted the following parameters: Adadelta optimizer, whose decay rate is set to , K iterations, and batch size = . All experiments were performed on a computer with an AMD Ryzen Threadripper X GHz CPU, GB of RAM, and an NVIDIA Quadro RTX GPU ( GB).
III-C Data Augmentation
It is well-known that (i) LPR datasets usually have a significant imbalance in terms of character classes as a result of LP assignment policies [36, 25, 15] and (ii) OCR models are prone to memorize patterns seen in the training stage [41, 42, 6]; this phenomenon was termed vocabulary reliance in [43]. To prevent overfitting, we generated many synthetic LP images to improve the training of the recognition models.
We created the synthetic LP images as follows. First, we obtained blank templates that matched the aspect ratio and color scheme of real LPs from the internet. Then, we superimposed a sequence of characters – that, although random, mimics the patterns seen on real LPs – on each template. Lastly, we applied various transformations to the LP images to increase variability. Transformations applied include, but are not limited to, random perspective transform, random noise, random shadows, and random perturbations of hue, saturation and brightness (note that these same transformations were also applied to real training images as a form of data augmentation). Examples of synthetic LP images generated in this way can be seen in Fig. 4.

III-D Results
Here, we report the recognition rates reached by the OCR models in each dataset under the original and fair splits666 We reinforce that all results reported in this work (Table I to IV) are from our experiments (i.e., we trained all OCR models following precisely the same protocol in each set of experiments) and not replicated from the cited papers.. Recognition rate refers to the number of correctly recognized LPs divided by the number of LPs in the test set [25, 17, 5]. Following [19], in addition to the recognition rates obtained in the original and fair protocols, we report their differences in terms of absolute percentage points (“Gap”) and in relation to the original error (“Rel. Gap”) .
The results of all OCR models on the AOLP dataset are shown in Table I and Table II. In both protocols (AOLP-A and AOLP-B), the recognition rates obtained in the fair split were considerably lower than those achieved in the original one. Specifically, the error rates were more than twice as high in the experiments conducted under the fair protocols.
It is crucial to note that the ranking of OCR models changed when they were trained and tested under fair splits. For example, the CNNG model achieved the best result under the AOLP-B protocol (as in [15], where it was proposed) but only reached the third-best result under AOLP-Fair-B. Similarly, the ViTSTR-Base model ranked third under the AOLP-A protocol but tied for first place with TRBA under AOLP-Fair-A.
These results strongly suggest that, in the past, the high fraction of near-duplicates in the splits traditionally adopted in the literature for the AOLP dataset may have prevented the publication and adoption of more efficient LPR models that can generalize as well as other models but fail to memorize duplicates. A similar concern was raised by Barz et al. [19] with respect to the CIFAR-10 and CIFAR-100 datasets.
Table III shows the results for the CCPD dataset. Table IV breaks down the results for each of the CCPD’s subsets, as is commonly done in the literature [2, 7, 5]. While the largest drop in recognition rate was % in the AOLP dataset, the STAR-Net and TRBA models had drops of % and % in recognition rate under the CCPD-Fair protocol, respectively. The average recognition rate decreased from % to %, with the relative gaps being much smaller than those observed in the AOLP dataset because the recognition rates reached in CCPD were not as high (this was expected, as the authors of the CCPD dataset modified it twice with the specific purpose of making it much more challenging than it was initially).
Examining the absolute number of errors may give a clearer understanding of the impact of duplicates on the evaluation of the recognition models. The lowest performance gap of % translates to + additional LPs being misrecognized under the fair split (vs. the standard one), while the highest performance gap of % represents a staggering number of + more LPs being incorrectly recognized under the fair split.
Differently from the results obtained in the AOLP dataset, the ranking of models remained practically the same in CCPD; only the fourth and fifth places switched positions. This is partially due to the significant performance gap between the models and suggests that the community’s research efforts have not yet overfitted to the presence of duplicates in the standard split of the CCPD dataset. However, we fundamentally believe it is only a matter of time before this starts to happen or be noticed (potentially with the use of deeper models, as the ability to memorize training data increases with the model’s capacity [19, 23]) in case such near-duplicates in the training and test sets are not acknowledged and therefore avoided.
IV What about other datasets?
As mentioned earlier, we focused our analysis on the AOLP and CCPD datasets due to their predominance in the ALPR literature [26, 44, 27, 28, 14]. Nevertheless, as this issue (i.e., LPR models being evaluated in datasets containing near-duplicates in the training and test sets) has not yet received due attention from the community, it has recurred in assessments carried out on several other public datasets.
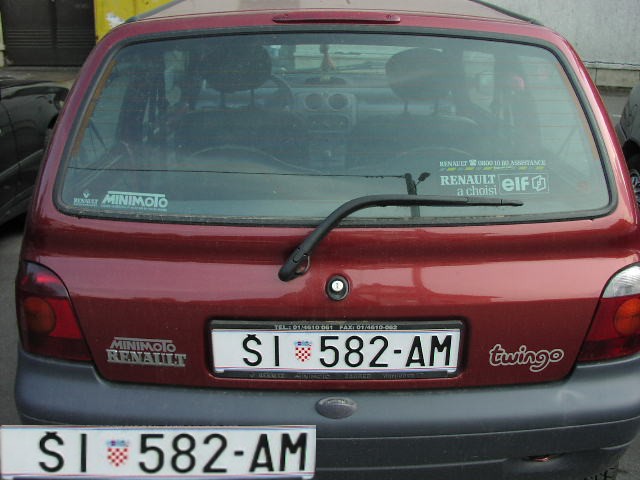
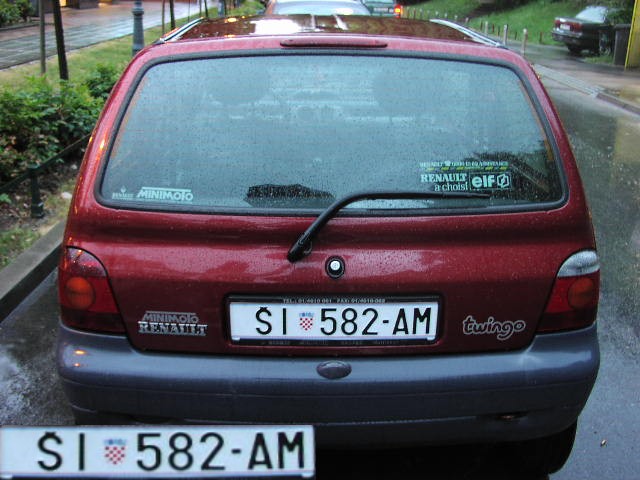
Consider the EnglishLP [45], Medialab LPR [46] and PKU [47] datasets as examples (they are quite popular, albeit far less than AOLP and CCPD). They all have near-duplicates, as shown in Fig. 5. As these datasets lack an official evaluation protocol, it is common for authors to divide their images into training, validation and test sets randomly [3, 48, 49, 25, 9, 16]. As can be inferred, the presence of near-duplicates in these datasets has also been overlooked in such setups.

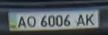
The ReId dataset [35] differs from the datasets mentioned above by having a standard protocol. It has images of cropped low-resolution LPs, of which are in the training set and are in the test set. We found that (68.6%) of the test images have near-duplicates in the training set (see some examples in Fig. 6). Although alarming, the high fraction of duplicates has gone unacknowledged in works using the ReId dataset for experimentation [50, 51, 52].


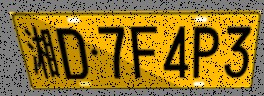
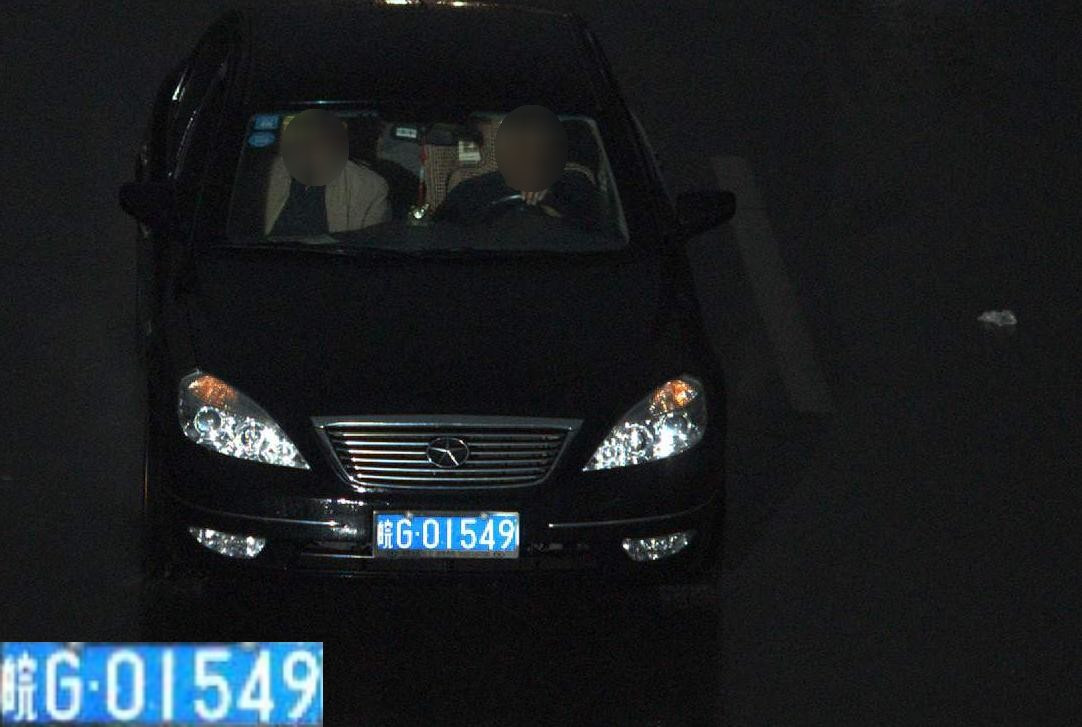
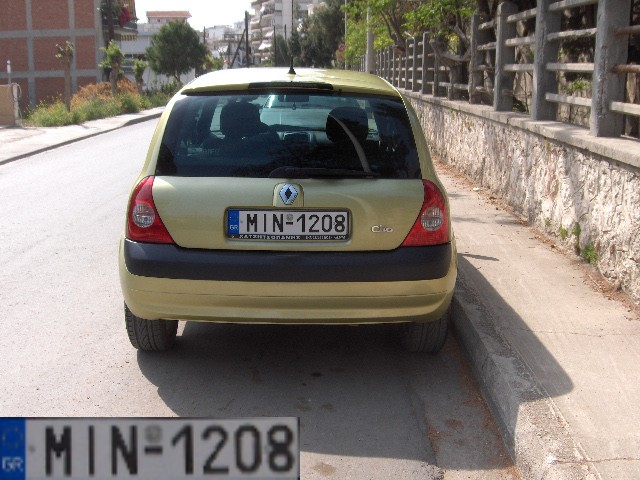
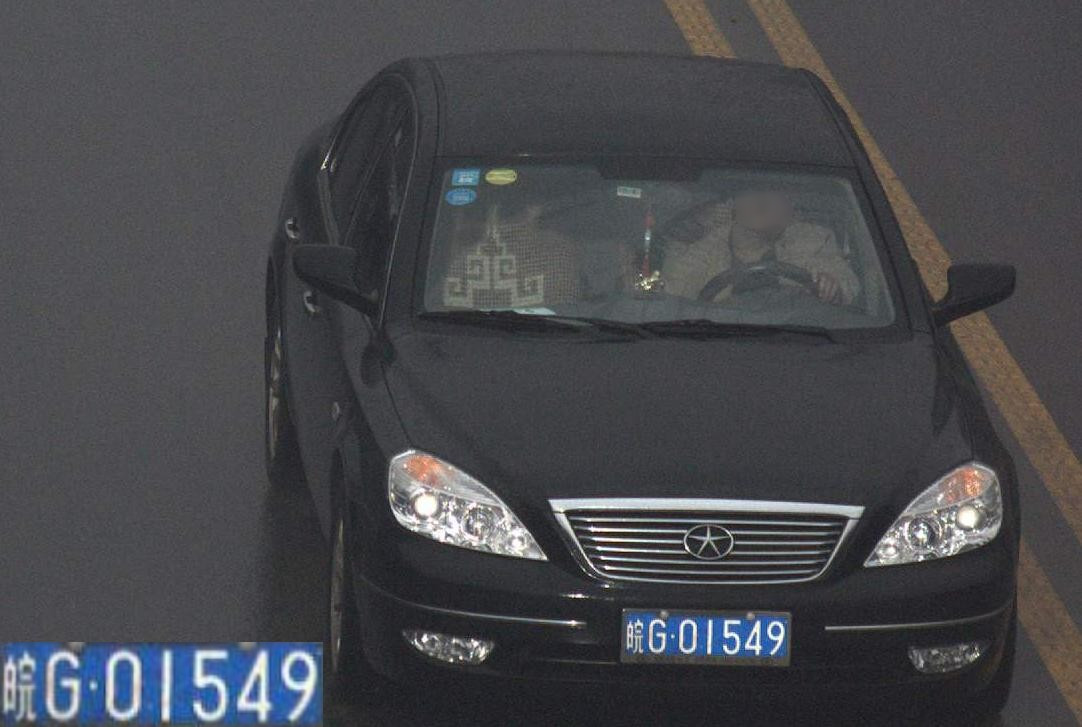
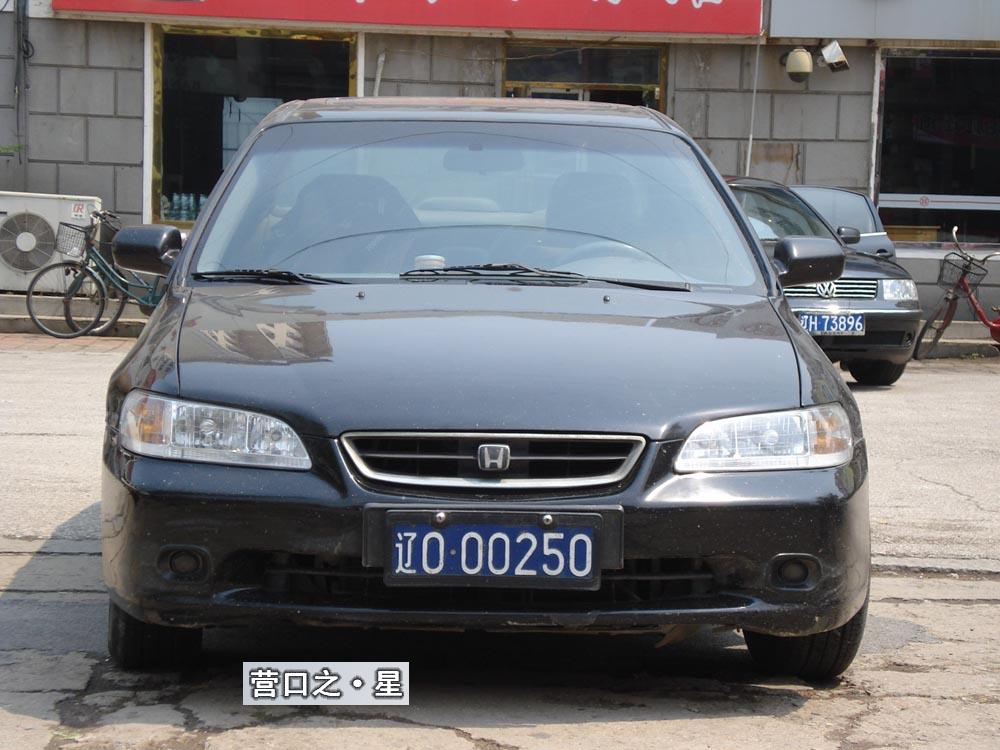
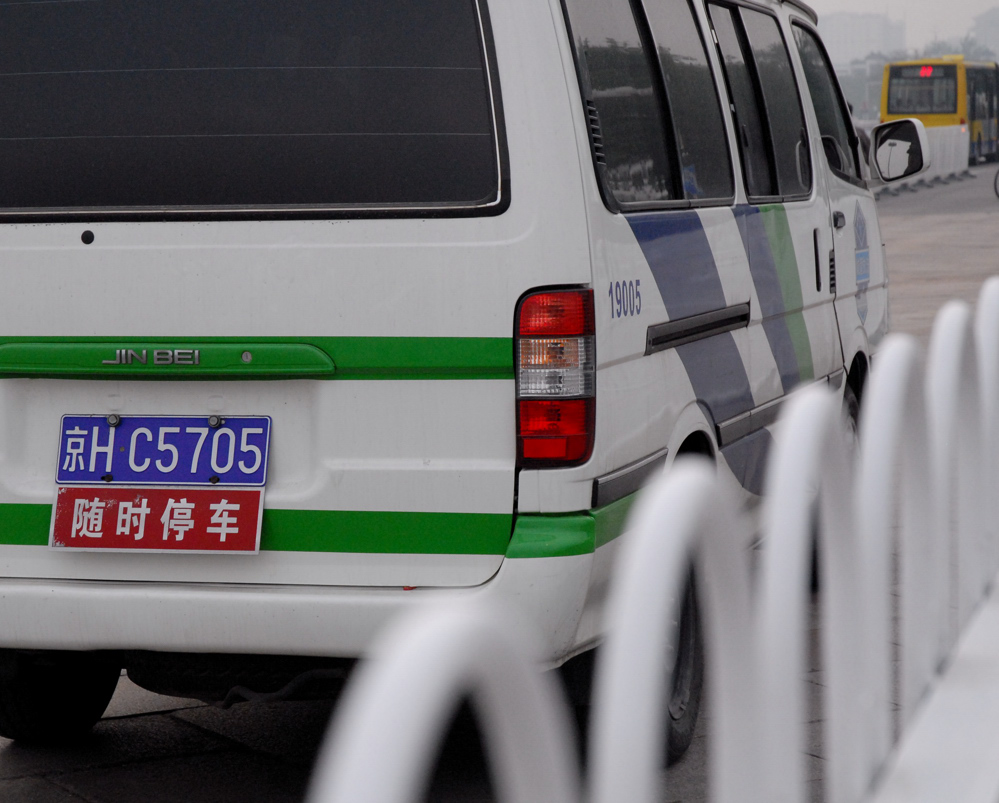
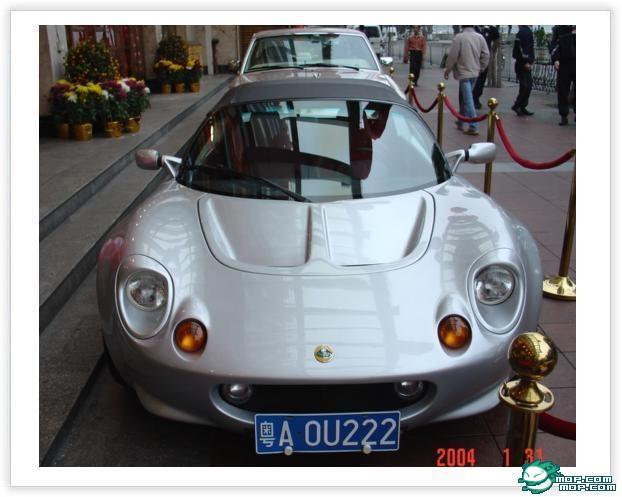
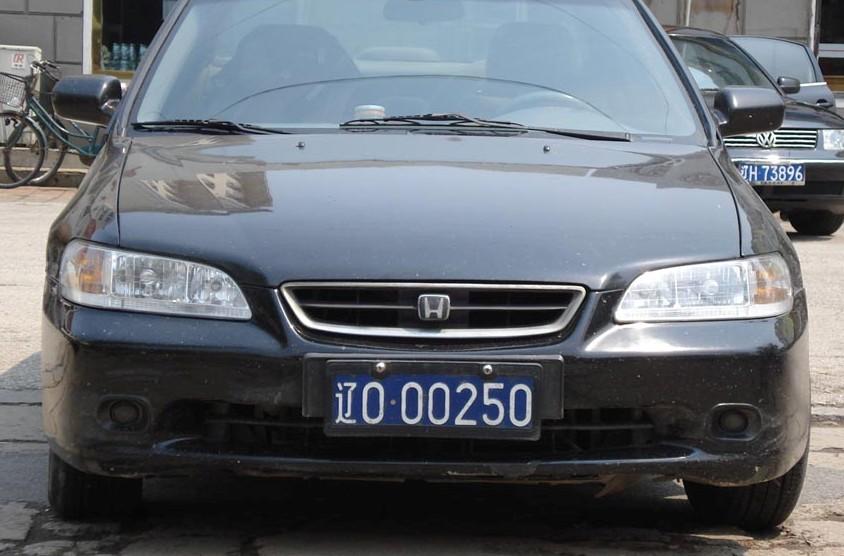
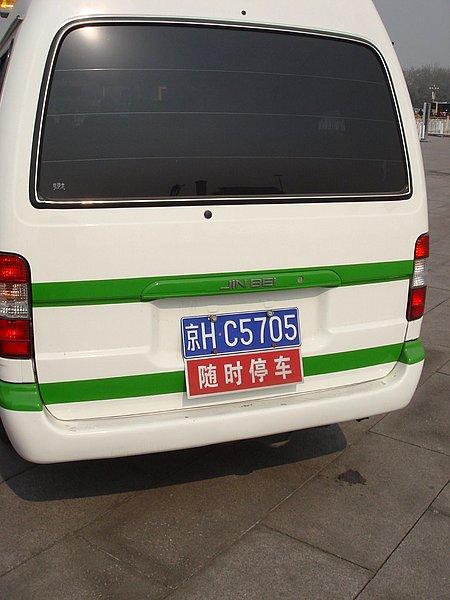
We also want to draw attention to the fact that there are duplicates even across different datasets. Recently, Zhang et al. [7] released the CLPD dataset, which comprises images gathered from multiple sources such as the internet, mobile phones, and car driving recorders. The authors employed all images for testing to verify the practicality of their LPD and LPR models, trained on other datasets. Subsequent studies have followed this protocol [54, 8, 9, 15, 5]. The problem is that several vehicles/LPs shown in CLPD are also shown in the ChineseLP dataset [55] (see Fig. 7). That is, if not yet, images from the ChineseLP dataset will eventually be used to train ALPR systems that will then be tested on the CLPD dataset. These experiments will likely be regarded as “cross-dataset,” although perhaps they should not.
One last example that reinforces how this issue has gone unnoticed in the literature is [56], where the authors presented a detailed comparison between multiple datasets gathered in mainland China – including ChineseLP and CLPD – without noticing the existence of duplicates across them.
It is essential to acknowledge that there are datasets, albeit very few, where the authors deliberately defined a standard split with no duplicates within the training and test sets. We verified that RodoSol-ALPR [6] is one such dataset.
V Conclusions
We drew attention to the large fraction of near-duplicates in the training and test sets of datasets widely adopted in ALPR research. Both the existence of such duplicates and their influence on the performance evaluation of LPR models have largely gone unnoticed in the literature.
Our experiments on the AOLP and CCPD datasets, the most commonly used in the field, showed that the presence of near-duplicates significantly impacts the performance evaluation of OCR models applied to LPR. In the AOLP dataset, the error rates reported by the models were more than twice as high in the experiments conducted under the fair splits. The ranking of models also changed when they were trained and tested under duplicate-free splits. In the more challenging CCPD dataset, the models showed recognition rate drops of up to %. Specifically, the average recognition rate decreased from % to % when the experiments were conducted under the fair split compared to the standard one. These results indicate that duplicates have biased the evaluation and development of deep learning-based models for LPR.
We created the fair splits for the abovementioned datasets by dividing their images into new training, validation and test sets while ensuring that no duplicates from the test set are present in the training set and preserving the original splits’ key characteristics as much as possible. These new splits and the list of duplicates found are publicly available.
We hope this work will encourage LPR researchers to train and evaluate their models using the fair splits we created for the AOLP and CCPD datasets and to beware of duplicates when performing experiments on other datasets. This work also provides researchers with a clearer understanding of the true capabilities of LPR models that have only been evaluated on test sets that include duplicates from the training set.
Further examination of the occurrences of near-duplicates in other ALPR datasets, including those mentioned in Section IV, will be conducted in future research.
ACKNOWLEDGMENTS
This work was partly supported by the Coordination for the Improvement of Higher Education Personnel (CAPES) (Programa de Cooperação Acadêmica em Segurança Pública e Ciências Forenses # 88881.516265/2020-01), and partly by the National Council for Scientific and Technological Development (CNPq) (# 308879/2020-1 and # 306878/2022-4). We thank the support of NVIDIA Corporation with the donation of the Quadro RTX GPU used for this research.
References
- [1] G. S. Hsu, J. C. Chen, and Y. Z. Chung, “Application-oriented license plate recognition,” IEEE Transactions on Vehicular Technology, vol. 62, no. 2, pp. 552–561, 2013.
- [2] Z. Xu et al., “Towards end-to-end license plate detection and recognition: A large dataset and baseline,” in European Conference on Computer Vision (ECCV), 2018, pp. 261–277.
- [3] J. Zhuang et al., “Towards human-level license plate recognition,” in European Conference on Computer Vision (ECCV), 2018, pp. 314–329.
- [4] W. Weihong and T. Jiaoyang, “Research on license plate recognition algorithms based on deep learning in complex environment,” IEEE Access, vol. 8, pp. 91 661–91 675, 2020.
- [5] Y. Wang et al., “Rethinking and designing a high-performing automatic license plate recognition approach,” IEEE Transactions on Intelligent Transportation Systems, vol. 23, no. 7, pp. 8868–8880, 2022.
- [6] R. Laroca, E. V. Cardoso, D. R. Lucio, V. Estevam, and D. Menotti, “On the cross-dataset generalization in license plate recognition,” in International Conference on Computer Vision Theory and Applications (VISAPP), Feb 2022, pp. 166–178.
- [7] L. Zhang et al., “A robust attentional framework for license plate recognition in the wild,” IEEE Transactions on Intelligent Transportation Systems, vol. 22, no. 11, pp. 6967–6976, 2021.
- [8] Q. Liu, S.-L. Chen, Z.-J. Li, C. Yang, F. Chen, and X.-C. Yin, “Fast recognition for multidirectional and multi-type license plates with 2D spatial attention,” in International Conference on Document Analysis and Recognition (ICDAR), 2021, pp. 125–139.
- [9] Y. Zhang, Z. Wang, and J. Zhuang, “Efficient license plate recognition via holistic position attention,” in AAAI Conference on Artificial Intelligence, May 2021, pp. 3438–3446.
- [10] V. Nascimento et al., “Combining attention module and pixel shuffle for license plate super-resolution,” in Conference on Graphics, Patterns and Images (SIBGRAPI), Oct 2022, pp. 228–233.
- [11] G. S. Hsu, A. Ambikapathi, S. L. Chung, and C. P. Su, “Robust license plate detection in the wild,” in IEEE International Conference on Advanced Video and Signal Based Surveillance, Aug 2017, pp. 1–6.
- [12] R. Laroca, E. Severo, L. A. Zanlorensi, L. S. Oliveira, G. R. Gonçalves, W. R. Schwartz, and D. Menotti, “A robust real-time automatic license plate recognition based on the YOLO detector,” in International Joint Conference on Neural Networks (IJCNN), July 2018, pp. 1–10.
- [13] M. Zhang, W. Liu, and H. Ma, “Joint license plate super-resolution and recognition in one multi-task GAN framework,” in IEEE International Conference on Acoustics, Speech and Signal Processing (ICASSP), April 2018, pp. 1443–1447.
- [14] T.-A. Pham, “Effective deep neural networks for license plate detection and recognition,” The Visual Computer, 2022.
- [15] X. Fan and W. Zhao, “Improving robustness of license plates automatic recognition in natural scenes,” IEEE Transactions on Intelligent Transportation Systems, vol. 23, no. 10, pp. 18 845–18 854, 2022.
- [16] S. Qin and S. Liu, “Towards end-to-end car license plate location and recognition in unconstrained scenarios,” Neural Computing and Applications, vol. 34, p. 21551–21566, 2022.
- [17] S. M. Silva and C. R. Jung, “A flexible approach for automatic license plate recognition in unconstrained scenarios,” IEEE Transactions on Intelligent Transportation Systems, vol. 23, no. 6, pp. 5693–5703, 2022.
- [18] H. Xu, X.-D. Zhou, Z. Li, L. Liu, C. Li, and Y. Shi, “EILPR: Toward end-to-end irregular license plate recognition based on automatic perspective alignment,” IEEE Transactions on Intelligent Transportation Systems, vol. 23, no. 3, pp. 2586–2595, 2022.
- [19] B. Barz and J. Denzler, “Do we train on test data? Purging CIFAR of near-duplicates,” Journal of Imaging, vol. 6, no. 6, p. 41, 2020.
- [20] A. Emami, K. Suleman, A. Trischler, and J. C. K. Cheung, “An analysis of dataset overlap on Winograd-style tasks,” in International Conference on Computational Linguistics, Dec 2020, pp. 5855–5865.
- [21] V. Feldman and C. Zhang, “What neural networks memorize and why: Discovering the long tail via influence estimation,” in International Conference on Neural Information Processing Systems (NeurIPS), vol. 33, 2020, pp. 2881–2891.
- [22] T. Liao, R. Taori, I. D. Raji, and L. Schmidt, “Are we learning yet? a meta review of evaluation failures across machine learning,” in International Conference on Neural Information Processing Systems (NeurIPS). Datasets and Benchmarks Track, 2021, pp. 1–10.
- [23] S. Hooker, N. Moorosi, G. Clark, S. Bengio, and E. Denton, “Characterising bias in compressed models,” arXiv preprint, vol. arXiv:2010.03058, pp. 1–13, 2020, Google Research.
- [24] H. Li, P. Wang, and C. Shen, “Toward end-to-end car license plate detection and recognition with deep neural networks,” IEEE Transactions on Intelligent Transportation Systems, vol. 20, pp. 1126–1136, 2019.
- [25] R. Laroca, L. A. Zanlorensi, G. R. Gonçalves, E. Todt, W. R. Schwartz, and D. Menotti, “An efficient and layout-independent automatic license plate recognition system based on the YOLO detector,” IET Intelligent Transport Systems, vol. 15, no. 4, pp. 483–503, 2021.
- [26] L. Xie et al., “A new CNN-based method for multi-directional car license plate detection,” IEEE Transactions on Intelligent Transportation Systems, vol. 19, no. 2, pp. 507–517, 2018.
- [27] S. Zhang et al., “Robust license plate recognition with shared adversarial training network,” IEEE Access, vol. 8, pp. 697–705, 2020.
- [28] J. Liang, G. Chen, Y. Wang, and H. Qin, “EGSANet: edge–guided sparse attention network for improving license plate detection in the wild,” Applied Intelligence, vol. 52, no. 4, pp. 4458–4472, 2022.
- [29] H. Nguyen, “An efficient license plate detection approach using lightweight deep convolutional neural networks,” Advances in Multimedia, vol. 2022, p. 8852142, 2022.
- [30] A. Torralba and A. A. Efros, “Unbiased look at dataset bias,” in IEEE Conference on Computer Vision and Pattern Recognition (CVPR), 2011, pp. 1521–1528.
- [31] T. Tommasi, N. Patricia, B. Caputo, and T. Tuytelaars, “A deeper look at dataset bias,” in Domain Adaptation in Computer Vision Applications. Springer, 2017, pp. 37–55.
- [32] R. Laroca, M. Santos, V. Estevam, E. Luz, and D. Menotti, “A first look at dataset bias in license plate recognition,” in Conference on Graphics, Patterns and Images (SIBGRAPI), Oct 2022, pp. 234–239.
- [33] X. Xu, J. Chen, J. Xiao, L. Gao, F. Shen, and H. T. Shen, “What machines see is not what they get: Fooling scene text recognition models with adversarial text images,” in IEEE/CVF Conference on Computer Vision and Pattern Recognition (CVPR), 2020, pp. 12 301–12 311.
- [34] R. Atienza, “Data augmentation for scene text recognition,” in IEEE/CVF International Conference on Computer Vision Workshops (ICCVW), 2021, pp. 1561–1570.
- [35] J. Špaňhel, J. Sochor, R. Juránek, A. Herout, L. Maršík, and P. Zemčík, “Holistic recognition of low quality license plates by CNN using track annotated data,” in IEEE International Conference on Advanced Video and Signal Based Surveillance, Aug 2017, pp. 1–6.
- [36] G. R. Gonçalves et al., “Real-time automatic license plate recognition through deep multi-task networks,” in Conference on Graphics, Patterns and Images (SIBGRAPI), Oct 2018, pp. 110–117.
- [37] W. Liu, C. Chen, Z. S. Kwan-Yee K. Wong, and J. Han, “STAR-Net: A spatial attention residue network for scene text recognition,” in British Machine Vision Conference (BMVC), Sept 2016, pp. 1–13.
- [38] J. Baek, G. Kim, J. Lee, S. Park, D. Han, S. Yun, S. J. Oh, and H. Lee, “What is wrong with scene text recognition model comparisons? Dataset and model analysis,” in IEEE/CVF International Conference on Computer Vision (ICCV), 2019, pp. 4714–4722.
- [39] R. Atienza, “Vision transformer for fast and efficient scene text recognition,” in International Conference on Document Analysis and Recognition (ICDAR), 2021, pp. 319–334.
- [40] G. R. Gonçalves et al., “Multi-task learning for low-resolution license plate recognition,” in Iberoamerican Congress on Pattern Recognition (CIARP), Oct 2019, pp. 251–261.
- [41] L. F. Zeni and C. Jung, “Weakly supervised character detection for license plate recognition,” in Conference on Graphics, Patterns and Images (SIBGRAPI), 2020, pp. 218–225.
- [42] S. Garcia-Bordils, A. Mafla, A. F. Biten, O. Nuriel, A. Aberdam, S. Mazor, R. Litman, and D. Karatzas, “Out-of-vocabulary challenge report,” in European Conference on Computer Vision (ECCV), TiE: Text in Everything Workshop, 2022, pp. 1–17.
- [43] Z. Wan, J. Zhang, L. Zhang, J. Luo, and C. Yao, “On vocabulary reliance in scene text recognition,” in IEEE/CVF Conference on Computer Vision and Pattern Recognition (CVPR), 2020, pp. 11 422–11 431.
- [44] S. Qin and S. Liu, “Efficient and unified license plate recognition via lightweight deep neural network,” IET Image Processing, vol. 14, no. 16, pp. 4102–4109, 2020.
- [45] V. Srebrić, “EnglishLP database,” https://www.zemris.fer.hr/projects/LicensePlates/english/baza_slika.zip, 2003.
- [46] C. N. E. Anagnostopoulos, I. E. Anagnostopoulos, I. D. Psoroulas, V. Loumos, and E. Kayafas, “License plate recognition from still images and video sequences: A survey,” IEEE Transactions on Intelligent Transportation Systems, vol. 9, no. 3, pp. 377–391, 2008.
- [47] Y. Yuan, W. Zou, Y. Zhao, X. Wang, X. Hu, and N. Komodakis, “A robust and efficient approach to license plate detection,” IEEE Transactions on Image Processing, vol. 26, no. 3, pp. 1102–1114, 2017.
- [48] F. Gao, Y. Cai, Y. Ge, and S. Lu, “EDF-LPR: a new encoder-decoder framework for license plate recognition,” IET Intelligent Transport Systems, vol. 14, no. 8, pp. 959–969, 2020.
- [49] K. Khan, A. Imran, H. Z. U. Rehman, A. Fazil, M. Zakwan, and Z. Mahmood, “Performance enhancement method for multiple license plate recognition in challenging environments,” EURASIP Journal on Image and Video Processing, vol. 2021, no. 1, p. 30, 2021.
- [50] J. Špaňhel, J. Sochor, R. Juránek, and A. Herout, “Geometric alignment by deep learning for recognition of challenging license plates,” in IEEE International Conference on Intelligent Transportation Systems (ITSC), Nov 2018, pp. 3524–3529.
- [51] S. Wu, W. Zhai, and Y. Cao, “PixTextGAN: structure aware text image synthesis for license plate recognition,” IET Image Processing, vol. 13, no. 14, pp. 2744–2752, 2019.
- [52] D. Moussa et al., “Forensic license plate recognition with compression-informed transformers,” in IEEE International Conference on Image Processing (ICIP), Oct 2022, pp. 406–410.
- [53] C. Henry, S. Y. Ahn, and S. Lee, “Multinational license plate recognition using generalized character sequence detection,” IEEE Access, vol. 8, pp. 35 185–35 199, 2020.
- [54] Y. Zou, Y. Zhang, J. Yan, X. Jiang, T. Huang, H. Fan, and Z. Cui, “A robust license plate recognition model based on Bi-LSTM,” IEEE Access, vol. 8, pp. 211 630–211 641, 2020.
- [55] W. Zhou, H. Li, Y. Lu, and Q. Tian, “Principal visual word discovery for automatic license plate detection,” IEEE Transactions on Image Processing, vol. 21, no. 9, pp. 4269–4279, Sept 2012.
- [56] Y. Gong, L. Deng, S. Tao, X. Lu, P. Wu, Z. Xie, Z. Ma, and M. Xie, “Unified Chinese license plate detection and recognition with high efficiency,” Journal of Visual Communication and Image Representation, vol. 86, p. 103541, 2022.