Three-dimensional morphology of an ultrafine Al-Si eutectic produced via laser rapid solidification
Abstract
Al-Si alloys processed by laser rapid solidification yield eutectic microstructures with ultrafine and interconnected fibers. Such fibrous structures have long been thought to bear resemblance to those formed in impurity-doped alloys upon conventional casting. Here, we show that any similarity is purely superficial. By harnessing high-throughput characterization and computer vision techniques, we perform a three-dimensional analysis of the branching behavior of the ultrafine eutectic and compare it against an impurity-modified eutectic as well as a random fractal (as a benchmark). Differences in the branching statistics point to different microstructural origins of the impurity- and quench-modified eutectic. Our quantitative approach is not limited to the data presented here but can be used to extract abstract information from other volumetric datasets, without customization.
keywords:
Rapid solidification , Laser surface remelting , 3D microstructure , eutecticAl-Si eutectic alloys are widely used as structural materials in automotive and aerospace applications due to their high strength-to-weight ratio and excellent castability [1]. Their mechanical properties such as tensile strength and ductility can be further improved by avoiding the formation of coarse, brittle Si flakes during solidification [2, 3, 4, 5]. This is accomplished via impurity-modification, in which the introduction of a few hundred ppm Na or Sr leads to a refinement of the Si into a fibrous structure on the order of micrometers [6, 7]. On the other hand, rapid solidification alone gives rise to a microstructural refinement [8, 9, 10, 11, 12]: for example, laser surface remelting creates rapid cooling conditions (as high as 1010 K/s [13]) to refine the microscale flakes to nanoscale fibers [14, 15, 16, 17]. Such a quench-modification is promoted above a critical solidification front velocity [18, 19]. In this context, the term “modification” indicates a dramatic alteration in the morphology of Si that is produced by eutectic solidification.
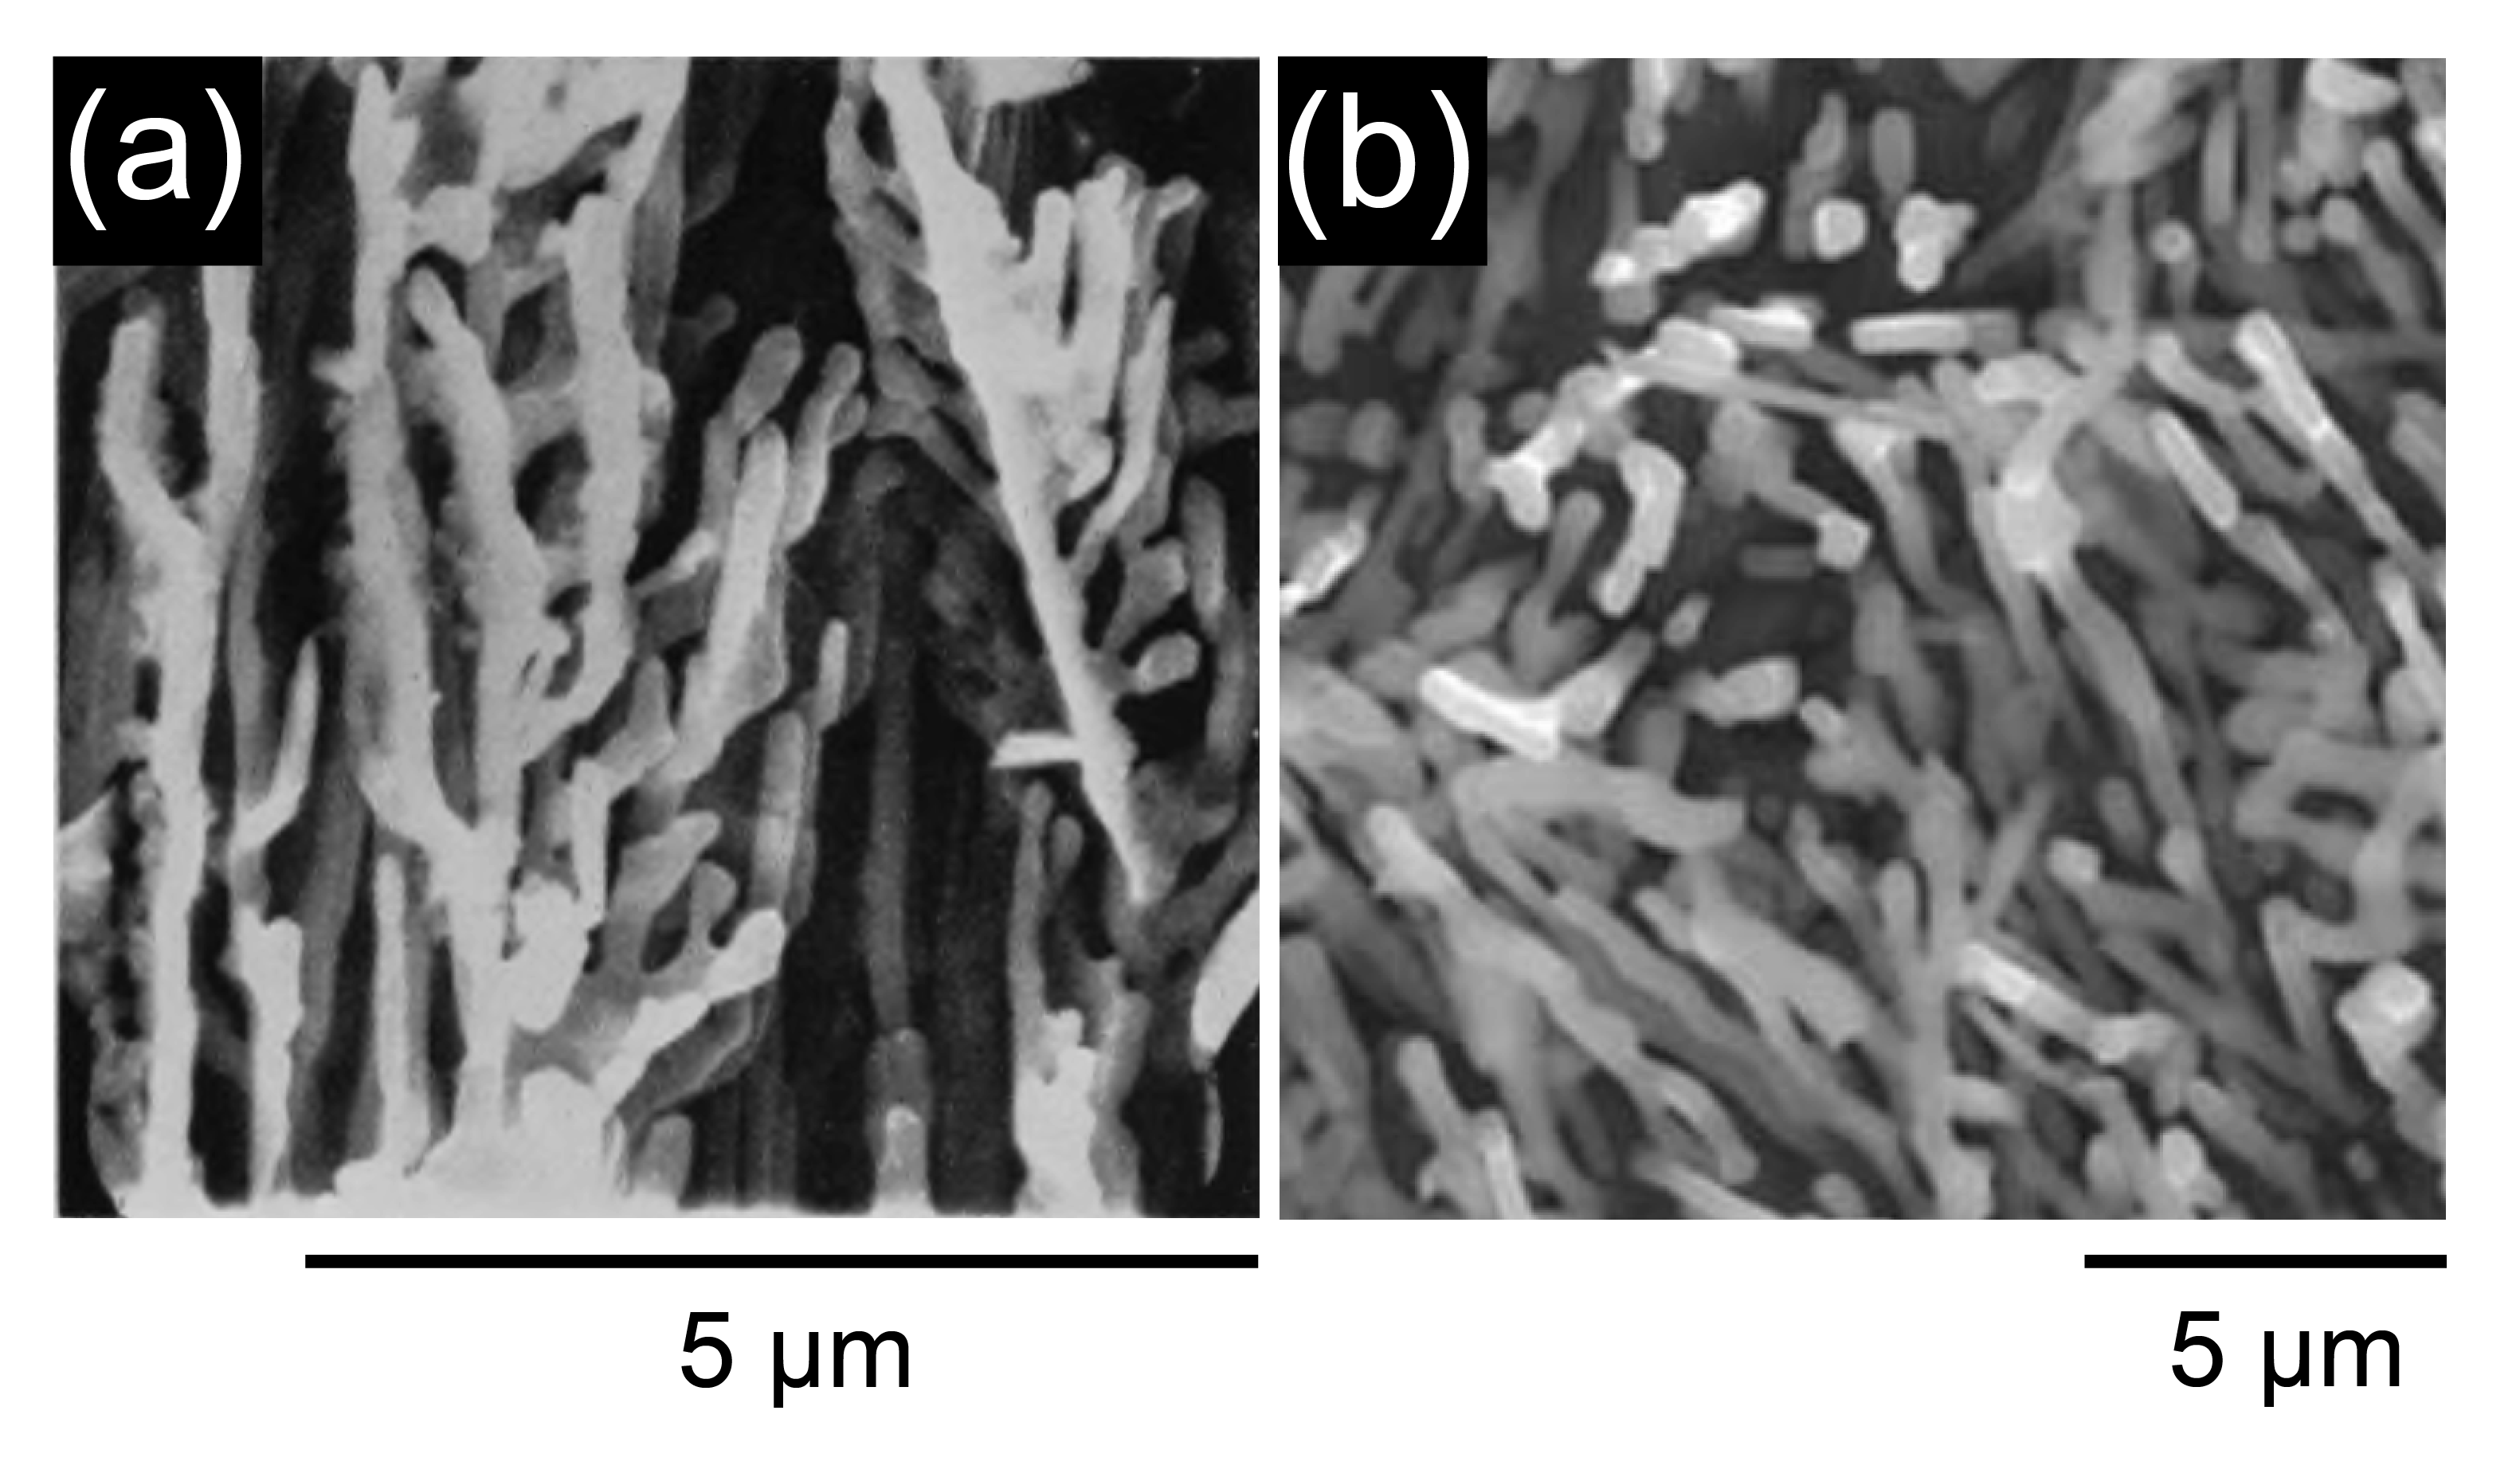
It has generally been assumed by some authors [18, 20, 21, 22, 23] that the two routes of modification lead to the same end-product (namely, fibers of Si in a matrix of Al). Yet this assumption has never been formally tested. Two-dimensional (2D) images of fibrous Si (see Fig. S1 for an example) may present similar features (e.g., aspect ratios [19]), but the morphology and topology of the Si phase may be distinct in three-dimensions (3D). Importantly, Requena and coworkers [24, 25] have found that the load-carrying capacity of Al-Si alloys depends on the internal 3D architecture, i.e., the connectivity of the eutectic Si phase. Only recently is it possible to obtain a detailed characterization and quantitative, comparative analysis of these structures at the nanometric level, due to advances in high resolution and high throughput 3D imaging and development of novel data-driven microstructure analysis tools. Computer vision provides an opportunity to construct rich 3D microstructural fingerprints [26], which can be analyzed and compared for the two mentioned processing routes, and without significant assumption or human intervention.
Here, we leverage the above capabilities to quantify the 3D morphology of ultra-fine Si formed by laser quench-modification [15] and compare to () Si formed by impurity-modification in directional solidification (previously characterized in [26]) and to () a random fractal simulated via diffusion limited aggregation (DLA). The laser remelted alloy was of composition Al-20wt%Si, cast from Al (99.99%) and Si (99.99%), see Ref. [15] for additional details. The reason we selected a hyper-eutectic alloy for our quench experiment was to ensure that we remain within the (skewed) coupled zone of Al-Si [14], at the relatively high velocities associated with laser rapid solidification. In case (), the directionally solidified Al-7wt%Si alloy contains 150 ppm of Sr [26] (i.e., above the concentration threshold for Sr modification [27]) and indeed it shows typical impurity-modified morphological characteristics and the basic parameters listed in Table 1. Our analysis of the branching behavior333The branched structures presented herein resemble at first glance a dendritic morphology, but note they are much smaller than the primary Si dendrites observed in, e.g., Ref. [28]. offers insight into their morphological differences and formation mechanisms.
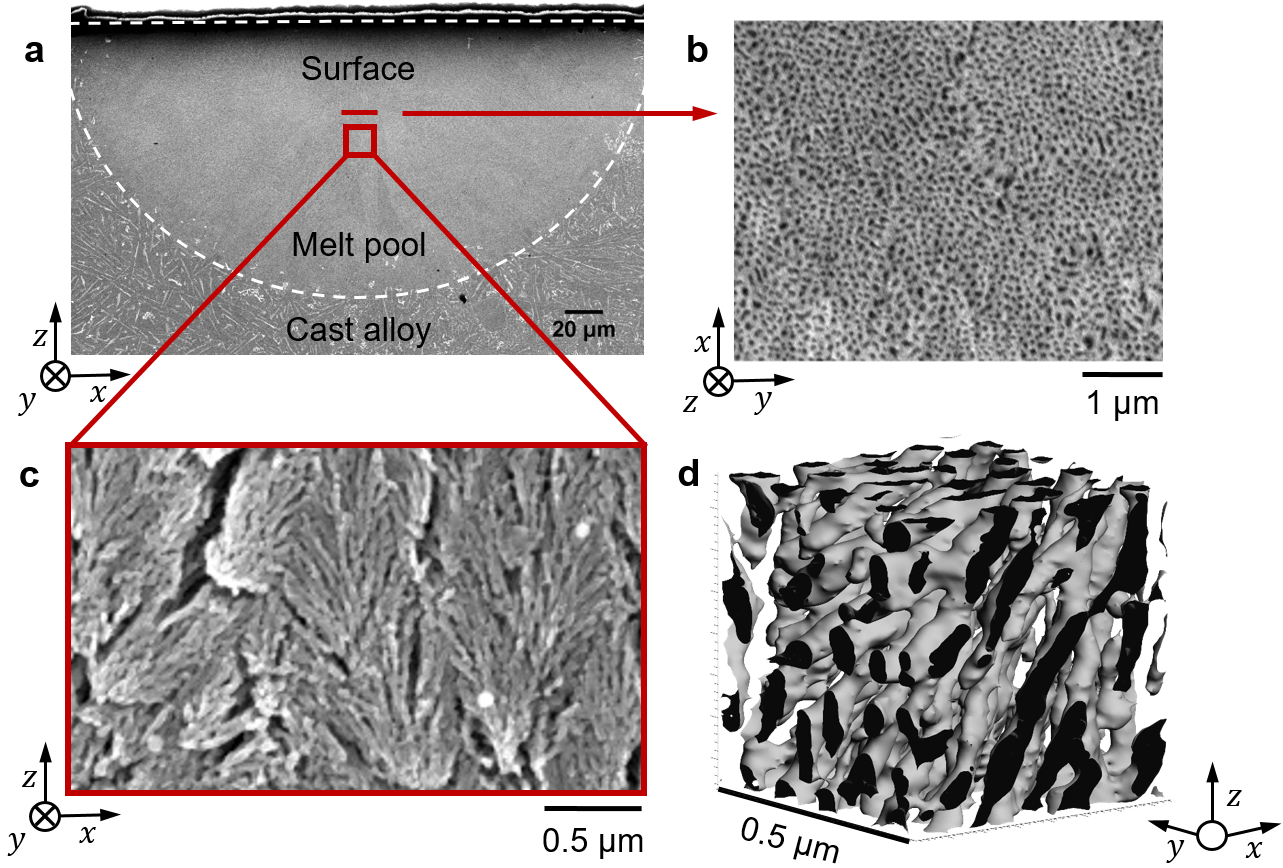
To characterize the connectivity of fine fibrous Si, we utilize focused ion beam (FIB) tomography. Through serial-sectioning, we can reconstruct the 3D microstructure via scanning electron microscopy (SEM) [29]. This method is advantageous since it can accommodate volumes larger than with voxels approaching tens of nm compared to X-ray nanotomography, in which the sample dimension is limited to [29, 30]. Also, the similar x-ray attenuation coefficients of Al and Si make it challenging to distinguish between them at ever decreasing length-scales. We used the ThermoFisher Helios 650 Nanolab SEM/FIB (ThermoFisher Scientific, Hillsboro, OR) for milling and imaging. The ion beam operated at an energy of 30 keV and the electron beam at an energy of 5 keV. We selected a region at the center of the laser surface remelted (LSR) zone of the same Al-Si sample described in Ref. [15], see Fig. 1(a). In total, we collected 512 images with 6.5 nm pixel size at 5 nm intervals along the milling direction (corresponding to the laser direction). See Fig. 1(b) for a representative FIB cross-sectional image and Fig. 1(c) for an orthogonal view.
Following data acquisition, we removed ion milling “curtain” artifacts in each cross-sectional SEM image using a compressed sensing stripe removal algorithm [31]. Fig. 1(b) is a representative image after stripe removal, showing Si fibers with circular cross-section. Then, we stretched all images vertically to account for the 52° sample tilt during data acquisition and registered the images using phase correlation in Matlab [32], considering only rigid translations. After processing the data, we utilized Zeiss Zen Blue 3.1 with the Intellesis deep learning module [33, 34] to perform semantic segmentation, a pixel-based machine learning method, to identify the solid phases in each SEM cross-section. For this purpose, we supplied five manually segmented images as training data. After training, the model was capable of distinguishing Si from Al. Fig. 1d shows a reconstructed subvolume, depicting the complex and bicontinuous fibrous Si (see Video. V1 for a visualization of a larger volume).
Due to the interconnectivity of the ultra-fine Si structure, it is impossible and also unreasonable to interrogate the morphology without having a clear starting and end point within the dataset. To make the problem tractable and meaningful, we decide to isolate a single colony for further analysis (as opposed to the aggregate network). These structures form as a result of growth front instability when the ratio of the velocity to the thermal gradient exceeds a critical value, thus destabilizing the otherwise planar front [35, 36]. They are common in laser treated materials since the generally high ratio establishes proper conditions for the formation of cells, even in high-purity alloys, see, e.g., [16].444While we have not conducted a detailed chemical analysis, we can estimate the concentration of impurities in our alloy using the constitutional supercooling criterion [37]: assuming mm/s (from Table 2) and K/mm (order-of-magnitude, from Ref. [38]), and taking the thermophysical parameters from Ref. [39], we would expect 10 ppm Sr is enough to destabilize the Al-Si eutectic growth front and generate cells via constitutional supercooling. That said, this low concentration is well below that needed for impurity modification, which gives rise to refinement and twinning (for an Al20wt%Si alloy, the critical concentration of Sr for modification is greater than 100 ppm, according to thermodynamic calculations in Ref. [27]). The cells or colonies have a coarser eutectic microstructure at their boundaries compared to their interior [35]. Unfortunately, however, attempts at manually outlining the colonies were tedious and subject to bias. To overcome this challenge, and inspired by Ref. [40], we quantify several microstructural descriptors of each connected component of Si (e.g., its volume, surface area, and aspect ratio) via Matlab [32]. Then, we determine the contribution of each descriptor (after normalization) to the overall variance, via principal component analysis. This enables us to identify those features that distinguish the Si fibers at the boundary from all others and ultimately to trace the colony boundaries in 3D, see supplementary information, Fig. S2. A selected colony is highlighted in red in Fig. 2(a) and visualized in 3D in Fig. 2(b).
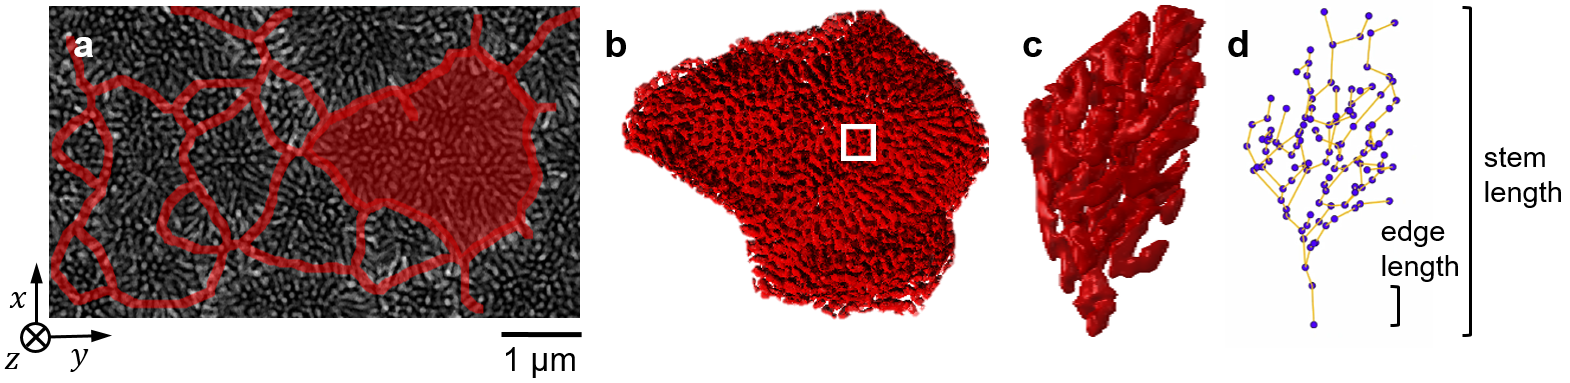
Subsequently, we skeletonize the single colony containing ultra-fine Si fibers via medial axis thinning [41], in order to quantify the branching behavior. The decomposed network structure can be represented by a list of nodes (with a defined spatial location) and links (spanning two nodes). Despite this reduced representation, we obtain a “forest” of nodes and links for the highly interconnected Si fibers within the colony. To make our task more manageable, we subdivide the Si fibers inside the colony into individual “trees” following two empirical rules (see Fig. S3 and Video. V1). Each tree has characteristic edge lengths and a stem length (Fig. 2(c,d)), defined in the same way as in Ref. [26].
We are now positioned to quantitatively compare the quench-modified eutectic against the impurity-modified eutectic (from Ref. [26]), with respect to length-scale and morphology.
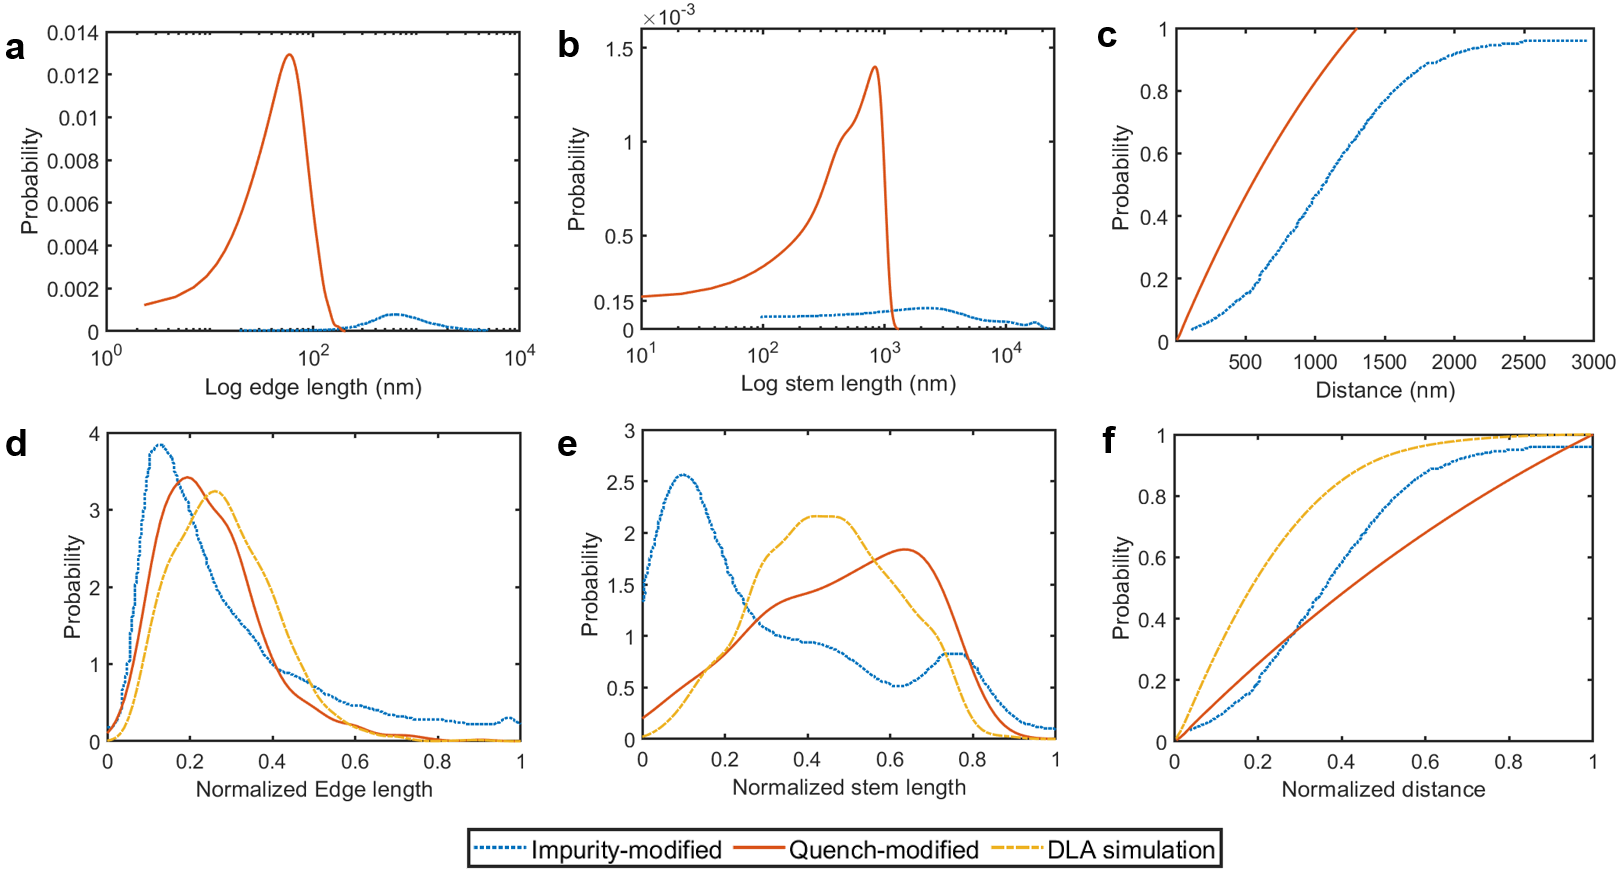
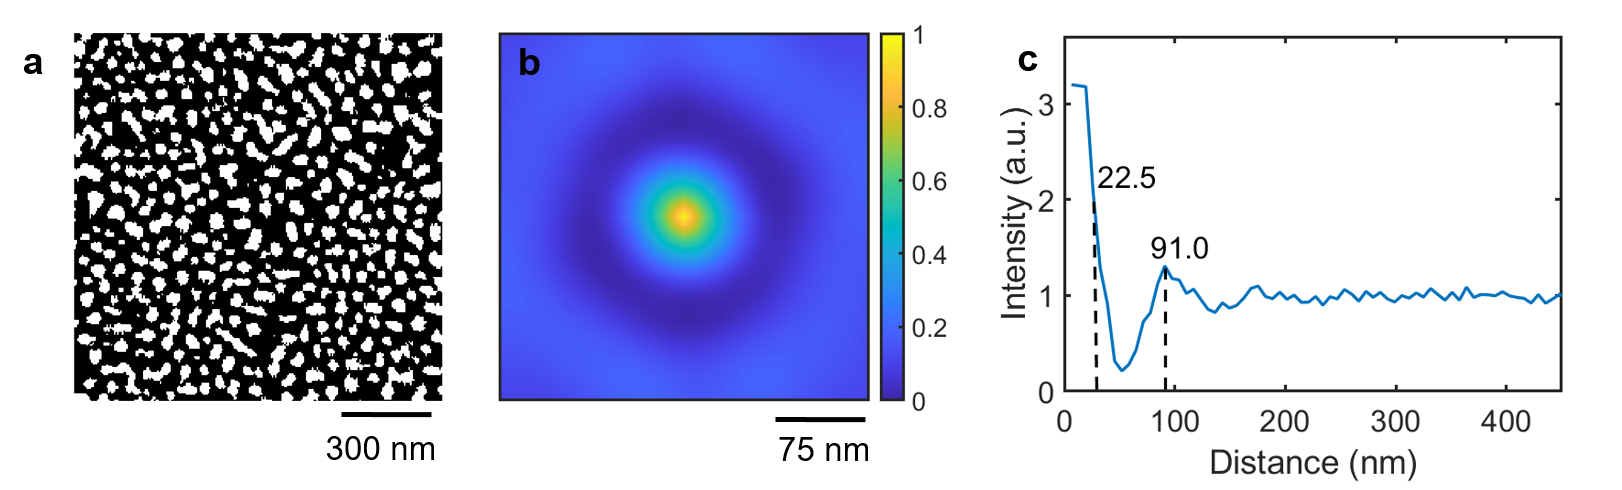
Fig. 3(a,b) shows distributions of edge and stem lengths, respectively. We also quantify via cross-correlation the contact distribution function in Fig. 3(c), defined as the probability that the minimum distance from a random position in the Al matrix to the Si tree structure is less than for [26]. Superimposed are the same descriptors from Ref. [26] on the impurity-modified eutectic. Unsurprisingly, both edge and stem lengths of the impurity-modified structure are on the order of micrometers, while the quenched structure shows finer features down to the nanometer length-scale. In fact, we find an average fiber radius of 22.5 nm and an average fiber spacing of 91.0 nm for the quenched structure using the auto-correlation function (see Fig. S4). This is near the finest possible spacing of 39.4 nm predicted by Ref. [42] as the limit of steady-state eutectic growth, see Table 2. Finally, we report a surface density of 58.0307 m-1, over 100 times larger than that of the impurity-modified sample. Table 1 summarizes the data from both eutectic structures.
In general, the nanoscale features of Si fibers in the LSR meltpool can be attributed to the deep undercooling and high growth velocity. Simulations [43] and experiments [44, 45, 46] have shown that a larger undercooling results in “facet breaking” which, for eutectics, should coincide with a transition from flake-like to fibrous Si. Adopting the undercooling-spacing-velocity relationships modified for rapid solidification [14], we estimate a growth velocity of 30.2 mm s-1 (which, fortuitously, corresponds to the laser scanning speed) and an undercooling of 72.7 K. In comparison, Hosch and coworkers [19, 47] reported that the flake-to-fiber transition of Si occurs in two stages with the first being the in-plane break-down of Si plates and the second being the out-of-plane Si branch growth. This conclusion was drawn from deep etching experiments; as such, it is difficult to ascertain whether fiber growth above the second transition is truly 3D in nature or is confined within the Si plates, as the authors themselves acknowledge [19]. Nevertheless, our calculated velocity is far above that of the second transition (see Table 2), which may explain the fibrous structure in Fig. 2c-d.
| Ref. | ||||||
|---|---|---|---|---|---|---|
| Quench-modified | This work | |||||
| Impurity-modified | * | [26] | ||||
| DLA | ** | This work | ||||
| Eutectic point (nominal) | [48] |
*: Value is calculated from the contact distribution function provided in Fig. 12 of Ref. [26].
**: The relatively large Si phase fraction obtained from DLA simulation is caused by dilating the tree structure to match the 22.5 nm fiber radius from the quenched sample.
| V | T (K) | Ref | ||
|---|---|---|---|---|
| Rapid quenching | 30.2 | This work | ||
| Coupled zone boundary, for 16 wt%Si | [14] | |||
| Limit of fiber spacing | 133 | [42] | ||
| Upper limit of flake-to-fiber transition | *** | [19] |
Aside from the obvious differences in length-scale, it remains to be determined whether the two processing routes lead to the same morphology of the Si phase. To answer this question, we plot the three histograms again, this time normalizing the length-scales to a range between zero and one (see Fig. 3(d-f)). The difference in the two distributions remains even after controlling for length-scale, indicating two fundamentally different morphologies with different origins. We conduct a two-sample Kolmogorov–Smirnov (K-S) test to quantify the statistical distance between the two distributions [50, 51, 52] and ultimately reject the null hypothesis that the two curves are drawn from the same distribution, at a 5% significance level. It follows that the two microstructures are not self-similar.
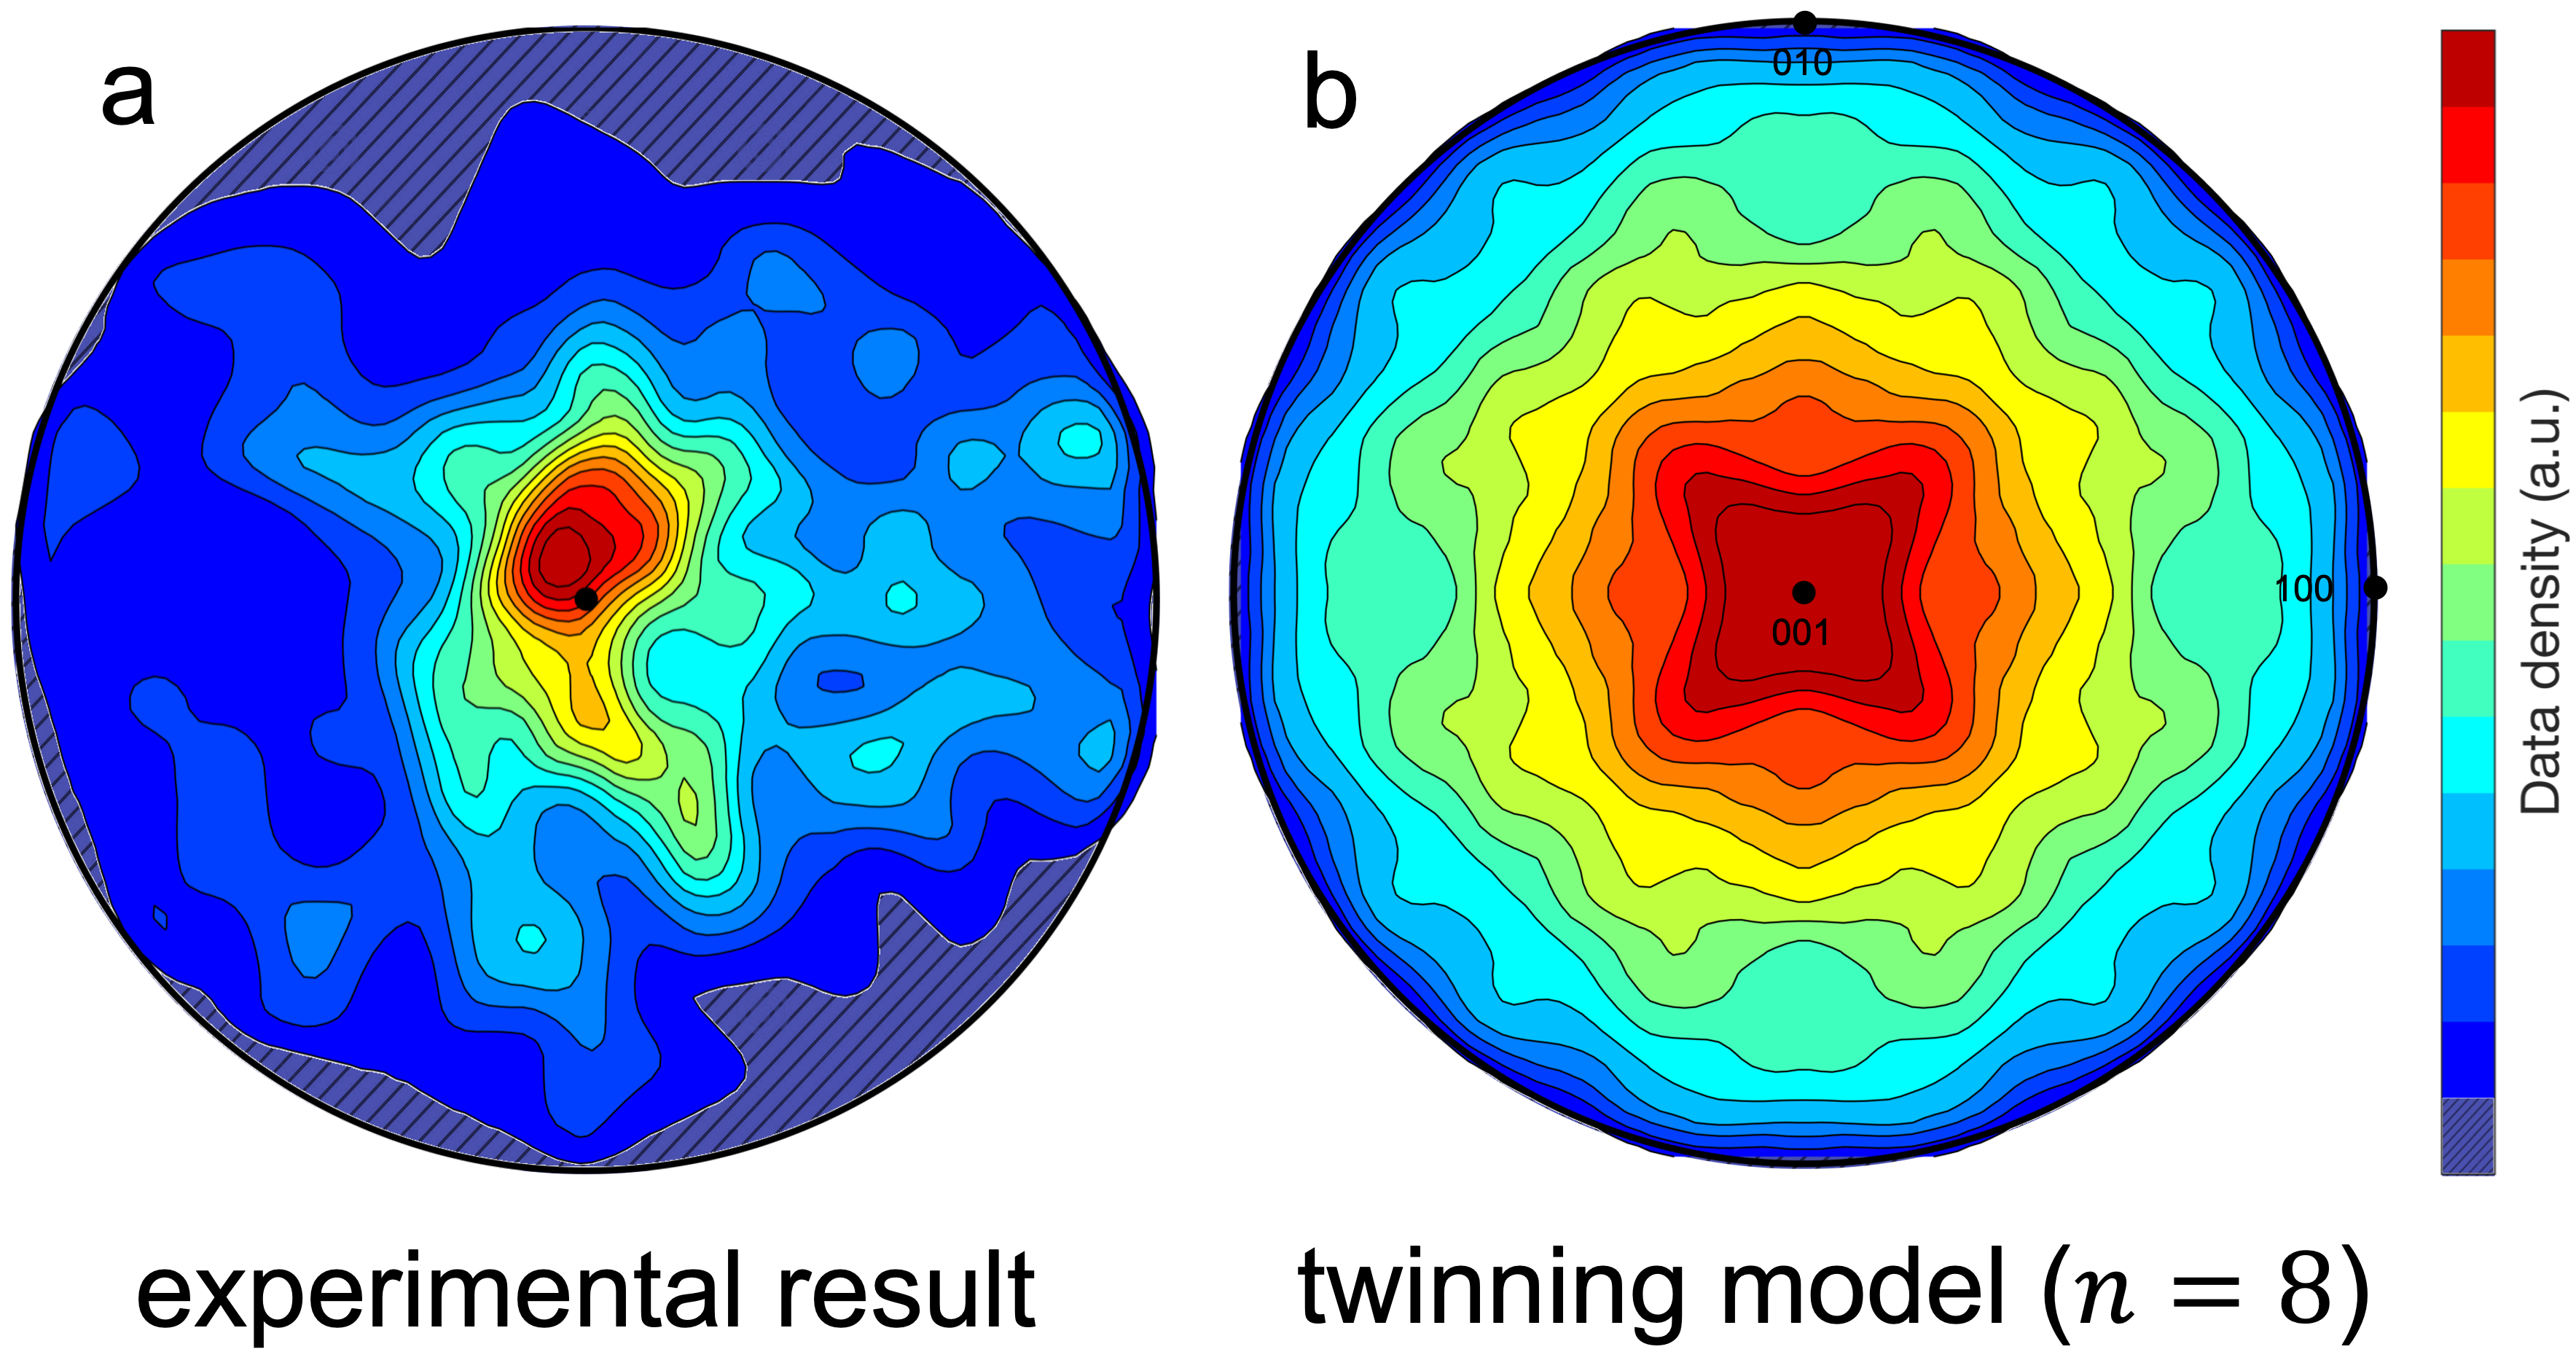
Instead, we posit that rapid cooling in LSR not only produces a much finer eutectic microstructure, but also a highly interconnected and isotropic branching behavior. To test this idea more rigorously, we compared stereographic projections of the Si fiber edge directions in the quenched structure against a theoretical prediction from multiple twinning, see Figs. 4. The latter is determined by calculating the total number of unique crystal orientations that are possible after th-order twinning on {111} planes, which follows a geometric series [1, 53]: . For example, after repeated twinning events, there are a total of unique crystal orientations (and hence growth directions) that cover the stereographic projection, although not uniformly. That is, Fig. 4(b) shows a preferred four-fold symmetry, which reflects the cubic symmetry of the Si crystal. In contrast, the fiber growth directions are non-directional or isotropic in Fig. 4(a).
We rationalize the above observations by noting that more growth sites are operative at high undercooling that are otherwise inaccessible at lower undercooling [54]. As more and more sites become active, the kinetic factor of Si in the revised Wilson-Frenkel law [55] will approach that of typical metals. That is, provided that the undercooling is above the threshold for the flake-to-fiber transition (as it is in our case), growth on multiple sites will naturally lend itself to a more isotropic morphology (namely, branching in any and all directions irrespective of the underlying crystallography of Si). An alternative explanation is that the kinetic undercooling of the Si phase increases with growth rate, such that the lead distance of the Si phase at the growth front would be gradually reduced. Eventually the Al and Si phases would be fully coupled at the growth front, such that the shape of the Si phase would no longer be governed by faceted growth [56, 57].
In contrast, theories for impurity-induced modification argue that the impurity atoms (such as Na or Sr) are rejected by the solidification front; accumulate at the eutectic-liquid interface; interfere with the layer growth of Si (once the eutectic Si has grown far enough to collect sufficient impurity atoms); and increase the number of twin defects in Si, thus enabling more frequent branching [58, 56, 7]. This cycle of crystallographic branching occurs with a characteristic frequency that is given by the edge length in Fig. 3(a,d). That said, branching is still constrained by the favored growth directions of Si and the locations of the twin plane grooves (provided the alloy is solidified under low growth rates) [59, 60, 20].
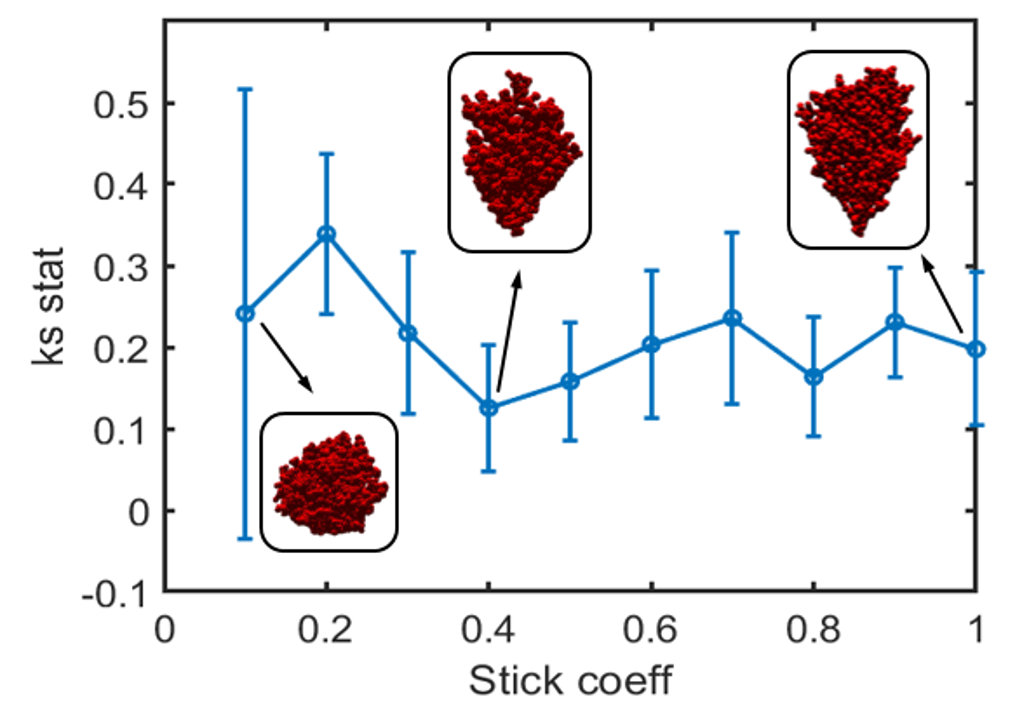
We put the above result in a broader context by comparing, for the first time, the morphology of Si to another, prototypical branched structure produced by diffusional aggregation: a random fractal [61, 62]. We follow standard algorithms for DLA [63, 61] to simulate the latter and test for its similarity to Si morphology under quenching. We restrict the movement of random walkers along the specimen direction to match the growth direction of the eutectic in experiment. We use the K-S test again to determine the sticking coefficient (the probability that a walker will stick to the aggregate) that resembles our quenched tree structure most closely, see Fig. S5. Then, as before, we obtain statistics on edge length, stem length and contact distribution (yellow curves in Fig. 3(d-f)).
According to the K-S test, the edge lengths of the random fractal and the quench-modified structure come from the same distribution at a 5% significance level. We reject the null hypothesis on stem length, however, although we suggest that this discrepancy is because the stem length is sensitive to the volume of the colonies from which the distributions are obtained. Likewise, the contact distributions of the two structures show a clear difference. This is due to the physics of directional eutectic solidification.555See Ref. [64] for the multi-particle extension of DLA for the simulation of solidification structures. That is, with the high thermal gradient of LSR, the Si fibers are aligned with the macroscopic growth direction (6.4% of edges are within 15∘ of vs. 3.4% for a random distribution, see also Fig. 4(a)). This would imply that the contact distribution increases linearly with normalized distance . Taken altogether, our analysis of the descriptors indicates that the ultrafine Si in LSR is in its own morphological class, distinct from impurity-modified and random fractal structures.666Pursuing also a comparison of the three histograms for the impurity-modified and random fractal structures, we find a significant difference at the 5% confidence level according to the K-S statistic.
In this paper, we characterize in 3D the morphology of an ultra-fine Al-Si eutectic processed via laser rapid solidification. We map the fibrous Si microstructure to a network of nodes and links to quantify its branching behavior. This representation brings to light that the quench-modified eutectic not only has a finer spacing (on the nanoscale) compared to its impurity-modified counterpart, but perhaps more surprisingly, that the morphologies of the two eutectics are not necessarily the same. For example, the branching behavior of the quench-modified eutectic is remarkably isotropic (somewhat akin to a random fractal produced via DLA). This would indicate the absence of Si facets exposed to the liquid, the result of either kinetic roughening or coupled growth at deep undercooling. Further insight may be gained from examining the Si morphology of impurity-doped samples under LSR, for which experiments are well underway. Broadly, our quantitative analysis can be used to generate synthetic eutectic microstructures that reflect the inherent complexity of real ones.
Acknowledgements
We gratefully acknowledge financial support from the National Science Foundation (NSF) CAREER program under award number 1847855. Amit Misra and Huai-Hsun Lien thank the support from DOE, Office of Science, Office of Basic Energy Sciences, grant number DE-SC0016808 for the laser processing work. We acknowledge assistance from Metin Kayitmazbatir and late Prof. Jyoti Mazumder in laser scanning experiments. We thank the University of Michigan College of Engineering for financial support and the Michigan Center for Materials Characterization for use of the instruments and staff assistance.
References
- Hellawell [1970] A. Hellawell, The growth and structure of eutectics with silicon and germanium, Progress in Materials Science 15 (1970) 3–78.
- Tiwary et al. [2015] C. S. Tiwary, S. Kashyap, D. H. Kim, K. Chattopadhyay, Al based ultra-fine eutectic with high room temperature plasticity and elevated temperature strength, Materials Science and Engineering: A 639 (2015) 359–369.
- Lien et al. [2022] H.-H. Lien, J. Wang, A. Misra, Plastic deformation induced microstructure transition in nano-fibrous Al-Si eutectics, Materials & Design (2022) 110701.
- Ferrarini et al. [2004] C. Ferrarini, C. Bolfarini, C. Kiminami, et al., Microstructure and mechanical properties of spray deposited hypoeutectic Al–Si alloy, Materials Science and Engineering: A 375 (2004) 577–580.
- Suryawanshi et al. [2016] J. Suryawanshi, K. Prashanth, S. Scudino, J. Eckert, O. Prakash, U. Ramamurty, Simultaneous enhancements of strength and toughness in an Al-12Si alloy synthesized using selective laser melting, Acta Materialia 115 (2016) 285–294.
- Yilmaz and Elliott [1989] F. Yilmaz, R. Elliott, The microstructure and mechanical properties of unidirectionally solidified Al-Si alloys, Journal of Materials Science 24 (1989) 2065–2070.
- Moniri and Shahani [2019] S. Moniri, A. J. Shahani, Chemical modification of degenerate eutectics: A review of recent advances and current issues, Journal of Materials Research 34 (2019) 20–34.
- Roehling et al. [2017] J. D. Roehling, D. R. Coughlin, J. W. Gibbs, J. K. Baldwin, J. C. Mertens, G. H. Campbell, A. J. Clarke, J. T. McKeown, Rapid solidification growth mode transitions in Al-Si alloys by dynamic transmission electron microscopy, Acta Materialia 131 (2017) 22–30.
- Zhao et al. [2014] L. Zhao, M. Zhao, L. Song, J. Mazumder, Ultra-fine Al-Si hypereutectic alloy fabricated by direct metal deposition, Materials & Design (1980-2015) 56 (2014) 542–548.
- Hearn [2018] W. Hearn, The microstructure, morphology and mechanical properties of rapidly solidified Al-10wt% Si alloy (2018).
- Bendijk et al. [1980] A. Bendijk, R. Delhez, L. Katgerman, T. H. De Keijser, E. Mittemeijer, N. Van Der Pers, Characterization of Al-Si alloys rapidly quenched from the melt, journal of Materials Science 15 (1980) 2803–2810.
- Gremaud et al. [1996] M. Gremaud, D. Allen, M. Rappaz, J. Perepezko, The development of nucleation controlled microstructures during laser treatment of AlSi alloys, Acta Materialia 44 (1996) 2669–2681.
- Von Allmen et al. [1984] M. Von Allmen, E. Huber, A. Blatter, K. Affolter, Melt quenching at 10 exp 10 at K/s, Int. J. Rapid Solidification 1 (1984) 15–25.
- Pierantoni et al. [1992] M. Pierantoni, M. Gremaud, P. Magnin, D. Stoll, W. Kurz, The coupled zone of rapidly solidified Al-Si alloys in laser treatment, Acta metallurgica et materialia 40 (1992) 1637–1644.
- Lien et al. [2020] H.-H. Lien, J. Mazumder, J. Wang, A. Misra, Microstructure evolution and high density of nanotwinned ultrafine Si in hypereutectic Al-Si alloy by laser surface remelting, Materials Characterization 161 (2020) 110147.
- Abboud and Mazumder [2020] J. Abboud, J. Mazumder, Developing of nano sized fibrous eutectic silicon in hypereutectic Al-Si alloy by laser remelting, Scientific Reports 10 (2020) 1–18.
- Dinda et al. [2012] G. Dinda, A. Dasgupta, J. Mazumder, Evolution of microstructure in laser deposited Al–11.28% Si alloy, Surface and Coatings Technology 206 (2012) 2152–2160.
- Steent and Hellawell [1972] H. Steent, A. Hellawell, Structure and properties of aluminium-silicon eutectic alloys, Acta Metallurgica 20 (1972) 363–370.
- Hosch et al. [2009] T. Hosch, L. G. England, R. E. Napolitano, Analysis of the high growth-rate transition in Al–Si eutectic solidification, Journal of Materials Science 44 (2009) 4892–4899.
- Day and Hellawell [1968] M. Day, A. Hellawell, The microstructure and crystallography of aluminium—silicon eutectic alloys, Proceedings of the Royal Society of London. Series A. Mathematical and Physical Sciences 305 (1968) 473–491.
- Gruzleski and Closset [1990] J. E. Gruzleski, B. M. Closset, The treatment of liquid aluminum-silicon alloys, Amer Foundry Society, 1990.
- Tenekedjiev and Gruzleski [1990] N. Tenekedjiev, J. Gruzleski, Hypereutectic aluminium-silicon casting alloys—a review, Cast Metals 3 (1990) 96–105.
- Nogita et al. [2004] K. Nogita, S. McDonald, A. Dahle, Modification of al-si alloys, in: Materials Forum, volume 28, 2004, pp. 945–950.
- Requena et al. [2009] G. Requena, G. Garcés, M. Rodríguez, T. Pirling, P. Cloetens, 3D architecture and load partition in eutectic Al-Si alloys, Advanced Engineering Materials 11 (2009) 1007–1014.
- Requena et al. [2011] G. Requena, G. Garcés, Z. Asghar, E. Marks, P. Staron, P. Cloetens, The effect of the connectivity of rigid phases on strength of Al- Si alloys, Advanced Engineering Materials 13 (2011) 674–684.
- Gaiselmann et al. [2013] G. Gaiselmann, O. Stenzel, A. Kruglova, F. Muecklich, V. Schmidt, Competitive stochastic growth model for the 3D morphology of eutectic Si in Al–Si alloys, Computational Materials Science 69 (2013) 289–298.
- Eiken et al. [2015] J. Eiken, M. Apel, S.-M. Liang, R. Schmid-Fetzer, Impact of p and sr on solidification sequence and morphology of hypoeutectic al–si alloys: Combined thermodynamic computation and phase-field simulation, Acta Materialia 98 (2015) 152–163.
- Toropova et al. [2022] L. Toropova, D. Alexandrov, M. Rettenmayr, D. Liu, Microstructure and morphology of si crystals grown in pure si and al–si melts, Journal of Physics: Condensed Matter 34 (2022) 094002.
- Uchic et al. [2007] M. D. Uchic, L. Holzer, B. J. Inkson, E. L. Principe, P. Munroe, Three-dimensional microstructural characterization using focused ion beam tomography, MRS Bulletin 32 (2007) 408–416.
- Shahani et al. [2020] A. J. Shahani, X. Xiao, E. M. Lauridsen, P. W. Voorhees, Characterization of metals in four dimensions, Materials Research Letters 8 (2020) 462–476.
- Schwartz et al. [2019] J. Schwartz, Y. Jiang, Y. Wang, A. Aiello, P. Bhattacharya, H. Yuan, Z. Mi, N. Bassim, R. Hovden, Removing stripes, scratches, and curtaining with nonrecoverable compressed sensing, Microscopy and Microanalysis 25 (2019) 705–710.
- MAT [2020] MATLAB Image Processing Toolbox Reference (R2020b), The Mathworks, Inc., Natick, Massachusetts, 2020.
- Andrew et al. [2017] M. Andrew, S. Bhattiprolu, D. Butnaru, J. Correa, The usage of modern data science in segmentation and classification: Machine learning and microscopy, Microscopy and Microanalysis 23 (2017) 156–157.
- Volkenandt et al. [2018] T. Volkenandt, S. Freitag, M. Rauscher, Machine learning powered image segmentation, Microscopy and Microanalysis 24 (2018) 520–521.
- Weart and Mack [1958] H. W. Weart, D. J. Mack, Eutectic solidification structures, Transactions of the metallurgical society of AIME 212 (1958).
- Yue et al. [????] A. S. Yue, F. W. Crossman, A. E. Vidoz, M. I. Jacobson, Controlled microstructures of Al-CuAI2 eutectic composites and their compressive properties 242 (????) 2241–2253.
- Hecht et al. [2004] U. Hecht, L. Gránásy, T. Pusztai, B. Böttger, M. Apel, V. Witusiewicz, L. Ratke, J. De Wilde, L. Froyen, D. Camel, et al., Multiphase solidification in multicomponent alloys, Materials Science and Engineering: R: Reports 46 (2004) 1–49.
- Kayitmazbatir et al. [2022] M. Kayitmazbatir, H.-H. Lien, J. Mazumder, J. Wang, A. Misra, Effect of cooling rate on nano-eutectic formation in laser surface remelted and rare earth modified hypereutectic al-20si alloys, Crystals 12 (2022) 750.
- Liao et al. [2014] H. Liao, W. Huang, Q. Wang, F. Jia, Effects of strontium, magnesium addition, temperature gradient, and growth velocity on al–si eutectic growth in a unidirectionally-solidified al–13 wt% si alloy, Journal of Materials Science & Technology 30 (2014) 146–153.
- Friess et al. [2022] J. Friess, P. Rayling, U. Hecht, A. Genau, Microstructure evolution and grain growth competition in directionally solidified ternary Al–Ag2Al–Al2Cu eutectic, Metallurgical and Materials Transactions A 53 (2022) 1294–1307.
- Kollmannsberger et al. [2017] P. Kollmannsberger, M. Kerschnitzki, F. Repp, W. Wagermaier, R. Weinkamer, P. Fratzl, The small world of osteocytes: connectomics of the lacuno-canalicular network in bone, New Journal of Physics 19 (2017) 073019.
- Wang and Trivedi [2011] N. Wang, R. Trivedi, Limit of steady-state lamellar eutectic growth, Scripta Materialia 64 (2011) 848–851.
- Bollada et al. [2018] P. Bollada, P. Jimack, A. Mullis, Faceted and dendritic morphology change in alloy solidification, Computational Materials Science 144 (2018) 76–84.
- Liu et al. [2004] R. P. Liu, D. M. Herlach, M. Vandyoussefi, A. L. Greer, Morphologies of silicon crystals solidified on a chill plate, Metallurgical and Materials Transactions A (2004) 7.
- Panofen and Herlach [2007] C. Panofen, D. Herlach, Solidification of highly undercooled Si and Si–Ge melts, Materials Science and Engineering: A 449-451 (2007) 699–703.
- Yang et al. [2011] X. Yang, K. Fujiwara, K. Maeda, J. Nozawa, H. Koizumi, S. Uda, Dependence of Si faceted dendrite growth velocity on undercooling, Applied Physics Letters 98 (2011) 012113.
- Hosch [2010] T. A. Hosch, Solidification, growth mechanisms, and associated properties of aluminum-silicon and magnesium lightweight casting alloys, Ph.D., Iowa State University, 2010.
- Massalski et al. [1986] T. B. Massalski, J. L. Murray, L. H. Bennett, H. Baker, Binary alloy phase diagrams, 1986.
- Grugel and Kurz [1987] R. Grugel, W. Kurz, Growth of interdendritic eutectic in directionally solidified al-si alloys, Metallurgical and Materials Transactions A 18 (1987) 1137–1142.
- Massey Jr [1951] F. J. Massey Jr, The Kolmogorov-Smirnov test for goodness of fit, Journal of the American statistical Association 46 (1951) 68–78.
- Miller [1956] L. H. Miller, Table of percentage points of Kolmogorov statistics, Journal of the American Statistical Association 51 (1956) 111–121.
- Marsaglia et al. [2003] G. Marsaglia, W. W. Tsang, J. Wang, Evaluating Kolmogorov’s distribution, Journal of statistical software 8 (2003) 1–4.
- Shahani [2016] A. J. Shahani, Interfacial evolution in four dimensions: Growth and coarsening in highly anisotropic systems, Ph.D. thesis, Northwestern University, 2016.
- Napolitano et al. [2004] R. E. Napolitano, H. Meco, C. Jung, Faceted solidification morphologies in low-growth-rate Al-Si eutectics, JOM 56 (2004) 16–21.
- Jackson [1967] K. Jackson, Current concepts in crystal growth from the melt, Progress in Solid State Chemistry 4 (1967) 53–80.
- Major and Rutter [1989] J. Major, J. Rutter, Effect of strontium and phosphorus on solid/liquid interface of Al–Si eutectic, Materials science and technology 5 (1989) 645–656.
- Mohagheghi et al. [2020] S. Mohagheghi, S. Bottin-Rousseau, S. Akamatsu, M. Şerefoğlu, Decoupled versus coupled growth dynamics of an irregular eutectic alloy, Scripta Materialia 189 (2020) 11–15.
- Lu and Hellawell [1987] S.-Z. Lu, A. Hellawell, The mechanism of silicon modification in aluminum-silicon alloys: Impurity induced twinning, Metallurgical transactions A 18 (1987) 1721–1733.
- Wagner [1960] R. Wagner, On the growth of germanium dendrites, Acta metall. 8 (1960) 57–60.
- Hamilton and Seidensticker [1960] D. Hamilton, R. Seidensticker, Propagation mechanism of germanium dendrites, Journal of Applied Physics 31 (1960) 1165–1168.
- Witten and Sander [1981] T. A. Witten, L. M. Sander, Diffusion-Limited Aggregation, a kinetic critical phenomenon, Phys. Rev. Lett. 47 (1981) 1400–1403.
- Bunde and Havlin [2012] A. Bunde, S. Havlin, Fractals and disordered systems, Springer Science & Business Media, 2012.
- Thomas and Hashim [2012] P. Thomas, M. Hashim, Diffusion experiments, https://github.com/philipithomas/diffusion, 2012.
- Das and Mittemeijer [2002] A. Das, E. Mittemeijer, Simulation of solidification structures of binary alloys, International Journal of Materials Research 93 (2002) 459–467.
- Steinmetz et al. [2018] P. Steinmetz, J. Hötzer, A. Dennstedt, C. Serr, B. Nestler, A. Genau, Graph-based investigation of three-dimensional microstructure rearrangement during ternary eutectic directional solidification of al-ag-cu, Journal of Crystal Growth 498 (2018) 230–243.
Supplementary material
Procedure for tracing colony boundaries
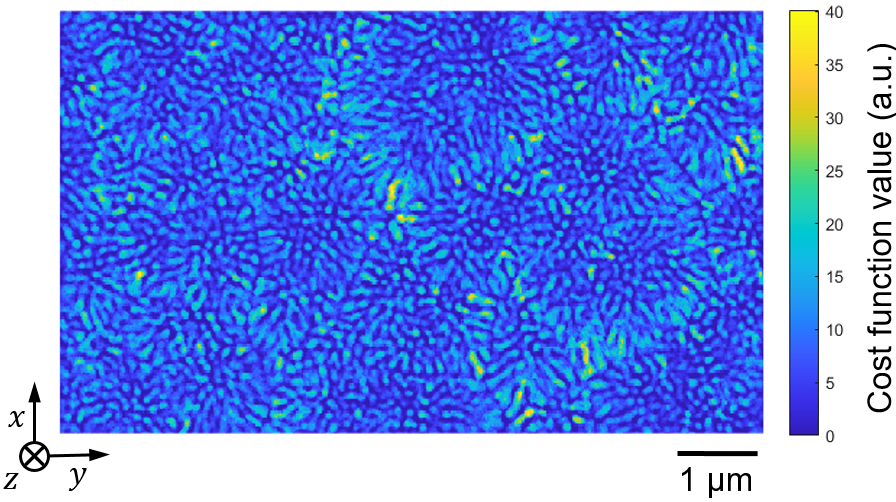
We decompose the microstructure into colonies by identifying the Si fibers that are located along the colony boundaries. According to the arguments given in Ref. [35], fibers along the boundaries tend to be coarser (and hence have a larger eutectic spacing). With this in mind, we selected eight descriptors to analyze the ensemble of fibers in the microstructure: () volume, () surface area, () ratio of the largest and smallest principal axis length in 3D, () solidity, as well as () the maximum, minimum, total, and mean distances between fibers and all of their nearest neighbors. The nearest neighbours are defined as those fibers closest to the target fiber in all directions. To identify the descriptors that help to distinguish between fibers at the boundary vs. those at the interior, we perform a principal component analysis. The first principal component (PC1) is a combination of volume , surface area , and aspect ratio ; it contributes more than 90% of the variance. Accordingly, we define a cost function to be a linear function of these three parameters, where the coefficients are taken as the weights in PC1, i.e., . A higher cost value indicates that the Si fiber is located along the periphery of the colony.
We can color each Si fiber according to its cost in the cross-sectional images (- plane). The outline of the colonies can then be reasonably identified from a projection along the image depth () for “chunks” of 30 cross-sectional images, see one such projection in Fig. S2.
Procedure for identifying tree-like structures
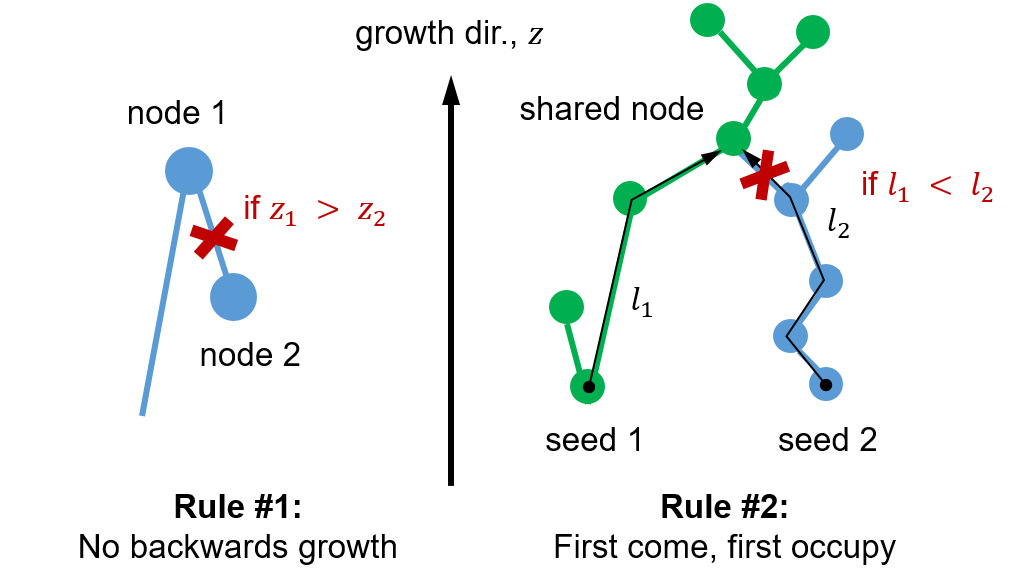
To subdivide the colonies into “tree”-like structures of connected fibers, we developed two empirical rules that are consistent with the physics of directional eutectic solidification. These rules enabled us to break links that connected two trees (due to merging of branched fibers in solidification [65]) and that ultimately rendered a single connected component (instead of two separate ones). Fig S3 provides a schematic illustration of both rules:
-
1.
Rule #1: No backwards growth. Here, we break links that point backwards (along ), i.e., away from the macroscopic growth direction (). Physically, it is not possible for a fiber to grow into a region that has already solidified.
-
2.
Rule #2: First come, first occupy. Here, we consider nodes that are shared between two or more trees. We assign them to the tree that arrives at that node earlier than the others, i.e., the tree that ‘wins’ is likely the one that has a shorter path from the starting seed to the shared node. The path length is calculated as the total length of the previous links from the starting seed up to the shared node. This rule follows from the fact that Si fibers can impinge upon fibers that were solidified beforehand.
While these rules can also impact the final tree morphology of Si phase, we try to minimize such an effect by selecting out those trees making their way through the whole colony as our target structures when gathering the branching statistics.
Basic descriptors of microstructure
We obtain the Si fiber diameter and spacing by calculating the 2D auto-correlation of Si phase. Fig. S4(a) shows a section of one 2D slice that we use to demonstrate our procedure, taken from the center of a colony. Fig. S4(b) shows the auto-correlation of Fig. S4(a). The size of the central peak (in yellow, a.u.) indicates the average size of the Si fibers. The distance between the central peak and the first-order ring indicates the spacing between the Si fibers. Note that it is invariant with direction, indicating that the eutectic microstructure is spatially isotropic. Fig. S4(c) shows the radial distribution function, computed from Fig. S4(b) with respect to the distance from the center of a Si fiber. The width of the primary peak gives the fiber diameter as 22.5 nm, and the distance between primary and secondary peaks gives the average spacing as 91.0 nm.
DLA simulation
When conducting DLA simulation, the sticking coefficient is one input parameter that influences strongly the structure of the tree clusters formed by random walkers [61, 62]. A sticking coefficient of 1 implies that all walkers will stick to the cluster, and 0 the converse. To determine which coefficient to use, we vary the coefficient from 0.1 to 1 in increments of 0.1 and generate 20 sets of random fractal clusters for each case. We then obtain branching statistics of all DLA tree structures following the same procedure (skeletonization) that we followed for the experimental data. We again use the K-S statistic to codify the similarity of distributions of edge and stem length between DLA and experimental data on the quench-modified structure. The result is shown in Fig. S5 where a lower K-S statistic value indicates a closer agreement in branching statistics. With this data in hand, we select a sticking coefficient of 0.4 to match the experimental data as best as possible.