Tracing and Visualizing Human-ML/AI Collaborative Processes through Artifacts of Data Work
Abstract.
Automated Machine Learning (AutoML) technology can lower barriers in data work yet still requires human intervention to be functional. However, the complex and collaborative process resulting from humans and machines trading off work makes it difficult to trace what was done, by whom (or what), and when. In this research, we construct a taxonomy of data work artifacts that captures AutoML and human processes. We present a rigorous methodology for its creation and discuss its transferability to the visual design process. We operationalize the taxonomy through the development of AutoML Trace a visual interactive sketch showing both the context and temporality of human-ML/AI collaboration in data work. Finally, we demonstrate the utility of our approach via a usage scenario with an enterprise software development team. Collectively, our research process and findings explore challenges and fruitful avenues for developing data visualization tools that interrogate the sociotechnical relationships in automated data work.
Availability of Supplemental Materials: https://osf.io/3nmyj/?view_only=19962103d58b45d289b5c83421f48b36
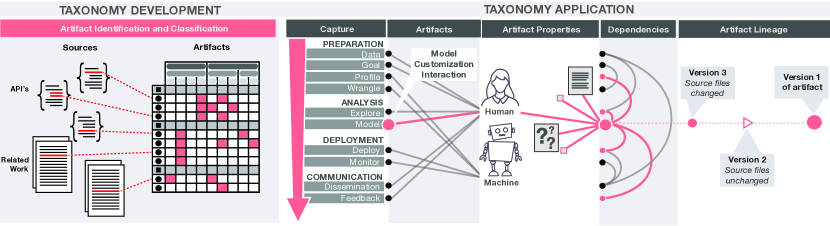
A visual diagram of our study processes. We use simple and stylized icons to describe our approach and contributions. The first panel in the figure shows the taxonomy development from APIs and literature sources. The subsequent panels show the process of getting artifacts from across a data science process, classifying whether they had human or machine origins, delineating their properties, and finally, show the history of that object over time.
1. Introduction
Data work comprises multiple interrelated phases that leverage statistical and computational techniques for data preparation, analysis, deployment, and communication (Crisan et al., 2021). The skills required to conduct data work remain sufficiently complex, making it inaccessible to many experts with the relevant domain context but needing more technical acumen (Karmaker et al., 2021). Recent innovations have developed techniques that automatically carry out data work, for example, model selection or certain data preparation steps, thereby lowering barriers of use to non-technical experts (De Bie et al., 2022). Initially, this so-called automated machine learning technology (AutoML) focused primarily on the analysis phase. However, recent research is pushing the boundaries of AutoML to encompass a more end-to-end data workflow (Karmaker et al., 2021; Crisan and Fiore-Gartland, 2021; He et al., 2021; Zöller and Huber, 2021). The expanded scope of AutoML can now involve automating wrangling in the data preparation phase, hyperparameter tuning and algorithm selection in the analysis phase alerts to drift within a deployed model, and even auto-generated reports for communication and dissemination. However, in practice, AutoML still requires considerable human labor and coordination to be functional (Crisan and Fiore-Gartland, 2021; Drozdal et al., 2020; Xin et al., 2021). Moreover, these prior studies point to friction amongst data teams when AutoML remains a ‘black box’ and it is difficult to interrogate how people collaborate with AutoML technology to complete data work. Even if full automation were possible, human oversight and intervention are still desired (Wang et al., 2021b; Karmaker et al., 2021; Lee et al., 2019; Crisan and Fiore-Gartland, 2021). Unfortunately, existing AutoML tools rarely consider this human element, resulting in many unaddressed needs even as this technology advances. To bridge this gap, we explored how visual analysis could help technical and non-technical experts trace AutoML-assisted data work.
To acknowledge the shared labor of AutoML and humans, we treat the challenge of traceability in automated data work as one of human-ML/AI collaboration. Recent research from the HCI community (Yang et al., 2020b) highlights several difficulties in human-ML/AI collaboration, and two issues were especially motivating in our research. The first challenge is that human-ML/AI collaboration adds uncertainty to the capabilities and outputs of an ML/AI system. They assert that this uncertainty is difficult to address with existing design methodologies. Though techniques and visual systems do exist to make AutoML processes more transparent through provenance tracking and auditing (e.g., (Souza et al., 2019; Schelter et al., 2017; Ono et al., 2021; Wang et al., 2019a)), these approaches often focus on the analysis phase of the pipeline, prioritizing machine learning engineers and data scientists over data workers with less technical expertise. This gap is significant for the development of AutoML systems, as it does not account for the diversity of teams involved in human-ML/AI collaboration (Parasuraman et al., 2000; Bansal et al., 2019; Wang et al., 2019c; Hong et al., 2020b; Heer, 2019; Crisan and Fiore-Gartland, 2021; Liu et al., 2020; Xin et al., 2021). Developing systems to support transparency for the full spectrum of data workers is essential, albeit challenging (Sambasivan et al., 2021). This reflects the second challenge Yang et al. identify in their work: close collaboration between user-oriented researchers and ML/AI engineers is important, but there are barriers to this collaboration stemming from a lack of mediation for such an interdisciplinary dialogue, such as “shared workflow, boundary objects, or a common language for scaffolding” (Yang et al., 2020b).
We encountered these challenges of human-ML/AI collaboration in our work with the enterprise team. Our initial goal was to develop a solution for visually tracing human and AutoML processes across a data workflow facilitated by their software. However, we realized the collaboration was missing a common language for shared discourse for their developing AutoML system. Through the lens of the broader HCI literature, and Yang et. al. in particular, what we lacked were boundary objects – abstract or concrete information that established a shared understanding for collaboration with the software team (John et al., 2004). We established that we needed first to characterize what could be captured in an AutoML pipeline from both humans and automated processes before we could develop a visual analysis tool.
Research in human-human collaboration and knowledge sharing has highlighted the importance of capturing artifacts (Kreiner, 2002; Lee, 2007) for tracing (Tiwana and Ramesh, 2001; Fischer and Otswald, 2001; Mariano and Awazu, 2016) complex collaborative processes. Grounding our research in this prior work and Yang et al. (Yang et al., 2020a), we present our approach for making automated data work traceable through developing an AutoML artifact taxonomy and the AutoML Trace visualization tool. Our taxonomy is drawn from examining both existing and theoretical AutoML and human-ML/AI interactive systems. It defines the broad scope of both human and AutoML-derived artifacts. The precise meaning of an artifact is dependent on its context. In our research, artifacts represent tangible and abstract items generated by humans (i.e., goals, tasks, documentation, datasets, source code, etc.) or AutoML processes (e.g., feature sets, the choice of model, automated insights, etc.) within data work. The taxonomy served as a boundary object that scaffolded for dialogue with the software team, allowing us to ideate around their existing system and outstanding end-user needs. We further operationalize this taxonomy through AutoML Trace- a high-fidelity visual interactive sketch that, in the words of Greenberg and Buxton (Greenberg and Buxton, 2008), aims to “make vague ideas concrete, reflect on possible problems and uses, discover alternate new ideas, and refine current ones.”. Developing an interactive sketch, instead of a high-fidelity and more full-featured prototype, allowed to engage more flexibly in a co-design process (Sanders and Stappers, 2014) with the software team. AutoML Trace identifies, captures, and contextualizes artifacts defined by our taxonomy and shows their dependencies and evolution over time. Although we apply AutoML Trace to our collaborators’ AutoML software, it can be applied to others.
Collectively, our research presents three contributions. The first contribution of this work is the AutoML Artifact Taxonomy that accounts for the nuances of human-ML/AI collaboration across the continuum of automation in data work. Two additional contributions of this work emerged as a natural progression from the development of the taxonomy and our engagement with the enterprise team. The second contribution is the AutoML Trace interactive sketch that operationalizes our taxonomy and serves as a medium for engagement with AutoML systems. Finally, the third contribution is a definition of traceability that characterizes what an understandable and observable data workflow involves. While we focus primarily on the challenges of automating data work, we also reflect on using taxonomies and visual sketches to broadly develop frameworks and systems for designing human-ML/AI collaboration.
2. Related Work
We review related work concerning taxonomies’ utility for creating a common language within and between complex systems, existing taxonomies for AutoML and data visualization, and existing visualization systems for AutoML that can surface these artifacts.
2.1. Taxonomies, Ontologies, and Schemas
Taxonomies provide structure to knowledge and enable comparison and identification of relationships between items (Nickerson et al., 2013). The Vis, HCI, and ML communities use taxonomies to inform the development of systems, define requirements, and provide a common language for communication (Lam et al., 2018; Domova and Vrotsou, 2022; Lee et al., 2021a). We intended the same utility for our taxonomy. However, we sought to develop our AutoML artifact taxonomy in a rigorous manner to ensure our work is seated on a solid theoretical foundation. Our taxonomy development is informed by the work of Nickerson et al. for rigorous taxonomy development in information systems (Nickerson et al., 2013), which was motivated by the often ad hoc methods for constructing taxonomies identified in their own community. We reviewed existing taxonomies in AutoML and data visualization to understand their respective conceptual characterization, utility, and granularity in relation to our taxonomy. We group existing taxonomies and similar works in three groups: ML processes, human-in-the-loop automation, and visual analysis.
2.1.1. Provenance, Tractability, and Reproducibility in ML Processes
We are not the first to formalize ML and AI processes as a taxonomy. Tatemen et al. (Taman et al., 2018) proposed a taxonomy for the reproducibility of ML research. Their research identifies low to high reproducibility examples based on the artifacts their research process produces. With a similar aim of reproducibility, Publio et al. (Publio et al., 2018) proposes ML-Schema, an ontology for representing and interchanging artifacts of ML processes, which includes code, data, and experimental documentation. They aim to automatically produce ML model meta-data descriptors to improve the interpretability of ML processes. Souza et al. (Souza et al., 2019) builds on the ML Schema along with PROV-DM to create a specific schema for provenance tracking of multiple ML workflows. While these taxonomies and schema for provenance in ML are important, they do not sufficiently account for the ways that human processes and interventions at various stages, as our research attempts to do. However, in developing our taxonomy, we also considered how existing taxonomies connect to ours to add more granular details to a specific data science process.
2.1.2. Human-in-the-loop and Hybrid Automation
In their characterization of provenance in visual analytics, Ragen et al. illustrate the heterogeneity of a given workflow as well as the importance of “capturing user thoughts, analytical reasoning, and insights,” (Ragan et al., 2015). More recent work (von Rueden et al., 2021; Dellermann et al., 2021) generated taxonomies that begin to explicitly account for a variety of human-generated artifacts in ML processes. Dellerman et al. (Dellermann et al., 2021) focuses on human intervention in AutoML technology; their work most closely approximates ours in spirit and uses the same methods that we do to develop a taxonomy. However, these taxonomies primarily focus on the model optimization phase, whereas ours is considered an end-to-end data science process, from preparation to communication. Taxonomies from the Human-Computer Interaction (HCI) and Computer Supported Cooperative Work (CSCW) communities(Karmaker et al., 2021; Wang et al., 2021b) propose ways for marrying different levels of automation, across an end-to-end data science process, with human collaboration. Karamaker et al. (Karmaker et al., 2021) propose six automation levels depending on the extent of successfully automated tasks. Their appendix provides a detailed view of different ML approaches, the scope of automation, and the role of human interventions. Wang et al.. (Wang et al., 2021b) suggest similar levels of human-directed and system-directed automation, which they describe within a larger human-in-the-loop AutoML framework.
2.1.3. Visualization of ML Provenance, Traceability, and Models
As our approach explores how artifacts can be surfaced via data visualization, we consider prior research in the visualization community. Sacha et al. (Sacha et al., 2019) formulate an ontology for visualization-assisted ML, which fits into the paradigm of human-in-the-loop ML/AI. It represents artifacts as input and output entities that constitute data, models, or knowledge; however, they do not provide more granular information on the properties of these entities. Spinner et al. (Spinner et al., 2020) presents a framework for explainability in visual and interactive ML whose processes align with those of automated data science processes driven by AutoML technology. They also primarily view artifacts as input/output entities but do not further define what those entities are.
2.1.4. Bridging the Gap
These different taxonomies, ontologies, and frameworks share the goal of defining a set of entities and actions across automated data science work. However, they lack a consistent description of entities generated or shared across data work. We propose artifacts to be this entity. By developing our taxonomy, we argue that our research can help bridge these prior works.
2.2. AutoML Visualization Systems
Interaction and visualization of machine learning pipelines both facilitate user engagement and intervention and build trust in the results of an ML process (Boukhelifa et al., 2020). Many visualization tools for AutoML have emerged in recent years. ATMSeer (Wang et al., 2019a) performs an automated search for machine learning models and visualizes the summary statistics from the search space for end-users with an automatically generated dashboard of linked views. ModelLineUpper (Narkar et al., 2021) also uses multi-linked views of different visual encodings to compare ML models generated by AutoML processes. AutoVizAI (Weidele et al., 2020) similarly explores the narrow scope of model configurations but uses conditional parallel coordinate plots to visualize the model generation across possible configurations. Lastly, Visus (Santos et al., 2019) targets how domain experts specifically can tackle model building using AutoML.
Other systems view AutoML processes more broadly, beyond the modeling phase. PipelineProfiler (Ono et al., 2021) integrates with Jupyter notebooks and provides an overview of the results using a matrix juxtaposed with aligned views to indicate the different components and outputs of the AutoML pipeline in each step. AutoDS (Wang et al., 2021a) uses a network diagram to show different possible ways to configure an end-to-end AutoML pipeline. AutoDS exists as a stand-alone tool or embedded with a Jupyter notebook. The Boba (Liu et al., 2021) system and its underlying DSL use a similar visual design to AutoDS for visualizing the stages and results of different data science processes. The design inspiration for Boba builds off of earlier user studies conducted by Liu (Liu et al., 2017) that visualized the analysis patterns of data workers via a network diagram. Swatai et al. similarly found that network diagrams effectively capture varied user paths through interactive analytic flows (Mishra and Rzeszotarski, 2021). Xin et al. (Xin et al., 2018) have leveraged this graph structure to develop techniques for inserting humans into automated machine-learning processes. Research is also oriented toward capturing user interactions with visual analytics systems; Knowledge Pearls (Stitz et al., 2019) and Trrack (Cutler et al., 2020) are two examples that also use an underlying graph to manage and visualize analysis paths.
Through our taxonomy, we aim to broaden what artifacts are visualized with additional context about the artifact’s origin, dependencies, and history. We draw inspiration from the visual encoding choices of these prior systems in the implementation of AutoML Trace (Section 6).
3. Traceability for Human-Machine Collaboration
Tracing the collaborative relationship between humans and ML/AI processes is essential for ensuring the entire process of data work is transparent and scrutinizable, not just the end product (i.e., the model or result) (Winfield and Jirotka, 2018). The traceability of artifacts has been explored in software and design engineering contexts (Rogers et al., 2021; Sundaram et al., 2010), the social sciences (Kreiner, 2002; Lee, 2007), and knowledge management communities (Tiwana and Ramesh, 2001; Fischer and Otswald, 2001; Mariano and Awazu, 2016) for some time and has more recently been explored for machine learning (Mora-Cantallops et al., 2021; Schelter et al., 2017; Cambronero, 2021). However, the definitions of traceability vary widely. Here, we define traceability for ML/AI as encompassing provenance, transparency, and context. Provenance is the process of recording individual artifacts and their origins; what generated the artifact and other artifacts dependent upon it. Transparency concerns the ability to understand how the model arrived at its conclusions. Finally, context indicates where the artifact exists with the analysis. Here, we propose tracing artifacts within data work, from preparation to communication phases, resulting from human-ML/AI collaboration across these phases over time. We consider an artifact to be traceable if there is a clear definition of what it is, how and when it was generated, and there exists a lineage of how it has changed.
4. Motivation and Methodology for an AutoML Artifact Taxonomy
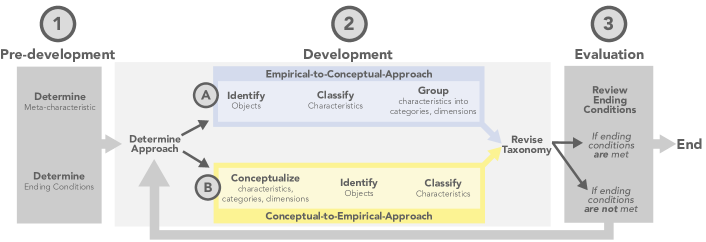
Taxonomies are a widely used system of knowledge organization that hierarchically groups concepts into logical associations based on shared qualities (Nickerson et al., 2013; Prat et al., 2015). They provide a common language to speculate and build upon concepts that facilitate communication within a team of diverse experts (Salmons, 2008). Prior data visualization research has used taxonomies of tasks (e.g., (Brehmer and Munzner, 2013; Lee et al., 2021b; Valiati et al., 2006)), data (e.g.,(Beck et al., 2017)), and visual techniques to motivate tool development. Taxonomies for AutoML and human-ML/AI collaboration have similarly been developed (see Section 2), but their influence on tool development is tenuous, lacking a consistent mechanism for development. As a result, the robustness of taxonomies in the literature can vary considerably in their quality and scope. Our taxonomy integrates and reconciles existing taxonomies, frameworks, ontologies, as well as artifacts of existing and theoretical systems, to provide a comprehensive set of AutoML artifacts. We have adopted a robust methodology from the information systems research that evaluates conciseness, robustness, comprehensiveness, extensiveness, and explainability (Nickerson et al., 2013; Prat et al., 2015). As part of our taxonomy contribution, we describe our development approach, summarized in Figure 2, to motivate the importance of robustness in taxonomy creation.
4.1. Methodology Overview
Nickerson et al. (Nickerson et al., 2013) and Prat et al. (Prat et al., 2015) define a multi-phased and integrated approach to defining and evaluating a taxonomy. Their approach is rooted in their definition of taxonomy as a set of objects classified according to taxonomic descriptors, which are a hierarchical set of dimensions, categories, and characteristics. Objects can refer to a variety of things, for example, living creatures, types of products sold in a store, or artifacts (as is the case here).
They define three phases of taxonomy creation: pre-development, development, and evaluation. The pre-development stage defines a meta-characteristic for the taxonomy objects and set of ending conditions for concluding taxonomy development. The subsequent development stage takes either an empirical-to-conceptual or conceptual-to-empirical approach to define objects and their properties. Finally, in the evaluation stage the taxonomy is assessed through an iterative process through a combination of objective and subjective criteria.
Reflecting on their methodology, Nickerson et al. (Nickerson et al., 2013) emphasizes that a taxonomy is a ‘design search process’ with an intractable solution. However, they argue, and we agree, that their methodology improves the resulting taxonomy’s transparency, robustness, and extensibility. Here, we detail the choices we made through these taxonomy development stages. Artifacts of our research processes, which include notes, documents, and materials, generated across the 8 iterations of taxonomy development are available online 111https://osf.io/3nmyj/?view_only=19962103d58b45d289b5c83421f48b36. This is an OSF view-only link for the review process, meaning it does not collect any data that could identify reviewers. Due to limitations of space, additional details of our taxonomy and its development are presented in the Supplemental Materials and annotated here with [SM1] (these are also clickable links). A full description of these supplemental materials appears at the end of this manuscript.
4.2. Pre-development Stage
4.2.1. Defining a Meta-Characteristic.
The taxonomy development process is initiated by delineating a concrete definition of a meta-characteristic that describes the objects under study (Figure 2.1). In our research, we define an object in the taxonomy to be an AutoML artifact that is generated and exchanged by a human or AutoML-driven task, which occurs across an end-to-end data science workflow encapsulating processes for data preparation, analysis, model deployment, and communication.
4.2.2. Defining Ending Conditions.
We defined an a priori set of object and subjective ending criteria to evaluate our taxonomy upon each development stage (Figure 2.1). If these criteria are met in the evaluation stage, we conclude our taxonomy development. The taxonomy’s structural stability across iterations is also part of the objective ending criteria. To meet this ending condition, our taxonomy should conform to the following criteria:
-
(1)
No new dimensions, characteristics, or objects (artifacts) are added or modified from the previous iteration
-
(2)
No new dimensions, characteristics, or objects (artifact) were merged and split
-
(3)
At least one object (artifact) is classified under every characteristic of each dimension
The subjective ending conditions are defined by Nickerson et als (Nickerson et al., 2013) as the minimum criteria for the utility of a taxonomy. These subjective conditions include conciseness, robustness, comprehensiveness, extensibility, and explanatory. As these are subjective criteria, they serve as a function to reflect on the taxonomy’s internal validity.
4.3. Development Stage
The development stage begins with either an empirical-to-conceptual (Figure 2.2.A) or conceptual-to-empirical approach (Figure 2.2.B). In the former, objects are identified from an available data source, classified via quantitative (i.e., statistical clustering) or qualitative (i.e., thematic analysis) methodology, and grouped according to an emergent set of properties (characteristics, categories, dimensions). While in the latter approach, a set of properties are conceptualized and used to identify data sources and objects that are then subsequently classified. The approach taken can be different at the start of each development stage. We used primarily an empirical-to-conceptual identify objects for analysis.
4.3.1. Literature Sources
We define both human and machine generated artifacts in automated data work from the research literature spanning Machine Learning, Human Computer Interaction, Computer Supported Collaborative Work, Information Visualization, and Visual Analytics. We sampled the research literature using two approaches. First, we gathered an initial set of 13 convenience sample papers, familiarized ourselves with the methodology, and created an initial taxonomy. The convenience sample was papers already known to the authors and from quick searches for “artifacts AutoML”, “taxonomy AutoML”, “capturing AutoML” and “visualizing AutoML” and subjectively selecting papers to discuss. Next, we identified a systematic set of published research and pre-prints on “AutoML”. The search was current to June 14th, 2021, and retrieved 153 articles from venues such as KDD, AAAI, NeurIPs, CHI, and others. Most publications were retrieved from arXiv (100 of 153; 65%) and dated within the past two years. A complete list of all sources used in our analysis and documentation on how they were used is found in online materials. We conducted an initial scan of all 153 papers. Based on this scan, we then developed inclusion and exclusion criteria. We excluded papers that were too narrow in scope because they focused on a highlight-specific technique. The list of literature sources in available in [SM2].
4.3.2. Object Classification
We identified and extracted approximately 400 items from literature sources that could represent human or machine-generated artifacts. First, we coarsely classified these items into phases of a data workflow (preparation, analysis, deployment, and communication) (Crisan et al., 2021). Within these phases, we further classified items into artifact groups. Finally, we used this grouping to ideate a set of artifact properties. We use open and axial coding techniques to derive the set of characteristics, categories, and dimensions that describe the artifact’s properties. We used descriptions and definitions from the object’s literature source text for this coding exercise.We combined separate items as definitions for artifacts and their properties became clearer with each coding iteration (i.e., T-SNE and PCA were combined into mapping transformations artifacts because they both map data from a higher to lower dimensions). From the initial set of 400 items, we distilled into a set of 52 artifacts. A full list of artifacts and their classification is available in [SM1] and [SM1-F].
4.4. Evaluation Stage
After each development stage, we assessed whether we met our ending criteria ( Figure 2.3). Per our definitions from (Nickerson et al., 2013) and (Prat et al., 2015), the taxonomy is concise, robust and comprehensive if, at the conclusion of a development stage, objects can be comprehensively classified with a sufficient and not excessive, set of dimensions, categories, and characteristics. It is extensible if new dimensions, categories, and characteristics can be easily added throughout iterations. Finally, it is explanatory if it can be used to describe the nature of objects.
Our taxonomy development required eight iterations before it met the ending conditions. Both authors read the literature sources, extracted artifacts that met the definition of the meta characteristic, classified those items, and finally grouped them according to an evolving set of artifact properties. The authors met and discussed their individual classifications daily for a month. While we arrived at a consensus, we did not attempt to resolve all conflicts, ambiguities, or divergent interpretations exhaustively.
5. AutoML Artifact Taxonomy
Our taxonomy comprises 52 artifacts clustered within eleven groups by their properties. We defined the properties of these artifacts according to a set of 4 dimensions, 17 categories, and 41 characteristics. Importantly, no single AutoML system contains all of these artifacts (Karmaker et al., 2021). Instead, we rely on an amalgamation of design decisions made by individual AutoML toolkits, systems, and theoretical research papers. We argue that by looking broadly at existing systems, what they are, and what they aspire to be, our taxonomy can extend to systems not yet developed. A summary of artifacts, their groupings, and the data science processes they belong to (in addition to interactive processes) is in Figure 3.
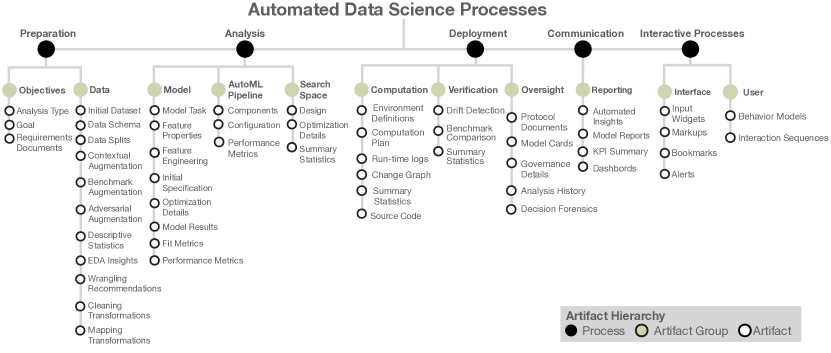
A hierarchical diagram that summarizes Artifacts and examples elicited from AutoML toolkits, libraries, systems, and user studies. We summarized 4̃00 artifacts from these sources into 11 Artifact Groups and 52 artifacts. The artifact properties are further delineated according to a taxonomy and a hierarchical set of dimensions, categories, and characteristics.
5.1. AutoML Artifacts
5.1.1. Artifacts and Processes of Data Science Workflows
As innovations in AutoML systems expand, so does the scope of task automation. As of this writing, many proposed systems do not exist for practical use (Karmaker et al., 2021). Leveraging a prior framework, we define an end-to-end data science workflow as comprising preparation, analysis, deployment, and communication processes. These stages also align with defined tasks and automation levels for AutoML systems proposed by Karmaker et al. (Karmaker et al., 2021). Likewise, AutoML systems composed of data science primitives (Heffetz et al., 2020; Ono et al., 2021) are similarly compartmentalized within these processes. While we imposed these processes on artifact classification (Section 4.3), we also found that most artifacts typically fit into one process. For example, the initial dataset is an artifact, typically supplied by a human, in the data preparation phase – future AutoML systems may be able to find these datasets for data workers. The artifact would occupy that preparation phase, but its properties would reflect its machine progenitor. Conversely, a dashboard of the model’s results is an artifact that exists in a communication process and likewise can be meticulously curated by a human or be automatically generated (Hu et al., 2019).
AutoML artifacts are more than inputs and outputs to tasks within these data processes. Artifacts can also be metadata or other documentation created for or by data science processes. Prior work has examined metadata in machine learning or software systems and how they relate to provenance (Section 2.1). For example, organizational processes create human requirements documentation, a human-generated artifact that can directly dictate data analysis objectives and impact the choice of dataset or model.
5.1.2. Groups of Artifacts and Individual Artifacts
We now describe artifact groups and examples of individual artifacts according to their data science processes. For an illustrated example of the artifact property hierarchy, see the breakdown for the “requirements document” artifact in Figure 4. While the processes are presented linearly here, in reality, they can occur in any order.
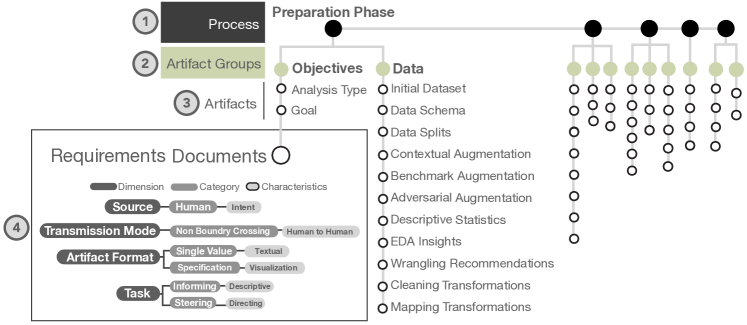
Preparation processes have two artifact groups: objectives and data (Figure 4.2). Data work begins with some objective that can be expressed in the form of analysis goals, requirement specifications, or tasks (Hong et al., 2020a; Gijsbers et al., 2019; Lam et al., 2018). Goals can also be translated to tasks (Karmaker et al., 2021; Brehmer and Munzner, 2013; Wong et al., 2018) and intents (Gadhave et al., 2020; Setlur et al., 2019) that further define specific analysis objectives. These objectives are necessary to define the dataset for analysis and any transformations or augmentations to the initial data and its schema representation (Dellermann et al., 2021). These transformations can result from data cleaning or wrangling operations (Kasica et al., 2021), data splits (Zhang et al., 2020b), or mapping transformations. We also observed that additional datasets are recruited in the preparation stage to further benchmark model performance (Zöller and Huber, 2021; Gijsbers et al., 2019) or evaluate its robustness. Augmentations to the data can include human-supplied semantic annotations (Estevez-Velarde et al., 2019). We observed that the preparation stage is still largely dominated by the activities of a single human or multiple humans working together. These activities are presently the most time-intensive of data work (Crisan and Fiore-Gartland, 2021), but also the most consequential (Sambasivan et al., 2021). As part of data preparation, we include exploratory data analysis that produces either automated or human-curated summaries, including descriptive statistics and visual summaries (Wongsuphasawat et al., 2016).
Analysis processes are most extensively covered by prior literature and encapsulate what many consider to be AutoML’s core functionality. We define four groups of artifacts of analysis: those pertaining to the individual model, an individual AutoML pipeline configuration, the search space of all possible pipeline configurations, and finally computation. The first set of artifacts concerns the model, which includes its task (i.e. classification, regression, clustering, or the various more nuanced tasks of neural networks) aspects of feature encoding (Yao et al., 2019; Yang et al., 2020a; Karmaker et al., 2021; Cambronero, 2021), generation(Wang et al., 2021b; Zimmer et al., 2021), and selection, as well as model optimization (Yang et al., 2019; Olson et al., 2016; Thornton et al., 2013) (within which we include the architecture of a model like a deep neural network (Jin et al., 2019; Zimmer et al., 2021)), and performance assessment (Wang et al., 2021b).
However, the model is only one component (Yang et al., 2020a; Wang et al., 2020) or primitive (Heffetz et al., 2020; Ono et al., 2021) of an AutoML pipeline. The pipeline itself is determined by a broader search space of possible alternative configurations (Zöller and Huber, 2021; Heffetz et al., 2020; Wang et al., 2019a, 2020; Alletto et al., 2020; Yao et al., 2019; Feurer et al., 2020; Salvador et al., 2016). Tools that visualize AutoML systems increasingly focus on the search space and pipeline configurations (Wang et al., 2019a; Ono et al., 2021). These two sources of artifacts compound the selection of the final model as they determine the scope of what form it may take. These three artifact groups, the model, pipeline, and search space, share similar artifacts, including preliminary configurations, performance assessments, optimization summaries, and a descriptive summary of the fit (or search) computation.
More recent AutoML systems place computation more prominently in the analysis stage. While these can include source code (Wang et al., 2021b; Cambronero, 2021) (including analysis notebooks), they also include system configurations and environments (Cambronero, 2021). Recently, computational budgets (Wang et al., 2019a) are used to calibrate model performance against computation time.
We observed that AutoML systems automate as much of the analysis as is reasonable but include avenues for human intervention. The complexity of AutoML systems makes it increasingly difficult to trace how it arrived at the choice of a model unless the full spectrum of artifacts is considered. For example, a system that searches a space of possible AutoML pipeline configurations is dependent on both the initial configuration and the set of primitives available to it. Imposing a computational budget will also limit the extent of the search space explored.
Deployment processes apply a final model to a production environment. We identified two groups of artifacts for deployment: those concerning verification and oversight. Verification artifacts result from monitoring the performance of a model (both before and after deployment) (Wang et al., 2021a). They include the generation of summary statistics, explicit comparisons to existing benchmarks (Zöller and Huber, 2021; Zimmer et al., 2021; Zhang et al., 2020b), and the detection of model drift or anomalies (Celik and Vanschoren, 2021; Elshawi et al., 2019; Spinner et al., 2020). These artifacts are important to capture changes in the model over time and frequently feed into the oversight artifacts. These oversight artifacts include documentation that describes the model’s characteristics, for example, a model card (Mitchell et al., 2019), decision forensic reports (Wang et al., 2021a), provenance artifacts of use (Spinner et al., 2020), as well as documents governing the use the model (Crisan and Fiore-Gartland, 2021; Wang et al., 2021a). Oversight artifacts provide a key point of knowledge sharing where humans monitor the model to ensure it is responsibly applied (Wang et al., 2021a). Moreover, these artifacts, automatically generated by an analyst, provide important avenues for humans to intervene in automated work. For example, suppose a deployed model in production begins to exhibit poor performance on benchmark datasets. In that case, oversight artifacts can initiate a process where a human returns to the analysis and manually re-initiates the model fitting processes.
Communication processes artifacts in our taxonomy are primarily documents, both static (i.e., a report) or interactive (i.e., a dashboard) to report information. While communication encompasses humans communicating with each other, AutoML systems must also communicate with humans. Once again, there is an opportunity to learn from human-human communication to make human-machine communication more effective. Communication artifacts include an automated summary of insights or an explanation for the model’s decision-making. Modeling explanations are automatically produced and are increasingly crucial for transparency (Wang et al., 2021b; Sperrle et al., 2021; Mittelstadt et al., 2019; Spinner et al., 2020).
Interactive processes are an outlier relative to other processes. We believed they should be treated separately as they represent distinctly human actions that can not be automated but seek to influence automated processes. Many artifacts in other phases can be generated by some combination of human or machine actions. We separate interactive processes into the artifacts of the graphical user interface and the user themselves. Elements of the user interface include bookmarked or saved insights (Wongsuphasawat et al., 2016; Cutler et al., 2020), annotations (Cutler et al., 2020; Souza et al., 2019; Estevez-Velarde et al., 2019). Humans can also trigger or modify automated processes (Celik and Vanschoren, 2021) across data science processes. Increasingly, these user actions are captured as behavioral graphs, interaction logs, or interaction sequences (Battle and Heer, 2019; Hong et al., 2020a; Cashman et al., 2019; Stitz et al., 2019), that can be visualized (Stitz et al., 2019; Cutler et al., 2020), to influence a machine learning component through semantic interactions (Gehrmann et al., 2020; Endert et al., 2012).
5.2. Artifact Properties
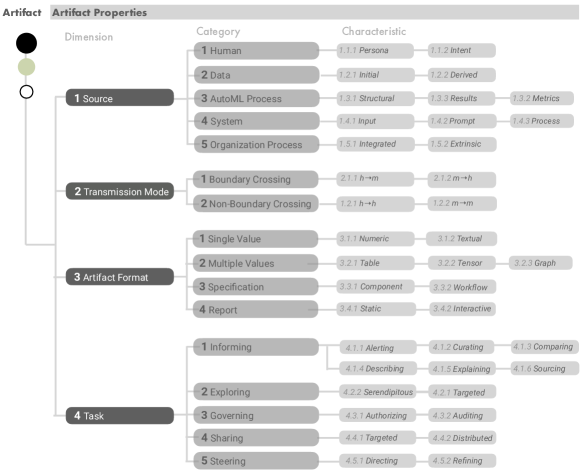
A hierarchical diagram that summarizes Artifact properties are a set of hierarchical taxonomic descriptors. The top level of this hierarchy is a dimension, followed by category, and finally characteristics.
The AutoML artifacts described in the previous section were determined by their properties. We used the initial set of 400 artifacts collected from the literature to derive a set of properties that allowed us to further group them into a smaller set.
The complete set of artifact properties is shown in Figure 5, but to avoid excessive repetition, a detailed breakdown of artifacts and their characteristics is in Appendix A. While the initial goal of taxonomization was to describe artifacts, we also found it useful for properties to be able to compare them as well. For example, two AutoML pipelines may include a feature generation phase, which would produce a common artifact of a feature set. However, feature generation can be done automatically in one pipeline, whereas in the other, it is the job of a human. In both pipelines, the subsequent hyperparameter tuning may be done automatically. We endeavored for our taxonomy to describe a broad design space of AutoML systems; both implemented and theoretical.
At the top level, our taxonomy has four dimensions that answer the following four questions: “What generated the artifact?” (Source), “Does it cross the boundaries between human and AutoML processes” (Transmission Mode), “What shape does the artifact take?” (Artifact Format), and finally, “What is its intended purpose?” (Task).
The Source of an artifact indicates by whom, or what, it was produced. We identified five sources: humans, an organization of humans, the data, AutoML processes, and the computational system. The first two sources distinguish between humans, acting individually and collaboratively, and a general set of organizational practices (i.e., business practices, legal or regulatory requirements) that can influence these people. Calculations, transformations, and other derivations from the initial dataset also produce new artifacts. Finally, AutoML processes and the computational infrastructure supporting that automation produce complementary but separate artifacts. For example, the former might produce a running summary of the model’s loss, whereas the latter records and returns code failures or when computational budgets have been reached.
The Transmission Mode properties describe whether the artifact has crossed boundaries between human and AutoML sources and in which direction. We have prioritized artifacts that are likely to transmit between humans and machines () and vice-versa (); we determined directionality from reading the literature sources. Some artifacts that do not cross boundaries in the specific AUtoML system are critical to include as they add context to boundary cross artifacts.
The Artifact format property enables comparison between different AutoML pipelines. In our taxonomy development, we observed that artifact formats were closely tied to the design choices of AutoML systems. For example, AutoML systems that targeted an ML-expert end-user had artifacts limited to single values, texts, or tensors when displaying this information. Those that target domain experts presented the same data visually or interactively. We summarize four formats: single values, multiple values, specifications, and reports. Visualization systems and dashboards that we discuss in Section 2 are considered reports that have either static or interactive characteristics.
The Task describes the affordances of the artifact. We proposed four categories of tasks: informing, governing, sharing, and steering. Artifacts that inform, and describe the prior or current state of the data science pipeline. These can include reports, summary statistics, or a dashboard (among other possibilities). Governing artifacts are specific to regulating, auditing, and monitoring both automated and human-driven work. Sharing artifacts are intended to be distributed amongst humans, not just between analysis and the AutoML system. Finally, steering artifacts intervene anywhere in the data science pipeline to make a change. These artifacts result from human or automated processes acting on, for example, an alert to a data quality issue.
5.3. Further Extension
The taxonomy itself can be further expanded over time, accommodating new artifacts that emerge as the capabilities of AutoML systems expand or to include highly bespoke qualities of specific system implementations. As we developed our taxonomy, we constantly reflected on its extensibility as part of our evaluation criteria. Specifically, as we merged the many different prior taxonomies specific to AutoML and machine learning (Dellermann et al., 2021; Taman et al., 2018; von Rueden et al., 2021), typologies of visual analysis (Brehmer and Munzner, 2013; Lam et al., 2018), and other classification systems (Sacha et al., 2019; Karmaker et al., 2021; Souza et al., 2019; Sperrle et al., 2021), we scrutinized stability of our taxonomy to incorporate these changes. Moreover, our stopping criteria were predicated on the stability of the taxonomies structure. We rely on future work to continuously reflect on its extensibility, as the present taxonomy incorporates currently available and relevant prior research.
6. AutoML Trace
We operationalize our artifact taxonomy through the creation of AutoML Trace, an interactive visual sketch (Greenberg and Buxton, 2008). Visual sketches are lower fidelity compared to more complex interactive prototypes but serve an important role in facilitating co-creation activities between researchers and their collaborators (Sanders and Stappers, 2014). By comparison, Sanders et. al. (Sanders and Stappers, 2014) define prototypes to be more mature in their conception and execution, which, in concurrence with Buxton and Greenberg (Greenberg and Buxton, 2008), can be counterproductive for co-creation and ideation. In this spirit, we develop ÃutoML Trace to investigate the utility of applying our taxonomy to the visual analysis of an existing AutoML system. Although our goals are ultimately to develop AutoML Trace with the purpose of facilitating a dialogue with our collaborators (presented in Section 7), AutoML Trace, together with our taxonomy, can be repurposed to analyze AI/ML systems more generally. We especially aimed to emphasize the human element through the capture of artifacts and the delineation of their properties to illuminate human-ML/AI collaborative processes within AutoML systems. This section describes (1) how our taxonomy enables us to identify, classify, extract, and visualize both human and machine-derived artifacts (2) the overall design of our interactive sketch, AutoML Trace, including the data and tasks it supports.
6.1. Operationalizing our Taxonomy
Our AutoML artifact taxonomy captures human and machine-derived artifacts in an end-to-end pipeline of data work, from preparation to communication. Individual artifacts and their properties allow us to accommodate different degrees of automation, from human-driven to fully automated, and the hybrid modes in between (Parasuraman et al., 2000; Crisan and Fiore-Gartland, 2021; Karmaker et al., 2021). In hybrid automation modes, we capture the directionality of work — from humans-to-machine processes () and vice-versa (). With the addition of temporal information, we use our taxonomy to derive both the context and the time of artifacts’ creation. By continuously capturing artifacts across an automated data work pipeline, we can show the evolution of data work and human-ML/AI collaborative processes over time.
6.1.1. Artifacts utilized in AutoML Trace
We used artifacts captured from the enterprise team’s AutoML pipeline within our interactive sketch. Using their artifacts directly not only provided an example of how our taxonomy can be operationalized with a live system, it promoted meaningful engagement with data important for the team’s AutoML tool development. The first step to operationalize our taxonomy is to leverage it for identifying and characterizing artifacts from the AutoML system. Some artifacts can be captured programmatically as inputs to AutoML systems or outputs from different APIs. For example, a human can specify goals or targets through an interactive interface. Alternatively, AutoML processes can initialize and traverse a search space to find optimal sets of model parameters. Both the user input and the search space exploration can be captured from system logs. Other artifacts are manually captured. For example, documents that state a system’s requirements or presentations communicating the results need to be captured from an existing document management system or other curation efforts. As these items are captured, either automatically or through curation efforts, the context of their creation (e.g., preparation, analysis, deployment, or communication stage) is provided through the taxonomy’s structure and the artifacts’ properties.
Our taxonomy allows us to identify the way in which these artifacts are generated and assign properties to them via manual annotation. For example, designers and ML/DS engineers can discuss the various inputs and outputs in the workflow, identify the type of artifact it may be, and describe them consistently with the taxonomy’s controlled vocabulary. AutoML Trace can support this process by defining a default template of artifacts and visually indicating what is captured or absent. However they are captured, the final result is a collection of artifacts traded between humans and automated processes in data work. Though we used a specific pipeline from the team’s AutoML system in AutoML Trace the captured artifacts are characterized by properties of our taxonomy developed for a range of AutoML systems. Considering the scaffolding provided by the taxonomy for artifacts, AutoML Trace remains applicable to other pipelines. Future work would provide evaluation of the interactive sketch for engagement with other pipelines as well as provide further automation of the artifact annotation process.
6.1.2. Tracing the chronology, dependencies, and variability of artifacts.
In addition to the creation context, we can collect a timestamp of artifact creation that enables us to examine the order of their creation and dependencies. For example, feature generation artifacts serve as inputs to model fitting. We can also examine how artifacts change over time. For example, say the initial set of features was generated automatically by an AutoML algorithm, a human examining the artifact decides to update these features with their own manual selection. Now, two versions of the artifact exist. Through the artifact’s properties, it is possible to identify that the first version of the artifact was created automatically, but the subsequent version resulted from human intervention.
6.1.3. Describing and comparing human-ML/AI collaborative analyses.
Collaboration between human and ML/AI systems makes it hard to audit and compare analyses. We propose that by annotating analysis through our artifact taxonomy, we directly describe and compare the different analytic choices and deduce some level of automation, from full automation to none and varying degrees in between (Parasuraman et al., 2000; Lee et al., 2019; Karmaker et al., 2021).
6.2. Data and Tasks
We use both the individual artifacts and their collective metadata as an input dataset for AutoML Trace to visualize. Individual artifacts come in different formats that influence how they are captured and how they are visualized to the end users; we define these different formats in our taxonomy as part of the properties of an artifact (Figure 5.2). The taxonomy along with additional information, such as timestamps and pipeline structure, define the metadata for a collection of artifacts. To facilitate an engaging, collaborative dialogue around these artifacts, we define a set of tasks that our interactive visual sketch should support:
-
•
T1 Present a Contextual Overview of Artifacts: The contextual overview ties the artifact creation with its specific data science phase (see Section 3). Whether an artifact was generated automatically or by a human was important – this consideration would become a key component of the AutoML Tracedesign. The dependencies of artifacts on each other were also an important contextual component.
-
•
T2 Locate an Artifact: Enable end-users to filter out artifacts they are not interested in and to focus on a specific artifact, or group of artifacts, that are of interest to them.
-
•
T3 Summarize the Details of the Artifact: Artifact details, like its properties and dependencies, should be progressively revealed to the end-user. Similarly, an artifact’s taxonomic descriptors should reveal artifacts that share the same properties, not just those that a selected artifact depends on.
-
•
T4 Compare an Artifact over its History: The end-user should be able to compare the states of an artifact over time and relative to its upstream and downstream dependencies.
These tasks align with those for information seeking that were defined by Shneiderman (Shneiderman, 1996) (Overview, Zoom, Filter, Details on Demand, Relate, Histories, and Extracts), but described using a terminology of more recent task typology defined by Brehmer and Munzner (Brehmer and Munzner, 2013).
6.3. AutoML Trace Interface
AutoML Trace takes a collection of artifacts and their metadata as input for visualization. It has three complementary views : Origin (Figure 6), Dependency (6), and History views (7). The encoding choices for the artifacts were the same for all views to maintain a consistent visual language. The artifacts are represented as circles, color-coded by their origin (human or machine), and aligned by the Data Science phase (preparation, analysis, deployment, and communication). These views are inspired by the graph and network visual approaches from prior AutoML systems and studies (see Section 2), although we did consider alternative designs (see Supplemental Materials - [SM4]). As this is an interactive sketch, we do not exhaustively compare it against other design alternatives.
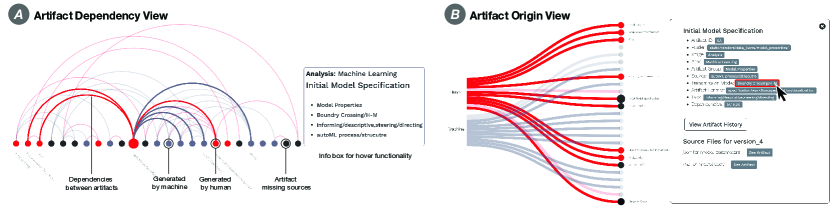
Origin View: What artifacts are human versus machine-
generated? The artifact origin view shows the artifacts collected from the AutoML system analysis in the context of whether they were generated by a human or automatically 6. We use an alluvial diagram to show the flow and trade-off between the origins of the artifact (T1 (Present)). We emphasize human and machine-generated artifacts as a focal point of this view as a way to showcase the interleaving collaborative processes.
Hovering triggers additional taxonomic details to be revealed on demand via an information card (T3). End-users can further hover on the taxonomic descriptors and contextual data such as dependencies and data science stage (T2). Once an artifact is selected, end-users can also view the raw source file outputs for the artifact.
Dependency View: What artifacts are dependent on one another? The dependency view show the relationships between artifacts(Fig. 6). The design of this view is inspired by the illustration of Data Cascades (Sambasivan et al., 2021); indeed, this view is a direct response to surfacing those cascades through artifacts. Similar to the origin view, the end-user is presented with an overview (T1), and information is revealed via hover actions (T3). However, in this view, selecting an artifact highlights its dependencies (T2).
Version History View: How did changes in one artifact influence changes in other artifacts? This view is used to drill down into artifact histories and understand how changes in one artifact could influence changes in dependent artifacts (Figure 7). Users can view the artifact history by selecting a given artifact in either the Origin or Dependency view. This view enables end-users to T4 (Compare) and the artifact itself over time as others. In Figure 7, there are four horizontal lines, which correspond to four revisions, or iterations, of the analysis. New artifacts or those modified by the update are represented as circles. Those that did not change are shown as a downward triangle. The dependencies for a selected artifact are also drawn. Like the previous two views, hovering reveals additional taxonomic descriptors of the artifact.
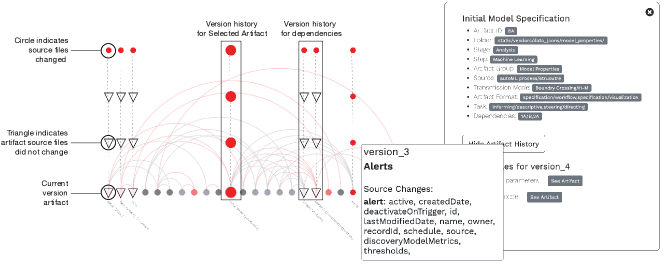
Artifact History View. This view shows the history of the selected artifact, differentiated by analysis versions. From the dependency view, the histories of the selected artifact dependencies are also shown. This example shows the history of the selected artifact “Initial Model Specification”. The tool-tip shows details for the third version of the “Alerts” artifact, which is a dependency of “Initial Model Specification”.
7. Usage Scenario
We present a usage scenario with a team of enterprise software developers where we use our taxonomy and AutoML Trace to explore and analyze their existing AutoML system. Our collaborators goal was to analyze their existing AutoML systems to understand when, what, and how end-users of their system intervened or overwrote the decisions of the AutoML system. At present, they had not mechanism for this interrogation. We describe how AutoML Trace supported dialogue during discussions with the team to reflect on the systems’ present capabilities and ideate around outstanding end-user needs. These discussions lasted one hour and occurred at a cadence of every two weeks for approximately a 3 month period. The entire team joined the meetings and discussions. In these conversations we presented collaborators with our analysis of their AutoML system as artifacts that we collected and annotated using our taxonomy. We refined both our collection of artifacts and the visual design of AutoML Trace in response to collaborator feedback and discussion.
7.1. Collaboration Context
Overview of the existing system. Their AutoML systems could automate aspects of data work from preparation to deployment (Section 3), including surfacing automatically flagged insights for exploring data, feature generation, and automated model selection. A graphical user interface (GUI) guided end-users through the analysis and revisions of the results. The end-user could intervene to modify the analysis, for example, change the model type, via input widgets and interactions through the GUI. Certain aspects of the system also required explicit human input before initiating an automated process. For example, the systems would surface multicollinearity (in a non-technical manner) and required that the end-user confirm which features to remove from the analysis. The end-users could deploy a model to be used by others; automated processes would also monitor for concept drift and, if necessary, alert the end-user to trigger updates.
Team composition and collaboration goals. Our collaboration had two primary goals. First, for the team to reflect on their existing system and better understand what AutoML systems are capable of. Our taxonomy created an avenue for this reflection by providing a structured vocabulary to describe their system and compare it to others. The second goal was to examine what the additional traceability would add to their system. The project team consisted of software engineers, designers, user researchers, and a project manager. We also recruited one customer of their system for additional feedback. The team worked together to implement different components of AutoML work and implement the system.
7.2. Artifact Identification, Classification, and Extraction
We briefly describe how we analyzed our collaborator’s existing system to develop a collection of artifacts visualized with AutoML Trace.
Generating Artifacts. Within the GUI environment of the AutoML system, we created an end-to-end data analysis. We began with preparation and concluded with communication. During this process, we returned to earlier steps and made modifications. For example, we did not initially apply automatic data-cleaning recommendations but did so in a subsequent iteration. We also let the system pick features for the model in the first iteration and subsequently changed them. Carrying out this analysis had three goals. First, to produce a variety of possible artifacts, second, to document dependencies between artifacts, and finally, to observe how artifacts change in response to user interactions. The result was a set of artifacts derived from the same analysis that changed over time.
Collecting Artifacts. We used APIs developed by the team to collect a set of JSON files for our analysis. We used the API outputs over other approaches (i.e., usage logs) because these outputted the entire artifact, making it easier for us to classify the artifact according to our taxonomy. We additionally stored the order in which objects were created and could establish the dependencies of artifacts (Section 6.1.2). Like many existing AutoML systems, they did not explicate any human involvement. We had to manually record when an artifact was generated or modified by human intervention needed. In the infrequent instances where we could not capture all aspects of the analysis, but we deemed an artifact was important, we took a screenshot of the artifact. For example, some of the automatically generated insights for data exploration had visualizations that could not be extracted from the APIs, so we took screenshots instead.
Classifying Artifacts We annotated the files from the API calls or screenshots using our artifact taxonomy. However, in most instances, a single file contained multiple artifacts. For example, an API call for information on the initial dataset returned this information along with information on recommended wrangling transformations. The authors first identified artifacts from these APIs by manually inspecting them in a simple development environment - demarcating and marking up instances of artifacts. Next, the authors examined each of the artifacts individually and classified them according to our taxonomy, modifying their properties as was pertinent to analysis (i.e., whether it was human or automatically generated). Finally, we examined and recorded the dependencies among artifacts. The authors repeated these two steps until they reached a consensus on the artifact type and its properties; we also engaged with our collaborators to verify that our artifacts were accurate. A final list of artifacts and their taxonomic annotations is available in the Supplemental Materials ([SM3]); this list served as a backbone of our AutoML Trace implementation.
7.3. Collaboration and Question Elicitation
As a final step, we presented AutoML Trace to our collaborators via chauffeured demonstrations (Lloyd and Dykes, 2011) conducted over video conferencing platforms. We demonstrated the functionality and affordances of AutoML Trace and our collaborators were given opportunities to provide feedback. We iterated between discussing the analysis we conducted using their existing platform and the artifacts we harvested and visualized via AutoML Trace. This was an important step in our assessment, as it reinforced to our collaborators that traceability could be added to their existing system, as all artifacts of a real analysis were captured through their APIs. The team was excited to view their artifacts and their system’s capabilities in this way.
We wanted to collect the types of questions our prototype would elicit during these feedback sessions. The engagement was dynamic, with both the authors posing and responding to questions about the artifacts, their sources, dependencies, and changes over time. What our collaborators appreciated most was being able to see their system laid out according to our taxonomy. This new view of their system led them to examine aspects of their work from a perspective they had not previously considered. We summarize our discussion into three common themes: seeing and describing dependencies, comparing sequences analyses over time, and comparing how their system differed from others.
Seeing and describing dependencies. Visualizing the dependencies of individual artifacts and the different types of artifacts was something they had not been previously able to do. They were especially interested and excited to see how the human and machine-generated processes interleaved through the analysis. This combination of the origin and dependency view allows them to infer potential causal relationships between an artifact’s current state and other actions. As we have previously indicated, many AutoML systems do not explicate the role of humans, but, with AutoML Trace the impact and effect of the human’s role are undeniable. The team saw the benefit of visualizing the analysis in this way as a way to reflect on the system’s design. They also saw the benefit of surfacing such relationships to support governing an analytic pipeline. For example, if authorization is required to deploy a model, they saw AutoML Trace as a useful way to audit the existing analysis to either recommend or decline deployment.
Comparing sequences of analyses analyses. Our collaborators were also interested in using AutoML Trace to compare analyses conducted by multiple analysts over time. They specifically wanted to have multiple analysis sequences generated by different actors and to compare them. This scenario of asynchronous human collaboration, together with individual human-machine collaboration, is a promising sign of our taxonomy’s utility for more complex problems. While we can version artifacts, enabling detailed comparisons, our current design is not well optimized for multi-human collaboration - although, this again, points to fruitful directions for future work.
One collaborator was particularly interested in understanding when humans took machine suggestions and applied them and when they ignored suggestions. A specific artifact sequence of interest began with the initial dataset, followed by wrangling transformation recommendations with a machine source. Then the recording of user actions would indicate whether the end-user applied any wrangling transformation recommendations. Finally, it concluded with any potential updates to the initial dataset. This is yet another interesting usage scenario that not only enables us to understand a system’s level of automation but, potentially defines signatures of automation per user. Moreover, it is also possible to assess whether some artifacts are modified more often than others. Collectively, these signatures could be leveraged to identify problematic features (for example, if the machine’s results are constantly overwritten) or patterns of analysis behavior.
Comparing their system to others. The taxonomy we developed is an amalgamation of various systems that span both human and machine processes. Our taxonomy provided a standard vocabulary for comparing these systems and reflecting on what artifacts might be missing relative to another system. For example, more recent advances in AutoML technology includes a computational budget to enable these automated processes to complete within a reasonable time frame and budgetary constraints. However, not all AutoML systems have such features. Our taxonomy prompted a discussion of the design implications for our collaborator’s system. They were first comforted to see that their existing system had elements that overlapped with others, but, could also see other interesting aspects that were absent in their current implementation.
7.4. Summary
In this second phase of research, we probed the utility and ecological validity of taxonomy by collaborating with a team developing a complex AutoML system. The AutoML Trace sketch demonstrates that a taxonomy is a useful boundary object to engage with a team of software and ML/AI experts designing human-ML/AI collaborative systems. It also demonstrates that traceability has valuable applications to both human-machine and human-human collaborations. While our approach does not address all of the design challenges for evolving and adaptive systems (Yang et al., 2020b), it does take preliminary steps toward doing so.
8. Discussion
Human collaboration with ML/AI systems will grow more ubiquitous as AutoML technology becomes increasingly integrated within data work. These systems lower the barrier for data work and help data scientists triage their work more effectively (Wang et al., 2021b). However, as existing systems still require human oversight and intervention, these semi-automated systems need to be observable and understandable. Recent work from the HCI community identifies challenges in scrutinizing ML/AI systems stemming from the complexities of human-ML/AI collaborative work and emphasizes the need for a common language for discourse in this space (Yang et al., 2020b).
Our work addresses limitations in human-ML/AI collaboration in several ways. First, we formalized a common language that accounts for human and machine aspects of these systems by creating an AutoML artifact taxonomy. Second, we operationalized this taxonomy in our interactive sketch AutoML Trace, characterizing these artifacts to facilitate a traceable workflow. Third, we characterized traceability for scrutinizing this highly complex and heterogeneous process. While prior research captures aspects of traceability through provenance tools (i.e., (Wang et al., 2019a; Ono et al., 2021; Liu et al., 2021)), they fail to differentiate between human and automated processes and frequently ignore human processes altogether. Research in human-human collaboration and knowledge sharing has highlighted the importance of artifacts for capturing (Kreiner, 2002; Lee, 2007) and tracing (Tiwana and Ramesh, 2001; Fischer and Otswald, 2001; Mariano and Awazu, 2016) complex collaborative processes. By considering traceability, we offer a different perspective on artifacts. We argue that traceability encourages a broader consideration of an artifact’s lineage and the contextual factors of its generation and use. Moreover, through artifacts, our research acknowledges and elevates the sociotechnical relationships between humans and ML/AI systems.
Beyond provenance, contemporary research is increasingly focused on the importance of transparency, interpretability, and explainability toward ML/AI systems (Barredo Arrieta et al., 2020; Kaur et al., 2020; Mittelstadt et al., 2019; Spinner et al., 2020; Amershi et al., 2019). However, this prior work focuses on the model itself and misses influential factors throughout the data cascade (Sambasivan et al., 2021). Our research expands the scope, capturing artifacts across an end-to-end pipeline of data science work through artifacts and taxonomies. We demonstrate that taxonomies can be robustly created and can serve as boundary objects for designing human-ML/AI collaborative systems. Our approach shows it is possible to have “both transparency of process and transparency of product; the former refers to the transparency of the human processes of research and innovation, the latter to the transparency of […] AI systems so developed.” (Winfield and Jirotka, 2018).
Lastly, our research acknowledges and describes the difficulties of developing visual and interactive systems for human-ML/AI collaboration in data work. Design studies and other application-type research focus primarily on end-users, but complex systems still require the engagement of ML/AI experts. The collaboration between researchers and experts who are not the end-users remains complex and can require visualization tools as intermediaries to facilitate a dialogue (Yang et al., 2020b). Absent reliable scaffolds for this dialogue, we took on the ambitious task of creating them. Developing an AutoML artifact taxonomy and AutoML Trace created boundary objects that we used to address these challenges. Our intent in describing our process is to provide possible avenues for other researchers facing similar challenges.
8.1. Implications of Our Findings and Future Work
8.1.1. On Design and Evaluation of Human-Centered AutoML Systems
Our artifact taxonomy can be used to reflect upon existing systems and ideate new ones. One of the limitations of existing guidelines for human-ML/AI interaction is that they target the initial ideation of the system and are less effective should a system already exist. In our case study, we observed an artifact taxonomy’s potential to reflect design retrospectively and prospectively. This potential is essential to identify and modify ineffective approaches. Our taxonomy serves to help researchers and practitioners ideate on new systems and speculate what an ML/AI system could do (Yang et al., 2020b) while promoting reflection on the role of humans.
8.1.2. On Data Science Collaboration
Different kinds of data workers are engaged across data work (Crisan and Fiore-Gartland, 2021; Wang et al., 2021a; Wang et al., 2019c). Further work is needed to understand how different data science personas (Crisan et al., 2021), from ML engineers to technical analysts, would use this taxonomy. Prior research shows that people trade-off aspects of data work amongst themselves (Crisan et al., 2021; Zhang et al., 2020a). Capturing and tracing artifacts can help a team of data workers understand what work was done and by whom (or what). Moreover, discussion around artifacts, visualized by tools like AutoML Trace can help teams of data workers make sense of and critique the analysis and its results (Neff et al., 2017). Finally, while there exists some research exploring the relationship between data workers and levels of automation (i.e., Wang et al. (Wang et al., 2021b)), the complex relationships of human-to-human with human-to-machine collaboration have not been explored. Our taxonomy may prove helpful for extending these prior studies to a more hybrid flow of data work.
8.1.3. On Data Visualization and Visual Analytics Tools
Visual analysis tools leverage the advancement in machine learning to innovate on affordances visual analytic (VA) systems. Expanding our understanding of VA systems by capturing a more detailed catalog of artifacts would allow “users of the system to stay more engaged in the act of visual data exploration, as opposed to actively training the model and system,” (Endert et al., 2017). Inspired by Yang et. al. (Yang et al., 2020b), we were motivated to expand the view of what can be captured and surfaced from ML/AI pipelines beyond the model or analysis phase. With the emphasis on a broader inclusion of the human element into what we capture and surface, our taxonomy is a step toward a more general view of human-generated artifacts captured across a workflow independent of a single system or pipeline. We hope others continue to utilize and expand on this in the space of VA systems. Visualization and Human Computer Interaction researchers can build upon our research in two ways. The first is expanding the scope of what can be visualized by VA systems for ML/AI. Our taxonomy proposes a richer view of an AutoML pipeline that current work (Section 2.2) does not yet consider. Researchers can use our taxonomy to analyze and visualize other ML/AI systems, including but not limited AutoML systems, and even extend our taxonomy and contribute to expanding our catalog of ML/A artifacts. While our AutoML Trace interactive sketch proposes one possible visual approach, we believe there are rich opportunities to explore the space of visual designs. The second is by expanding paradigms for human-ML/AI interaction. Data visualization tools are a medium for human and machine learning systems to work together (Spinner et al., 2020; Sperrle et al., 2021). While interactions with these systems can be used to intervene with ML models (Endert et al., 2012; Brown et al., 2012; Gehrmann et al., 2020), future work could extend this potential to other types of primitives and aspects of AutoML pipelines (Heffetz et al., 2020; Ono et al., 2021).
8.2. Limitations
Data work involves a wide variety of different kinds of data workers. Further work is needed to understand how different data science personas (Crisan et al., 2021), from ML engineers to technical analysts, would use this taxonomy. To re-purpose the adage about statistical models, “All taxonomies are wrong, some are useful.” Like the taxonomies that came before ours, we strove to make our taxonomy useful to HCI, visualization, and machine learning researchers and practitioners. In service to this goal, we followed a rigorous process for taxonomy development proposed by Nickerson et al. (Nickerson et al., 2013) with extensions from Prat et al. (Prat et al., 2015). We were diligent in documenting our taxonomy development and made artifacts of our research process available as supplementary materials so others might critique or extend our work. While this approach is more involved, it also serves as an important alternative to ad hoc approaches for taxonomy development that are difficult to interrogate and replicated. More generally, we argue that the research process brings greater attention to the importance of artifacts resulting from automation and human labor in data science work. Another limitation of our work is that our usage scenario excludes the ultimate end-user, the people conducting the analysis. The rationale for doing so was twofold. First, we needed some baseline to ground the development of a system like AutoML Trace. Absent this baseline, we needed to create one, hence, the primary contribution of our taxonomy. The second rationale was that, for our present contributions, the developer team was the more appropriate group to conduct a preliminary assessment. In Section 7, we identify several fruitful ways to expand on our work and move toward end-user evaluations, including a broader investigation of the visual design space and an investigation of asynchronous, multi-human collaborations.
Finally, we reflect on our taxonomy development approach. Although our taxonomy was developed through a broad literature review, we assess it utility primarily through a collaboration with a single team. It is not uncommon for visualization research to focus on a core collaborator group, but, further work is required to assess its generality. We are optimistic that there is great potential for using the taxonomy to compare disparate systems and pipelines from AutoML to visual analysis. We encourage the community to engage with the taxonomy operationalized in mediums they see fit for their data work. In addition, we look forward to seeing how this taxonomy can expand over time as ML/AI technology advances.
9. Conclusion
The growing ubiquity of AutoML technology enables a wider group of stakeholders to conduct data work but can also make it challenging to trace what was done and by whom (or what). Attempts to address these challenges are often stymied by the complexity of the systems themselves and a lack of available scaffolding for engaging with the ML and software developers that create these systems. We present a two-phased approach that explicates the collaborative relationships between humans and AutoML systems to carry out data work. The first phase develops an artifact taxonomy that can be used to identify, classify, and describe artifacts from both socio- and technical sources. The second phase is a usage scenario with an enterprise development team that demonstrates the utility of our taxonomy as a boundary object. This usage scenario also reifies the value of tracing artifacts in the process of designing and developing collaborative human-ML/AI systems. Our findings and contributions have implications for the design and evaluation of AutoML systems used to facilitate automation in data work.
Availability of Supplementary Materials. Notes taken during the development of our taxonomy and the AutoML Trace prototype are available online222https://osf.io/3nmyj/?view_only=19962103d58b45d289b5c83421f48b36.
-
•
[SM1] AutoML Artifact Taxonomy Development : A spreadsheet of each artifact and their classification across each iteration of the taxonomy
-
•
[SM1-F] AutoML Artifact Taxonomy Final : A spreadsheet of the final taxonomy, with artifacts, properties, and their classification. A summary is also shown in
-
•
[SM2] Taxonomy Iterations Details : A summary of our decision process for adjusting the taxonomic dimensions, categories, and objects. It has a detailed annotation of each iteration, what changed, and how we assess our end conditions for taxonomy development.
- •
-
•
[SM4] Design Alternatives : Design alternatives that were considered and discussed with our collaborators.
References
- (1)
- Agarwal et al. (2021) Oshin Agarwal, Heming Ge, Siamak Shakeri, and Rami Al-Rfou. 2021. Knowledge Graph Based Synthetic Corpus Generation for Knowledge-Enhanced Language Model Pre-training. https://arxiv.org/abs/2010.12688
- Alletto et al. (2020) Stefano Alletto, Shenyang Huang, Vincent Francois-Lavet, Yohei Nakata, and Guillaume Rabusseau. 2020. RandomNet: Towards Fully Automatic Neural Architecture Design for Multimodal Learning. arXiv:2003.01181 https://arxiv.org/abs/2003.01181
- Amershi et al. (2019) Saleema Amershi, Dan Weld, Mihaela Vorvoreanu, Adam Fourney, Besmira Nushi, Penny Collisson, Jina Suh, Shamsi Iqbal, Paul N. Bennett, Kori Inkpen, Jaime Teevan, Ruth Kikin-Gil, and Eric Horvitz. 2019. Guidelines for Human-AI Interaction. In Proc. CHI’19. 1–13. https://doi.org/10.1145/3290605.3300233
- Bansal et al. (2019) Gagan Bansal, Besmira Nushi, Ece Kamar, Daniel S. Weld, Walter S. Lasecki, and Eric Horvitz. 2019. Updates in Human-AI Teams: Understanding and Addressing the Performance/Compatibility Tradeoff. Proc AAAI’19 33, 01 (Jul. 2019), 2429–2437. https://doi.org/10.1609/aaai.v33i01.33012429
- Barredo Arrieta et al. (2020) Alejandro Barredo Arrieta, Natalia Díaz-Rodríguez, Javier Del Ser, Adrien Bennetot, Siham Tabik, Alberto Barbado, Salvador Garcia, Sergio Gil-Lopez, Daniel Molina, Richard Benjamins, Raja Chatila, and Francisco Herrera. 2020. Explainable Artificial Intelligence (XAI): Concepts, taxonomies, opportunities and challenges toward responsible AI. Information Fusion 58 (2020), 82–115. https://doi.org//10.1016/j.inffus.2019.12.012
- Battle and Heer (2019) Leilani Battle and Jeffrey Heer. 2019. Characterizing Exploratory Visual Analysis: A Literature Review and Evaluation of Analytic Provenance in Tableau. Computer Graphics Forum 38, 3 (2019), 145–159. https://doi.org/10.1111/cgf.13678
- Beck et al. (2017) Fabian Beck, Michael Burch, Stephan Diehl, and Daniel Weiskopf. 2017. A Taxonomy and Survey of Dynamic Graph Visualization. Computer Graphics Forum 36, 1 (2017), 133–159. https://doi.org/10.1111/cgf.12791
- Boukhelifa et al. (2020) Nadia Boukhelifa, Anastasia Bezerianos, Remco Chang, Christopher Collins, Steven Drucker, Alexander Endert, Jessica Hullman, Chris North, and Michael Sedlmair. 2020. Challenges in evaluating interactive visual machine learning systems. IEEE Computer Graphics and Applications 40, 6 (2020), 88–96.
- Brehmer and Munzner (2013) Matthew Brehmer and Tamara Munzner. 2013. A Multi-Level Typology of Abstract Visualization Tasks. IEEE Transactions on Visualization and Computer Graphics 19, 12 (2013), 2376–2385. https://doi.org/10.1109/TVCG.2013.124
- Brown et al. (2012) Eli T. Brown, Jingjing Lie, Carla E. Brodely, and Remco Chang. 2012. Dis-function: Learning Distance Functions Interactively. In 2012 IEEE Conference on Visual Analytics Science and Technology (VAST). 83–92. https://doi.org/10.1109/VAST.2012.6400486
- Cambronero (2021) José Pablo Cambronero. 2021. Mining Software Artifacts for use in Automated Machine Learning. Ph.D. Dissertation. MIT-CSAIL. https://www.josecambronero.com/pdf/JCambronero-PhD-EECS-June2021.pdf
- Cashman et al. (2019) Dylan Cashman, Shah Rukh Humayoun, Florian Heimerl, Kendall Park, Subhajit Das, John Thompson, Bahador Saket, Abigail Mosca, John Stasko, Alex Endert, Michael Gleicher, and Remco Chang. 2019. A User-based Visual Analytics Workflow for Exploratory Model Analysis. Computer Graphics Forum 38, 3 (2019), 185–199. https://doi.org/10.1111/cgf.13681
- Celik and Vanschoren (2021) Bilge Celik and Joaquin Vanschoren. 2021. Adaptation Strategies for Automated Machine Learning on Evolving Data. IEEE Transactions on Pattern Analysis and Machine Intelligence (2021), 1–1. https://doi.org/10.1109/TPAMI.2021.3062900
- Crisan and Fiore-Gartland (2021) Anamaria Crisan and Brittany Fiore-Gartland. 2021. Fits and Starts: Enterprise Use of AutoML and the Role of Humans in the Loop. In Proc CHI’21. Article 601, 15 pages.
- Crisan et al. (2021) Anamaria Crisan, Brittany Fiore-Gartland, and Melanie Tory. 2021. Passing the Data Baton : A Retrospective Analysis on Data Science Work and Workers. IEEE Transactions on Visualization and Computer Graphics 27, 2 (2021), 1860–1870. https://doi.org/10.1109/TVCG.2020.3030340
- Cutler et al. (2020) Zach Cutler, Kiran Gadhave, and Alexander Lex. 2020. Trrack: A Library for Provenance-Tracking in Web-Based Visualizations. In 2020 IEEE Visualization Conference (VIS). 116–120. https://doi.org/10.1109/VIS47514.2020.00030
- Davies and Frank (2013) Tim Davies and Mark Frank. 2013. ’There’s No Such Thing as Raw Data’: Exploring the Socio-Technical Life of a Government Dataset. In Proc WebSci ’13. 75–78. https://doi.org/10.1145/2464464.2464472
- De Bie et al. (2022) Tijl De Bie, Luc De Raedt, José Hernández-Orallo, Holger H. Hoos, Padhraic Smyth, and Christopher K. I. Williams. 2022. Automating Data Science. Commun. ACM 65, 3 (feb 2022), 76–87. https://doi.org/10.1145/3495256
- Dellermann et al. (2021) Dominik Dellermann, Adrian Calma, Nikolaus Lipusch, Thorsten Weber, Sascha Weigel, and Philipp Ebel. 2021. The future of human-AI collaboration: a taxonomy of design knowledge for hybrid intelligence systems. arXiv:2105.03354 https://arxiv.org/abs/2105.03354
- Domova and Vrotsou (2022) Veronika Domova and Katerina Vrotsou. 2022. A Model for Types and Levels of Automation in Visual Analytics: a Survey, a Taxonomy, and Examples. IEEE Transactions on Visualization and Computer Graphics (2022).
- Drozdal et al. (2020) Jaimie Drozdal, Justin Weisz, Dakuo Wang, Gaurav Dass, Bingsheng Yao, Changruo Zhao, Michael Muller, Lin Ju, and Hui Su. 2020. Trust in AutoML: Exploring Information Needs for Establishing Trust in Automated Machine Learning Systems. In Proc. IUI’20. 297–307. https://doi.org/10.1145/3377325.3377501
- Elshawi et al. (2019) Radwa Elshawi, Mohamed Maher, and Sherif Sakr. 2019. Automated Machine Learning: State-of-The-Art and Open Challenges. arXiv:1906.02287 https://arxiv.org/abs/1906.02287
- Endert et al. (2012) Alex Endert, Patrick Fiaux, and Chris North. 2012. Semantic Interaction for Visual Text Analytics. In Proc CHI’12. 473–482. https://doi.org/10.1145/2207676.2207741
- Endert et al. (2017) Alex Endert, William Ribarsky, Cagatay Turkay, BL William Wong, Ian Nabney, I Díaz Blanco, and Fabrice Rossi. 2017. The state of the art in integrating machine learning into visual analytics. In Computer Graphics Forum, Vol. 36. Wiley Online Library, 458–486.
- Estevez-Velarde et al. (2019) Suilan Estevez-Velarde, Yoan Gutiérrez, Andrés Montoyo, and Yudivián Almeida-Cruz. 2019. AutoML Strategy Based on Grammatical Evolution: A Case Study about Knowledge Discovery from Text. In Proc ACL’19. 4356–4365. https://doi.org/10.18653/v1/P19-1428
- Feurer et al. (2020) Matthias Feurer, Katharina Eggensperger, Stefan Falkner, Marius Lindauer, and Frank Hutter. 2020. Auto-Sklearn 2.0: The Next Generation. arXiv:2007.04074 https://arxiv.org/abs/2007.04074
- Fischer and Otswald (2001) Gerhard . Fischer and Jonathan. Otswald. 2001. Knowledge management: problems, promises, realities, and challenges. IEEE Intelligent Systems 16, 1 (2001), 60–72. https://doi.org/10.1109/5254.912386
- Gadhave et al. (2020) Kiran Gadhave, Jochen Görtler, Zach Cutler, Carolina Nobre, Oliver Deussen, Miriah Meyer, Jeff Phillips, and Alexander Lex. 2020. Capturing User Intent when Brushing in Scatterplots. https://doi.org/10.31219/osf.io/mq2rk
- Gehrmann et al. (2020) Sebastian Gehrmann, Hendrik Strobelt, Robert Krüger, Hanspeter Pfister, and Alexander M. Rush. 2020. Visual Interaction with Deep Learning Models through Collaborative Semantic Inference. IEEE Transactions on Visualization and Computer Graphics 26, 1 (2020), 884–894. https://doi.org/10.1109/TVCG.2019.2934595
- Gijsbers et al. (2019) Pieter Gijsbers, Erin LeDell, Janek Thomas, Sébastien Poirier, Bernd Bischl, and Joaquin Vanschoren. 2019. An Open Source AutoML Benchmark. arXiv:1907.00909 https://arxiv.org/abs/1907.00909
- Gitelman (2013) Lisa Gitelman. 2013. “Raw Data” Is an Oxymoron. MIT Press, Cambridge, USA.
- Gleicher (2018) Michael Gleicher. 2018. Considerations for Visualizing Comparison. IEEE Transactions on Visualization and Computer Graphics 24, 1 (2018), 413–423. https://doi.org/10.1109/TVCG.2017.2744199
- Gleicher et al. (2011) Michael Gleicher, Danielle Albers, Rick Walker, Ilir Jusufi, Charles D. Hansen, and Jonathan C. Roberts. 2011. Visual Comparison for Information Visualization. Information Visualization 10, 4 (Oct. 2011), 289–309. https://doi.org/10.1177/1473871611416549
- Golovin et al. (2017) Daniel Golovin, Benjamin Solnik, Subhodeep Moitra, Greg Kochanski, John Karro, and D. Sculley. 2017. Google Vizier: A Service for Black-Box Optimization. In Proc KDD’17. 1487–1495. https://doi.org/10.1145/3097983.3098043
- Greenberg and Buxton (2008) Saul Greenberg and William Buxton. 2008. Usability evaluation considered harmful (some of the time). Proc. CHI’08, 111–120. https://doi.org/10.1145/1357054.1357074
- He et al. (2021) Xin He, Kaiyong Zhao, and Xiaowen Chu. 2021. AutoML: A survey of the state-of-the-art. Knowledge-Based Systems 212 (Jan 2021), 106622. https://doi.org/10.1016/j.knosys.2020.106622
- Heer (2019) Jeffrey Heer. 2019. Agency Plus Automation: Designing Artificial Intelligence into Interactive Systems. Proceedings of the National Academy of Sciences 116, 6 (2019), 1844–1850. https://doi.org/10.1073/pnas.1807184115
- Heffetz et al. (2020) Yuval Heffetz, Roman Vainshtein, Gilad Katz, and Lior Rokach. 2020. DeepLine: AutoML Tool for Pipelines Generation Using Deep Reinforcement Learning and Hierarchical Actions Filtering. In Proc KDD ’20. 2103–2113. https://doi.org/10.1145/3394486.3403261
- Hong et al. (2020a) Sungsoo Ray Hong, Sonia Castelo, Vito D’Orazio, Christopher Benthune, Aecio Santos, Scott Langevin, David Jonker, Enrico Bertini, and Juliana Freire. 2020a. Towards Evaluating Exploratory Model Building Process with AutoML Systems. arXiv:2009.00449 https://arxiv.org/abs/2009.00449
- Hong et al. (2020b) Sungsoo Ray Hong, Jessica Hullman, and Enrico Bertini. 2020b. Human Factors in Model Interpretability: Industry Practices, Challenges, and Needs. Proc. CSCW’20. 4, CSCW1, Article 068 (May 2020), 26 pages. https://doi.org/10.1145/3392878
- Hu et al. (2019) Kevin Hu, Michiel A. Bakker, Stephen Li, Tim Kraska, and César Hidalgo. 2019. VizML: A Machine Learning Approach to Visualization Recommendation. In Proc. CHI’19. Association for Computing Machinery, New York, NY, USA, 1–12. https://doi.org/10.1145/3290605.3300358
- Jin et al. (2019) Haifeng Jin, Qingquan Song, and Xia Hu. 2019. Auto-Keras: An Efficient Neural Architecture Search System. In Proc KDD ’19 (Anchorage, AK, USA). Association for Computing Machinery, New York, NY, USA, 1946–1956. https://doi.org/10.1145/3292500.3330648
- John et al. (2004) Bonnie E John, Len Bass, Rick Kazman, and Eugene Chen. 2004. Identifying gaps between HCI, software engineering, and design, and boundary objects to bridge them. In CHI’04 extended abstracts on Human factors in computing systems. 1723–1724.
- Karmaker et al. (2021) Shubhra Kanti Karmaker, Md. Mahadi Hassan, Micah J. Smith, Lei Xu, ChengXiang Zhai, and Kalyan Veeramachaneni. 2021. AutoML to Date and Beyond: Challenges and Opportunities. arXiv:2010.10777 https://arxiv.org/abs/2010.10777
- Kasica et al. (2021) Stephen Kasica, Charles Berret, and Tamara Munzner. 2021. Table Scraps: An Actionable Framework for Multi-Table Data Wrangling From An Artifact Study of Computational Journalism. IEEE Transactions on Visualization and Computer Graphics 27, 2 (2021), 957–966. https://doi.org/10.1109/TVCG.2020.3030462
- Kaur et al. (2020) Harmanpreet Kaur, Harsha Nori, Samuel Jenkins, Rich Caruana, Hanna Wallach, and Jennifer Wortman Vaughan. 2020. Interpreting Interpretability: Understanding Data Scientists’ Use of Interpretability Tools for Machine Learning. 1–14. https://doi.org/h10.1145/3313831.3376219
- Kreiner (2002) Kristian Kreiner. 2002. Tacit knowledge management: the role of artifacts. Journal of Knowledge Management 6, 2 (01 Jan 2002), 112–123. https://doi.org/10.1108/13673270210424648
- Lam et al. (2018) Heidi Lam, Melanie Tory, and Tamara Munzner. 2018. Bridging from Goals to Tasks with Design Study Analysis Reports. IEEE Transactions on Visualization and Computer Graphics 24, 1 (2018), 435–445. https://doi.org/10.1109/TVCG.2017.2744319
- Lee (2007) Charlotte P. Lee. 2007. Boundary Negotiating Artifacts: Unbinding the Routine of Boundary Objects and Embracing Chaos in Collaborative Work. Proc. CSCW’07 16, 3 (01 Jun 2007), 307–339. https://doi.org/10.1007/s10606-007-9044-5
- Lee et al. (2019) D. Lee, Stephen Macke, Doris Xin, Angela Lee, Silu Huang, and Aditya G. Parameswaran. 2019. A Human-in-the-loop Perspective on AutoML: Milestones and the Road Ahead. IEEE Data Eng. Bull. 42, 2 (2019), 59–70. http://sites.computer.org/debull/A19june/p59.pdf
- Lee et al. (2021a) Doris Jung-Lin Lee, Vidya Setlur, Melanie Tory, Karrie G Karahalios, and Aditya Parameswaran. 2021a. Deconstructing categorization in visualization recommendation: A taxonomy and comparative study. IEEE Transactions on Visualization and Computer Graphics (2021).
- Lee et al. (2021b) Doris Jung-Lin Lee, Vidya Setlur, Melanie Tory, Karrie G. Karahalios, and Aditya Parameswaran. 2021b. Deconstructing Categorization in Visualization Recommendation: A Taxonomy and Comparative Study. IEEE Transactions on Visualization and Computer Graphics (2021), 1–1. https://doi.org/10.1109/TVCG.2021.3085751
- Lee et al. (2021c) Doris Jung-Lin Lee, Dixin Tang, Kunal Agarwal, Thyne Boonmark, Caitlyn Chen, Jake Kang, Ujjaini Mukhopadhyay, Jerry Song, Micah Yong, Marti A. Hearst, and Aditya G. Parameswaran. 2021c. Lux: Always-on Visualization Recommendations for Exploratory Data Science. https://arxiv.org/abs/2105.00121
- Liu et al. (2017) Shixia Liu, Xiting Wang, Mengchen Liu, and Jun Zhu. 2017. Towards better analysis of machine learning models: A visual analytics perspective. Visual Informatics 1, 1 (2017), 48–56. https://doi.org/10.1016/j.visinf.2017.01.006
- Liu et al. (2020) Yang Liu, Tim Althoff, and Jeffrey Heer. 2020. Paths Explored, Paths Omitted, Paths Obscured: Decision Points; Selective Reporting in End-to-End Data Analysis. In Proc. CHI’20. 1–14. https://doi.org/10.1145/3313831.3376533
- Liu et al. (2021) Yang Liu, Alex Kale, Tim Althoff, and Jeffrey Heer. 2021. Boba: Authoring and Visualizing Multiverse Analyses. IEEE Transactions on Visualization and Computer Graphics 27, 2 (Feb 2021), 1753–1763. https://doi.org/10.1109/tvcg.2020.3028985
- Lloyd and Dykes (2011) David Lloyd and Jason Dykes. 2011. Human-Centered Approaches in Geovisualization Design: Investigating Multiple Methods Through a Long-Term Case Study. IEEE Transactions on Visualization and Computer Graphics 17, 12 (2011), 2498–2507. https://doi.org/10.1109/TVCG.2011.209
- Loyola-González (2019) Octavio Loyola-González. 2019. Black-Box vs. White-Box: Understanding Their Advantages and Weaknesses From a Practical Point of View. IEEE Access 7 (2019), 154096–154113. https://doi.org/10.1109/ACCESS.2019.2949286
- Mariano and Awazu (2016) Stefania Mariano and Yukika Awazu. 2016. Artifacts in knowledge management research: a systematic literature review and future research directions. Journal of Knowledge Management 20, 6 (01 Jan 2016), 1333–1352. https://doi.org/10.1108/JKM-05-2016-0199
- Mishra and Rzeszotarski (2021) Swati Mishra and Jeffrey M Rzeszotarski. 2021. Designing Interactive Transfer Learning Tools for ML Non-Experts. In Proc. CHI’21. Article 364, 15 pages. https://doi.org/10.1145/3411764.3445096
- Mitchell et al. (2019) Margaret Mitchell, Simone Wu, Andrew Zaldivar, Parker Barnes, Lucy Vasserman, Ben Hutchinson, Elena Spitzer, Inioluwa Deborah Raji, and Timnit Gebru. 2019. Model Cards for Model Reporting. In Proc. FAccT’19. https://doi.org/10.1145/3287560.3287596
- Mittelstadt et al. (2019) Brent Mittelstadt, Chris Russell, and Sandra Wachter. 2019. Explaining Explanations in AI. In Proc. FAccT’19. 279–288. https://doi.org/10.1145/3287560.3287574
- Mora-Cantallops et al. (2021) Marçal Mora-Cantallops, Salvador Sánchez-Alonso, Elena García-Barriocanal, and Miguel-Angel Sicilia. 2021. Traceability for Trustworthy AI: A Review of Models and Tools. Big Data and Cognitive Computing 5, 2 (May 2021), 20. https://doi.org/10.3390/bdcc5020020
- Narkar et al. (2021) Shweta Narkar, Yunfeng Zhang, Q. Vera Liao, Dakuo Wang, and Justin D. Weisz. 2021. Model LineUpper: Supporting Interactive Model Comparison at Multiple Levels for AutoML. In Proc. IUI’21. 170–174. https://doi.org/10.1145/3397481.3450658
- Neff et al. (2017) Gina Neff, Anissa Tanweer, Brittany Fiore-Gartland, and Laura Osburn. 2017. Critique and contribute: A practice-based framework for improving critical data studies and data science. Big data 5, 2 (2017), 85–97.
- Neto et al. (2020) Habib Asseiss Neto, Ronnie C. O. Alves, and Sergio V. A. Campos. 2020. NASirt: AutoML based learning with instance-level complexity information. arXiv:2008.11846 https://arxiv.org/abs/2008.11846
- Nickerson et al. (2013) Robert Nickerson, Upkar Varshney, and Jan Muntermann. 2013. A Method for Taxonomy Development and its Application in Information Systems. European Journal of Information Systems 22 (05 2013). https://doi.org/10.1057/ejis.2012.26
- Nikitin et al. (2021) Nikolay O. Nikitin, Pavel Vychuzhanin, Mikhail Sarafanov, Iana S. Polonskaia, Ilia Revin, Irina V. Barabanova, Gleb Maximov, Anna V. Kalyuzhnaya, and Alexander Boukhanovsky. 2021. Automated Evolutionary Approach for the Design of Composite Machine Learning Pipelines. https://arxiv.org/abs/2106.15397
- Olson et al. (2016) Randal S. Olson, Nathan Bartley, Ryan J. Urbanowicz, and Jason H. Moore. 2016. Evaluation of a Tree-Based Pipeline Optimization Tool for Automating Data Science. In Proc GECCO’16. 485–492. https://doi.org/10.1145/2908812.2908918
- Ono et al. (2021) Jorge Piazentin Ono, Sonia Castelo, Roque Lopez, Enrico Bertini, Juliana Freire, and Claudio Silva. 2021. PipelineProfiler: A Visual Analytics Tool for the Exploration of AutoML Pipelines. IEEE Transactions on Visualization and Computer Graphics 27, 2 (2021), 390–400. https://doi.org/10.1109/TVCG.2020.3030361
- Pan and Yang (2010) Sinno Jialin Pan and Qiang Yang. 2010. A Survey on Transfer Learning. IEEE Transactions on Knowledge and Data Engineering 22, 10 (2010), 1345–1359. https://doi.org/10.1109/TKDE.2009.191
- Parasuraman et al. (2000) Raja Parasuraman, Thomas B. Sheridan, and Christopher D. Wickens. 2000. A Model for Types and Levels of Human Interaction with Automation. IEEE Transactions on Systems, Man, and Cybernetics - Part A: Systems and Humans 30, 3 (2000), 286–297. https://doi.org/10.1109/3468.844354
- Prat et al. (2015) Nicolas Prat, Isabelle Comyn-Wattiau, and Jacky Akoka. 2015. A Taxonomy of Evaluation Methods for Information Systems Artifacts. Journal of Management Information Systems 32, 3 (2015), 229–267. https://doi.org/10.1080/07421222.2015.1099390
- Publio et al. (2018) G. Publio, Diego Esteves, Agnieszka Lawrynowicz, P. Panov, L. Soldatova, Tommaso Soru, J. Vanschoren, and Hamid Zafar. 2018. ML-Schema: Exposing the Semantics of Machine Learning with Schemas and Ontologies. https://openreview.net/forum?id=B1e8MrXVxQ
- Ragan et al. (2015) Eric D Ragan, Alex Endert, Jibonananda Sanyal, and Jian Chen. 2015. Characterizing provenance in visualization and data analysis: an organizational framework of provenance types and purposes. IEEE transactions on visualization and computer graphics 22, 1 (2015), 31–40.
- Rogers et al. (2021) Jen Rogers, Austin H. Patton, Luke Harmon, Alexander Lex, and Miriah Meyer. 2021. Insights From Experiments With Rigor in an EvoBio Design Study. IEEE Transactions on Visualization and Computer Graphics 27, 2 (2021), 1106–1116. https://doi.org/10.1109/TVCG.2020.3030405
- Sacha et al. (2019) Dominik Sacha, Matthias Kraus, Daniel A. Keim, and Min Chen. 2019. VIS4ML: An Ontology for Visual Analytics Assisted Machine Learning. IEEE Transactions on Visualization and Computer Graphics 25, 1 (2019), 385–395. https://doi.org/10.1109/TVCG.2018.2864838
- Sacha et al. (2017) Dominik Sacha, Michael Sedlmair, Leishi Zhang, John A. Lee, Jaakko Peltonen, Daniel Weiskopf, Stephen C. North, and Daniel A. Keim. 2017. What you see is what you can change: Human-centered machine learning by interactive visualization. Neurocomputing 268 (2017), 164–175. https://doi.org/10.1016/j.neucom.2017.01.105
- Salmons (2008) Janet Salmons. 2008. Expect originality! Using taxonomies to structure assignments that support original work. In Student plagiarism in an online world: Problems and solutions. IGI Global, 208–227.
- Salvador et al. (2016) Manuel Martin Salvador, Marcin Budka, and Bogdan Gabrys. 2016. Adapting Multicomponent Predictive Systems using Hybrid Adaptation Strategies with Auto-WEKA in Process Industry. In Proceedings of the Workshop on Automatic Machine Learning (Proceedings of Machine Learning Research, Vol. 64), Frank Hutter, Lars Kotthoff, and Joaquin Vanschoren (Eds.). PMLR, New York, New York, USA, 48–57. http://proceedings.mlr.press/v64/salvador_adapting_2016.html
- Sambasivan et al. (2021) Nithya Sambasivan, Shivani Kapania, Hannah Highfill, Diana Akrong, Praveen Paritosh, and Lora M Aroyo. 2021. “Everyone Wants to Do the Model Work, Not the Data Work”: Data Cascades in High-Stakes AI. In Proc. CHI’21. Article 39, 15 pages. https://doi.org/10.1145/3411764.3445518
- Sanders and Stappers (2014) Elizabeth B.-N. Sanders and Pieter Jan Stappers. 2014. Probes, toolkits and prototypes: three approaches to making in codesigning. CoDesign 10, 1 (2014), 5–14. https://doi.org/10.1080/15710882.2014.888183
- Santos et al. (2019) Aécio Santos, Sonia Castelo, Cristian Felix, Jorge Piazentin Ono, Bowen Yu, Sungsoo Ray Hong, Cláudio T. Silva, Enrico Bertini, and Juliana Freire. 2019. Visus: An Interactive System for Automatic Machine Learning Model Building and Curation. In Proc. HILDA’19. Article 6, 7 pages. https://doi.org/10.1145/3328519.3329134
- Schelter et al. (2017) Sebastian Schelter, Joos-Hendrik Boese, Johannes Kirschnick, Thoralf Klein, and Stephan Seufert. 2017. Automatically tracking metadata and provenance of machine learning experiments. In Machine Learning Systems Workshop at NIPS. 27–29.
- Setlur et al. (2019) Vidya Setlur, Melanie Tory, and Alex Djalali. 2019. Inferencing Underspecified Natural Language Utterances in Visual Analysis. In Proc IUI ’19. 40–51. https://doi.org/10.1145/3301275.3302270
- Shneiderman (1996) B. Shneiderman. 1996. The eyes have it: a task by data type taxonomy for information visualizations. In Proc. VLHCC’96. 336–343. https://doi.org/10.1109/VL.1996.545307
- Souza et al. (2019) Renan Souza, Patrick Valduriez, Marta Mattoso, Renato Cerqueira, Marco Netto, Leonardo Azevedo, Vítor Lourenço, Elton F. de S. Soares, Raphael Melo, Rafael Brandão, Daniel Salles Civitarese, Emilio Vital Brazil, and Marcio Ferreira Moreno. 2019. Provenance Data in the Machine Learning Lifecycle in Computational Science and Engineering. In Proc. WORKS’19. 1–10. https://doi.org/10.1109/WORKS49585.2019.00006
- Sperrle et al. (2021) Fabian Sperrle, Mennatallah El-Assady, Grace Guo, Rita Borgo, Duen Horng Chau, Alex Endert, and Daniel Keim. 2021. A Survey of Human-Centered Evaluations in Human-Centered Machine Learning. Computer Graphics Forum 40, 3 (2021), 543–567. https://doi.org/10.1111/cgf.14329
- Sperrle et al. (2020) Fabian Sperrle, Astrik Jeitler, Jürgen Bernard, Daniel A. Keim, and Mennatallah El-Assady. 2020. Learning and Teaching in Co-Adaptive Guidance for Mixed-Initiative Visual Analytics. In EuroVis Workshop on Visual Analytics (EuroVA). The Eurographics Association. https://doi.org/10.2312/eurova.20201088
- Spinner et al. (2020) Thilo Spinner, Udo Schlegel, Hanna Schäfer, and Mennatallah El-Assady. 2020. explAIner: A Visual Analytics Framework for Interactive and Explainable Machine Learning. IEEE Transactions on Visualization and Computer Graphics 26, 1 (2020), 1064–1074. https://doi.org/10.1109/TVCG.2019.2934629
- Stitz et al. (2019) Holger Stitz, Samuel Gratzl, Harald Piringer, Thomas Zichner, and Marc Streit. 2019. KnowledgePearls: Provenance-Based Visualization Retrieval. IEEE Transactions on Visualization and Computer Graphics 25, 1 (2019), 120–130. https://doi.org/10.1109/TVCG.2018.2865024
- Sundaram et al. (2010) Senthil Karthikeyan Sundaram, Jane Huffman Hayes, Alex Dekhtyar, and E. Ashlee Holbrook. 2010. Assessing traceability of software engineering artifacts. Requirements Engineering 15, 3 (01 Sep 2010), 313–335. https://doi.org/10.1007/s00766-009-0096-6
- Taman et al. (2018) Rachel Taman, Jake VanderPlas, and Sohier Dane. 2018. A Practical Taxonomy of Reproducibility for Machine Learning Research. https://openreview.net/forum?id=B1eYYK5QgX
- Thornton et al. (2013) Chris Thornton, Frank Hutter, Holger H. Hoos, and Kevin Leyton-Brown. 2013. Auto-WEKA: Combined Selection and Hyperparameter Optimization of Classification Algorithms. In Proc. KDD’13. 847–855. https://doi.org/10.1145/2487575.2487629
- Tiwana and Ramesh (2001) Amrit Tiwana and Balasubramaniam Ramesh. 2001. A design knowledge management system to support collaborative information product evolution. Decision Support Systems 31, 2 (2001), 241–262. https://doi.org/10.1016/S0167-9236(00)00134-2
- Valiati et al. (2006) Eliane R. A. Valiati, Marcelo S. Pimenta, and Carla M. D. S. Freitas. 2006. A Taxonomy of Tasks for Guiding the Evaluation of Multidimensional Visualizations. In Proceedings of the 2006 AVI Workshop on BEyond Time and Errors: Novel Evaluation Methods for Information Visualization (Venice, Italy) (BELIV ’06). Association for Computing Machinery, New York, NY, USA, 1–6. https://doi.org/10.1145/1168149.1168169
- von Rueden et al. (2021) Laura von Rueden, Sebastian Mayer, Katharina Beckh, Bogdan Georgiev, Sven Giesselbach, Raoul Heese, Birgit Kirsch, Michal Walczak, Julius Pfrommer, Annika Pick, and et al. 2021. Informed Machine Learning - A Taxonomy and Survey of Integrating Prior Knowledge into Learning Systems. IEEE Transactions on Knowledge and Data Engineering (2021), 1–1. https://doi.org/10.1109/tkde.2021.3079836
- Wang et al. (2019b) April Yi Wang, Anant Mittal, Christopher Brooks, and Steve Oney. 2019b. How Data Scientists Use Computational Notebooks for Real-Time Collaboration. Proc CSCW’19 3 (Nov 2019), 1–30. https://doi.org/10.1145/3359141
- Wang et al. (2020) Bochao Wang, Hang Xu, Jiajin Zhang, Chen Chen, Xiaozhi Fang, Yixing Xu, Ning Kang, Lanqing Hong, Chenhan Jiang, Xinyue Cai, Jiawei Li, Fengwei Zhou, Yong Li, Zhicheng Liu, Xinghao Chen, Kai Han, Han Shu, Dehua Song, Yunhe Wang, Wei Zhang, Chunjing Xu, Zhenguo Li, Wenzhi Liu, and Tong Zhang. 2020. VEGA: Towards an End-to-End Configurable AutoML Pipeline. arXiv:2011.01507 https://arxiv.org/abs/2011.01507
- Wang et al. (2021a) Dakuo Wang, Josh Andres, Justin D. Weisz, Erick Oduor, and Casey Dugan. 2021a. AutoDS: Towards Human-Centered Automation of Data Science. In Proc. CHI’21. Article 79, 12 pages. https://doi.org/10.1145/3411764.3445526
- Wang et al. (2021b) Dakuo Wang, Q. Vera Liao, Yunfeng Zhang, Udayan Khurana, Horst Samulowitz, Soya Park, Michael Muller, and Lisa Amini. 2021b. How Much Automation Does a Data Scientist Want? arXiv:2101.03970 https://arxiv.org/abs/2101.03970
- Wang et al. (2019c) Dakuo Wang, Justin D. Weisz, Michael Muller, Parikshit Ram, Werner Geyer, Casey Dugan, Yla Tausczik, Horst Samulowitz, and Alexander Gray. 2019c. Human-AI Collaboration in Data Science: Exploring Data Scientists’ Perceptions of Automated AI. Proc. CSCW’19, 24 pages. https://doi.org/10.1145/3359313
- Wang et al. (2019a) Qianwen Wang, Yao Ming, Zhihua Jin, Qiaomu Shen, Dongyu Liu, Micah J. Smith, Kalyan Veeramachaneni, and Huamin Qu. 2019a. ATMSeer: Increasing Transparency and Controllability in Automated Machine Learning. In Proc CHI’19. 1–12. https://doi.org/10.1145/3290605.3300911
- Weidele et al. (2020) Daniel Karl I. Weidele, Justin D. Weisz, Erick Oduor, Michael Muller, Josh Andres, Alexander Gray, and Dakuo Wang. 2020. AutoAIViz: Opening the Blackbox of Automated Artificial Intelligence with Conditional Parallel Coordinates. In Proc. IUI’20. 308–312. https://doi.org/10.1145/3377325.3377538
- Winfield and Jirotka (2018) Alan F. T. Winfield and Marina Jirotka. 2018. Ethical governance is essential to building trust in robotics and artificial intelligence systems. Philosophical Transactions of the Royal Society A: Mathematical, Physical and Engineering Sciences 376, 2133 (2018), 20180085. https://doi.org/10.1098/rsta.2018.0085
- Wong et al. (2018) Catherine Wong, Neil Houlsby, Yifeng Lu, and Andrea Gesmundo. 2018. Transfer Learning with Neural AutoML. In Proc NeurIPS’18. Curran Associates Inc., Red Hook, NY, USA, 8366–8375.
- Wongsuphasawat et al. (2016) K. Wongsuphasawat, D. Moritz, A. Anand, J. Mackinlay, D. Howe, and J. Heer. 2016. Voyager: Exploratory Analysis via Faceted Browsing of Visualization Recommendations. IEEE Transactions on Visualization and Computer Graphics 22, 1 (Jan 2016), 649–658. https://doi.org/10.1109/TVCG.2015.2467191
- Xin et al. (2018) Doris Xin, Litian Ma, Jialin Liu, Stephen Macke, Shuchen Song, and Aditya Parameswaran. 2018. Accelerating Human-in-the-Loop Machine Learning: Challenges and Opportunities. In Proc. DEEM’18. https://doi.org/10.1145/3209889.3209897
- Xin et al. (2021) Doris Xin, Eva Yiwei Wu, Doris Jung-Lin Lee, Niloufar Salehi, and Aditya Parameswaran. 2021. Whither AutoML? Understanding the Role of Automation in Machine Learning Workflows. https://doi.org/10.1145/3411764.3445306
- Yang et al. (2019) Chengrun Yang, Yuji Akimoto, Dae Won Kim, and Madeleine Udell. 2019. OBOE: Collaborative Filtering for AutoML Model Selection. In Proc KDD ’19 (Anchorage, AK, USA). 1173–1183. https://doi.org/10.1145/3292500.3330909
- Yang et al. (2020a) Chengrun Yang, Jicong Fan, Ziyang Wu, and Madeleine Udell. 2020a. AutoML Pipeline Selection: Efficiently Navigating the Combinatorial Space. In Proc KDD ’20. 1446–1456. https://doi.org/10.1145/3394486.3403197
- Yang et al. (2020b) Qian Yang, Aaron Steinfeld, Carolyn Rosé, and John Zimmerman. 2020b. Re-Examining Whether, Why, and How Human-AI Interaction Is Uniquely Difficult to Design. 1–13. https://doi.org/10.1145/3313831.3376301
- Yao et al. (2019) Quanming Yao, Mengshuo Wang, Yuqiang Chen, Wenyuan Dai, Yu-Feng Li, Wei-Wei Tu, Qiang Yang, and Yang Yu. 2019. Taking Human out of Learning Applications: A Survey on Automated Machine Learning. arXiv:1810.13306 https://arxiv.org/abs/1810.13306
- Zhang et al. (2020a) Amy X. Zhang, Michael Muller, and Dakuo Wang. 2020a. How Do Data Science Workers Collaborate? Roles, Workflows, and Tools. Proc CSCW’2020, Article 022 (May 2020), 23 pages. https://doi.org/10.1145/3392826
- Zhang et al. (2021) Baobao Zhang, Markus Anderljung, Lauren Kahn, Noemi Dreksler, Michael C. Horowitz, and Allan Dafoe. 2021. Ethics and Governance of Artificial Intelligence: Evidence from a Survey of Machine Learning Researchers. arXiv:2105.02117 [cs.CY]
- Zhang et al. (2020b) Yao Zhang, William Zame, and Mihaela van der Schaar. 2020b. AutoCP: Automated Pipelines for Accurate Prediction Intervals. arXiv:2006.14099 https://arxiv.org/abs/2006.14099
- Zhuang et al. (2021) Fuzhen Zhuang, Zhiyuan Qi, Keyu Duan, Dongbo Xi, Yongchun Zhu, Hengshu Zhu, Hui Xiong, and Qing He. 2021. A Comprehensive Survey on Transfer Learning. Proc. IEEE 109, 1 (2021), 43–76. https://doi.org/10.1109/JPROC.2020.3004555
- Zimmer et al. (2021) Lucas Zimmer, Marius Lindauer, and Frank Hutter. 2021. Auto-Pytorch: Multi-Fidelity MetaLearning for Efficient and Robust AutoDL. IEEE Transactions on Pattern Analysis & Machine Intelligence 01 (2021), 1–1. https://doi.org/10.1109/TPAMI.2021.3067763
- Zöller and Huber (2021) Marc-André Zöller and M. Huber. 2021. Benchmark and Survey of Automated Machine Learning Frameworks. J. Artif. Intell. Res. 70 (2021), 409–472.
- Zoph and Le (2017) Barret Zoph and Quoc V. Le. 2017. Neural Architecture Search with Reinforcement Learning. https://arxiv.org/abs/1611.01578
Appendix A Appendix: AutoML Artifact Taxonomy Additional Details
We describe the artifact properties according to our taxonomy. We use color highlighting through this subsection to to emphasize the dimensions, categories, and characteristics of our taxonomy (see Section 4). The exposition of our taxonomy proceeds in a hierarchical order, beginning with a dimension down to its respective characteristics.
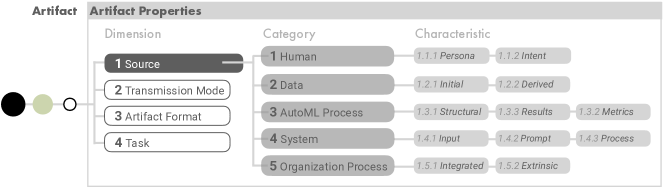
Dimension 1: Source (“What generated the artifact?”) Identifying the artifact’s source helps provide context and a sense of provenance of how the decisions were made throughout an AutoML process. In fully automated data science processes, these artifacts are generated by computational processes, which we refer to as ‘the machine’, without human interventions. However, as full automation is both challenging to achieve and not always desirable, in reality, artifacts can have a variety of sources. For example, a visual analytics mixed-initiative system that operates on top of an AutoML pipeline. In such a system, an analyst can arrive at a set of insights through a combination of automated decisions made by a back-end model and human inputs provided through the interface made along the way (Heer, 2019; Sperrle et al., 2021, 2020). At a high level, artifacts can have human or machine sources. However, in our taxonomy development process, we were also able to define an additional layer of granularity to artifact sources. Human artifacts can be sourced from individual or organizational processes. Machine artifacts can be sourced from the AutoML processes and the overall software infrastructure (or system) that orchestrates the automated data science processes. Finally, we separate data as its own unique source as it cross-cuts both human and machine sources. These more granular source delineations are categories in our taxonomy that have additional characteristics. While we found that many artifacts generally have distinct sources, some can have multiple sources. For example, many artifacts concerning data augmentation can be sourced from a combination of human intents and derivations from the initial dataset. Sources of human input can also result from prompts by the system that explicitly seek user feedback.
-
•
Category 1.1: Human We found that humans act as sources to AutoML pipelines primarily by providing inputs in the form of goals and requirements, specifications (Hong et al., 2020a; Gijsbers et al., 2019), and interactions with a system (Hong et al., 2020a; Cashman et al., 2019; Sacha et al., 2017). While human can refer to one or multiple individuals providing input, we prefer the more narrow interpretation of a single human providing input to, or interacting with an AutoML pipeline. As will become clear, ‘organizational processes’ is a better source designation to describe multiple humans working together. Amongst individual human sources, we found two characteristics that added important context: persona and intent.
We found that artifact types can differ based upon thepersona (c1.1.1) (Karmaker et al., 2021; Wang et al., 2019a; Crisan and Fiore-Gartland, 2021) of the individual carrying out the analysis. AutoML systems can be leveraged by individuals not trained in data science or machine learning. We posit the nature of those inputs and the affordances they use to supply those inputs will be different than those with more area expertise. For example, individuals trained in data science of machine learning might produce more codebase artifacts through their use of notebooks (Wang et al., 2019b), while other personas may rely more on no-code solutions, and their inputs are more likely captured through interface widgets or other types of semantic interactions (Gehrmann et al., 2020; Endert et al., 2012).
Another important characteristic of human source artifacts is the intent (c1.1.2) of the individual. These artifacts can appear as user preference models, analysis types, or even model tasks (the analyst chooses a model optimized for a specific task). The HCI, Vis, and ML communities have used different terminologies to define what a person wishes to do in an analysis process. Tasks is a common term used in all three communities (i.e. (Karmaker et al., 2021; Brehmer and Munzner, 2013; Wong et al., 2018) ) and these can be tied to goals (Lam et al., 2018) or preferences. Recently, visualization researchers have begun using intent as a general way to capture this spectrum, from an individual’s tasks to their goals (Gadhave et al., 2020; Setlur et al., 2019). We opted to use this terminology because it aligned well with the diversity of artifacts our analysis captured.
-
•
Category 1.2: Data Data are perhaps the most obvious artifact of an AutoML process and one that needs the least explanation. In our taxonomy, the primary characteristics of data differentiate whether it is an initial input or whether it is derived from the AutoML process.
Initial (c1.2.1) datasets are sometimes also referred to as raw data. We refrain from using the word ‘raw’ largely because no dataset truly exists in such a state (Davies and Frank, 2013; Gitelman, 2013). Instead, we use the term ‘initial’ dataset, in lieu of the ‘raw’ terminology. Furthermore, the terminology of 1initial’ acknowledges that a dataset may be further transformed or augmented either by a human or an AutoML processes before a machine learning model is applied.
In contrast, derived (c1.2.2) datasets result when transformations are applied to the initial data. These transformations can result from data cleaning or wrangling operations (Kasica et al., 2021) (including feature encoding (Yao et al., 2019; Yang et al., 2020a; Karmaker et al., 2021), the derivation of new features (Wang et al., 2021b; Zimmer et al., 2021), or creating a new representations via data or feature embedding (Yang et al., 2020a)). The resulting derived datasets are generated by the AutoML processes and changes in their compositions can be useful to understand how processes arrived at its final set of results (Celik and Vanschoren, 2021).
-
•
Category 1.3: AutoML Process Different levels of automation directly influence how many and what kinds of artifacts are generated by an AutoML process. Given that AutoML can theoretically range from hyperparameter tuning to a full end-to-end data science pipeline (Zöller and Huber, 2021; Karmaker et al., 2021; Heffetz et al., 2020), the spectrum of possible artifacts stem from AutoML processes can be very broad. However, we identified three characteristics of artifacts that span this spectrum: structure, metrics, and results.
Structural (c1.3.1) characteristics of artifacts describe a component of an AutoML pipeline, such as a machine learning model, or an end-to-end pipeline of steps that also encompasses data preparation, feature engineering, and reporting (Wang et al., 2020; Zöller and Huber, 2021; Karmaker et al., 2021; Yang et al., 2020a; Heffetz et al., 2020; Feurer et al., 2020). We additionally extended the definition of structural characteristics to include algorithmic artifacts that constitute training or tuning a specific component (Golovin et al., 2017), the architecture or more complex models like neural networks (Jin et al., 2019), or pipeline topology (Yang et al., 2020a), configuration space (Feurer et al., 2020; Zöller and Huber, 2021), or search space (Wang et al., 2019a; Ono et al., 2021; Nikitin et al., 2021). Lastly, we include a model’s tasks as part of its structural characteristics, as they play an important role in understanding what the model is intended to do while adding context to architecture. Structural characteristics often take the form of specifications supplied by the end-users or are automatically generated by the AutoML processes. For example, we consider the final architecture or fit of a model to be an automatically generated artifact with structural characteristics resulting from an algorithmic process.
Metrics (c1.3.2) and results (c1.3.3) are two complementary characteristics and perhaps the most widely scrutinized aspects of AutoML process artifacts. Metrics refers to measures that describe the model training, validation, and testing performance. These can take various forms depending on the type of model used and the task it is intended to solve. However, basic measures such as overall or average accuracy tend to be the most commonly reported. Metrics are intimately tied to the result of a component or pipeline applied to a data set. Again, the precise nature of this result depends upon the model task. Two commonly used types are classification and clustering tasks; however, more advanced models enable a more complex set of tasks such as document summarizing, text or image generation, among others.
-
•
Category 1.4: System AutoML processes sit within a larger software ecosystem that orchestrates and carries out the computational instructions of its different components (i.e., data cleaning, feature engineering, or machine learning steps). Artifacts tend to be generated by a system, and we identified three characteristics of such artifacts: inputs, prompts, and processes.
Characteristics of these artifacts concerned the ways that they were either provided or generated by the system. Some artifacts operate as inputs (c1.4.1), which can come from human processes or result from data or other types of artifacts transferred between an AutoML process and the computational layer of a system. These can include configuration files for the computational environment (Cambronero, 2021), computational budgets (Wang et al., 2019a), or source code (Wang et al., 2021b; Cambronero, 2021). Artifacts are also generated as a result of the system presenting a prompt (c1.4.2) to an individual for some input, or through an automatic process (c1.4.3). Alerting mechanisms can be a common way to prompt an individual for some action; this action produces an artifact that can trigger a change to the AutoML pipeline. For example, alerting an individual to a high correlation between two variables in their input dataset can lead them to remove a feature from a model. The alert is generated by an automated process that carries out the correlation checking and is itself an artifact, but the choice the user makes (whether to remove the feature from the model or not) results from the prompt itself; the artifact is a user’s choice and has the characteristic of being generated by a prompt.
-
•
Category 1.5: Organizational Process AutoML technology is used in conjunction with existing business and organization practices (Crisan and Fiore-Gartland, 2021). These processes generate artifacts that can act as input and integrate directly into AutoML processes while others exert an extrinsic influence but do not provide any direct input.
Organizational artifacts that have an integrated (c1.5.1) characteristic when they directly influence how AutoML pipelines are trained, evaluated, and finally used in decision making. For example, the data schemas that define the structure of the data are influenced by business practices. However, schemas influence the type of data that is collected, how it is stored and accessed, which can be used or limit what is achievable in an AutoML process (Dellermann et al., 2021). Other artifacts that constitute integrated organizations process include data augmentations, through contextual augments (i.e. human supplied semantic annotations (Estevez-Velarde et al., 2019) or ontologies (Cashman et al., 2019)) and benchmark datasets (Zöller and Huber, 2021; Jin et al., 2019; Zhang et al., 2020b; Olson et al., 2016). We found that these artifacts closely reflected how organizations carry out their practices, unlike a machine learning model whose underlying mathematical specifications are largely agnostic to organizational practices.
Although not the focus of our research (Section LABEL:problem-statement), we also made space of extrinsic (c1.5.2) organizational processes, which include legal procedures or practices within the organization that dictate the use and limitations of AutoML technology. These artifacts are not directly integrated into the processes of specifying, developing, or training aspects of an AutoML pipeline, as, for example, data augmentations are. They are a step removed from the AutoML processes, even though they add relevant contextual information; hence, we classified these artifacts as extrinsic.
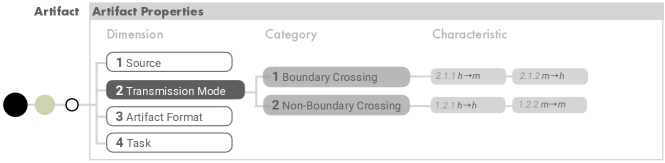
D2: Transmission Mode(“Does it cross the boundaries between human and AutoML processes?”) Our work emphasizes artifacts that cross boundaries between machine and human processes. However, there still exist artifacts that do not cross this boundary but that are important for transparently describing an AutoML processes. We include space for both in our taxonomy.
-
•
Category 2.1: Boundary Crossing artifacts are passed between the human and AutoML processes, and vice-versa, which we interpret as characteristics of an artifact. An artifact that goes from a human to AutoML processes, hm (c2.1.1); human-to-machine, serves as input to the AutoML. This input includes artifact sources stemming from the data they provide, specifications and configurations, or even the imposition of integrated or extrinsic processes, such as requirements documentation (Wang et al., 2021b; Alletto et al., 2020; Cambronero, 2021) which can dictate what the AutoML process should do. We also consider actions that govern an AutoML process and determine how it proceeds, for example, whether a specific model can be deployed, to also possess hm characteristics, although none of the research papers we reviewed in building our taxonomy contained such an explicit artifact. AutoML processes can automatically generate outputs in the form of reports or alerts intended for human consumption. These artifacts have an mh (c2.1.2; machine-to-human) characteristics. Increasing AutoML processes produce, or are expected to produce, explanations for their outputs in the form of reports (Wang et al., 2021b) or automatically generated model cards (Mitchell et al., 2019). Automatic methods for detecting anomalies in the data or model (Elshawi et al., 2019), especially the presence of concept drift (Celik and Vanschoren, 2021), are initiated by the AutoML system. These automated methods generate artifacts to present to a user in the form of alerts, automatically generated reports, or dashboards.
-
•
Category 2.2: Non-Boundary Crossing We limited the number of non-boundary crossing items we included in our taxonomy; a full survey of such artifacts could likely fill one or several research papers on their own. Moreover, other research literature has examined these such artifacts ranging from knowledge management (Kreiner, 2002) to APIs and other considerations of computational infrastructure. To be able to connect our taxonomy to such artifacts we have included hh (c2.2.1; human-to-human) and mm (c2.2.1; machine-to-machine) characteristics for non-boundary crossing artifacts.
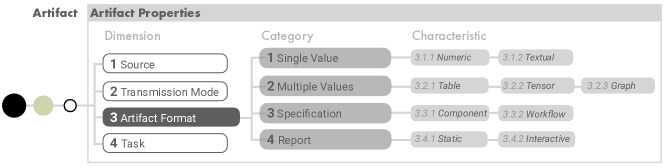
D3: Artifact Format(“What shape does the artifact take?”) As a practical consideration in our taxonomy is the different forms that artifacts take. Our observation is that different systems produce artifacts in different formats, although current systems place an emphasis on primarily numerical artifacts. Systems that visualize AutoML process, such as PipelineProfiler (Ono et al., 2021), ATMSeer (Wang et al., 2019a), or AutoVizAI (Weidele et al., 2020), are informed by the format these artifacts take when consider what to visualize and how. As we take a more expansive look at AutoML processes and the hand-off between human and machine processes, and as AutoML systems expand to greater levels of automation, we argue that the diversity of artifact formats grows. It is important to acknowledge this artifact format diversity in creating future AutoML systems or tools that aim to surface these artifacts of a diversity of data science and non-data science personas. Moreover, these artifacts can constitute both inputs to, or outputs of, and AutoML processes. In our analysis, we identified four categories of these artifact formats : single values, multiple values, specifications, and reports.
-
•
Category 3.1: Single Value It is common for AutoML artifacts to be a single value, for example, a single summary statistic or a text alert informing an individual of some result. We found that either numeric (c3.1.1) or textual (c3.1.2) characteristics were common for such artifacts. Annotations on the data (Estevez-Velarde et al., 2019; Souza et al., 2019) or AutoML pipeline (Spinner et al., 2020) and feedback from individuals also tend to come in the form of comments and thus are also artifacts with textual characteristics.
-
•
Category 3.2: Multiple Value A natural extension of single value artifacts are those that contain multiple values. We delineate table (c3.2.1) and tensor (c3.2.2) characteristics for the shape of these data. In the machine learning literature, tensor strongly implies an N-dimensional numeric array, which can range form a single scalar value (N=0) to a vector (N=1), and a finally a multi-dimensional array (N¿1). Because the term tensor has such a strong numeric connotation, we include ‘table’ terminology to allow for artifacts mixed types of data (numeric, ordinal, categorical); a table with one column is just a list. We did consider whether single values should simply be considered special cases of tables and tensors, but, because we also wanted to emphasize data with similar or mixed variable (column, attribute) types we opted to separate single and multiple values in order to make this characterization easier to identify.
We also considered a graph (c3.2.3) to constitute multiple data types. The word ‘graph’ is overloaded and can mean either a visualization or a type of data structure. Here, we use the term to mean a graph data structure that constitutes nodes and edges. Moreover, we use graph as a general term to encompass both network and tree structures, again with these being special cases on graphs; a tree is a graph with a hierarchical, directed, and acyclic structure. Behavioral graphs, interaction logs, or interaction sequences (Battle and Heer, 2019; Hong et al., 2020a; Cashman et al., 2019; Stitz et al., 2019) are common examples of artifacts with graph characteristics that we found. Initial datasets are also artifacts that can have a graph characteristics, for example, ontologies or knowledge graphs (von Rueden et al., 2021; Agarwal et al., 2021). -
•
Category 3.3: Specification
As AutoML processes grow in complexity from focusing on model training and expanding to multiple stages of a data science processes. As a result an AutoML process can be described as a set of interchangeable components (Yang et al., 2020a; Wang et al., 2020) (also referred to as an ‘ML primitive’ (Heffetz et al., 2020; Ono et al., 2021)) that are pieced together into a final workflow configuration. We use an expanded definition of an AutoML component here to include not such the machine learning model and it’s dependencies (feature engineering, data preparation), but also to include reporting, task formulation, and other such stages (Karmaker et al., 2021). Depending on the level of automation, specifications can represent individual components or entire workflows. These specifications typically take the form of configuration files or source code, however, others have explored a broader space of specifications that includes equations and logic rules (von Rueden et al., 2021)333Although the authors consider these to be knowledge representations, they would fit our definition of a specification..
Depending upon the level of automation, an individual component (c3.3.1) can either be specified entirely by a human or the specification can be automatically generated by a learning processes. They type of specification will vary depending on the component that is being specified. For example, specifications for a machine learning model component will differ from specifications for a feature generation component which will also be different than a data visualization component. While many of these processes were formally the manual work of data scientists (Zöller and Huber, 2021; Wang et al., 2021b) these processes are becoming increasingly automated (Karmaker et al., 2021).
Currently, many AutoML systems and toolkits arguably focus primarily on the machine learning model component and the optimization of it’s structural specifications (Yang et al., 2019; Olson et al., 2016; Thornton et al., 2013), or in the case of deep learning it’s architectural specifications (Jin et al., 2019; Zimmer et al., 2021). However, as more sophisticated end-to-end AutoML system arise, an individual need not specify many of the components as these can be derived automatically by search a AutoML workflow (c3.3.2) design. In these cases, an individual may only need to specify the preliminary configurations of the search space (Zöller and Huber, 2021; Heffetz et al., 2020; Wang et al., 2019a, 2020; Alletto et al., 2020; Yao et al., 2019; Feurer et al., 2020; Salvador et al., 2016). -
•
Category 3.4: Report Currently, many reporting tasks are done by humans and are not regularly considered part of an AutoML processes, but we see this changing in the future. Over time, AutoML processes will be automatically generating explainers (Spinner et al., 2020), reports (Wang et al., 2021b; Hong et al., 2020b), and data visualizations (Lee et al., 2021c). These will exist along side human reporting artifacts around the largely analytic goals of an AutoML processes, decision making provenance, and finally, dashboards that report key performance indicators (Wang et al., 2021b). These final output of these reporting artifacts depend upon how they are specified either by individuals or by the AutoML processes. We find that they general have two characteristics, static (c3.4.1), for example PDFs or presentations, or interactive (c3.4.2) dashboards.
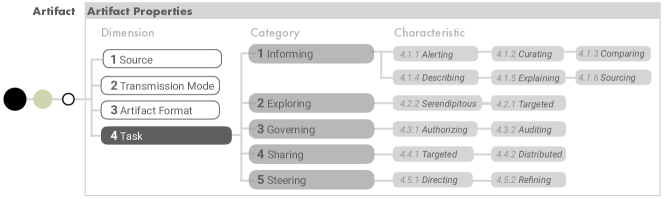
D4: Task(“What is its intended purpose?”). Human analytic tasks and machine learning model tasks have complementary, if not overlapping, objectives (Sperrle et al., 2021). The tasks that either a human or machine wishes to accomplish effects the characteristics of the artifacts that are hand-off between them, especially if this tasks results in a artifact the crosses the boundary between human and machine processes. In our analysis, we have applied our own judgement to establish the types of tasks that different AutoML artifacts are intended to support. However, we also previous task taxonomies specific of AutoML and machine learning (Dellermann et al., 2021; Taman et al., 2018; von Rueden et al., 2021), typologies of visual analysis (Brehmer and Munzner, 2013; Lam et al., 2018), and other classification systems (Sacha et al., 2019; Karmaker et al., 2021; Souza et al., 2019; Sperrle et al., 2021) reported across various disciplines in formulating our taxonomy of the types of task that artifacts can support. Again, end-to-end AutoML systems are an evolving technology and current implementations of these systems vary with respect to what tasks they support. As such, we remind the reader that these tasks are an amalgamation of tasks we’ve identified in real and theoretical AutoML systems.
-
•
Category 4.1: Informing We believe that the most common task of artifacts is currently to inform. The intended audience for this information can vary depending the whether the artifact is boundary crossing or not. We identified six characteristics of these artifacts, which we in alphabetical order. Alerting (c4.1.1) characterises are associated with artifacts that arise from data quality or model quality alerts (Celik and Vanschoren, 2021) in the form when they are take also take on characteristics. We speculate that future systems may even be able to automatically incorporate alerts in Te form of textual feedback from , for example, if a human evaluate spots an error or omission in the AutoML processes and seeks to alert the algorithm. Moreover, we also speculate that there exists informal artifacts, in the form of comments, annotations, or other means that initiate corrective mechanisms in a model following a review of the results or decisions. Curating (c4.1.2) was a characteristic common of shared or saved insights, which we found to be a common mode of sharing key findings from exploratory visual analyses (Wongsuphasawat et al., 2016). Increasingly, AutoML system can produce their own set of curated insights that are presented in a rank-order for individuals to consider. Artifacts with comparing (c4.1.3) characteristics were in many cases focused on comparing different states of the individual workflow components; often these were also data visualizations. For example, an individual may wish to conduct a sensitivity analysis on a threshold for a classification model. Alternatively, they may also wish to compare a component over time to see how it evolves. Comparison tasks have been extensively studied in visualization research, and there are complimentary taxonomies (Gleicher, 2018; Gleicher et al., 2011) here that can add even more context to comparison artifacts from AutoML processes. Artifacts with describing (c4.1.4) characteristics described the state of an AutoML component or process. These include specifications, requirements, or regulatory documents that indicated either what an individual component was and what the sequence or configuration the AutoML components (Wang et al., 2021b; Cambronero, 2021). Moreover, we argue that descriptive artifacts can also take the form of statistical analysis that provide a summary of the data, results, or other properties of the AutoML processes (Karmaker et al., 2021; Cashman et al., 2019). We chose to differentiate these descriptive artifacts from those whose primary purpose is intended to be explanatory (c4.1.5). Explanations focusing on the modeling components are increasingly important for transparency and are being automatically produced by these components (Wang et al., 2021b; Sperrle et al., 2021; Mittelstadt et al., 2019; Spinner et al., 2020). These artifacts can take the form of reports, but also the outputs of techniques like SHAP, LIME, and the like (Kaur et al., 2020). While these explanations tend to focus on black-box models, we also extend our definition to the self-explanatory characteristics of so-called “white-box” models (Loyola-González, 2019; Barredo Arrieta et al., 2020). The final characteristics of artifacts with an informing intent is sourcing (c.4.1.5). Sourcing artifacts are those focusing on the lineage and analysis history of an AutoML processes. Even with full automation, human oversight, for example by interacting with other artifacts, can trigger a refinement or retraining of an AutoML processes’ configuration (Elshawi et al., 2019; Sperrle et al., 2020; Liu et al., 2020). Through each iteration, either human driven or triggered by automated process (Celik and Vanschoren, 2021). Provenance processes can also capture an individuals interactions with different components, for example data visualizations (Stitz et al., 2019; Cutler et al., 2020), can could influence an machine learning component through semantic interactions (Gehrmann et al., 2020; Endert et al., 2012; Brown et al., 2012). While sourcing characteristics can also be considered descriptive, we argue that, like explanations, they have a more specific and active role beyond simply describing the state of the systems or some component and thus should be considered separately.
-
•
Category 4.2: Exploring Artifacts can be generated as an individual, or even an automated processes, explores the data, model, or pipeline configuration space. We differentiate between exploratory artifacts that are targeted (̧4.4.1) for some specific aim (for example, hypothesis verification) and those that arise through purely serendipitous (̧4.4.2) discovery. WE consider many artifacts that arise from an exploratory visual analysis processes (Battle and Heer, 2019; Stitz et al., 2019; Cutler et al., 2020), which can include bookmarked or saved insights that are curated (Wongsuphasawat et al., 2016), to be exploratory artifacts with serendipitous characteristics.
-
•
Category 4.3: Governing Governance processes were not widely considered in the AutoML literature, although they appear in more recent work (Wang et al., 2021b; Crisan and Fiore-Gartland, 2021). These processes will only grow in importance over time as legal requirements and organizational practices change to regulate ML/AI and AutoML technology more generally (Winfield and Jirotka, 2018; Zhang et al., 2021). From the research that does exist, we propose two characteristics of governance artifacts: authorizing and auditing. Authorizing (c4.3.1) concerns enabling an AutoML system or even an individual analyst to to execute some component, again, who performs the work depends on the level of automation inherent in the system. We found some evidence for such possible artifacts in (Crisan and Fiore-Gartland, 2021) and (Wang et al., 2021b) in their description of a desire for oversight, for example having a data scientist authorize the deployment of a model created by someone else in the organization, or having automated rules that enforce, for example, anti-bias rules. Complementary to these artifacts are those that enable auditing (c4.3.2), for example, decision optimization forensics reports (Wang et al., 2021b). Artifacts with auditing characteristics rely on a variety of artifacts, especially those that are intended to inform.
-
•
Category 4.4: Sharing Even when humans do not aim to intervene at all in AutoML processes, the results of these process are integrated into other human and organizational processes to share knowledge. Artifacts that are intended to be targeted (c4.4.1) to specific personas have a specific purpose. We consider computational notebooks (Zhang et al., 2020a) to be artifacts possessing such characteristics, as they are intended to be be shared with other technical data workers or simply with the data scientist themselves. Artifacts with distribution (c4.4.2) characteristics are those that aim to have a wide audience. These can include presentations or reports, many of which rely on the compilation and analysis of other AutoML artifacts.
-
•
Category 4.5: Steering Artifacts can act to orient or intervene within an AutoML process. Artifacts with directing (̧4.5.1) act to initialize or orient the AutoML processes in a specific trajectory. These artifacts can include a human setting initial goals, providing training data, or providing an initial configurations for components (Yao et al., 2019). They can also include algorithmic processes that define the final configuration of AutoML components. In contrast, artifacts with refining (c4.5.2) characteristics are subtler than directing as they largely build off of the existing model structure. Fine-tuning operations, example Transfer Learning (Barredo Arrieta et al., 2020; Pan and Yang, 2010; Zhuang et al., 2021), produce artifacts for refining an existing neural architecture (Wong et al., 2018), rather than conducting an expensive neural architecture search (Alletto et al., 2020; Neto et al., 2020; Jin et al., 2019; Wang et al., 2020; Wong et al., 2018; Zoph and Le, 2017). We consider the former to be a refinement, while the latter uses an initial design space configuration to direct the overall neural architecture search process.