BugNIST: A New Large Scale Volumetric 3D Image Dataset
for Classification and Detection
Abstract
Progress in 3D volumetric image analysis research is limited by the lack of datasets and most advances in analysis methods for volumetric images are based on medical data. However, medical data do not necessarily resemble the characteristics of other volumetric images such as µCT. To promote research in 3D volumetric image analysis beyond medical data, we have created the BugNIST dataset and made it freely available. BugNIST is an extensive dataset of µCT scans of 12 types of bugs, such as insects and larvae. BugNIST contains 9437 volumes where 9087 are of individual bugs and 350 are mixtures of bugs and other material. The goal of BugNIST is to benchmark classification and detection methods, and we have designed the detection challenge such that detection models are trained on scans of individual bugs and tested on bug mixtures. Models capable of solving this task will be independent of the context, i.e., the surrounding material. This is a great advantage if the context is unknown or changing, as is often the case in µCT. Our initial baseline analysis shows that current state-of-the-art deep learning methods classify individual bugs very well, but has great difficulty with the detection challenge. Hereby, BugNIST enables research in image analysis areas that until now have missed relevant data — both classification, detection, and hopefully more.
1 Introduction
We contribute BugNIST 111The BugNIST dataset is available from: https://qim.dk/bugnist/ – a comprehensive and freely available 3D volumetric image dataset aimed at benchmarking deep learning algorithms. The name, BugNIST, is inspired by the influential MNIST dataset [23]. MNIST has been a driver for developing and testing deep learning methods, especially because of the small size and large number of images. BugNIST is made up of 3D µCT scans of 12 types of bugs. Besides being 3D, the scans are also significantly larger than the small MNIST images, but due to modern hardware, BugNIST volumes are still easily accessible. The bugs we have scanned include insects, larvae, pupae, and woodlice, both as individual bugs and in mixtures. With 9437 volumes, BugNIST is, to our knowledge, the first large-size non-medical volumetric image dataset targeted for benchmarking deep learning methods. Hereby, BugNIST can be a foundation for advancing the field of volumetric 3D deep learning methods.
There is currently a shortage of volumetric 3D data for benchmarking deep neural networks [31], and the most available 3D data is medical. This limits the options in developing new deep learning-based methods for analyzing 3D volumes, especially on non-medical data. There is, however, a great need for efficient techniques to analyze volumetric imaging data [42, 45]. BugNIST is created to meet this need and is developed specifically for object classification and detection in 3D volumetric images.
The 12 groups of individually scanned bugs in BugNIST are evenly distributed with 700-800 volumes of each group, see fig. 1. In the additional 350 volumes with mixtures of bugs and other materials, we have counted the number of bugs and their type. For 45 of the mixtures, we have also annotated the center positions of the bugs. For the individual bugs, the challenge is to classify volumes into the respective groups, and for the mixed volumes, the challenge is to detect, classify, and count the bugs.
The detection and counting challenge that we pose here is special in that the detection algorithm should be trained on the scans of individual bugs alone and tested on counting and detecting bugs in the mixtures. This makes BugNIST unique and the first to pose a detection challenge in volumetric images using this approach with such an extensive set of training data. The benefit of posing the challenge this way is model generalizability. When solving the BugNIST detection problem, methods will be forced to learn the object’s appearance and not the appearance of the context surrounding the objects, which will make the detection invariant to changes in the surrounding context. As we will show, this dramatically challenges state-of-the-art deep learning detection methods.
Data is a driver for developing machine learning and especially deep learning methods. Since research in data-driven methods is dominating computer vision, most advances are seen in areas with good datasets [24]. This also means that less attention is given to areas with limited or no data available.
The generic nature of deep learning allows models created for one type of data to be applied to other data types. E.g. methods developed for solving problems related to ImageNet [37] or COCO [24] have been applied to volumetric data. However, this transfer of domains is sub-optimal as the characteristics of volumetric data are different from photographs. Volumetric data is obtained by scanning and the voxel size is typically given by the scanning setup. In most cases, there will also be much knowledge about the sample and expected voxel intensities. This is not the case in photographs, where illumination and scale typically vary. In this respect, volumes are simpler than photos, but the fact that the volumes are 3D adds complexity. Furthermore, volumetric data is often limited by noise and resolution. From a user perspective, the 3D property makes volumetric images complex to visualize and inspect. Considering these characteristics when developing volumetric analysis methods has the potential for better-performing methods.
The majority of volumetric image datasets come from the medical domain, especially from clinical 3D CT and MRI scanners. Deep learning methods for the analysis of volumetric images are primarily developed for medical problems and there is extensive research in deep learning for medical volumetric images [50]. Much medical data is difficult to use due to privacy concerns making data-handling cumbersome. To some extent, one would assume that the methods developed for volumetric medical data also can be applied to other types of 3D data. But it turns out that the use of deep learning for non-medical volumetric data is limited [45], and the question is why this is the case.
There are important differences in structures and analysis problems between medical data and for example µCT data, which might be one reason for the limited use of deep learning. Medical data is acquired following specific protocols that allow for investigating and diagnosing patients, whereas µCT or electron microscopy is often used for inspecting new structures, making this type of data unique. To provide solutions for such problems based on deep learning, there is a need for a new type of volumetric datasets that will allow for developing deep learning methods targeting new types of problems.
There is already much volumetric image data available, and it is easy to find datasets on platforms like Zenodo222https://zenodo.org/ or TomoBank333https://tomobank.readthedocs.io/en/latest/index.html. However, most of this data is not in a processed format nor of a type that makes it easy to use for deep learning. Often this data comes with no clear problem formulation or well-defined tasks that allow for a comparison of methods, and the data is typically very large volumes that are difficult to access. It can also be difficult to judge the complexity of the data, and analysis might either be very easy or extremely difficult. This makes it less suitable to use for developing new deep learning methods, and therefore much less attractive to employ for developing new analysis methods compared to standard benchmark data.
Many 2D computer vision datasets address challenges for classification, detection, segmentation, etc., but for 3D volumetric data, most datasets focus on segmentation [2, 40]. Segmentation has the advantage that it allows for solving many problems, but it typically comes with the price of expensive annotations. But similar to 2D computer vision, one would also like to answer questions such as if an object is present and where it is. Datasets for object detection in volumetric data are less common than segmentation datasets, especially for non-medical data. The BugNIST dataset, which is the main contribution of this paper, provides a challenge for classification and detection, and there are other uses such as segmentation, geometric analysis, 3D generative models (GANs), etc. that we have not explored in this paper. Often, classification and detection tasks are useful for pretraining models, and the size of BugNIST could be useful for that.
2 Related work
In computer vision, the term 3D images cover different types of data and include point clouds, surfaces, volumes, color+depth, etc. Here we are only concerned with 3D volumes, i.e. images represented on a voxel grid.
BugNIST is created to test classification and object counting and detection. Classification is a well-defined problem with a clear goal, but for volumetric data, classification is less common than detection and especially segmentation. In, for example, medical image datasets, classification makes up 10% of tasks, whereas segmentation accounts for 70% of tasks [29]. In volumetric medical data, classification is used, for example, for diagnosis [7, 8, 14, 22, 38]. One classification example outside the medical field is baggage security screening [11, 44, 43] where object classification of prohibited items is used. When it is possible to formulate an analysis problem as a classification task, performance is usually high and often with an accuracy above 90%. However, object detection is difficult to formulate as a classification problem. Instead, we need to employ a model that is targeted for object detection.
Counting is done by assessing the number and type of the objects whereas, for object detection, each object must also be located. Object detection is extensively explored for 2D images, where it has numerous applications. Deep learning models are dominating, and most models either use a two-stage detector such as R-CNN [12, 13, 35], with a region proposal and a classifier to choose among the proposed regions, or a one-stage detector such as YOLO [34], where regions and classes are proposed in a single network. Object detection in volumetric images is less common.
3D object detection can be formulated as a segmentation task using, for example, a 3D U-Net [9] where each connected component of the foreground label class is a detection [19]. An example is lung nodule detection in [46]. Employing segmentation for object detection comes with the problem of separating out objects that may be connected or combining separated segments into one object. To avoid this problem, Jaeger et al. [19] propose the Retina U-Net: a one-shot 3D detection algorithm that combines the Retina Net [25] and U-Net [36] giving detections with 3D bounding boxes. Despite the good performance of Retina U-Net, changing to a new 3D detection problem requires a time-consuming method configuration. This has been addressed in nnDetection [5]. Inspired by the nnU-Net (no new U-Net) [18], they propose a no new 3D detection method. On the BugNIST data, we test detection with 3D U-Net [9] and the nnDetection method [5].
Most 3D datasets for benchmarking image analysis algorithms are medical. A lightweight dataset is MedMNIST by Yang et al. [48, 49], which, similar to MNIST [23], is comprised of images. Six of the 18 datasets are 3D and have 1370 and 1909 volumes in 2-11 classes. There are other datasets, such as the PROSTATEx dataset [4] containing 720 MRI scans and tissue samples, the COVID-CT-MD dataset [1] containing 305 CT scans, the Mossmeddata [32] containing 1110 CT scans of covid lungs, and more classifications challenges with 2-4 classes such as health, covid19, or pneumonia as is the case for the COVID-CT-MD dataset.
For 3D object detection, Baumgartner et al. [5] use 13 datasets to develop the nnDetection method. Two of these datasets were originally targeted 3D detection and include the LUNA16 for nodule detection [39], which is a subset of the LIDC dataset [3] and contains 888 CT scans of lungs, and the ADAM dataset [41] for detecting aneurysms in MRI scans. ADAM is made up of 254 MRI scans. The rest of the detection datasets are medical segmentation datasets such as data from the Medical Segmentation Decathlon [40], the rib fracture detection [21], the PROSTATEx dataset [4], and others. The segmentation datasets have been transformed into detection data by identifying center positions and bounding boxes for the segments.
3 Dataset
The BugNIST dataset has a classification and detection task. It consists of 9087 volumes of individual bugs of 12 types (species and stages) and an additional 350 volumes with mixtures of bugs, leaves, cotton, shredded paper, and wood shaving, where the number of bugs and other materials varies. We have used the dataset to investigate the problems of classifying species of scans that contain individual bugs, as well as counting, classifying and localizing species in the mixtures. To classify, count, and localize the bugs in the mixtures, the task is to learn the bug appearance from the scans of individual bugs and use this on the mixtures.
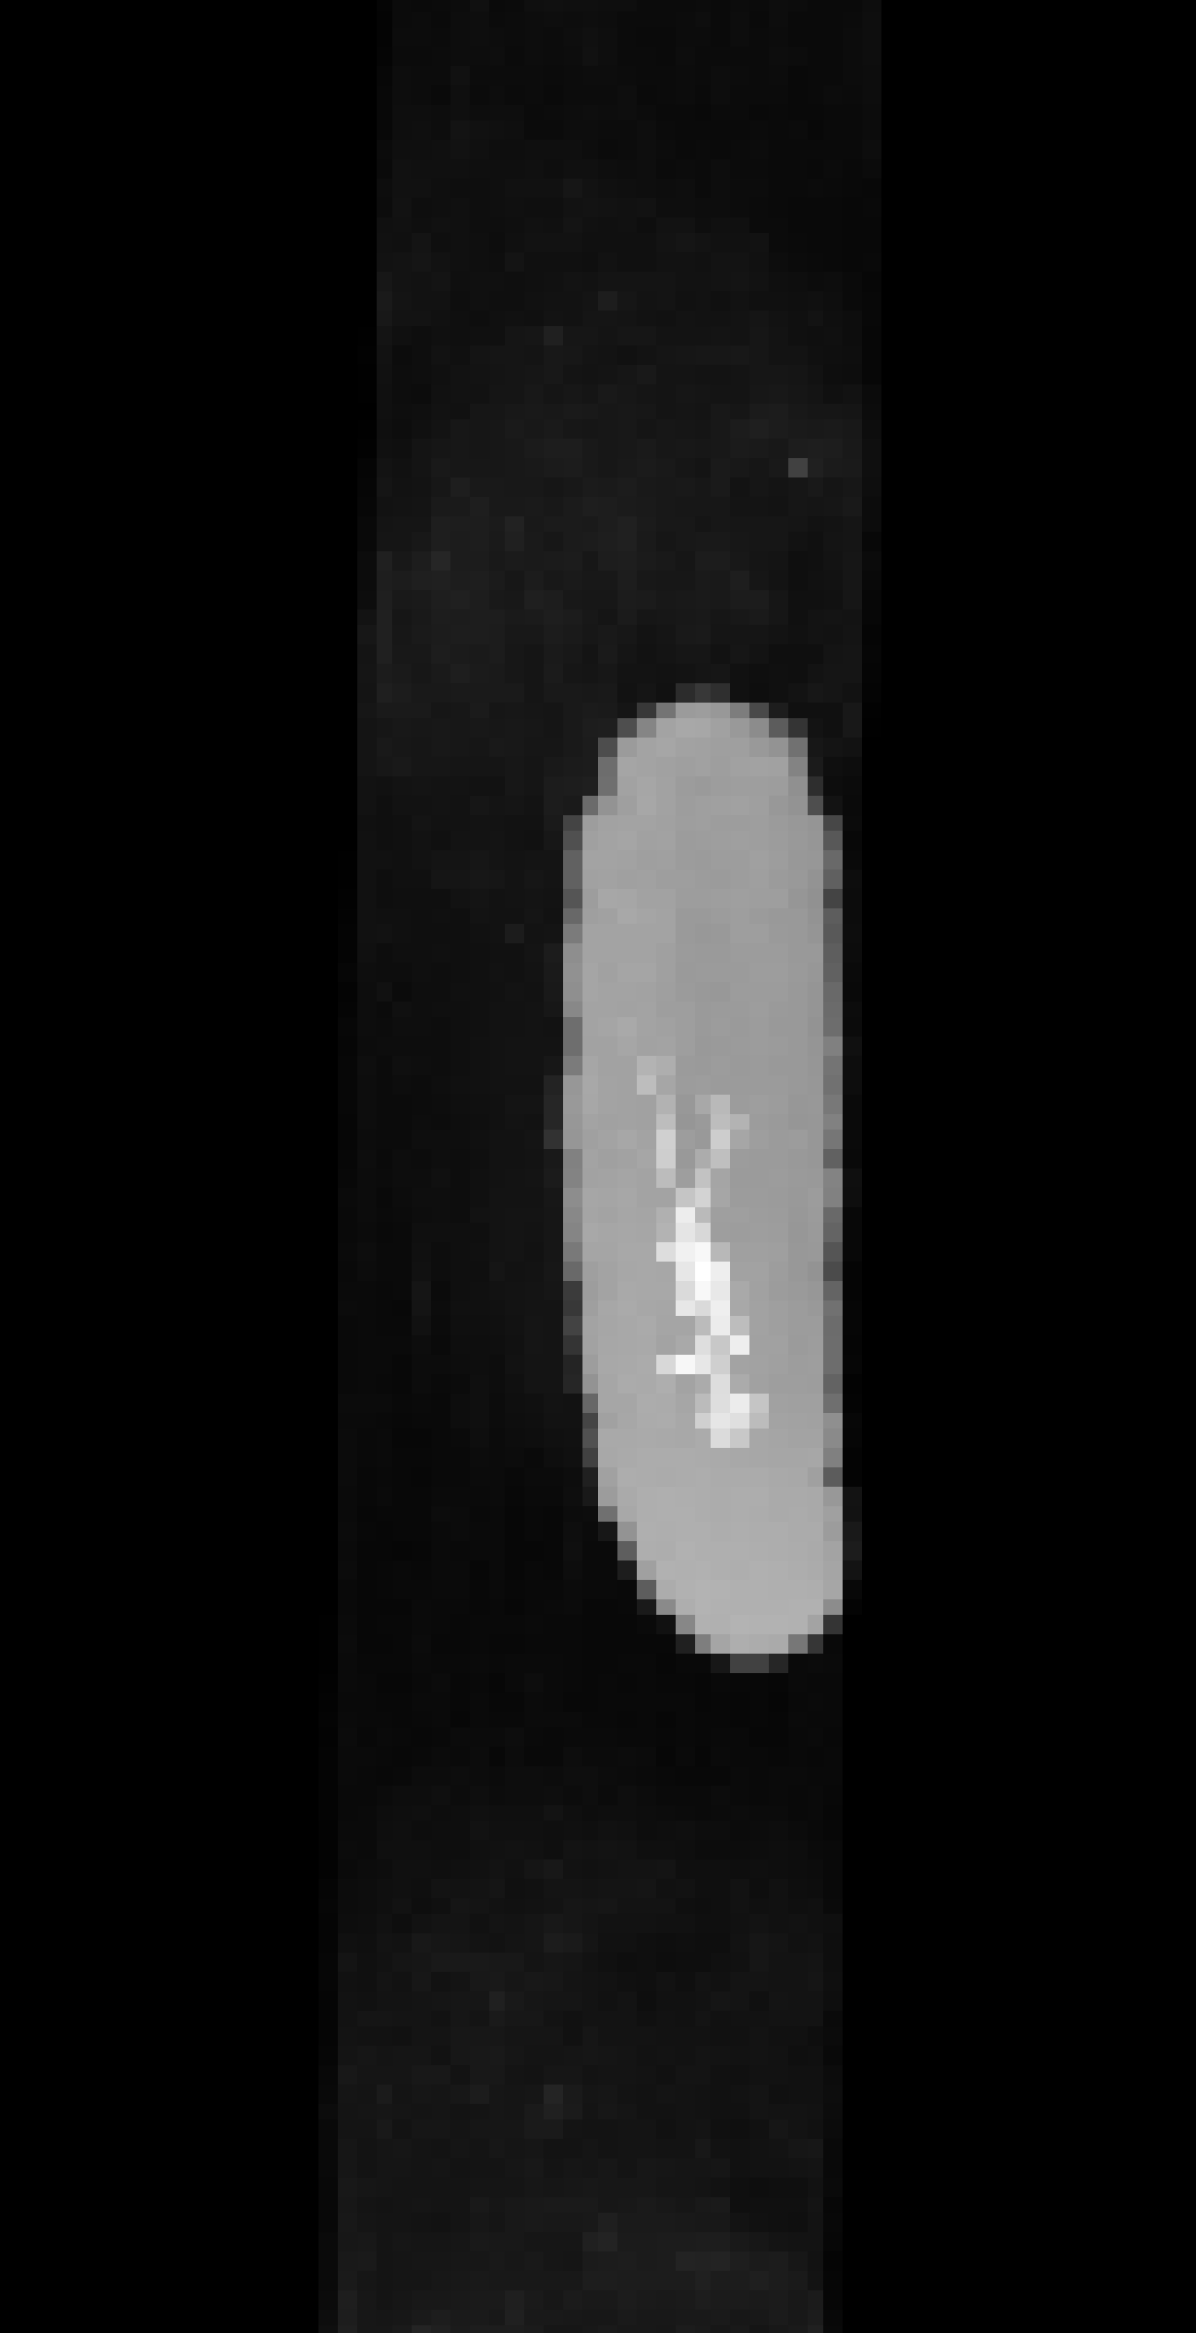
Our data is obtained using a laboratory µCT scanner (Nikon metrology scanner) that records volumes of 2000 voxels cubed with an isotropic voxel size of 26.62 µm. These large volumes have allowed us to scan multiple bugs at once, and then crop them into smaller volumes. To scan individual bugs, we made a setup with the bugs placed in plastic straws spaced with cotton. Each straw was 6 cm long and contained 2-3 bugs with cotton in between. By bundling the straws, we scanned between 40 and 150 bugs at once.
We used two types of straws, one with a diameter of 5 mm and another with a diameter of 9 mm, depending on the size of each bug type. The cylindrical shape of the straws was easy to segment using a circular Hough-transform [47] and sparse layered graphs [20], leaving us with a cylinder of only bugs and cotton. The X-ray absorption of cotton is low, which makes it almost transparent compared to the bugs, so we just kept the cotton and air part in the cylinder.
A similar setup was applied for the mixtures, but instead of straws, we used test tubes with a diameter of 14 mm. With this setup we can obtain 14 mixtures from each µCT scan. To vary the difficulty of the bug counting and detection problem in the mixtures, we added either leaves, shredded paper, or wood shavings to some of the mixtures together with cotton, which was used for spacing. We also varied the number of bugs, their species, and how dense they were packed.
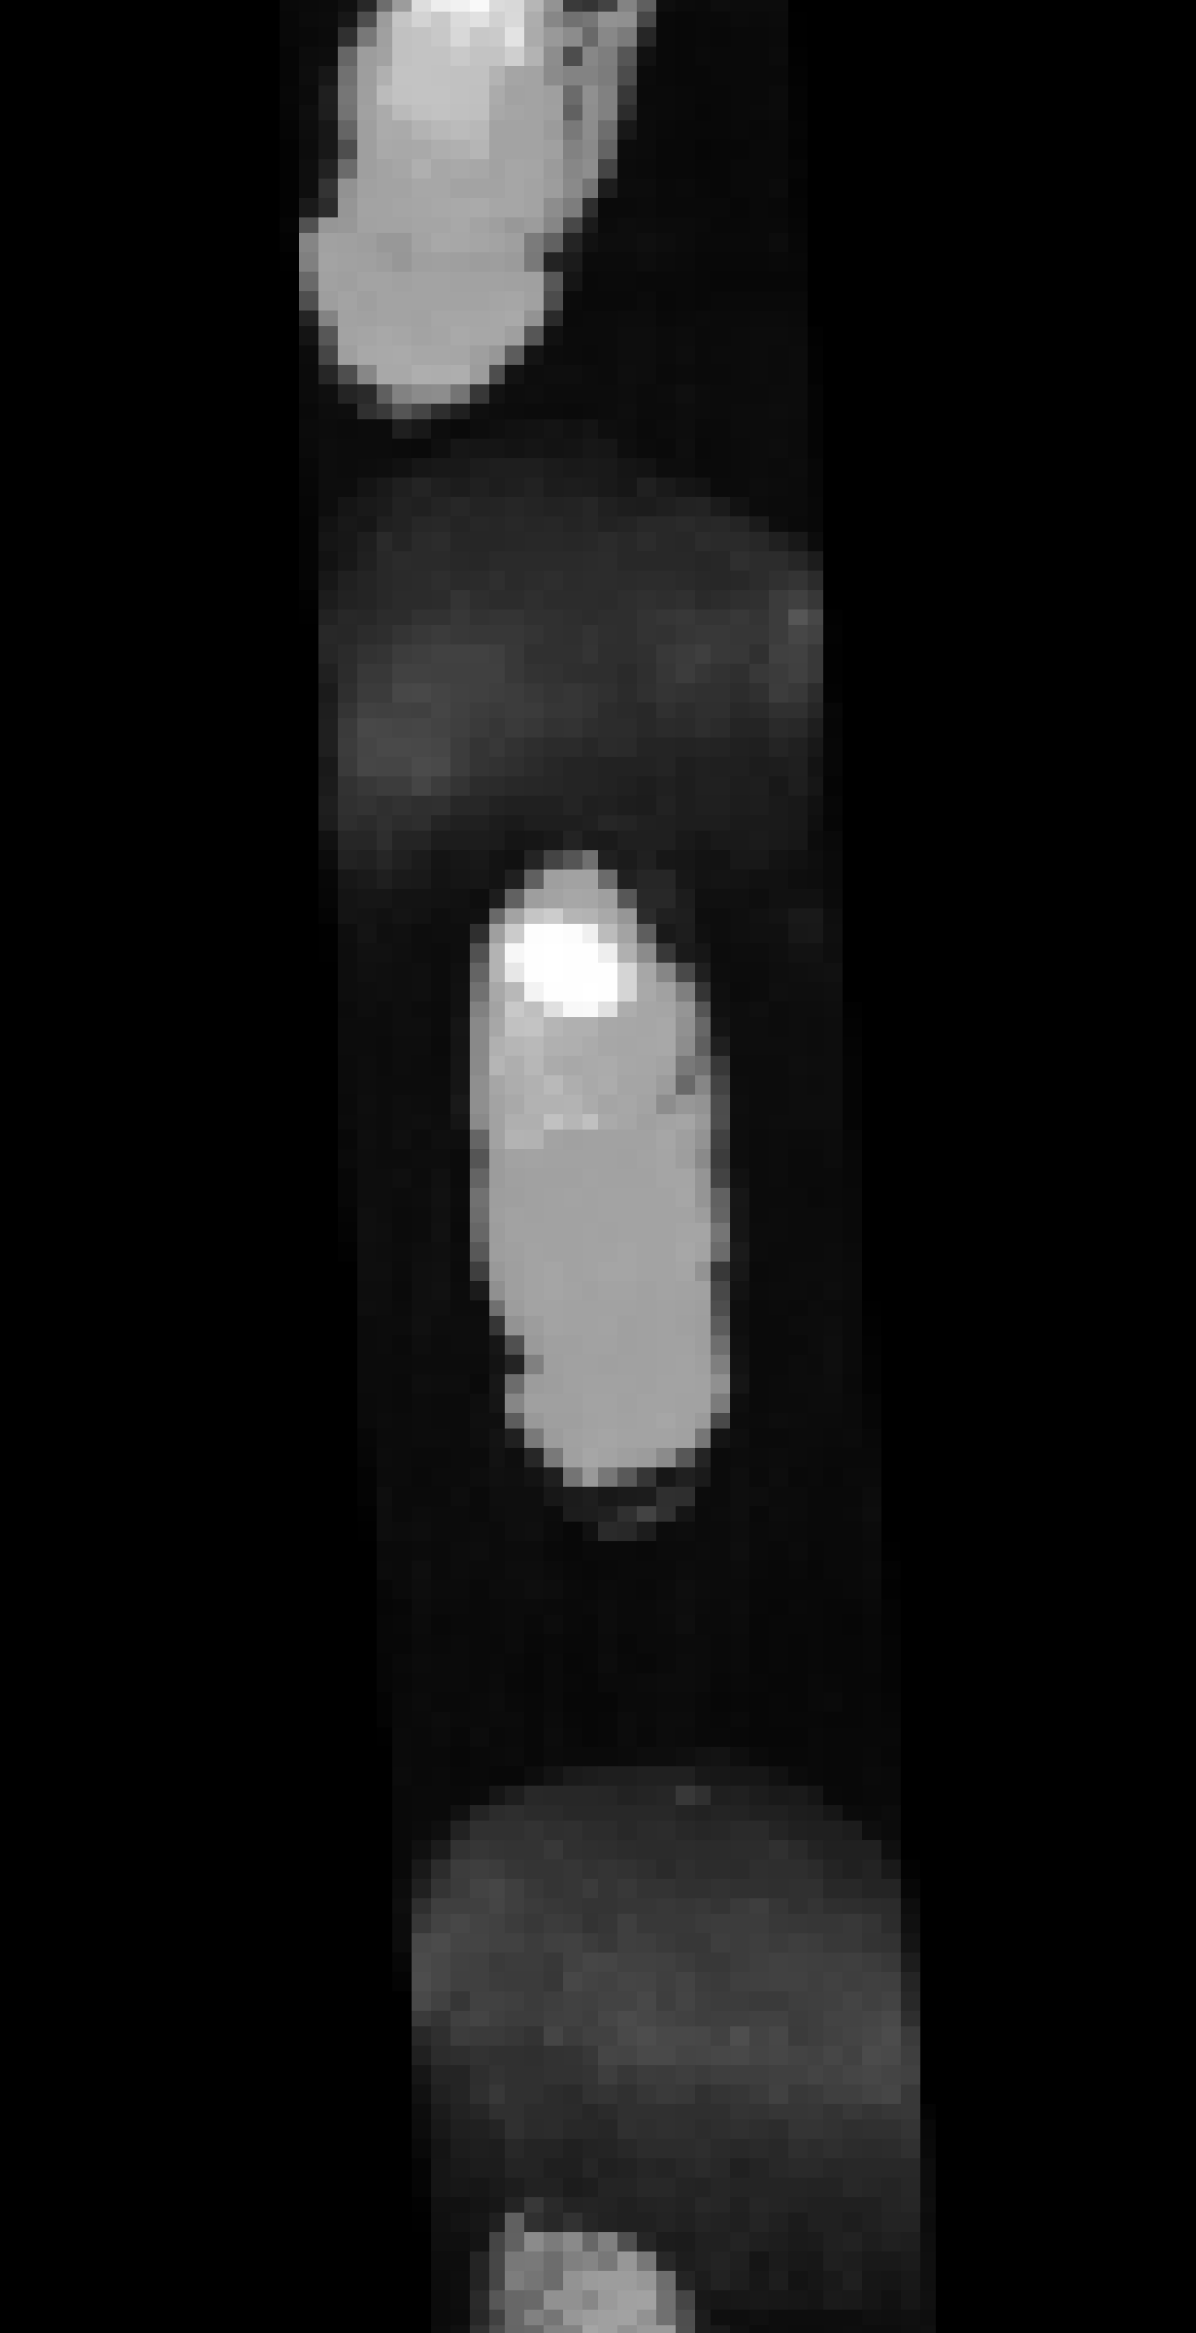
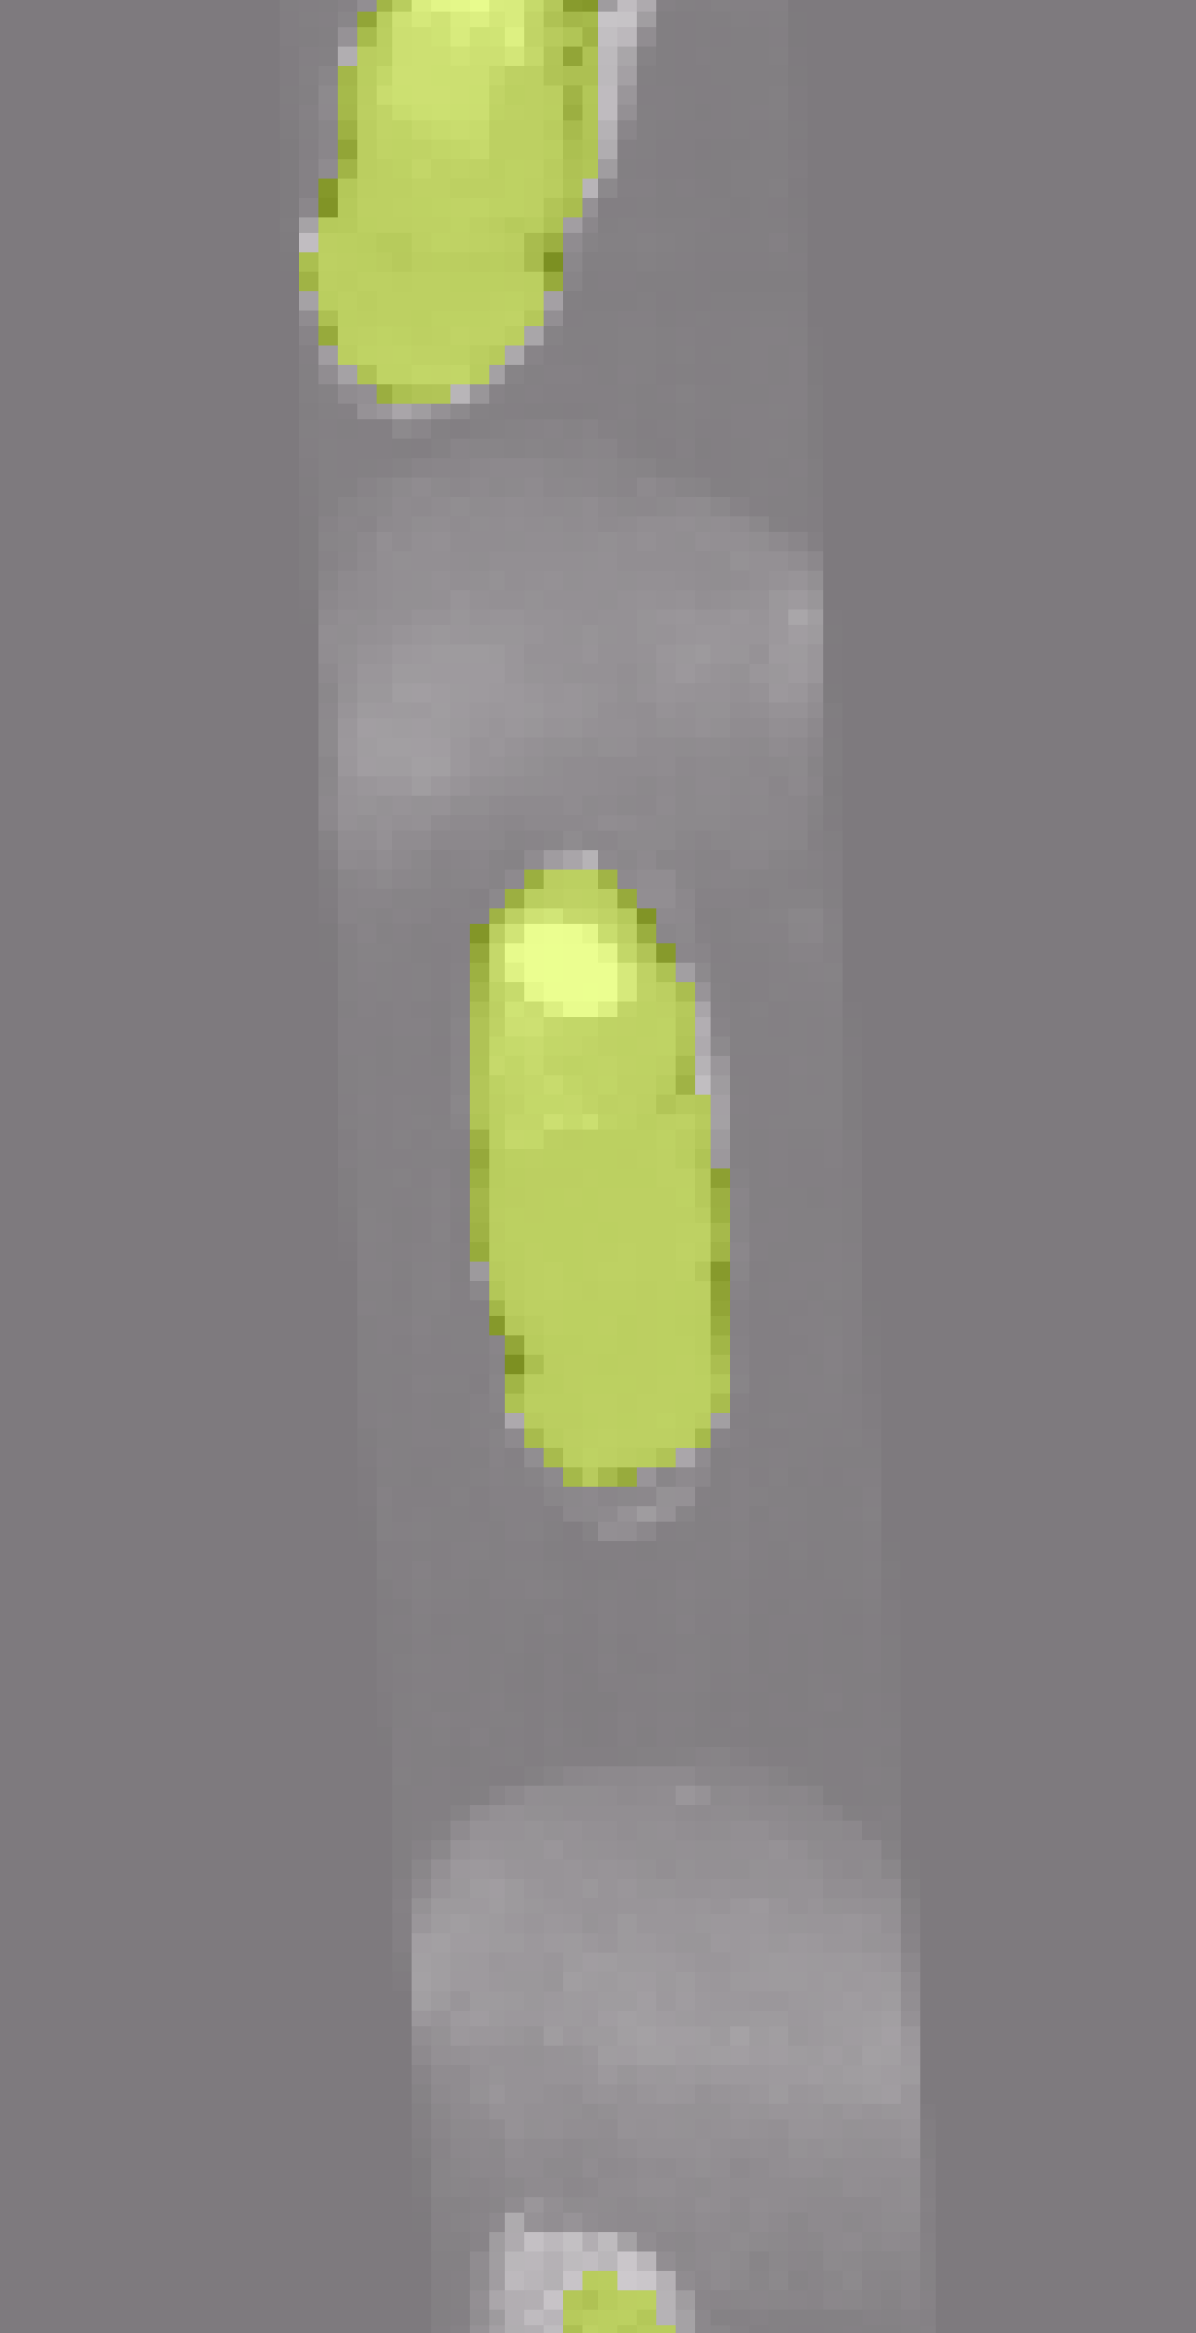
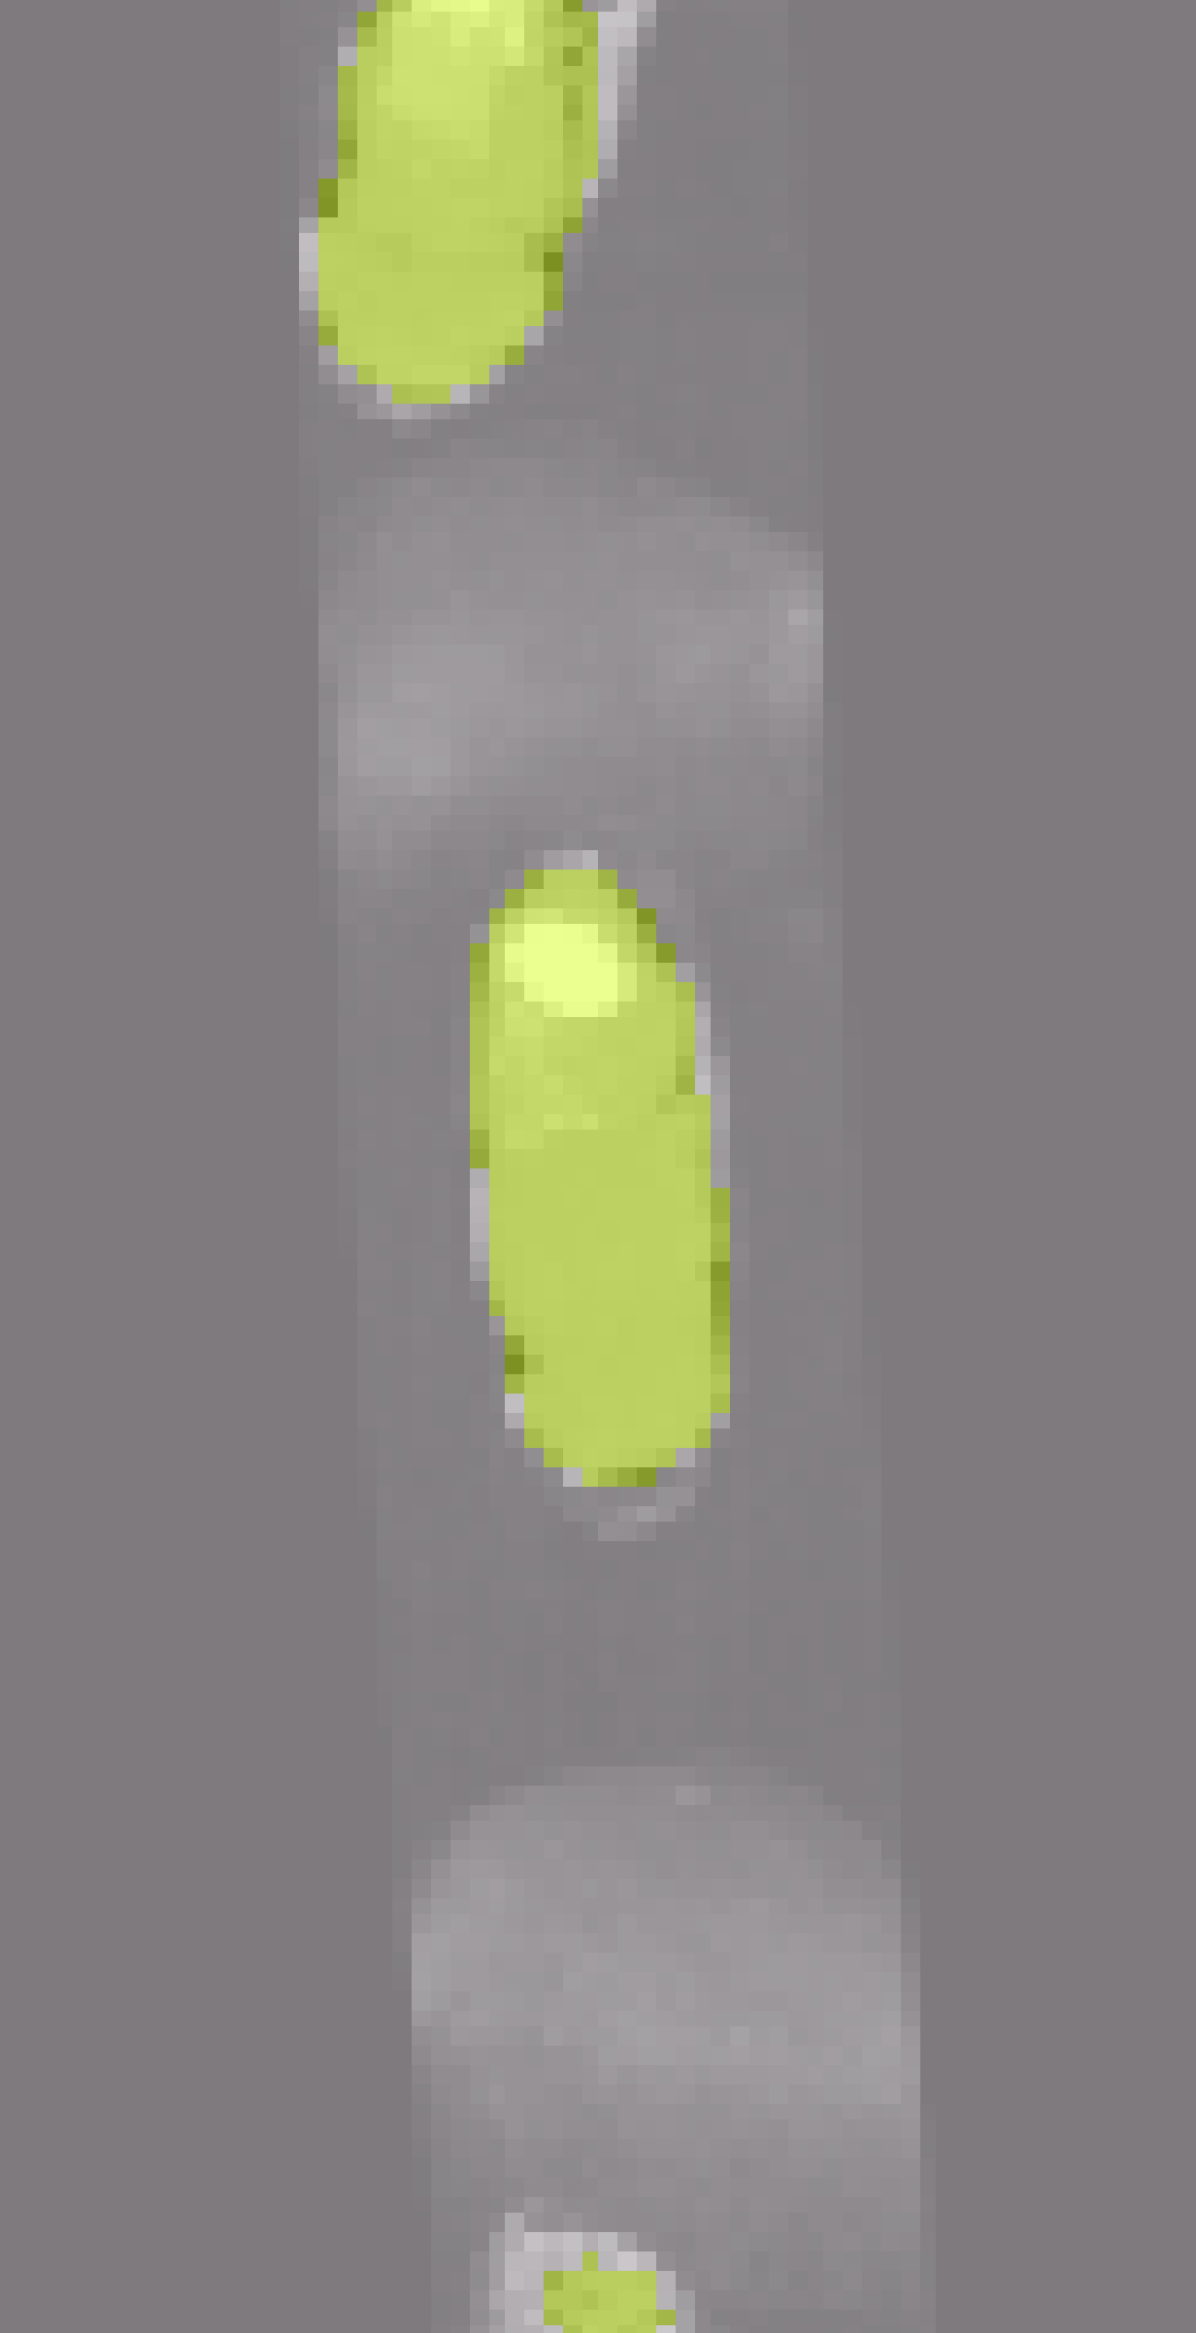
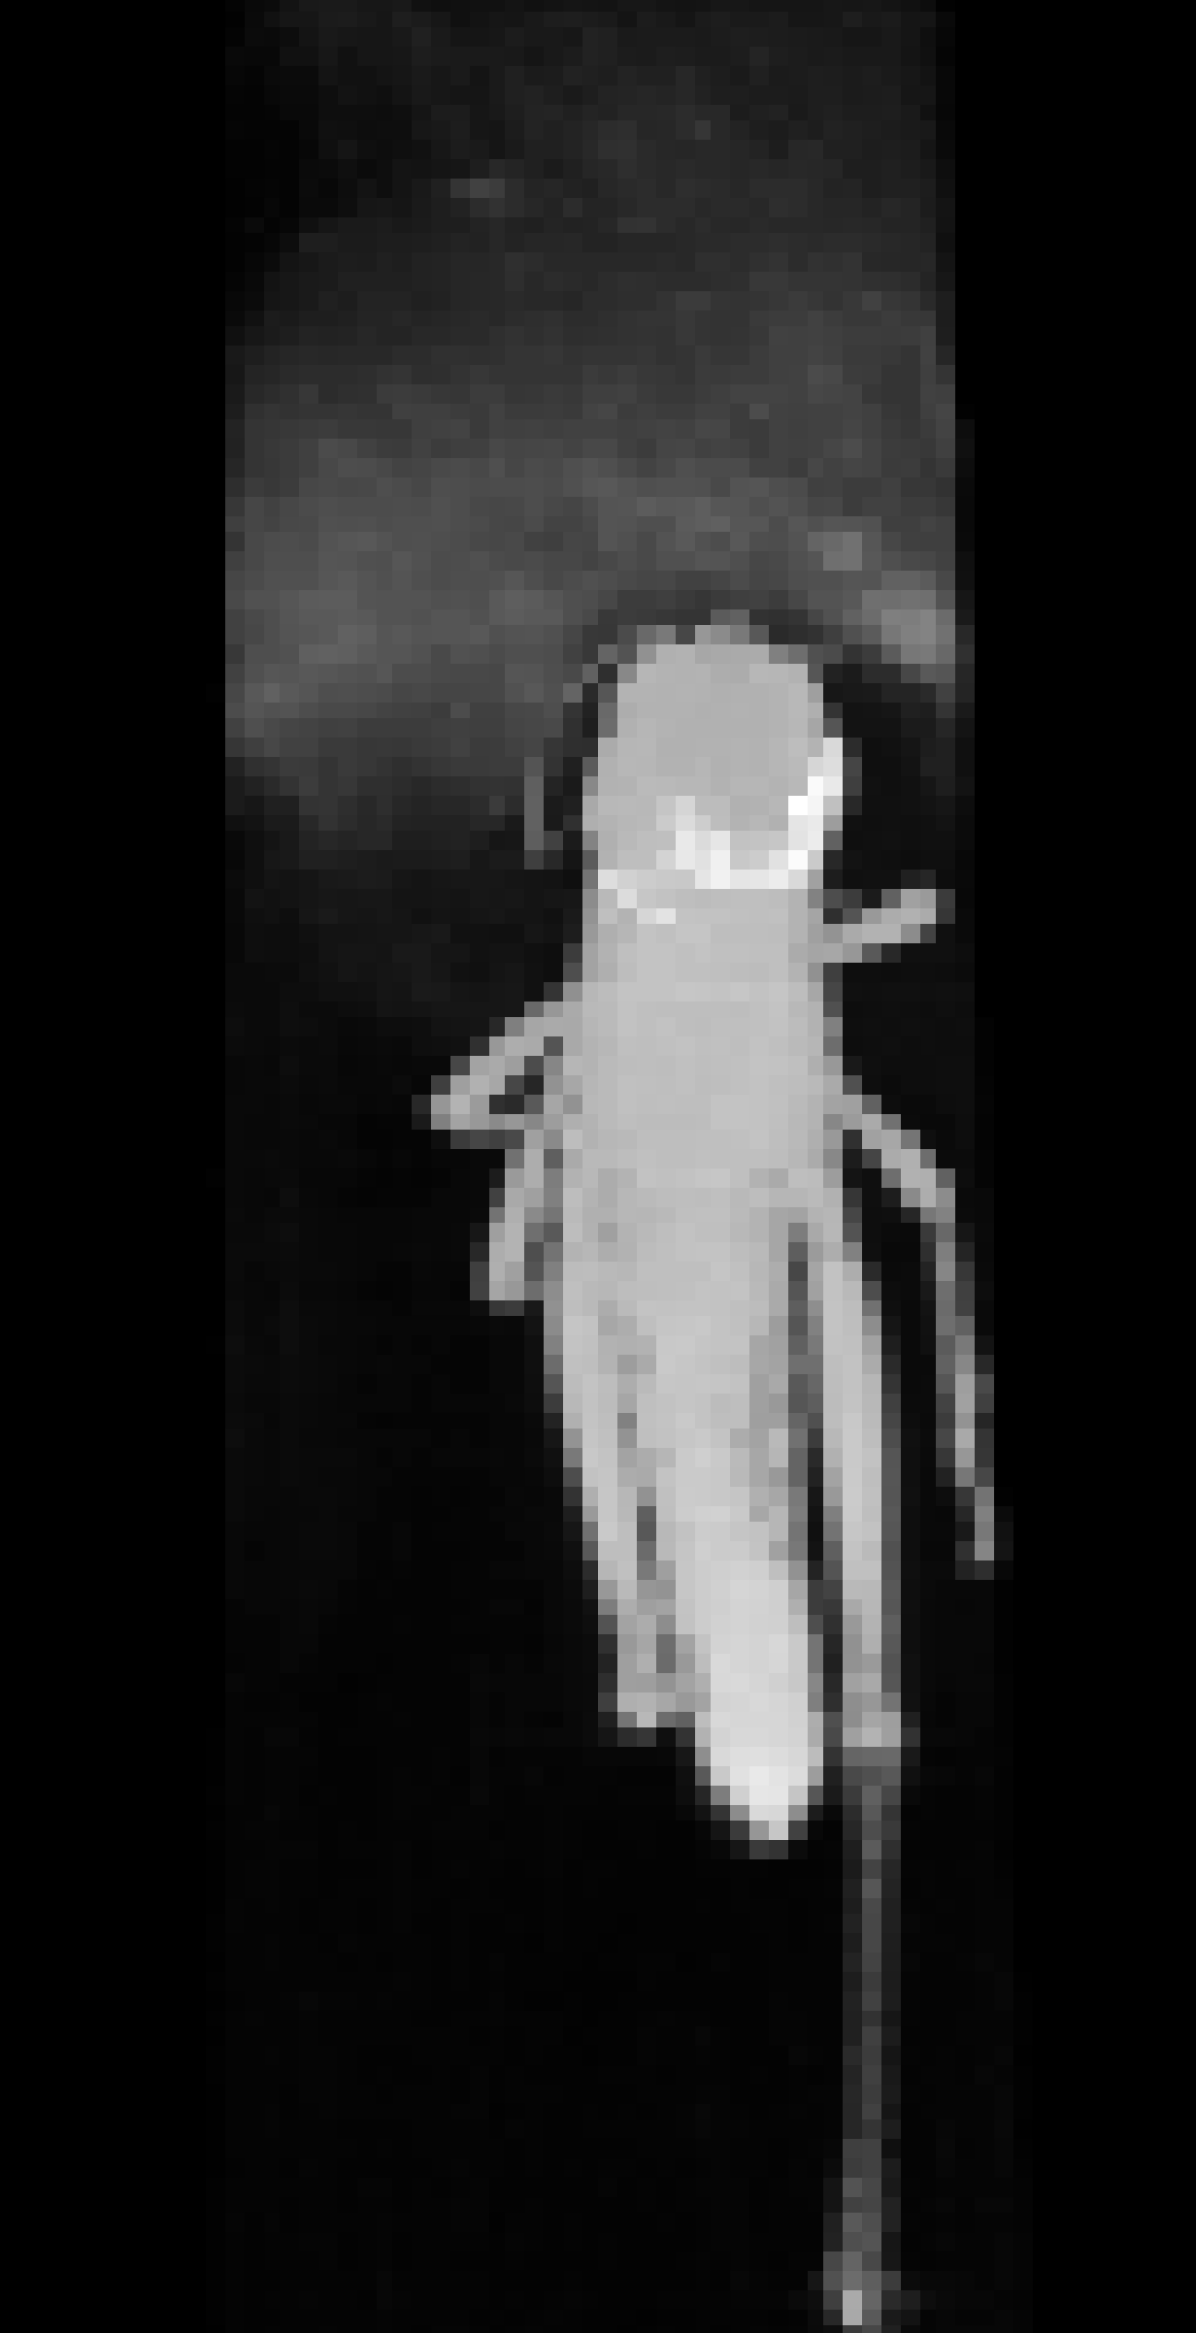
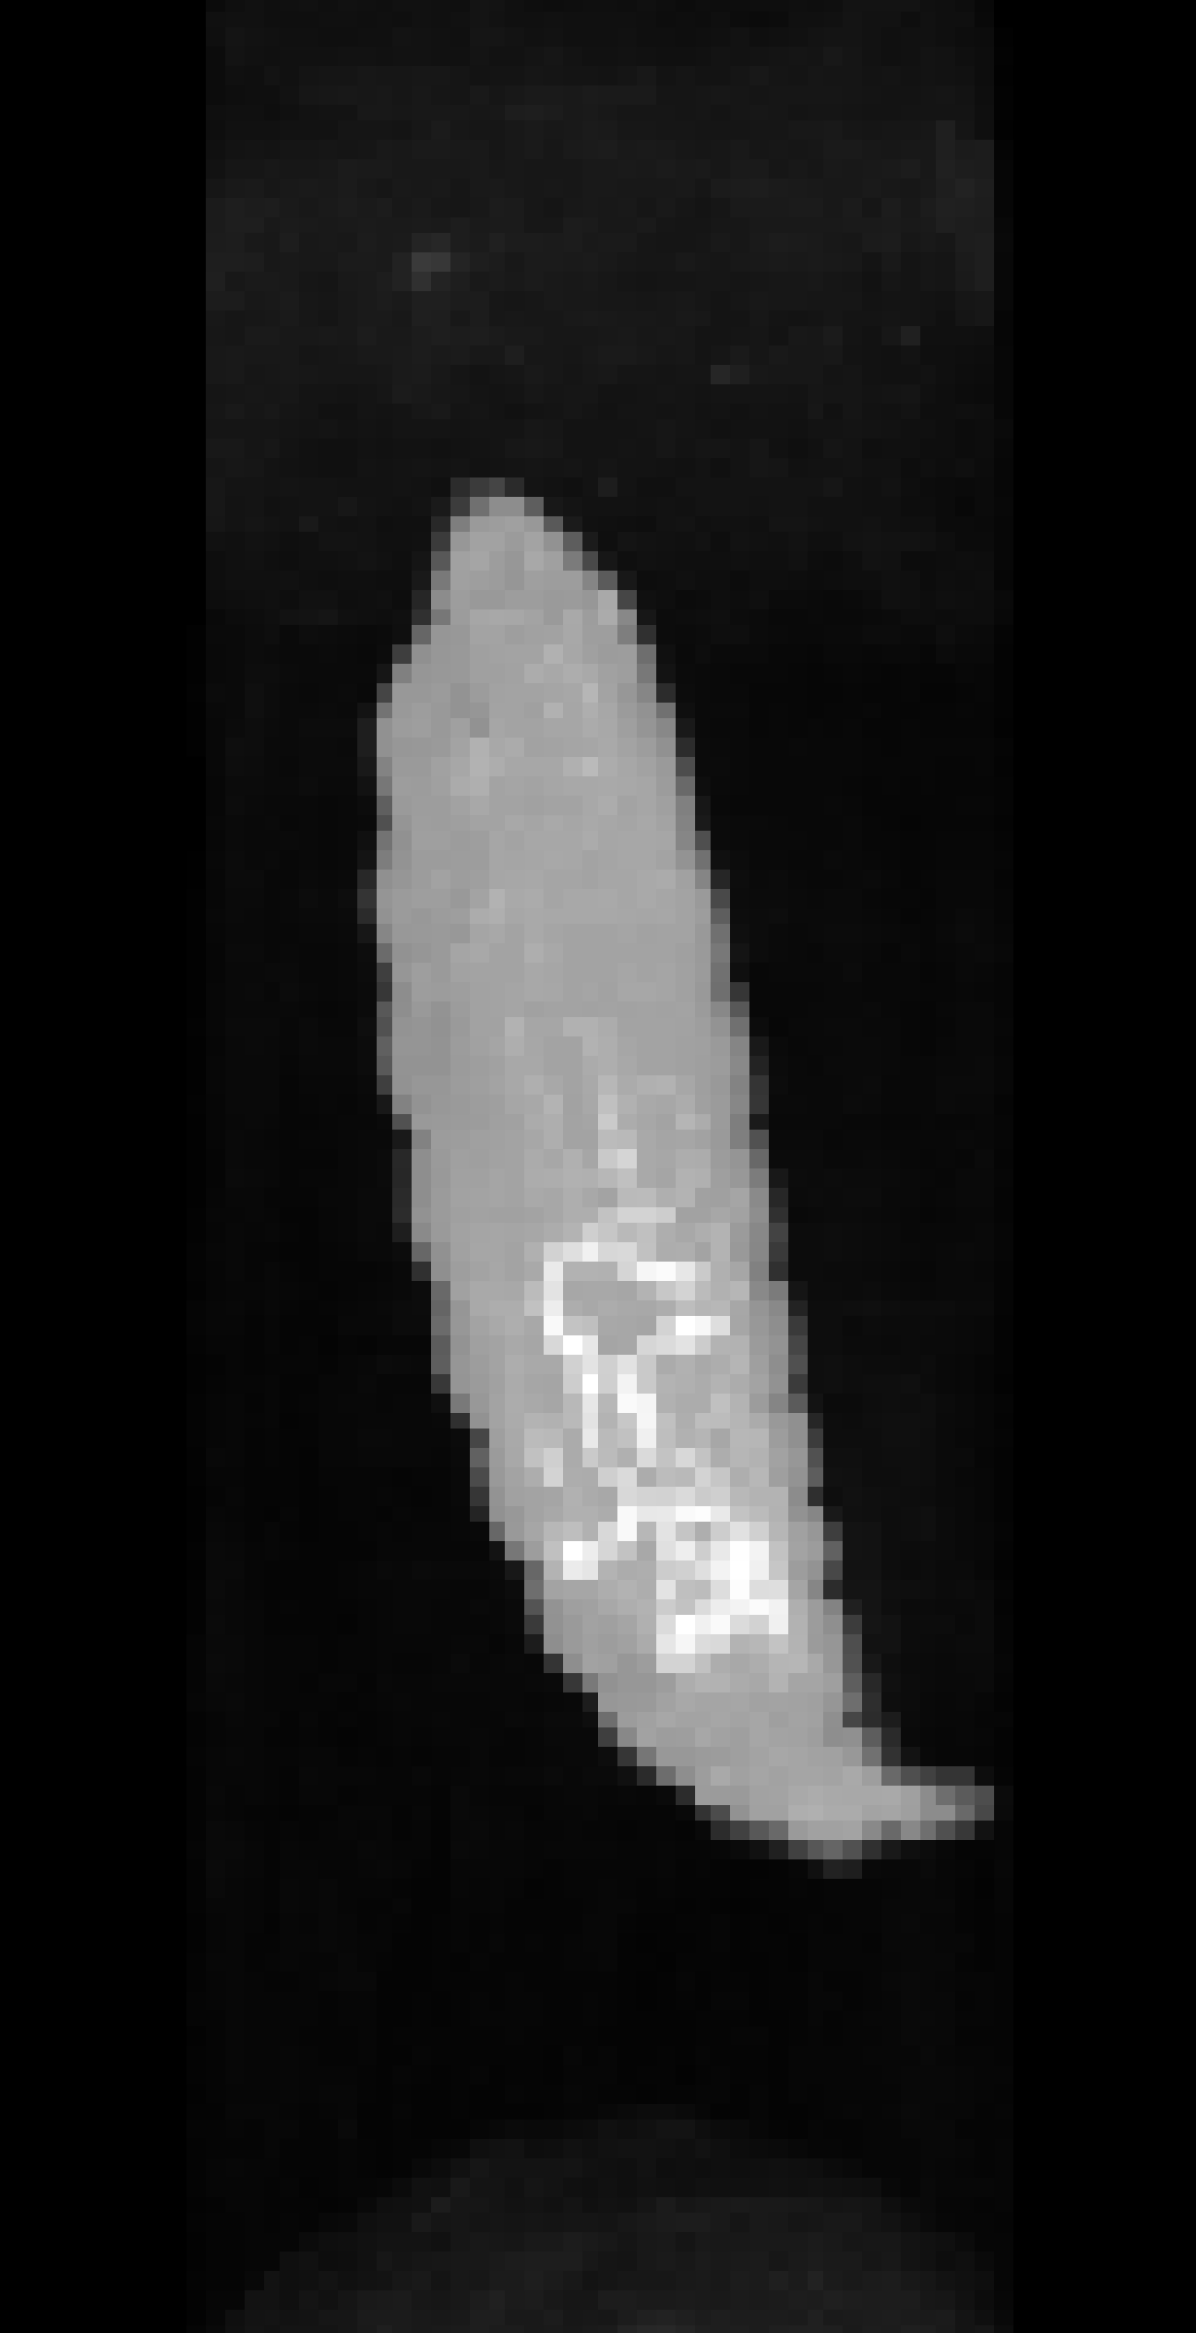
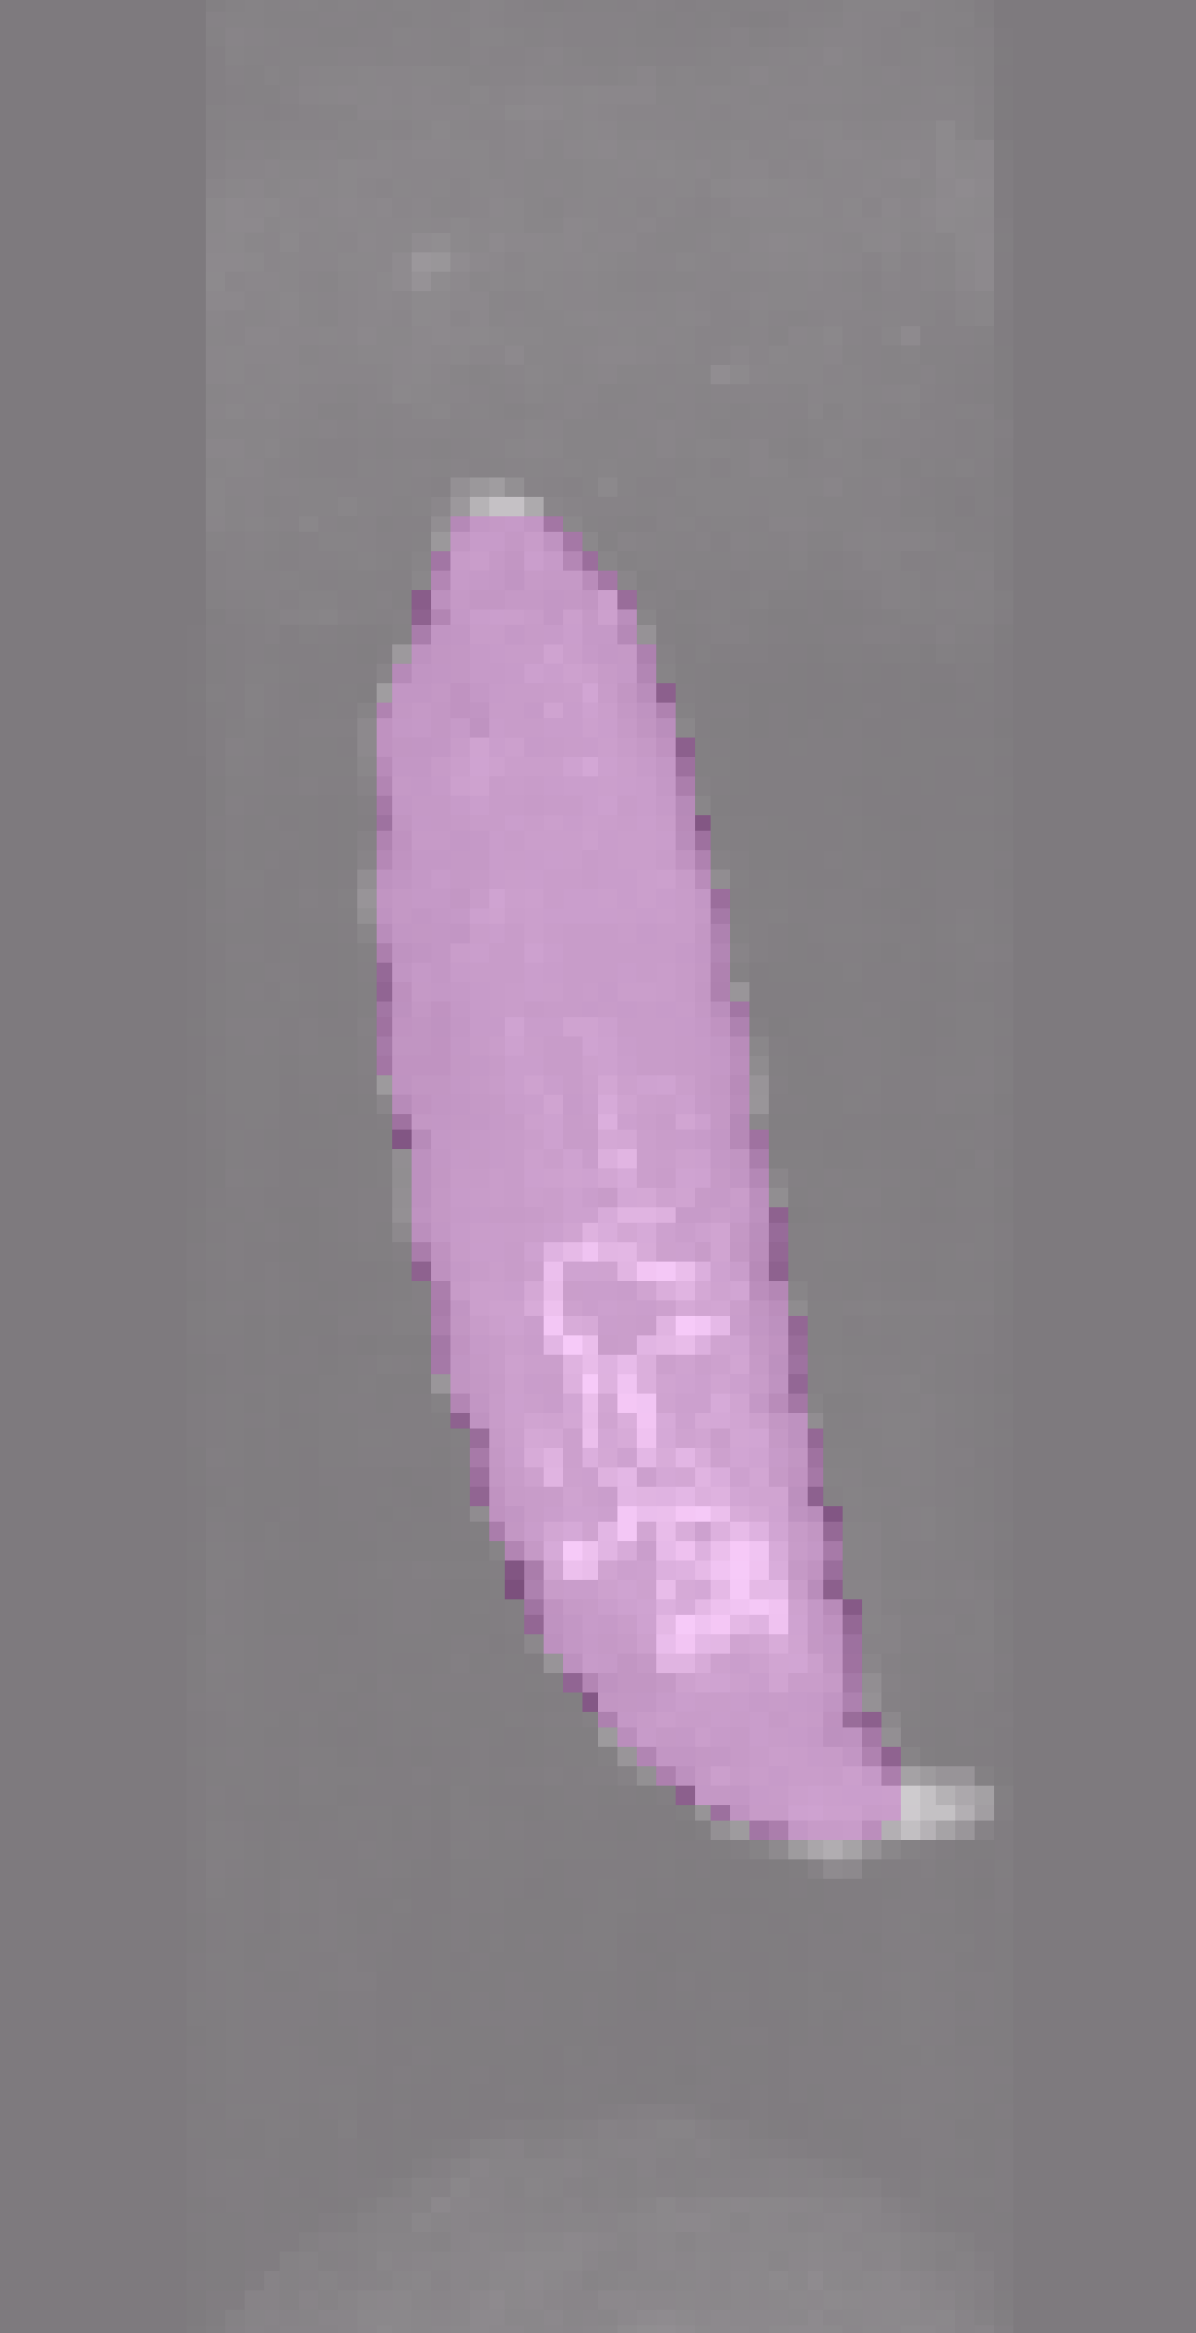
The final volumes of scans of individual bugs are voxels. They were obtained by placing the segmented cylinder centered in the volume and along the full voxels length of the volume. Areas outside the cylinder were set to zero. The mixtures were segmented in the same way and the resulting volumes are voxels. All the volumes are stored as 8-bit unsigned integers, but with their original spatial resolution (physical voxel size). The scans are illustrated in fig. 2.
The bugs included in the BugNIST data are bred as fodder for pets and have been frozen before being packed for scanning. Despite careful packing, the scanned bugs may appear damaged, e.g. some of the crickets have broken off antennas or miss a leg. We have chosen to accept these defects because this also reflects w—hat you would expect to meet in a normal population, and add to the challenge of the dataset. In the 5 mm straws, i.e., for the two types of fly pupae, buffalo beetle larvae, maggots, curly-wing flies, and woodlice, we packed three bugs into each straw. This means that bugs were placed close together, and due to variations in the packing, some volumes have parts of the bug above or below the cropped-out volume.
To create lightweight datasets for classification, we downsized the volumes to the datasets x64, x128, x256, and x512, where x64 is of size , x128 is , etc. These datasets have further been split into training (60%), validation (10%), and test sets (30%). We also made another variation of the datasets where the bugs were aligned and resized to approximately the same size. The axis alignment was done by aligning the bugs along the principal directions of thresholded bug volumes. The size of the bugs was determined by the lengths of the principal axes.
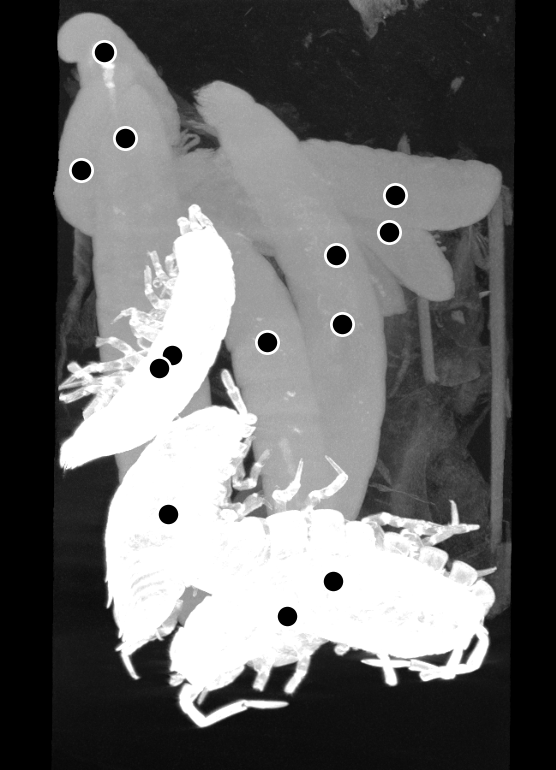
For the mixtures, we counted the bugs that were placed in the mixtures when we packed them. This gives a ground truth for the models trained to predict the number of bugs in a mixture and their species. This can, however, not be used to determine where in the volume the bugs are detected. To facilitate that the BugNIST data can be used for detection, we have manually marked the center positions of the bugs in a subset of 45 mixed volumes. We have only marked the center position and not bounding boxes because some of the bugs, e.g. mealworms, are very elongated. If such a bug lies diagonal to the volume axis, its bounding box could take up most of the volume, and therefore contain much more than that bug. Manually annotating the center position of the bugs is time-consuming, which is the reason for only annotating a smaller fraction of the mixtures. Since the annotations are used for testing, and not for training and validation, this number of annotations is sufficient for evaluating a method.
4 Experiments
To illustrate the use of the BugNIST dataset, we have made baseline results for the proposed tasks including classification, counting, and detection. To classify scans of individual bugs, we have selected a set of high-performing classification methods. The detection problem has been solved based on a multi-label segmentation approach.
Classification
The investigated classification methods are DenseNet [17], ResNet [15], SEResNet50 [16] and Vision Transformers [10] from MONAI [6] and Swin Transformers [26, 27] and ConvNext [28] from torchvision [30]. The torchvision models were adapted to 3D by us. These models are selected because they are well-known for their high performance and span both older tried-and-tested methods and new state-of-the-art models. We train the models on the non-mix volumes to predict the bug species. After every epoch, we evaluate the models on the validation set and keep the best model. After training, we evaluate the model on the test set. We provide the remaining details on the training setup in the supplementary materials.
Detection
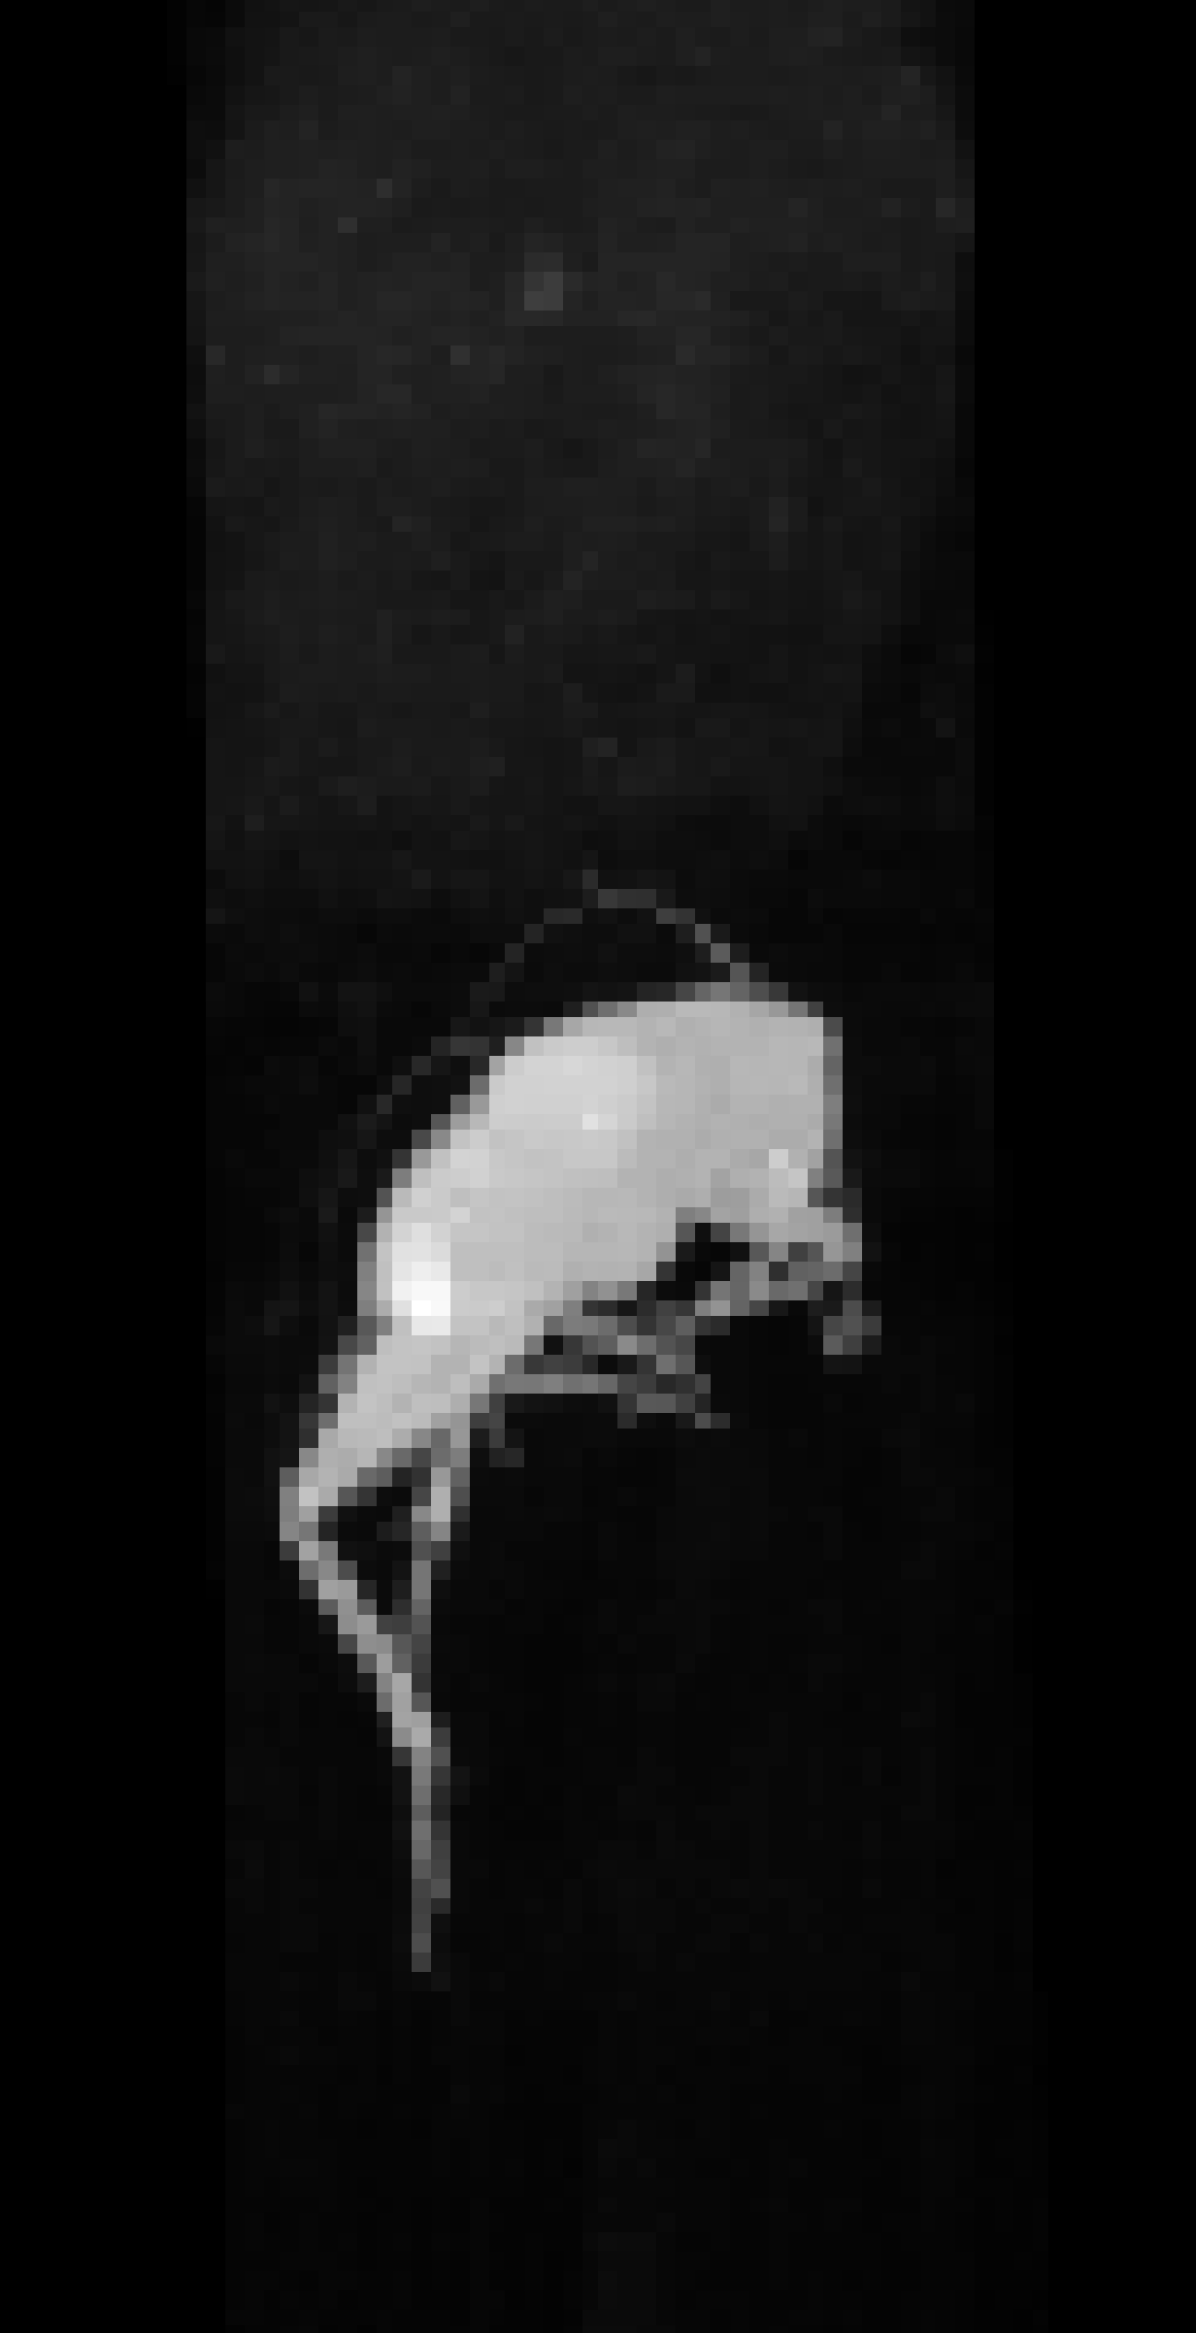
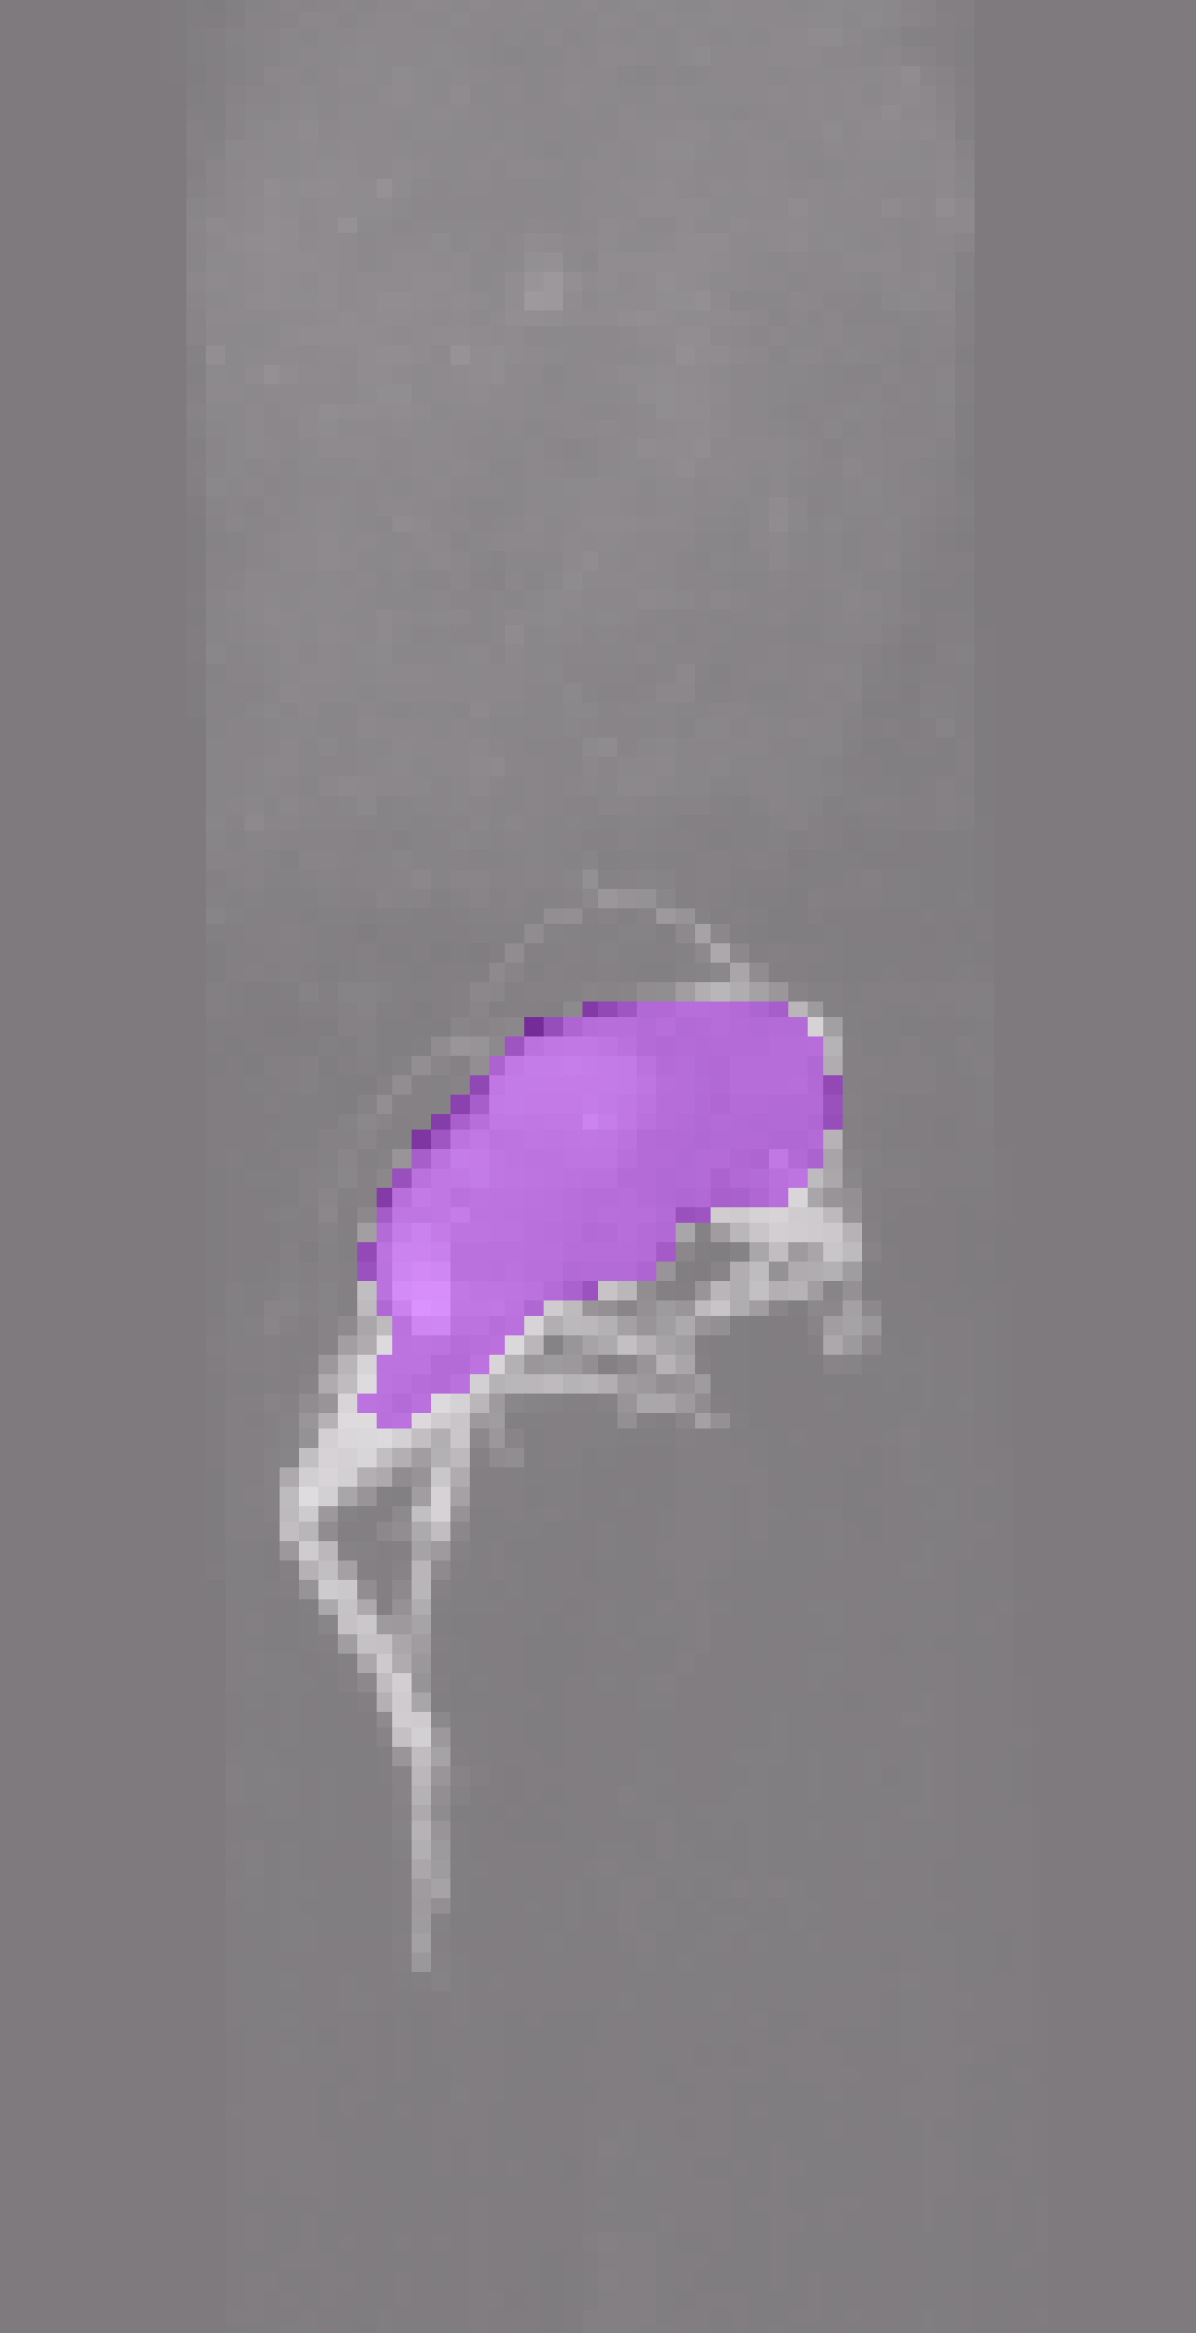
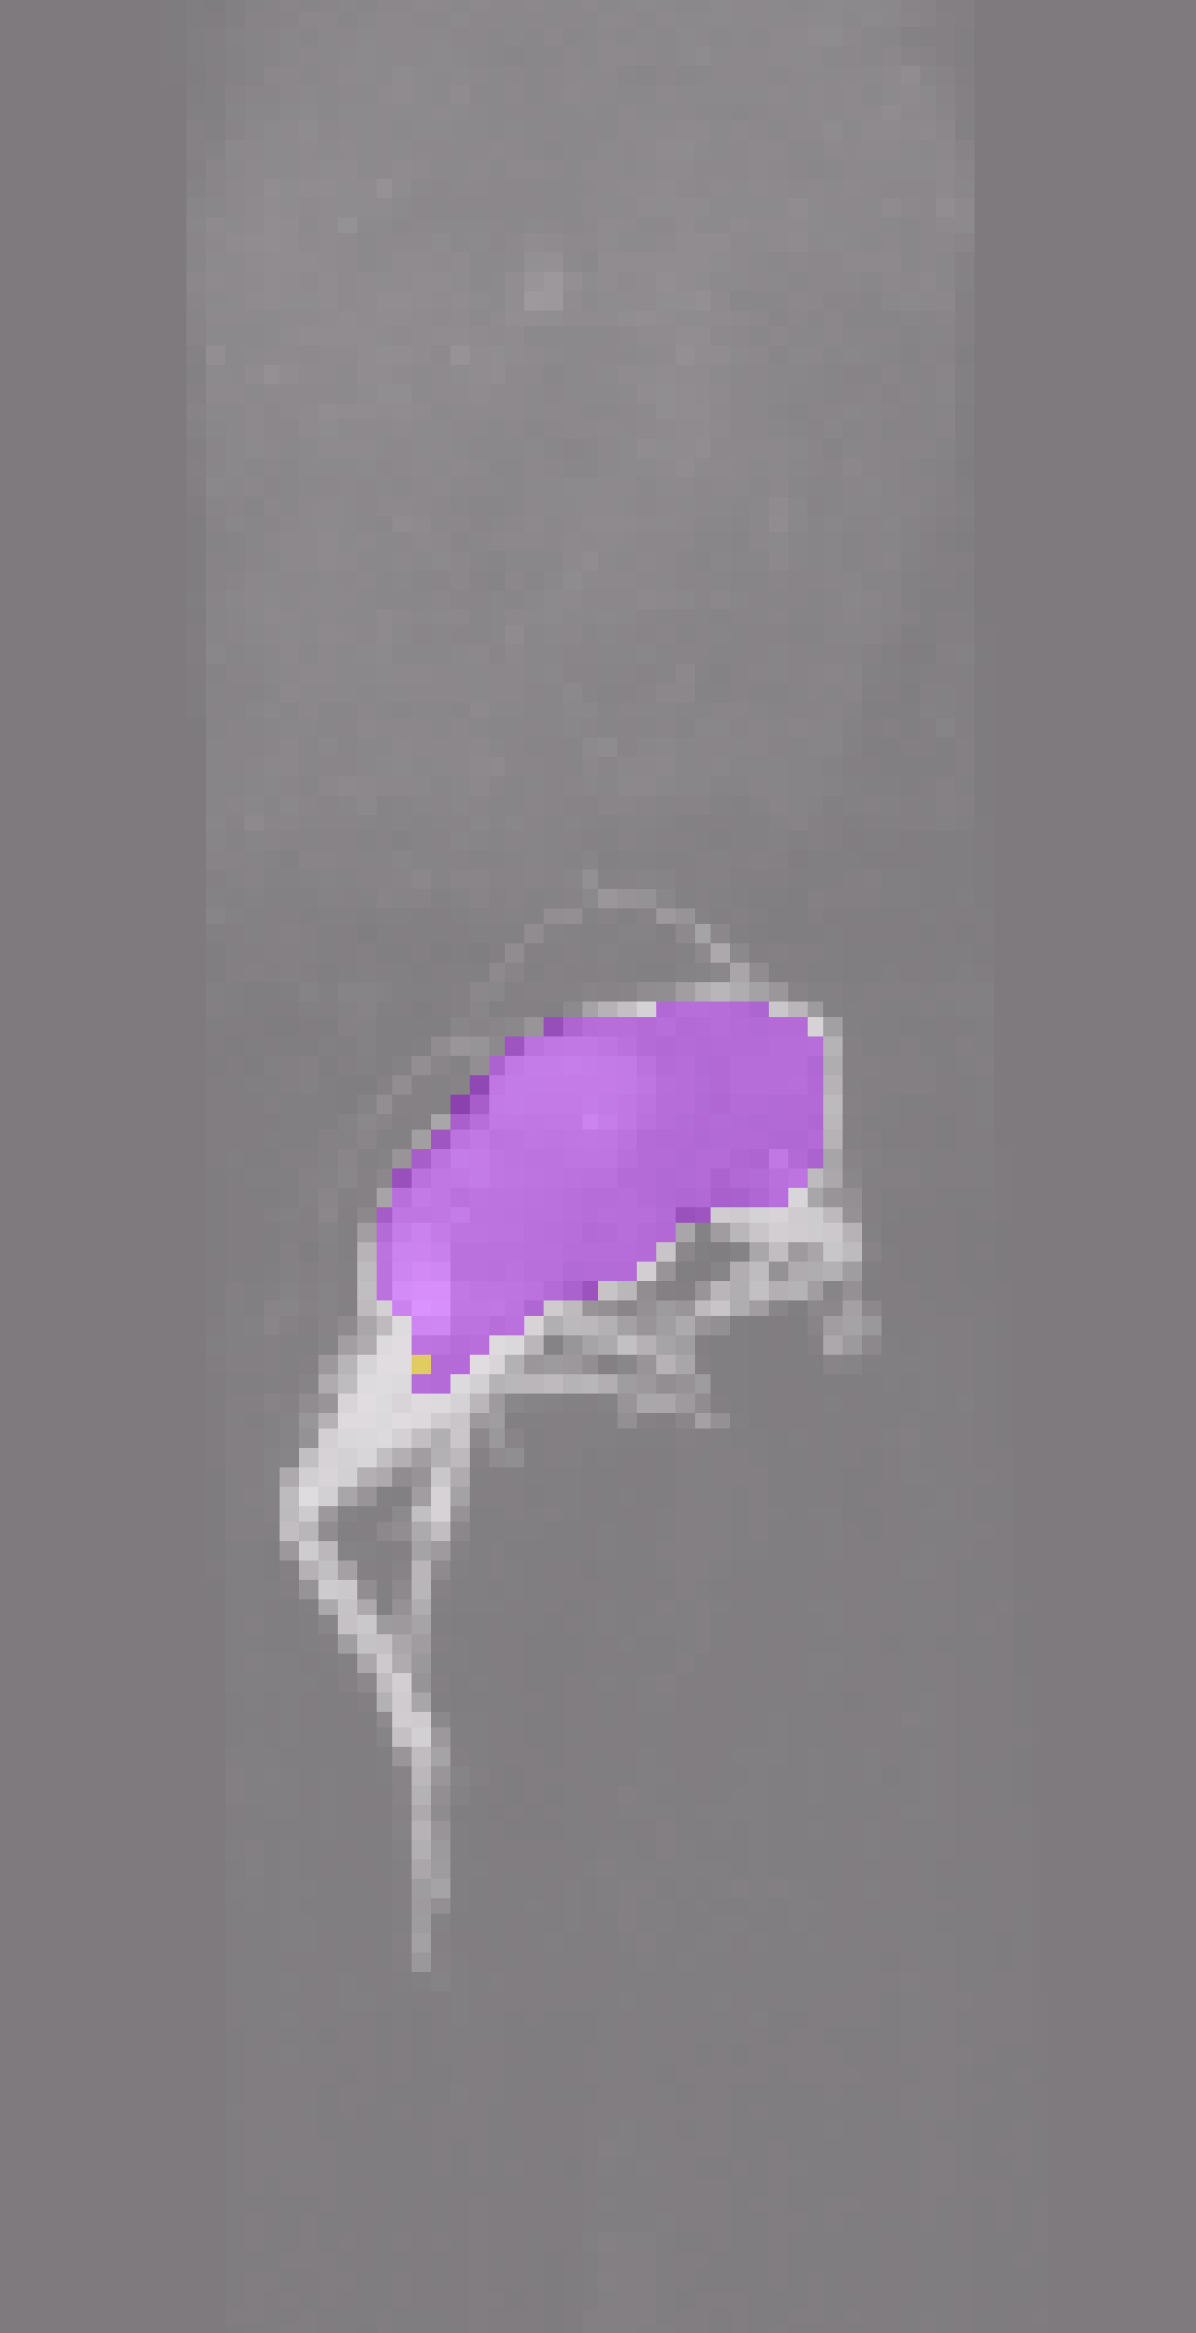
For detection, we investigate two methods. First, a simple baseline using U-Net [9] from MONAI [6] which is trained to segment bugs in the classification data. We extract semantic segmentation masks by first smoothing each image with a Gaussian kernel of std. 2 voxels, thresholding, and then adding the known label to the mask. Thus, each voxel has one of 13 labels: background or one of the twelve bugs. We train the model on the training and validation set, and evaluate on the test set after every epoch. After training, we apply the best model to the mixture images where each connected component is counted as a detection. Full details are in the supplementary materials.
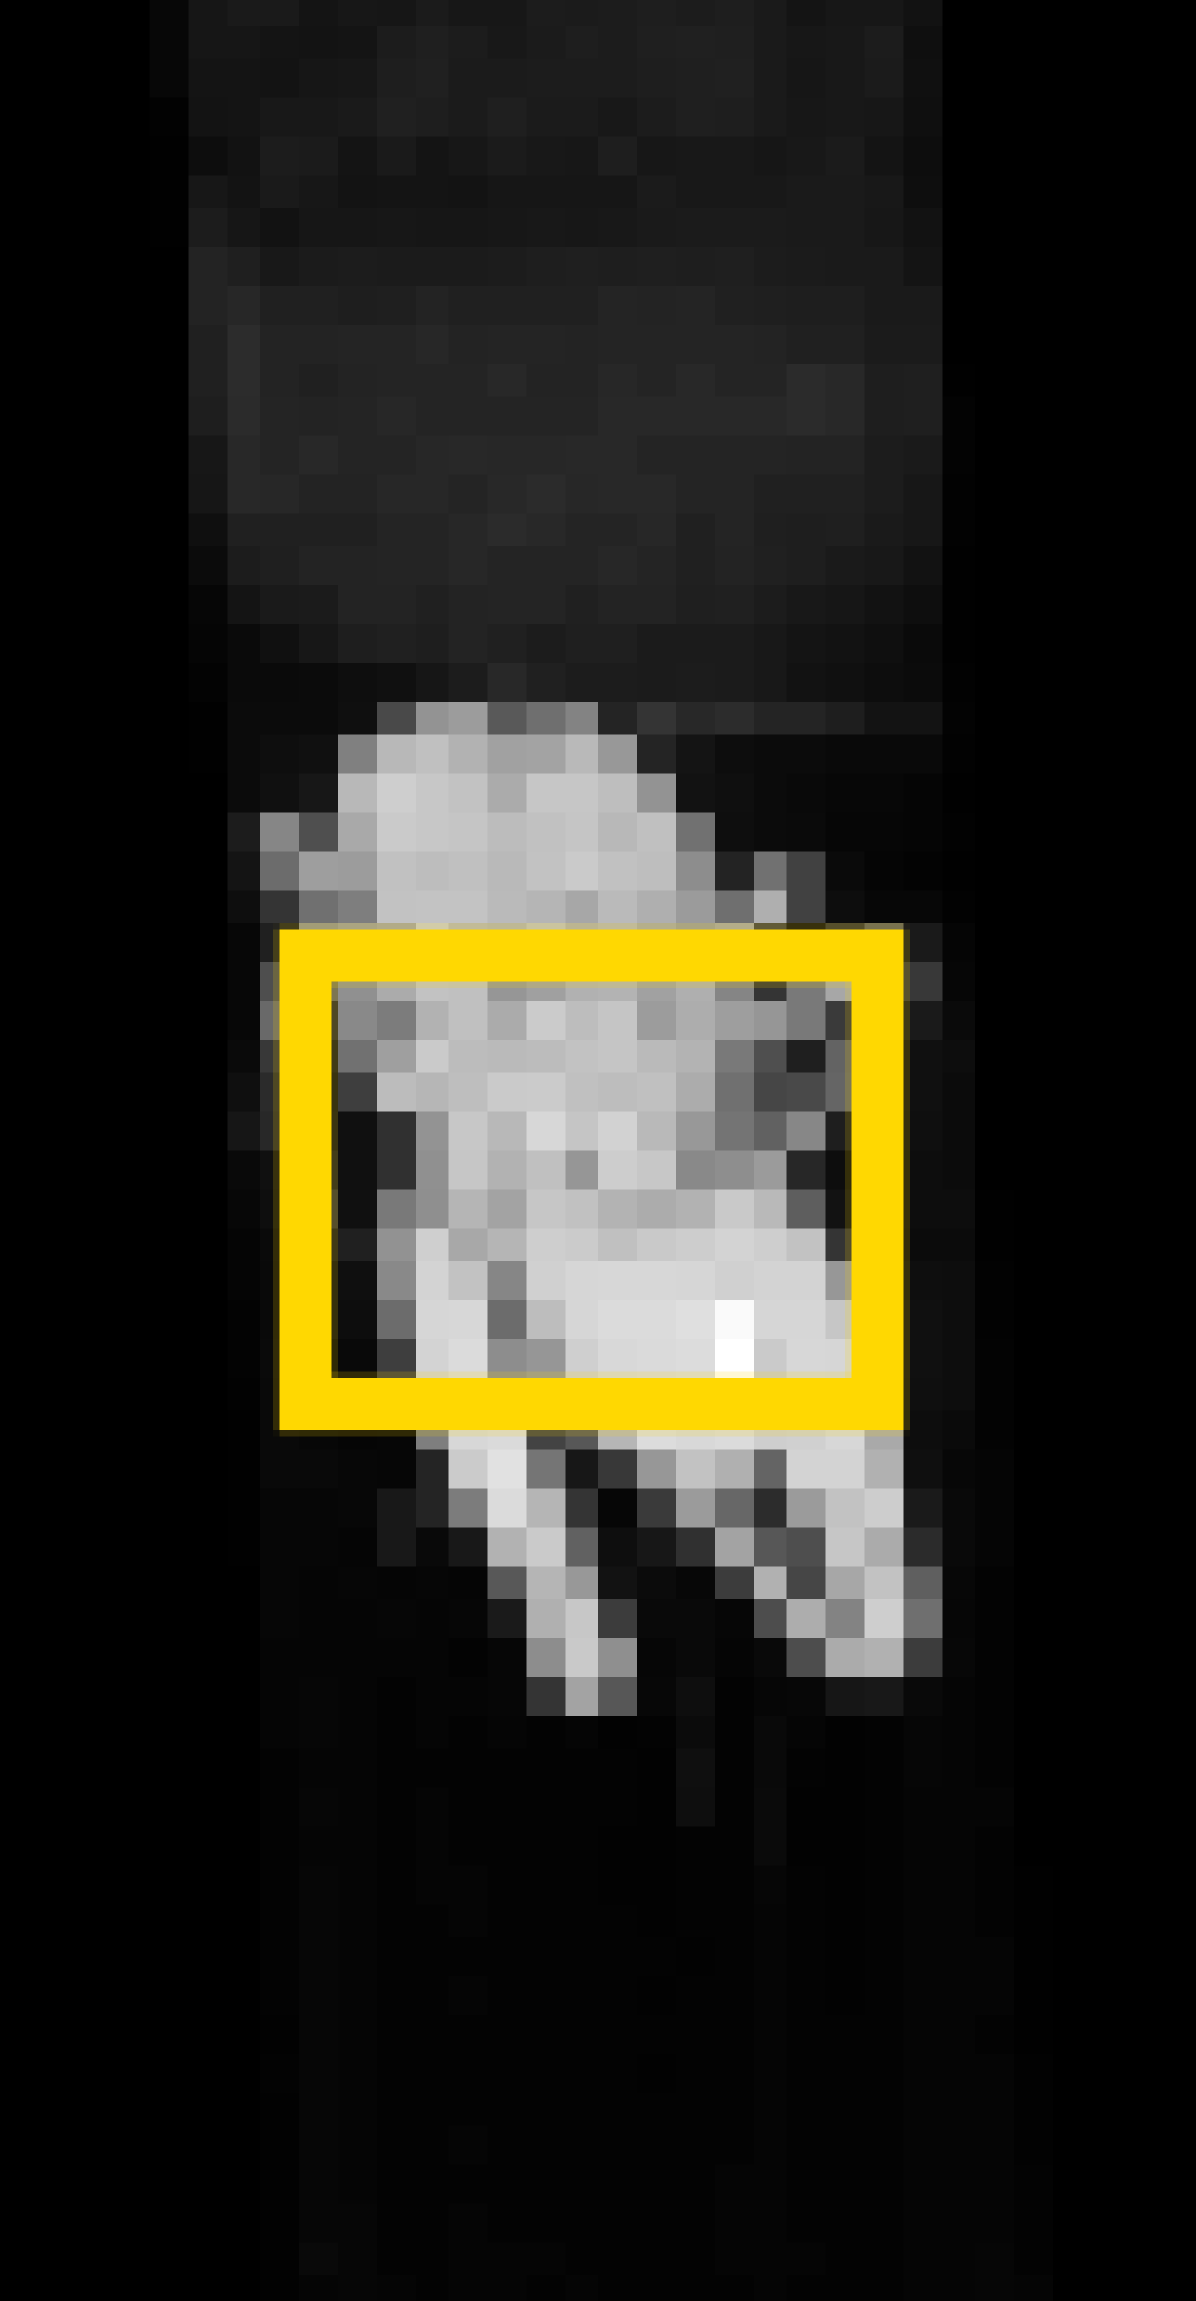
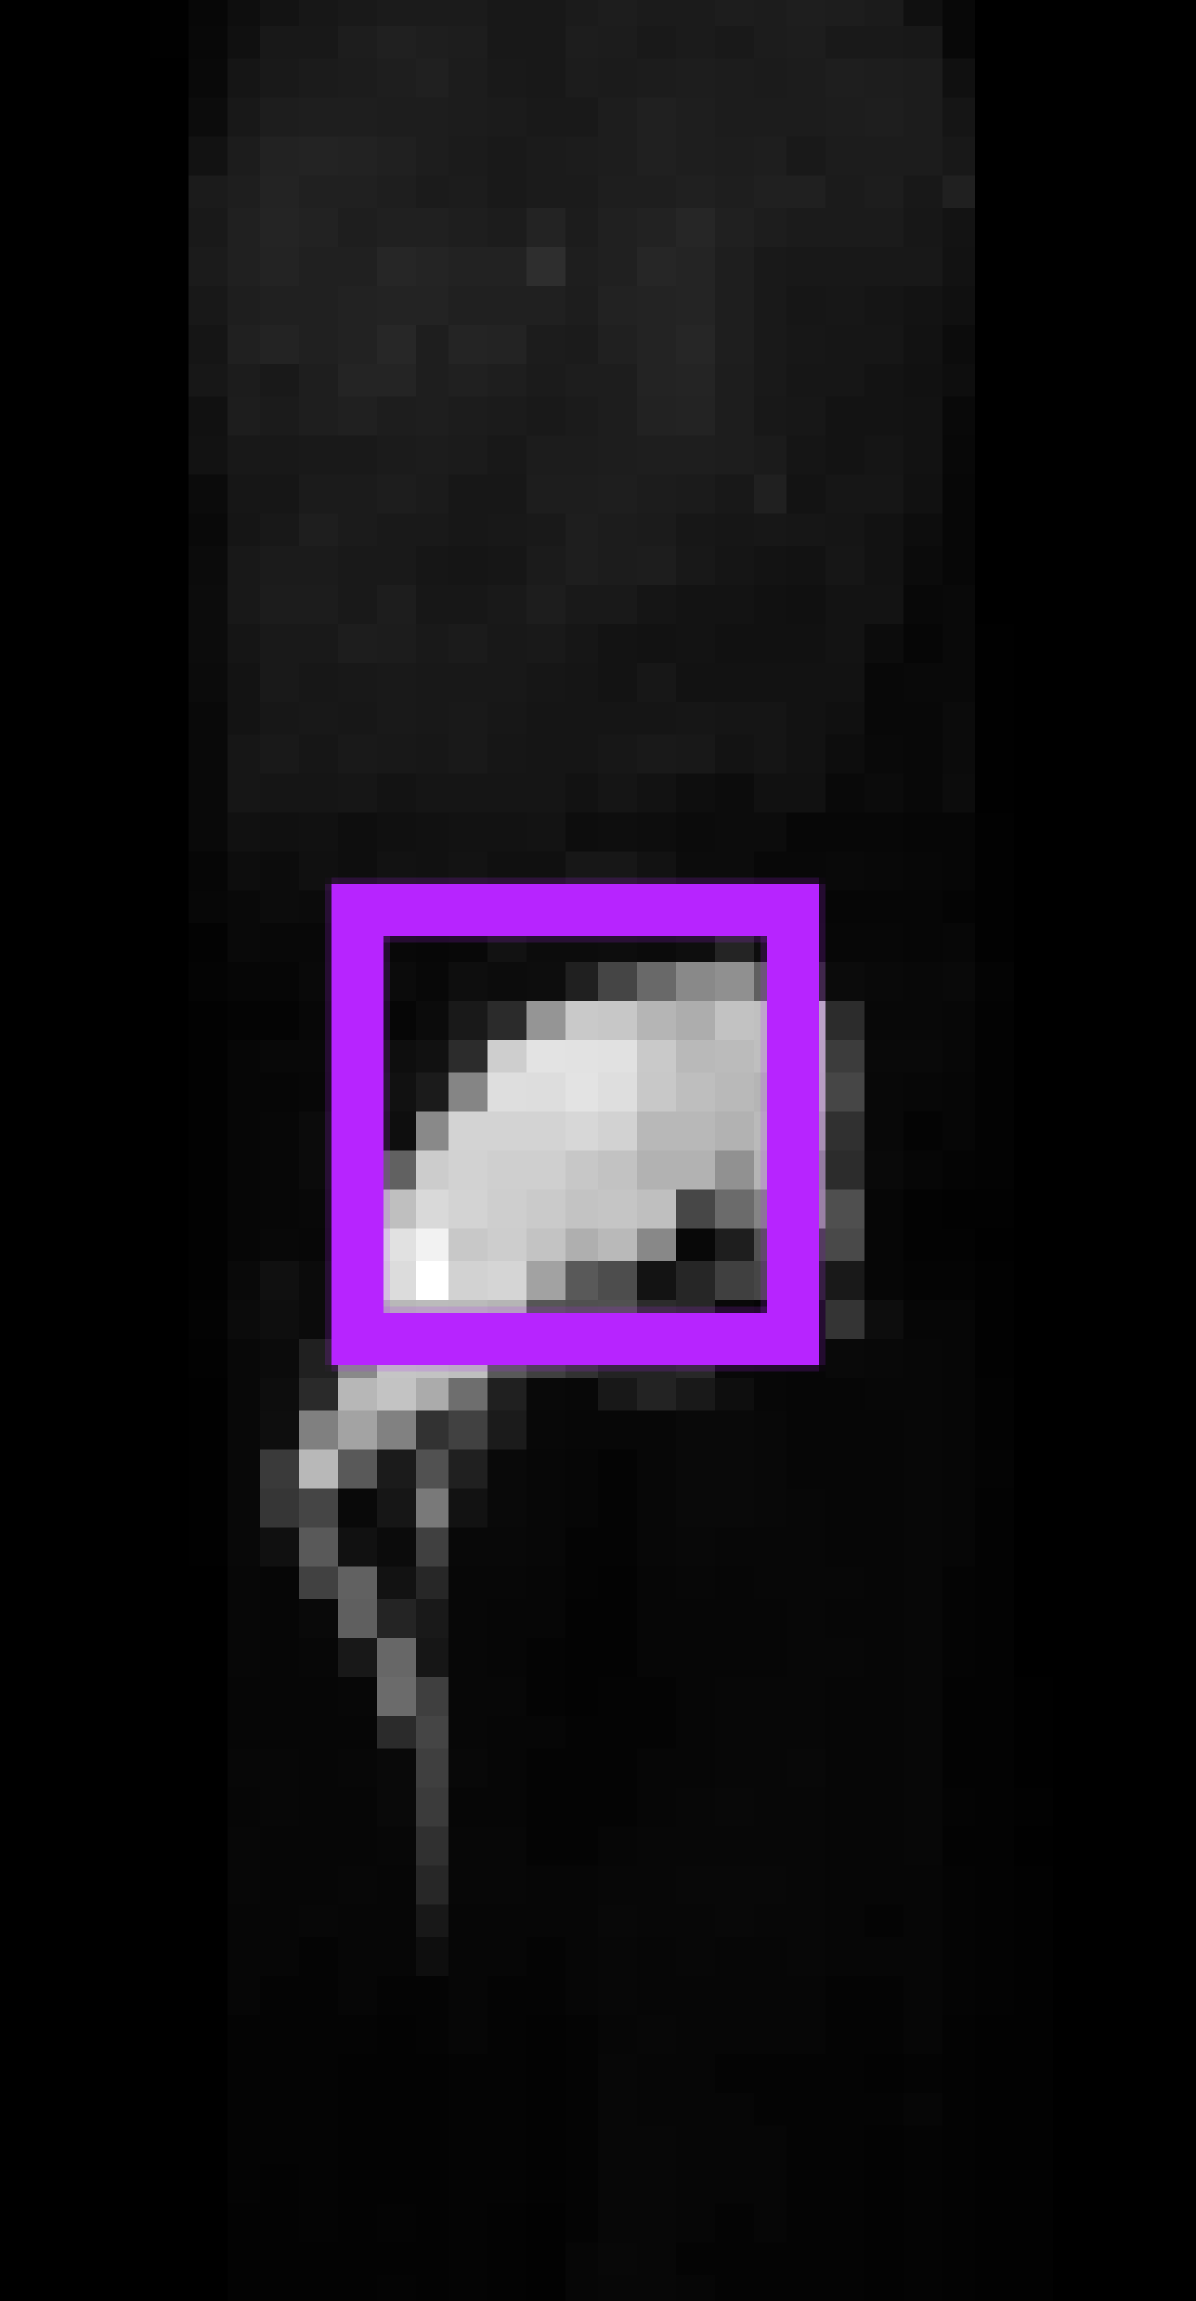
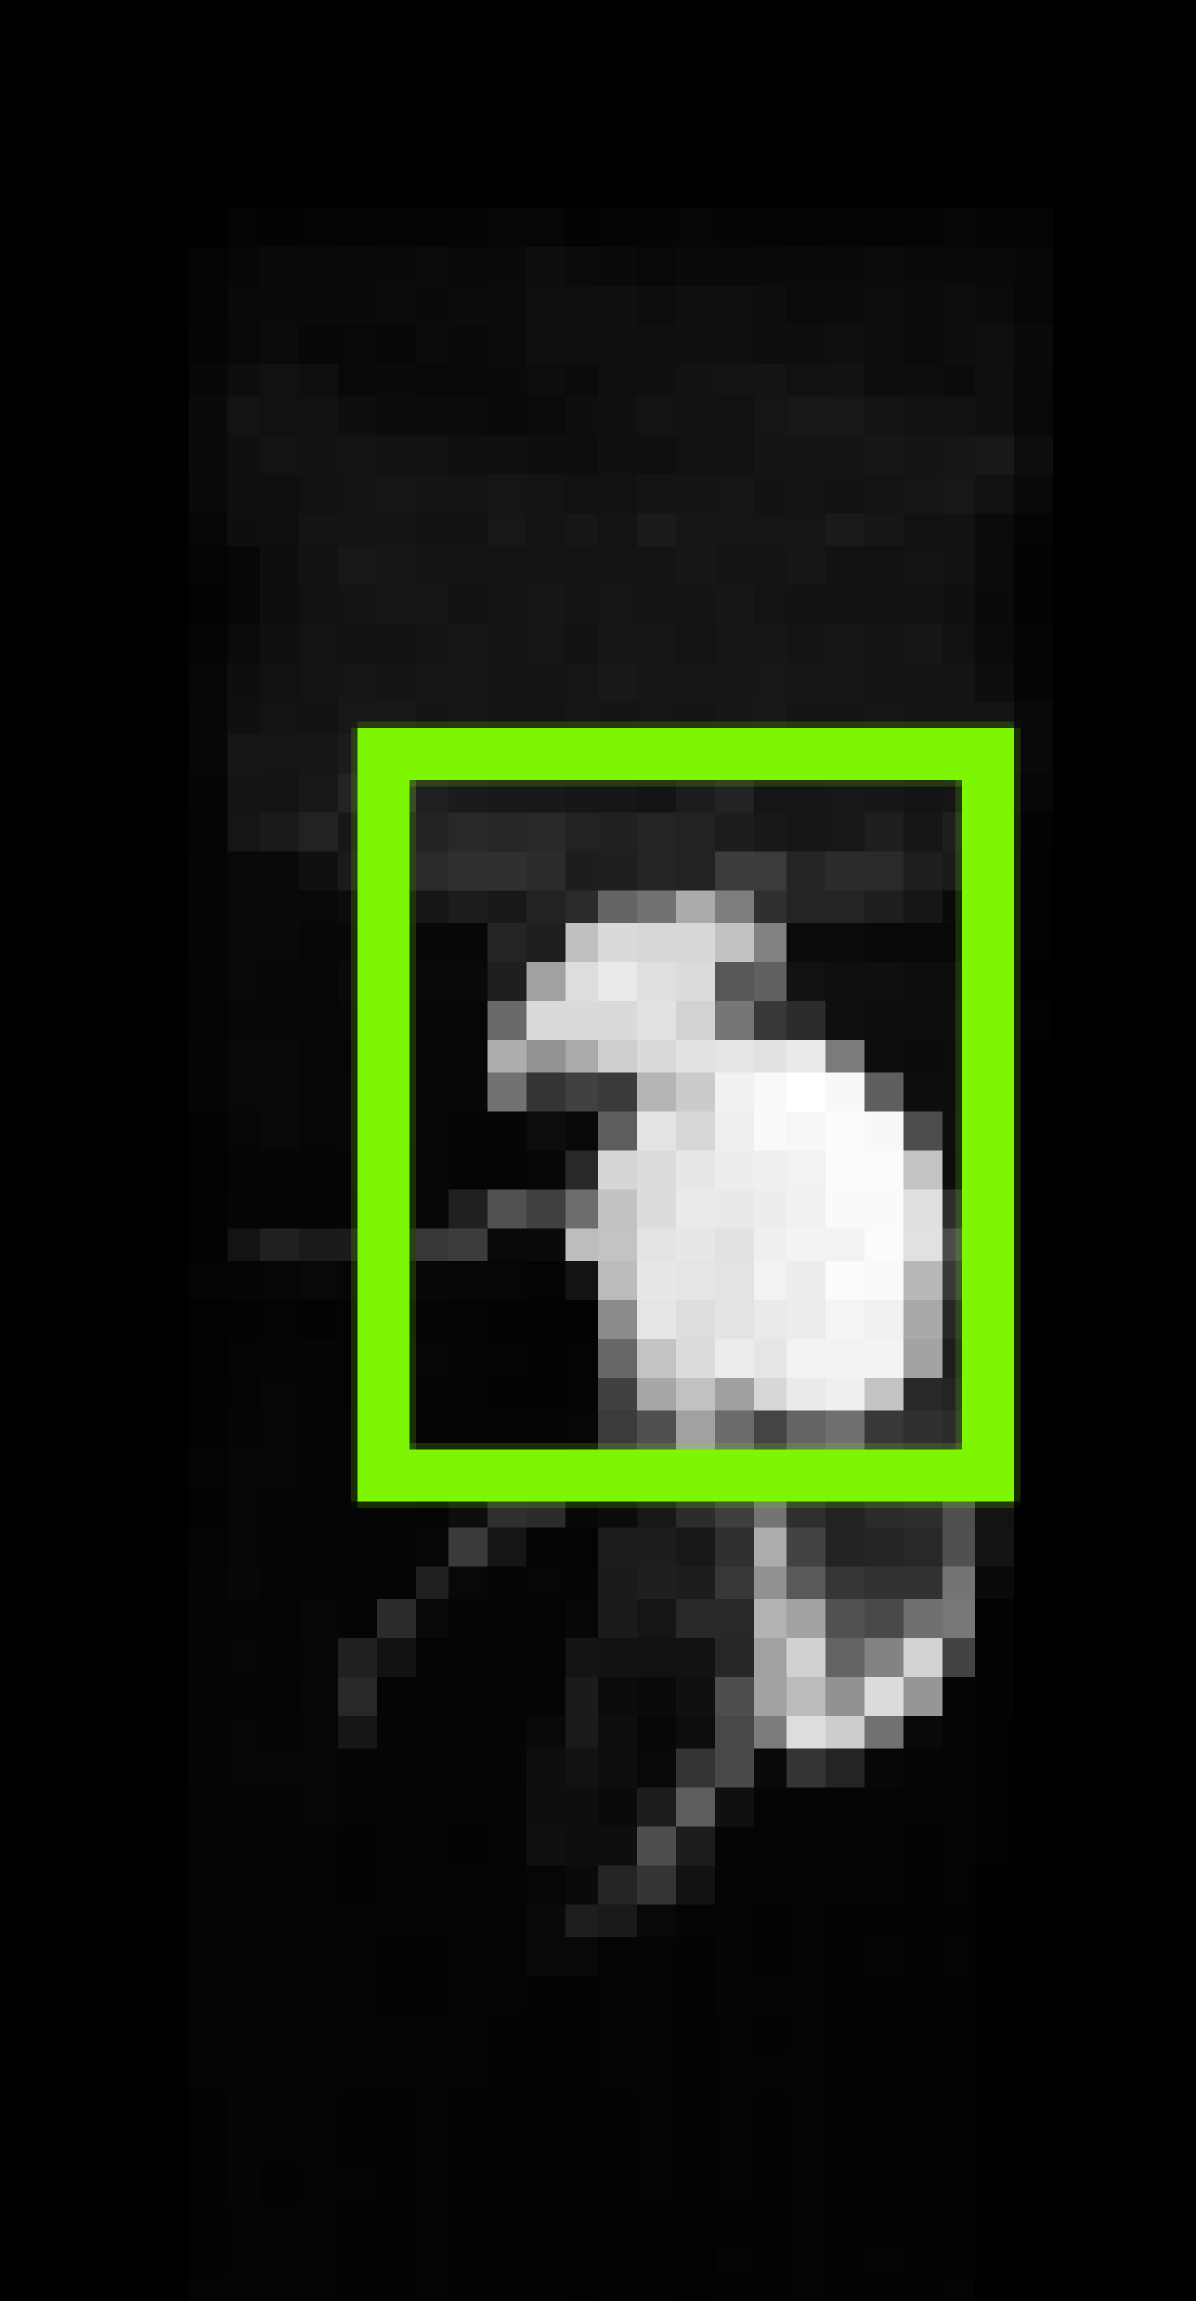
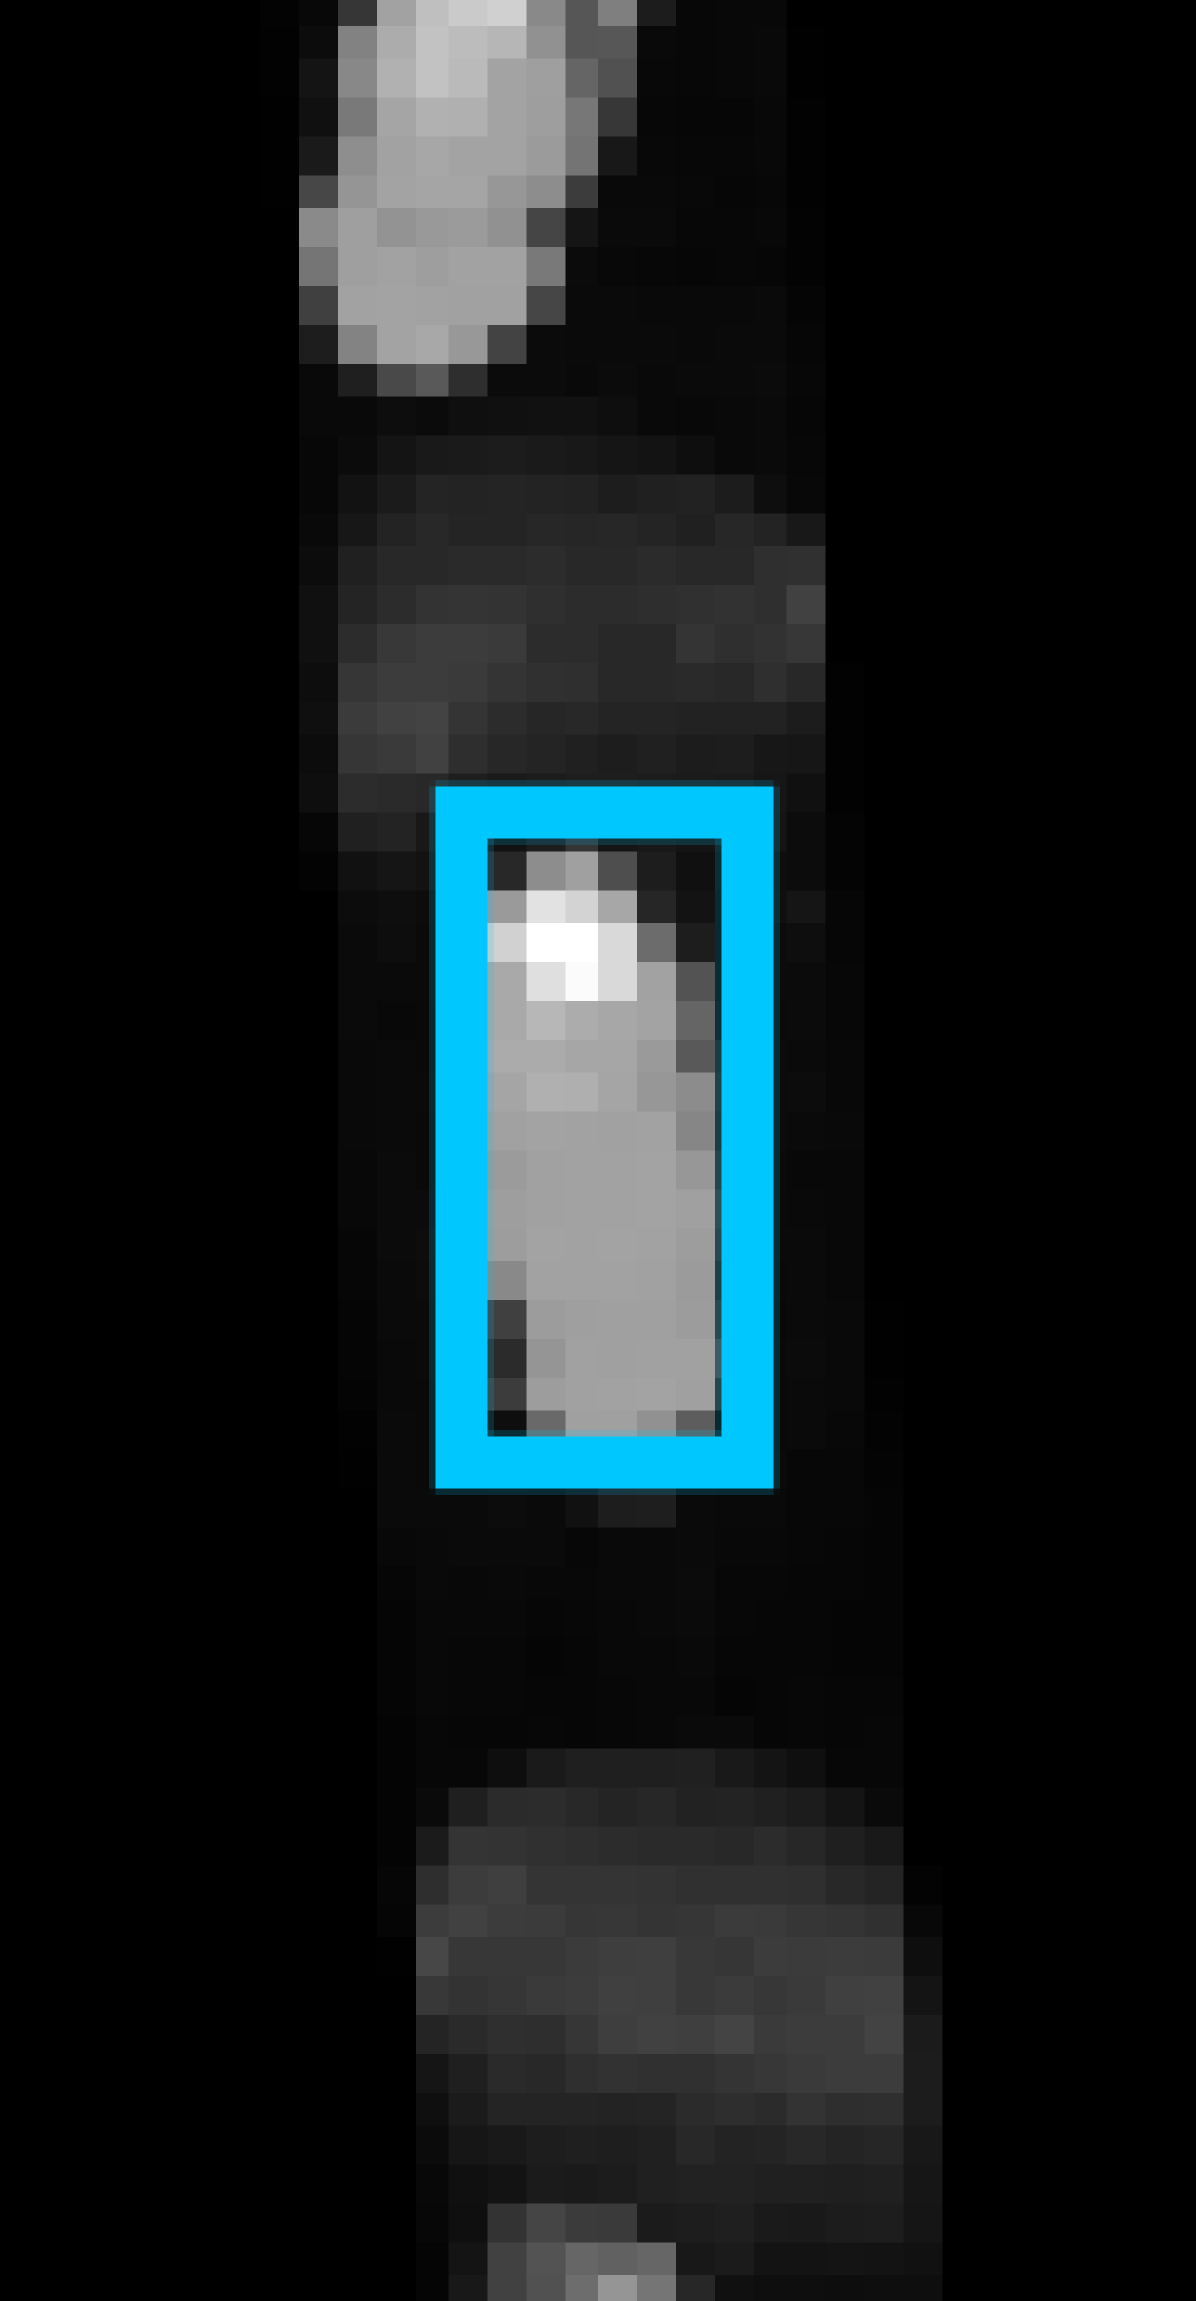
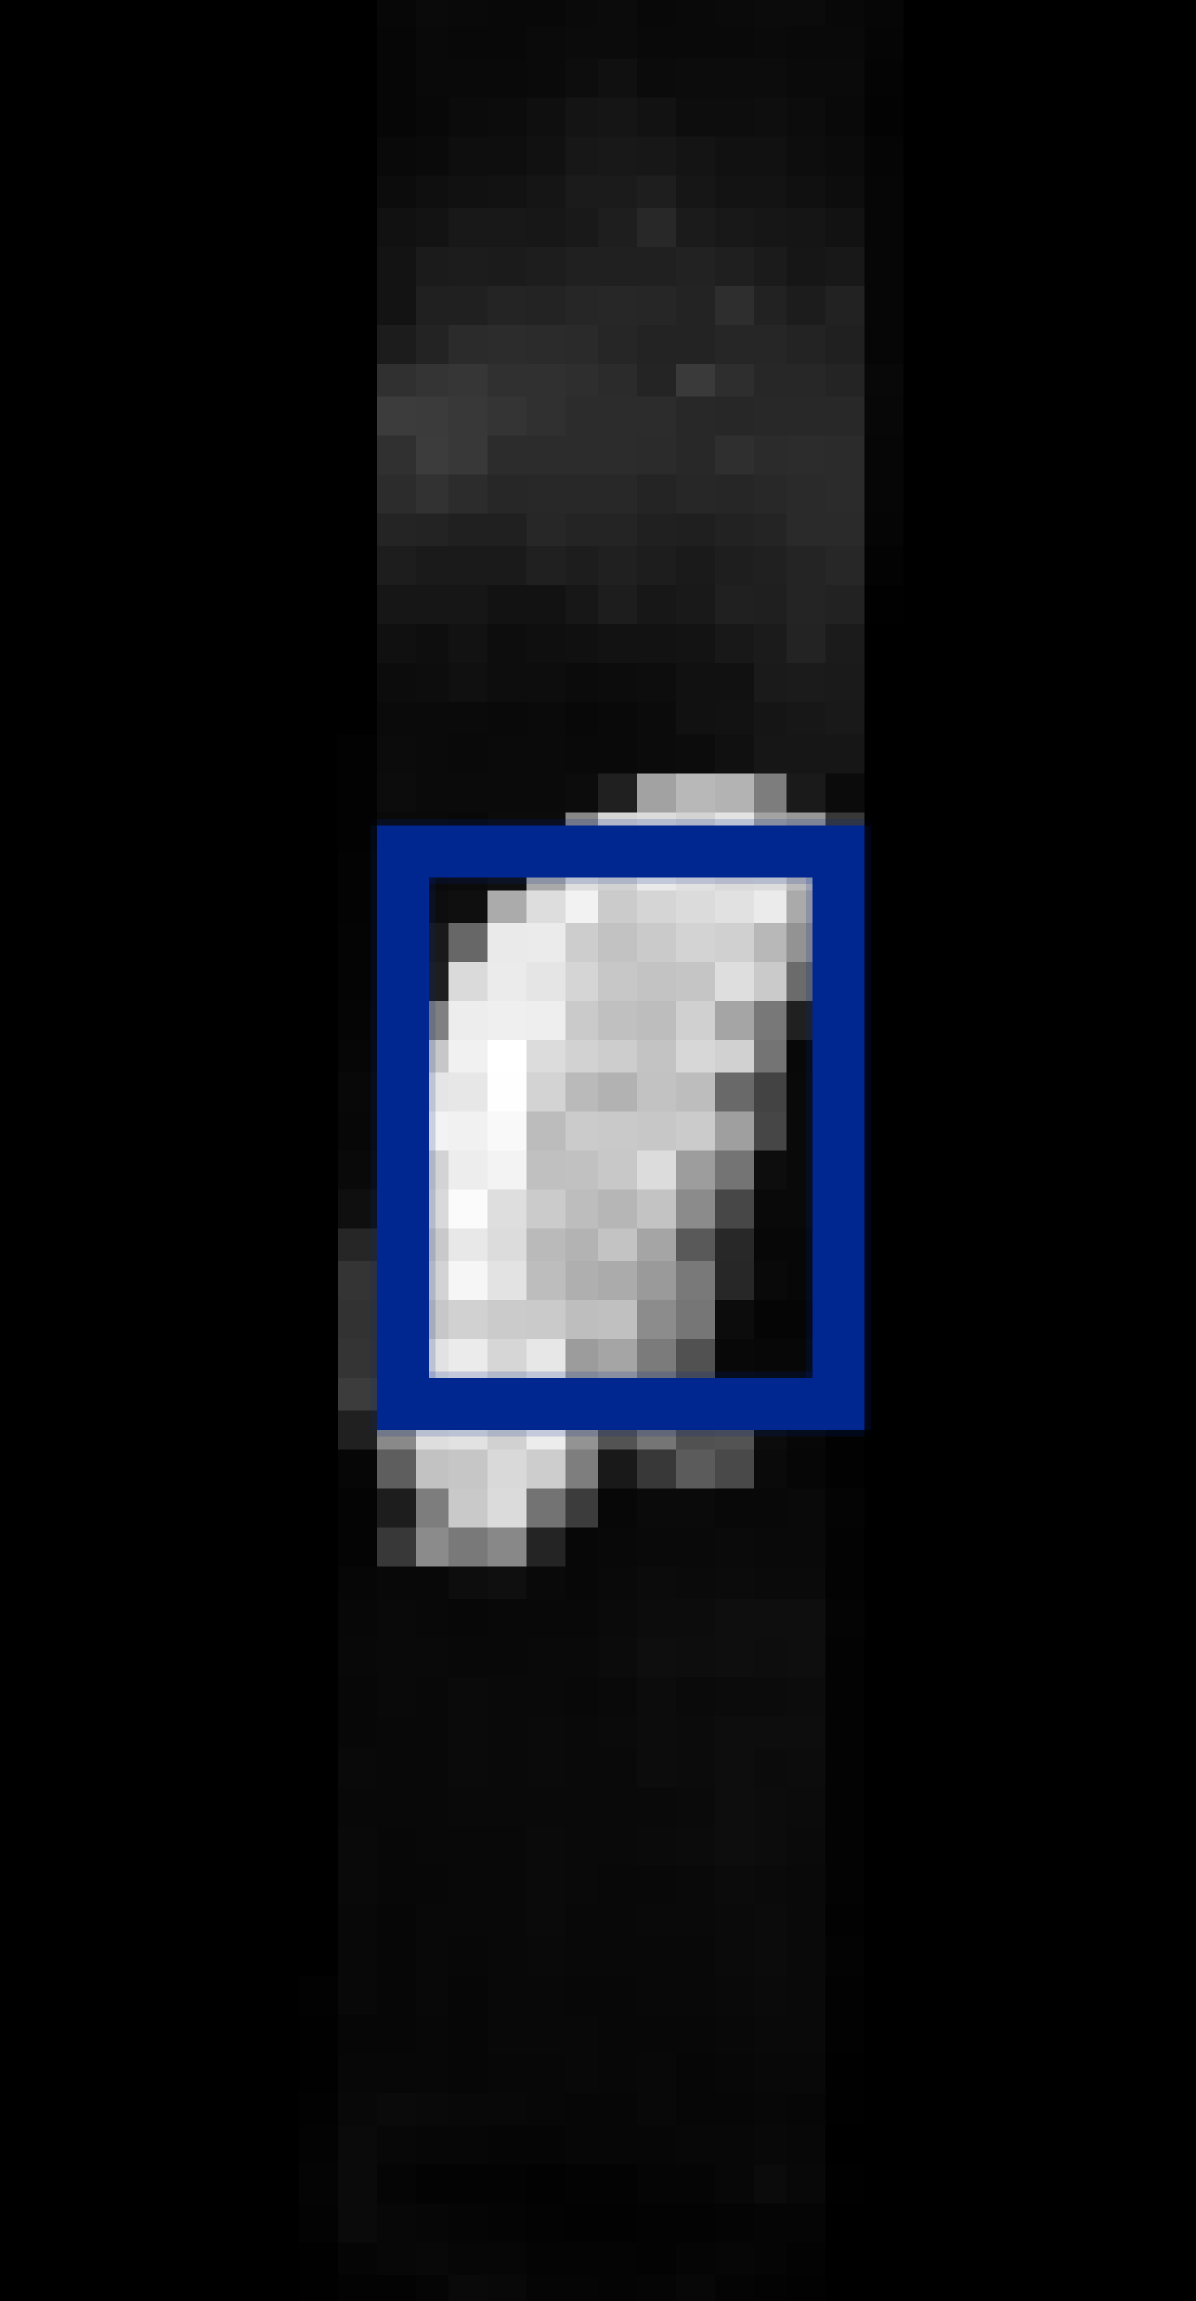
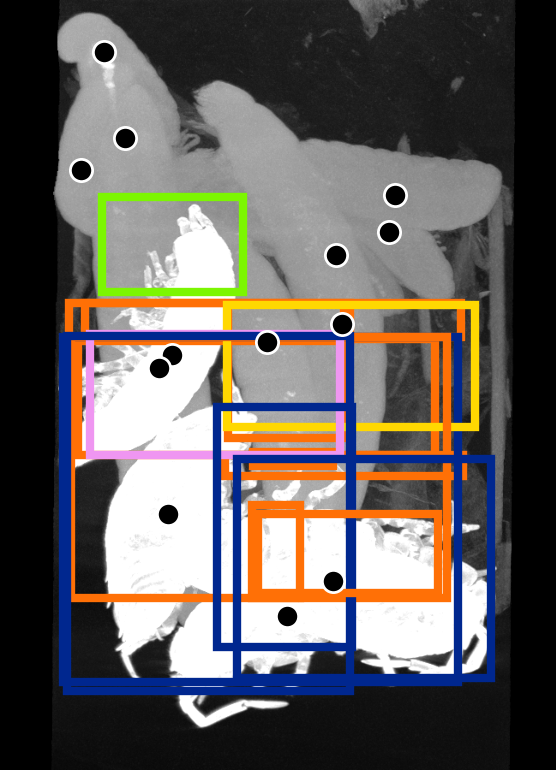
The second method is the nnDetection (nnDet) framework [5] using a Retina U-Net [19]. This is trained to detect bugs in the classification data by outputting bounding boxes. We extract segmentation masks as before, and then also extracts a bounding box for each foreground connected component for training. We then train the model on the training and validation set, and evaluate on the test set after every epoch. After training, we apply the best model to the mixture images. Again, full details are in the supplementary materials.
We evaluate the mixture data detections on the following metrics: Precision and recall, detection-L1, and count error. Precision and recall are computed by matching detections with center point annotations based on their distances. For U-Net, we use the distances from an annotation to the nearest voxel in the connected component of the detection. For nnDet, we use the distance between an annotation and the bounding box centroid. Munkres’ algorithm [33] then computes the optimal matching. For U-Net, we allow matches with distances under 8 voxels and for nnDet we require that an annotation must be contained in the detection bounding box. Precision is then computed as the ratio of matched detections and total annotations and recall as the ratio of matched annotations and total annotations.
For detection-L1, we compute the absolute error in the number of detections for each class and then sum these. We then normalize this error by the total number of bugs. Finally, count error is simply absolute error on the total number of detected bugs normalized by the true number of bugs.
Notice that precision and recall only asses the location of each detection but not the classes whereas detection-L1 assess the detected classes but not their location. Together, they allow a useful assessment of the detection quality with low annotation effort.
5 Results
Classification
We show accuracy and AUC metrics for the classification results in table 1. Due to computational limitations, we only trained a few models on the largest versions. However, the smaller datasets still give a good assessment of the models, as they perform consistently over the dataset sizes.
| BugNIST | x64 | x128 | x256 | x512 | _Ax64 | _Ax128 | _Ax256 | _Ax512 | ||||||||
|---|---|---|---|---|---|---|---|---|---|---|---|---|---|---|---|---|
| Model | Acc. | AUC | Acc. | AUC | Acc. | AUC | Acc. | AUC | Acc. | AUC | Acc. | AUC | Acc. | AUC | Acc. | AUC |
| DenseNet121 [17] | 0.94 | 0.998 | 0.96 | 0.999 | 0.98 | 0.999 | 0.97 | 0.999 | 0.95 | 0.998 | 0.97 | 0.999 | 0.98 | 1.000 | 0.97 | 0.999 |
| DenseNet169 [17] | 0.95 | 0.998 | 0.97 | 0.999 | 0.97 | 0.999 | 0.98 | 0.999 | 0.94 | 0.997 | 0.97 | 0.999 | 0.97 | 0.999 | 0.98 | 0.999 |
| DenseNet201 [17] | 0.95 | 0.998 | 0.96 | 0.999 | 0.98 | 0.999 | - | - | 0.94 | 0.997 | 0.96 | 0.999 | 0.98 | 0.999 | - | - |
| ResNet18 [15] | 0.94 | 0.998 | 0.96 | 0.998 | 0.97 | 0.999 | - | - | 0.94 | 0.998 | 0.97 | 0.999 | 0.98 | 1.000 | - | - |
| ResNet34 [15] | 0.94 | 0.997 | 0.97 | 0.999 | 0.98 | 0.999 | - | - | 0.94 | 0.997 | 0.97 | 0.999 | 0.98 | 0.999 | - | - |
| ResNet50 [15] | 0.95 | 0.998 | 0.96 | 0.999 | 0.98 | 0.999 | - | - | 0.95 | 0.997 | 0.97 | 0.999 | 0.97 | 0.999 | - | - |
| SEResNet34 [16] | 0.93 | 0.997 | 0.94 | 0.997 | 0.97 | 0.998 | - | - | 0.92 | 0.995 | 0.94 | 0.997 | 0.97 | 0.999 | - | - |
| SEResNet50 [16] | 0.92 | 0.996 | 0.96 | 0.998 | 0.97 | 0.999 | - | - | 0.91 | 0.995 | 0.95 | 0.998 | 0.97 | 0.999 | - | - |
| ConvNext-T [28] | 0.82 | 0.983 | 0.90 | 0.993 | - | - | - | - | 0.77 | 0.976 | 0.90 | 0.992 | - | - | - | - |
| ConvNext-B [28] | 0.84 | 0.988 | 0.90 | 0.994 | - | - | - | - | 0.78 | 0.980 | 0.89 | 0.992 | - | - | - | - |
| ViT [10] | 0.86 | 0.979 | 0.87 | 0.980 | - | - | - | - | 0.81 | 0.964 | 0.82 | 0.965 | - | - | - | - |
| SwinT-v2-T [27] | 0.88 | 0.987 | 0.86 | 0.984 | - | - | - | - | 0.84 | 0.982 | 0.82 | 0.976 | - | - | - | - |
| SwinT-v2-S [27] | 0.90 | 0.992 | 0.90 | 0.993 | - | - | - | - | 0.88 | 0.989 | 0.90 | 0.992 | - | - | - | - |

We also show a confusion matrix in fig. 3 for a selection of models on the BugNISTx64 data.
As shown in table 1, all models perform well. It is only the fine grained classification of brown and black crickets (classes AC and BC) that cause issues. Looking at just these classes, the accuracy is between 0.70 and 0.86.
Detection
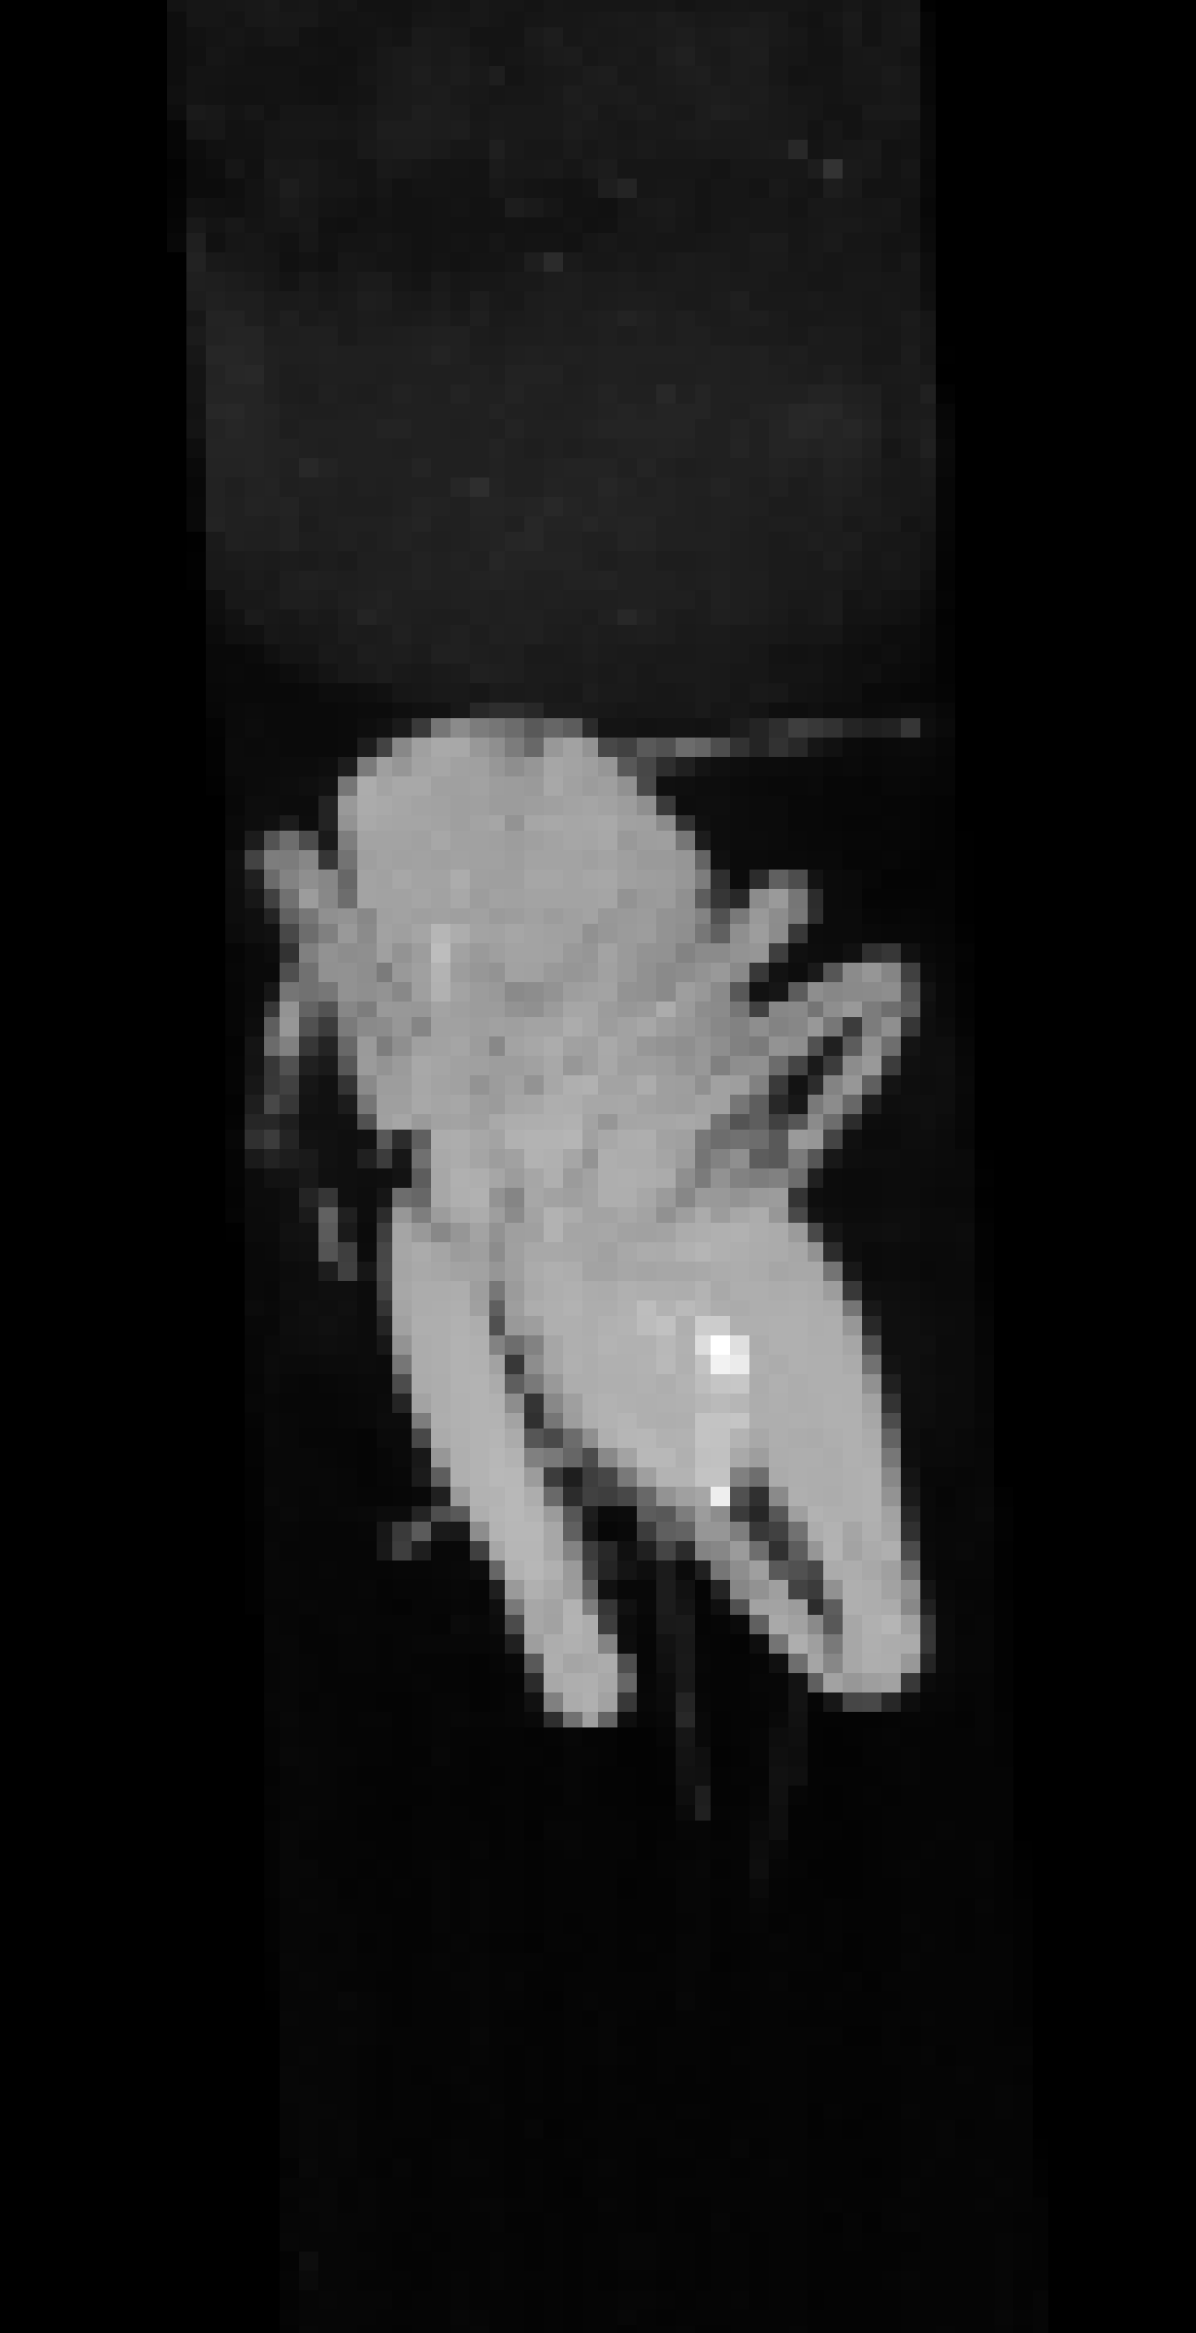
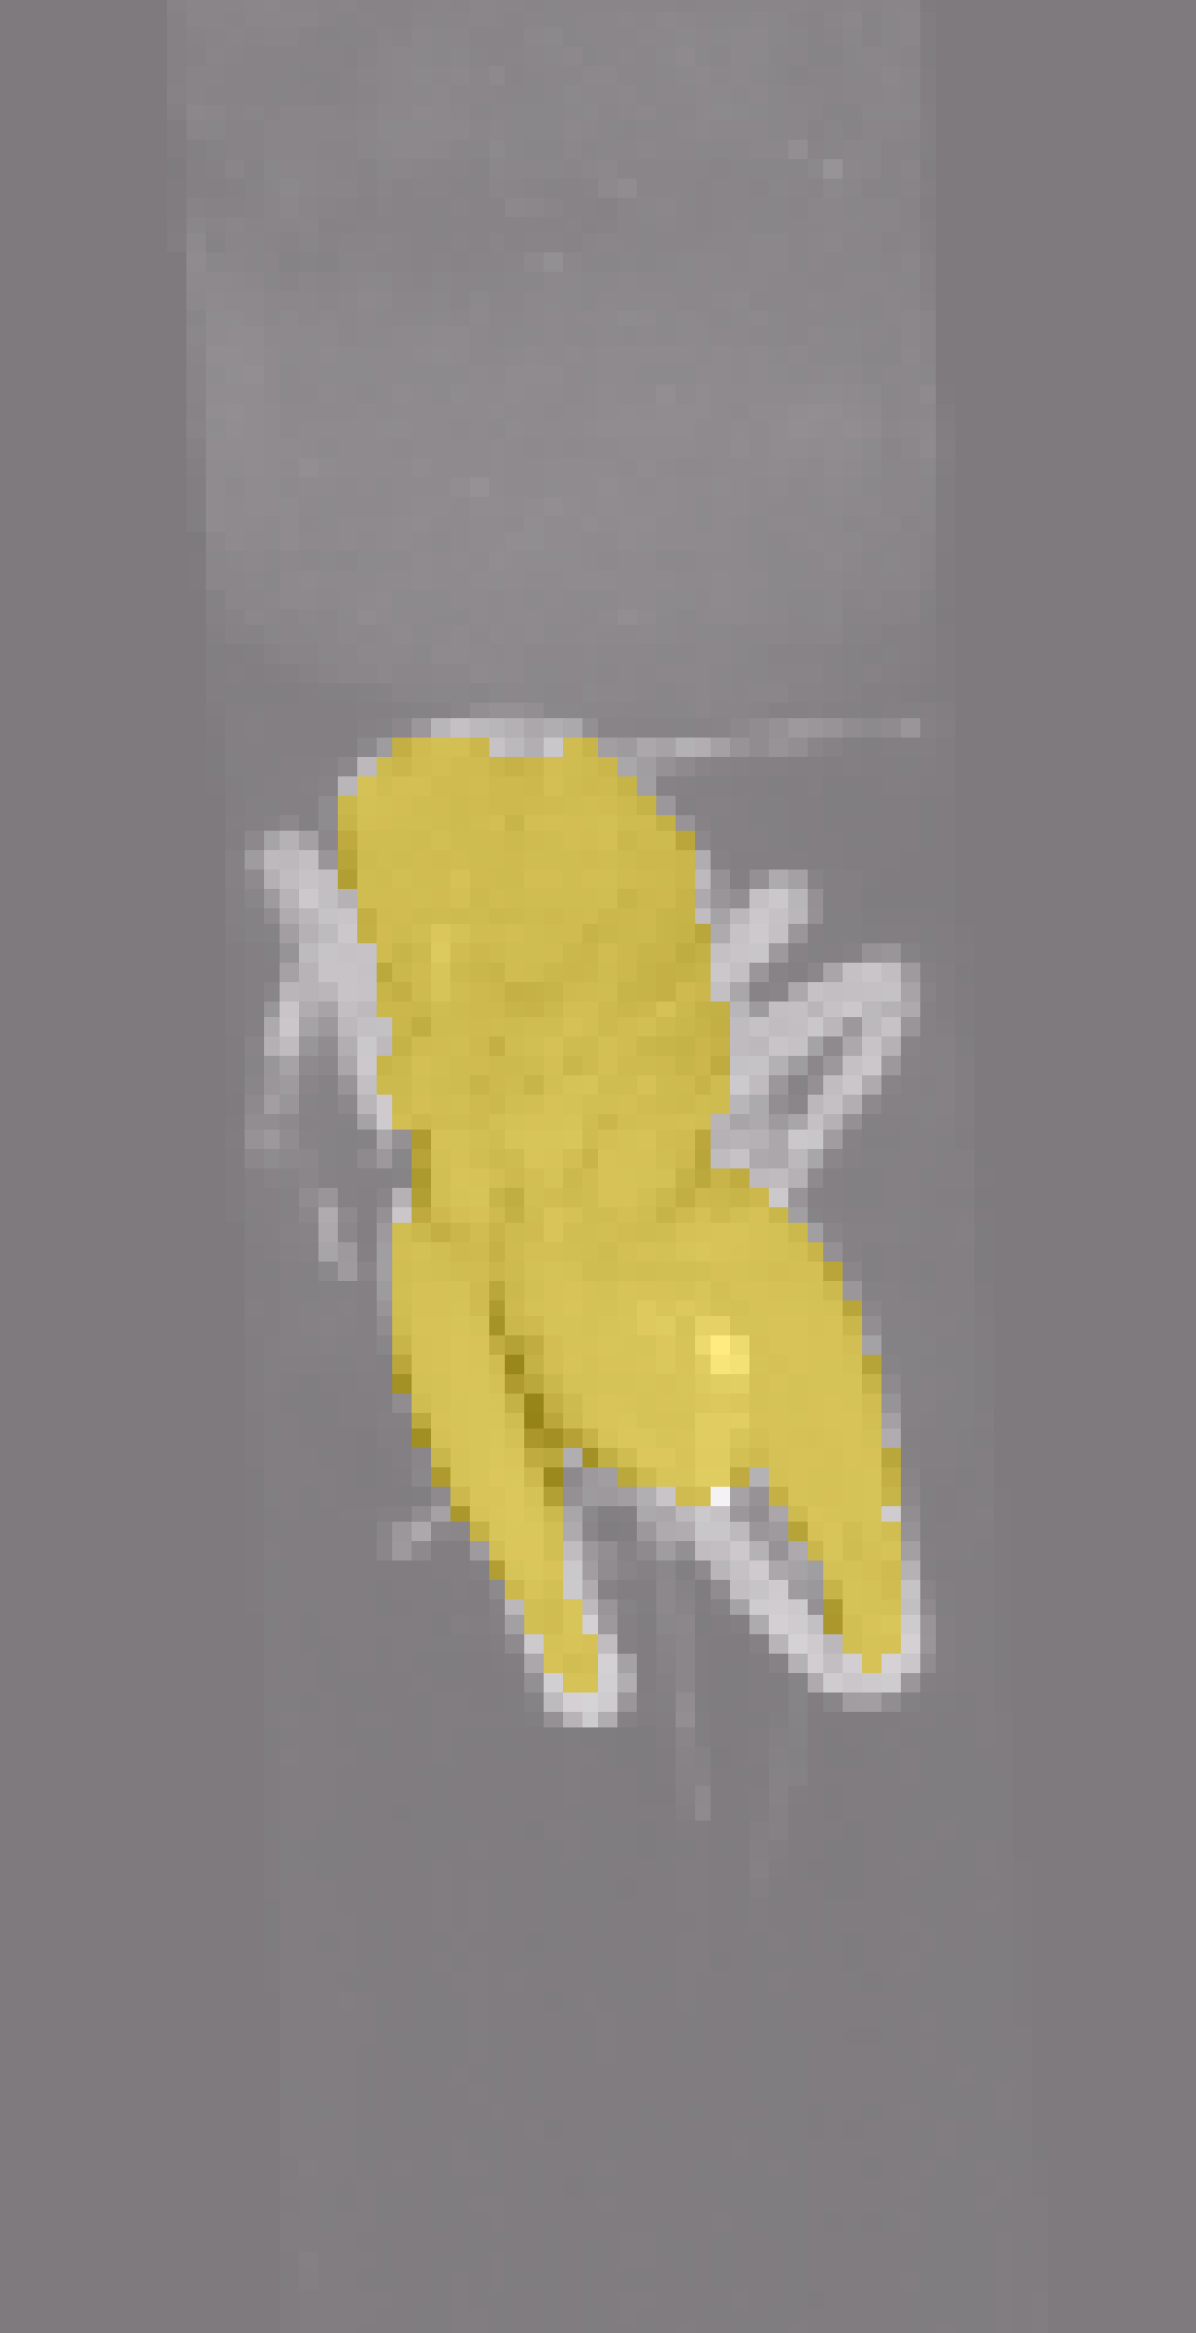
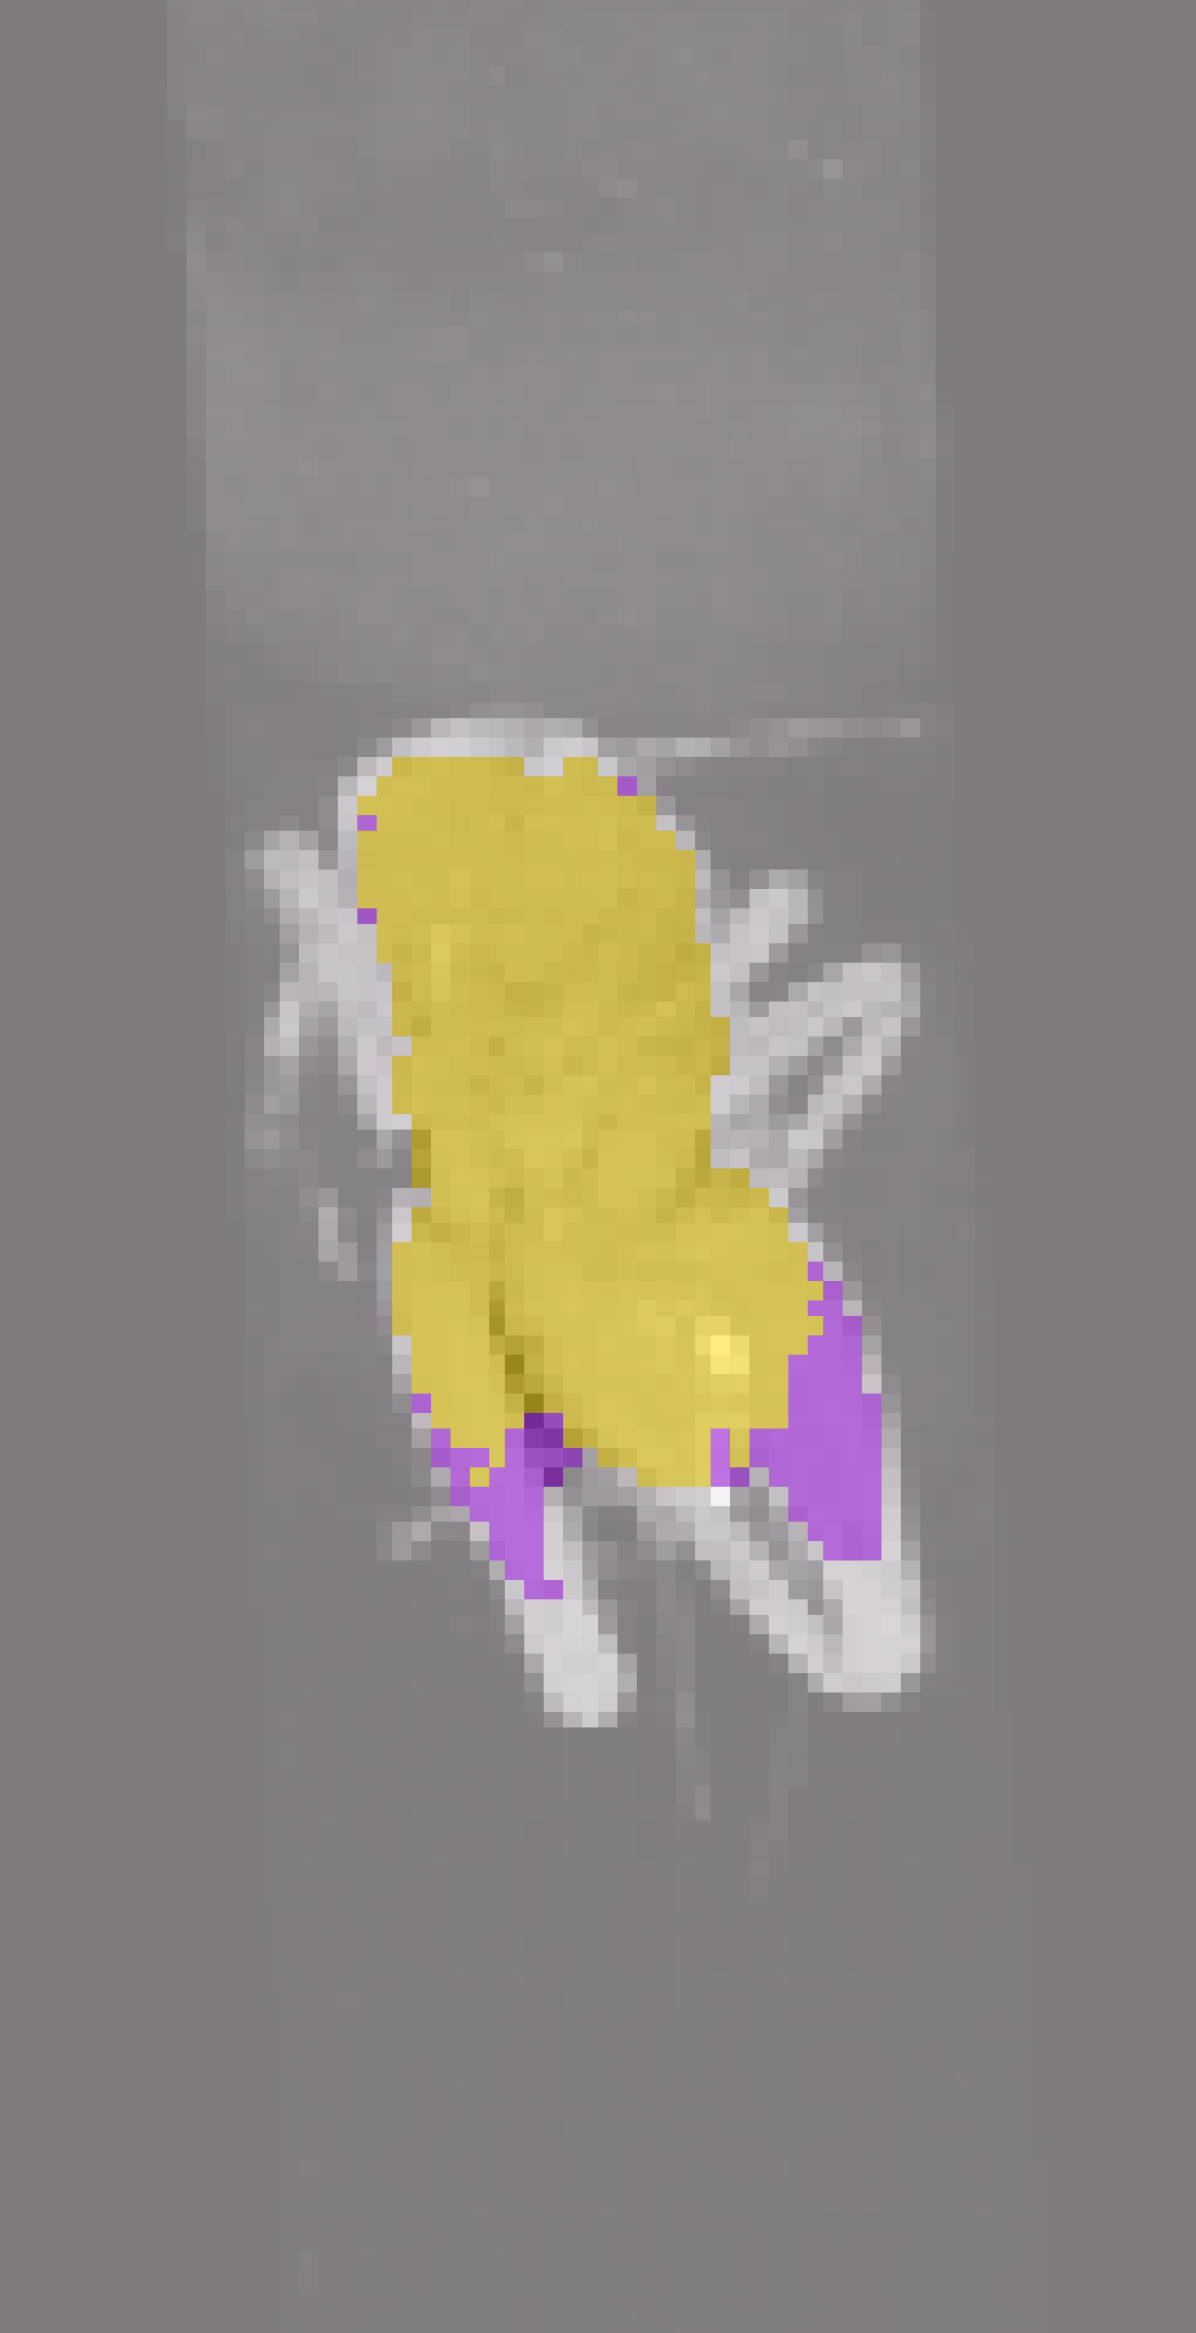
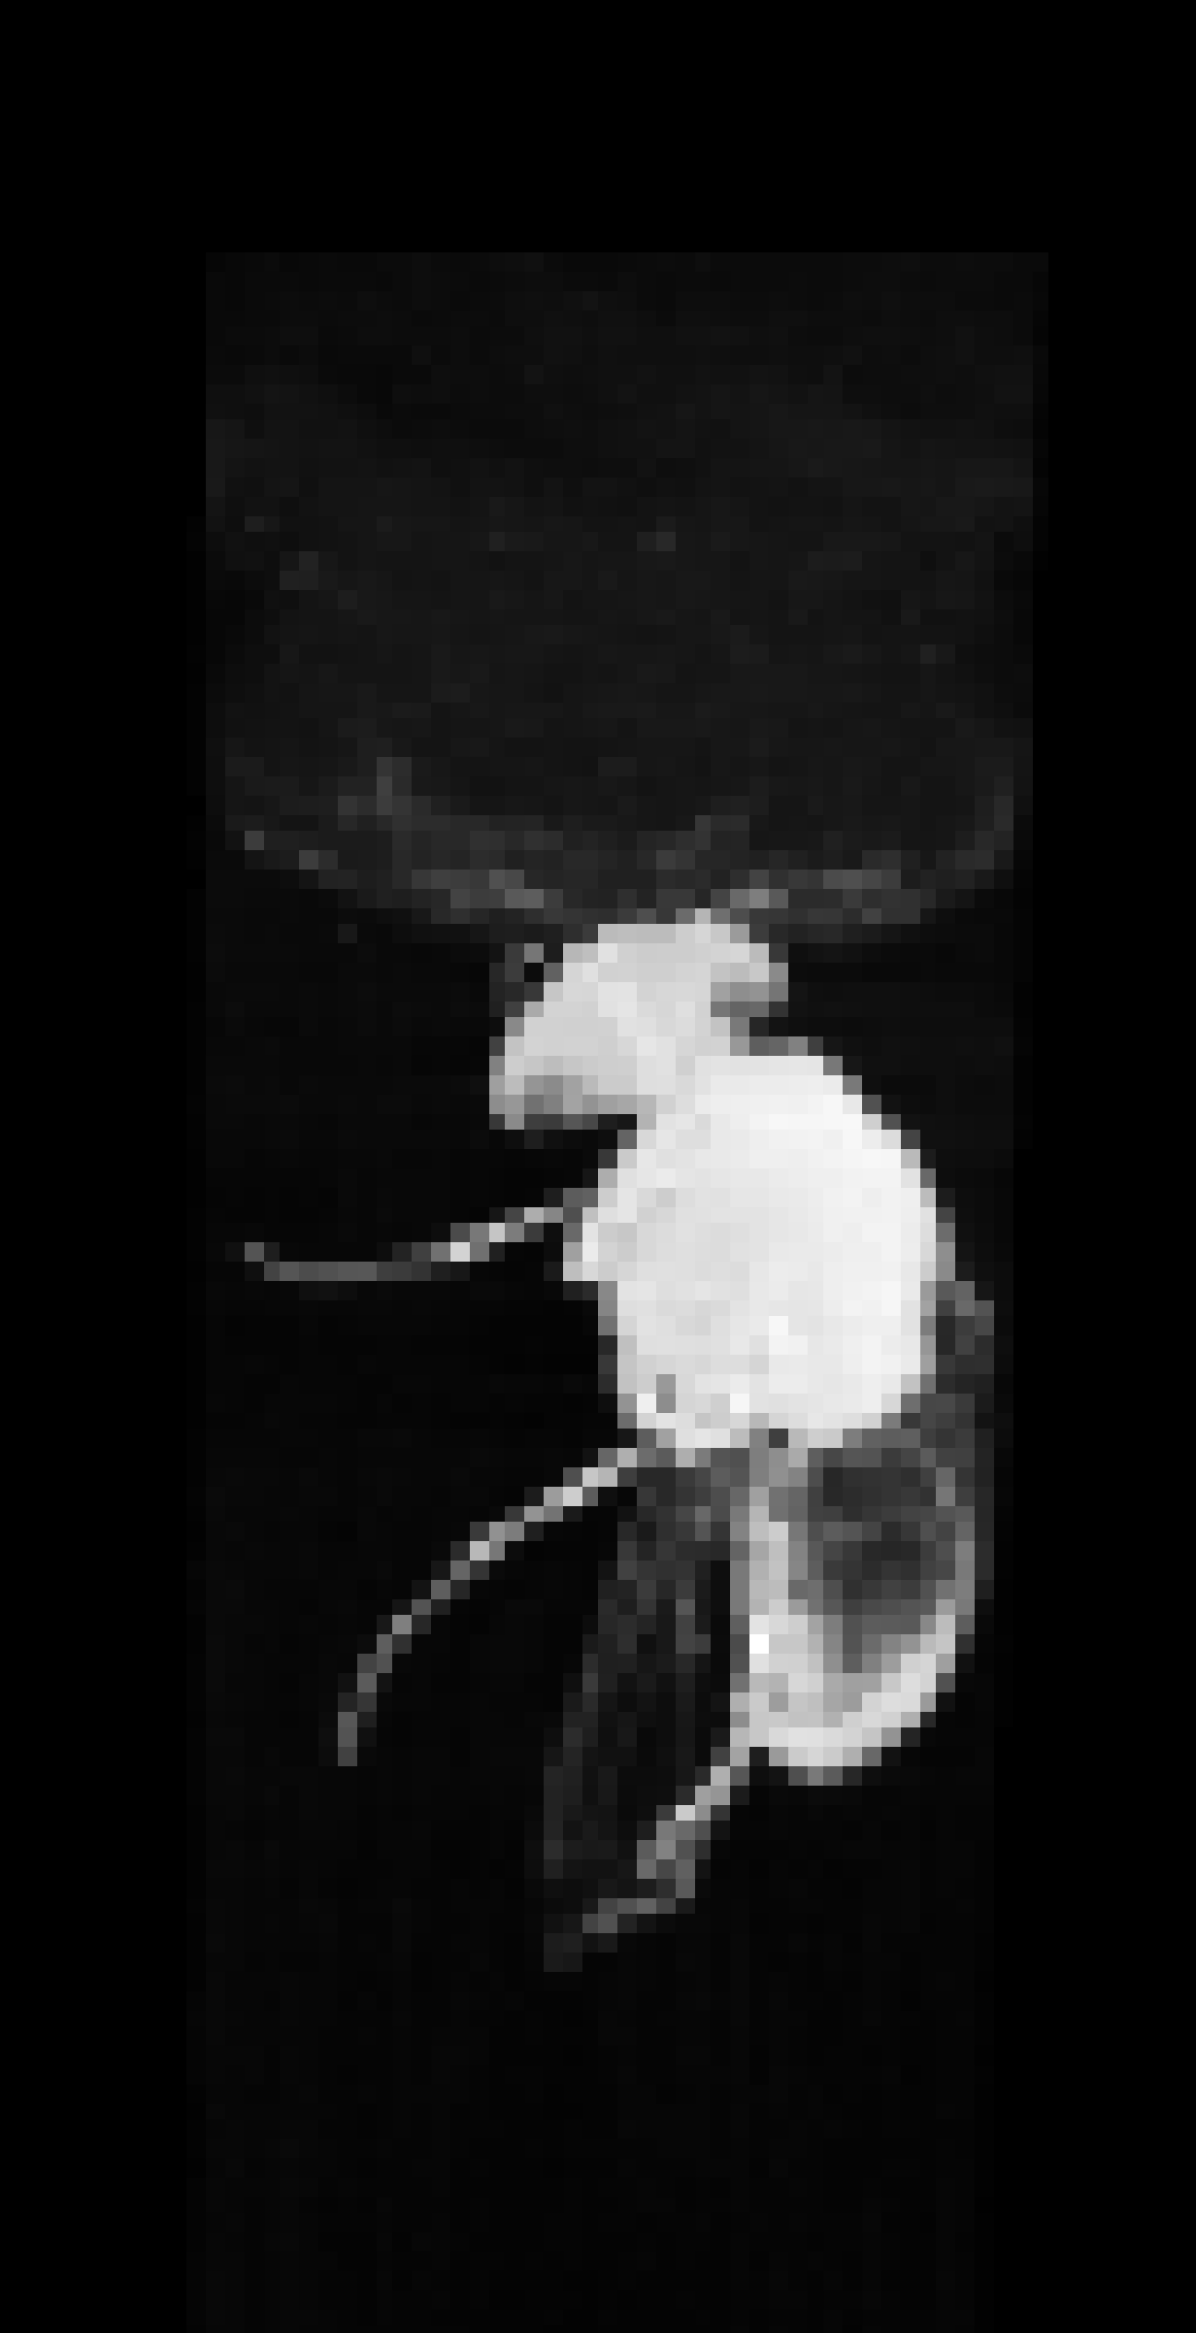
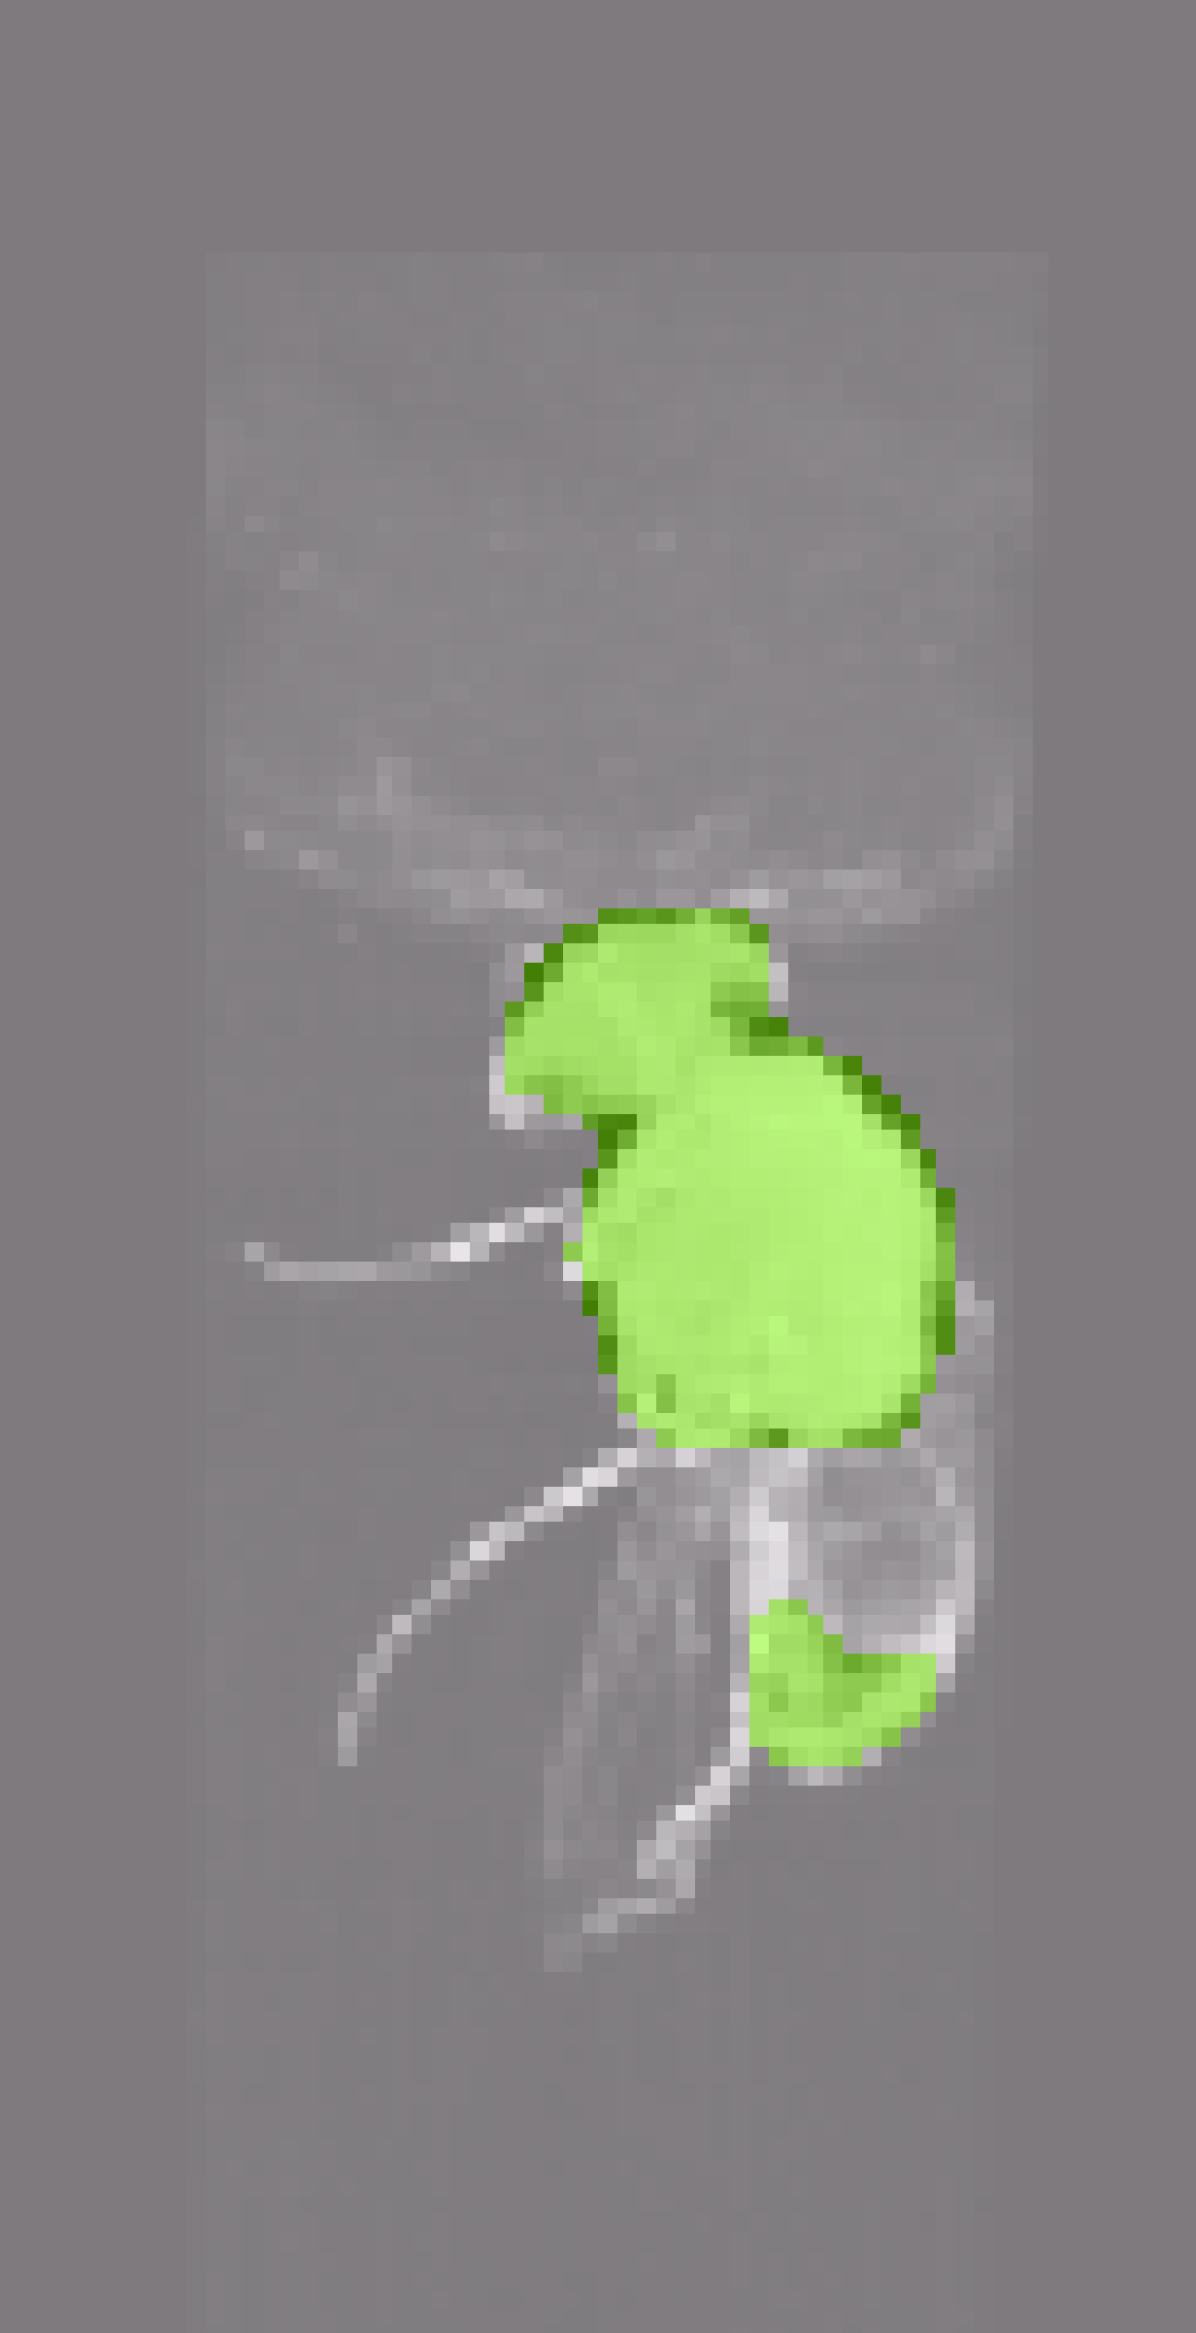
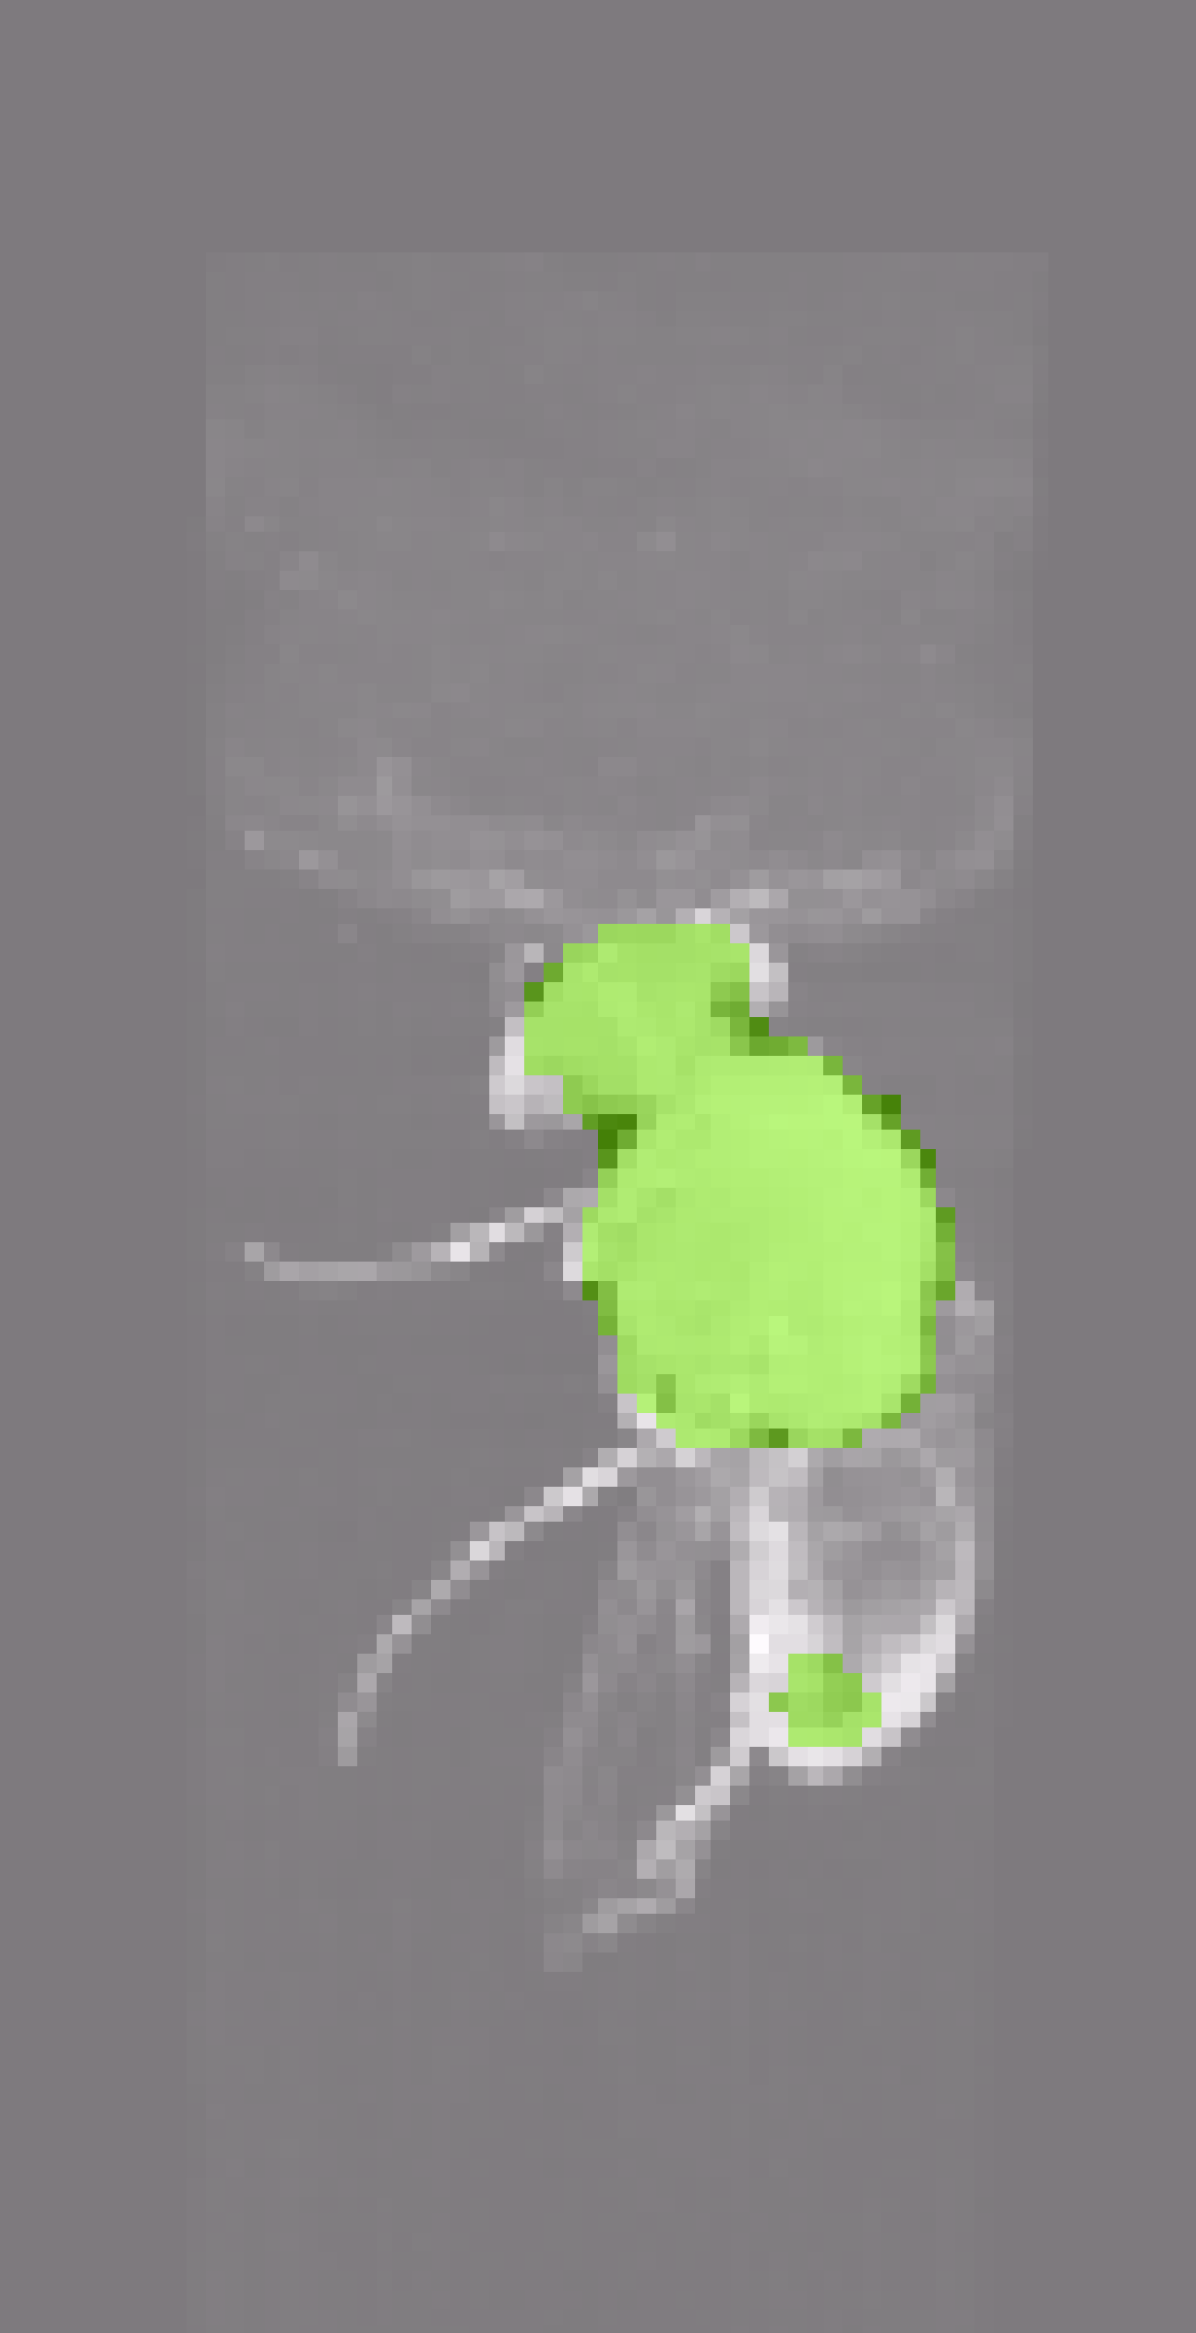
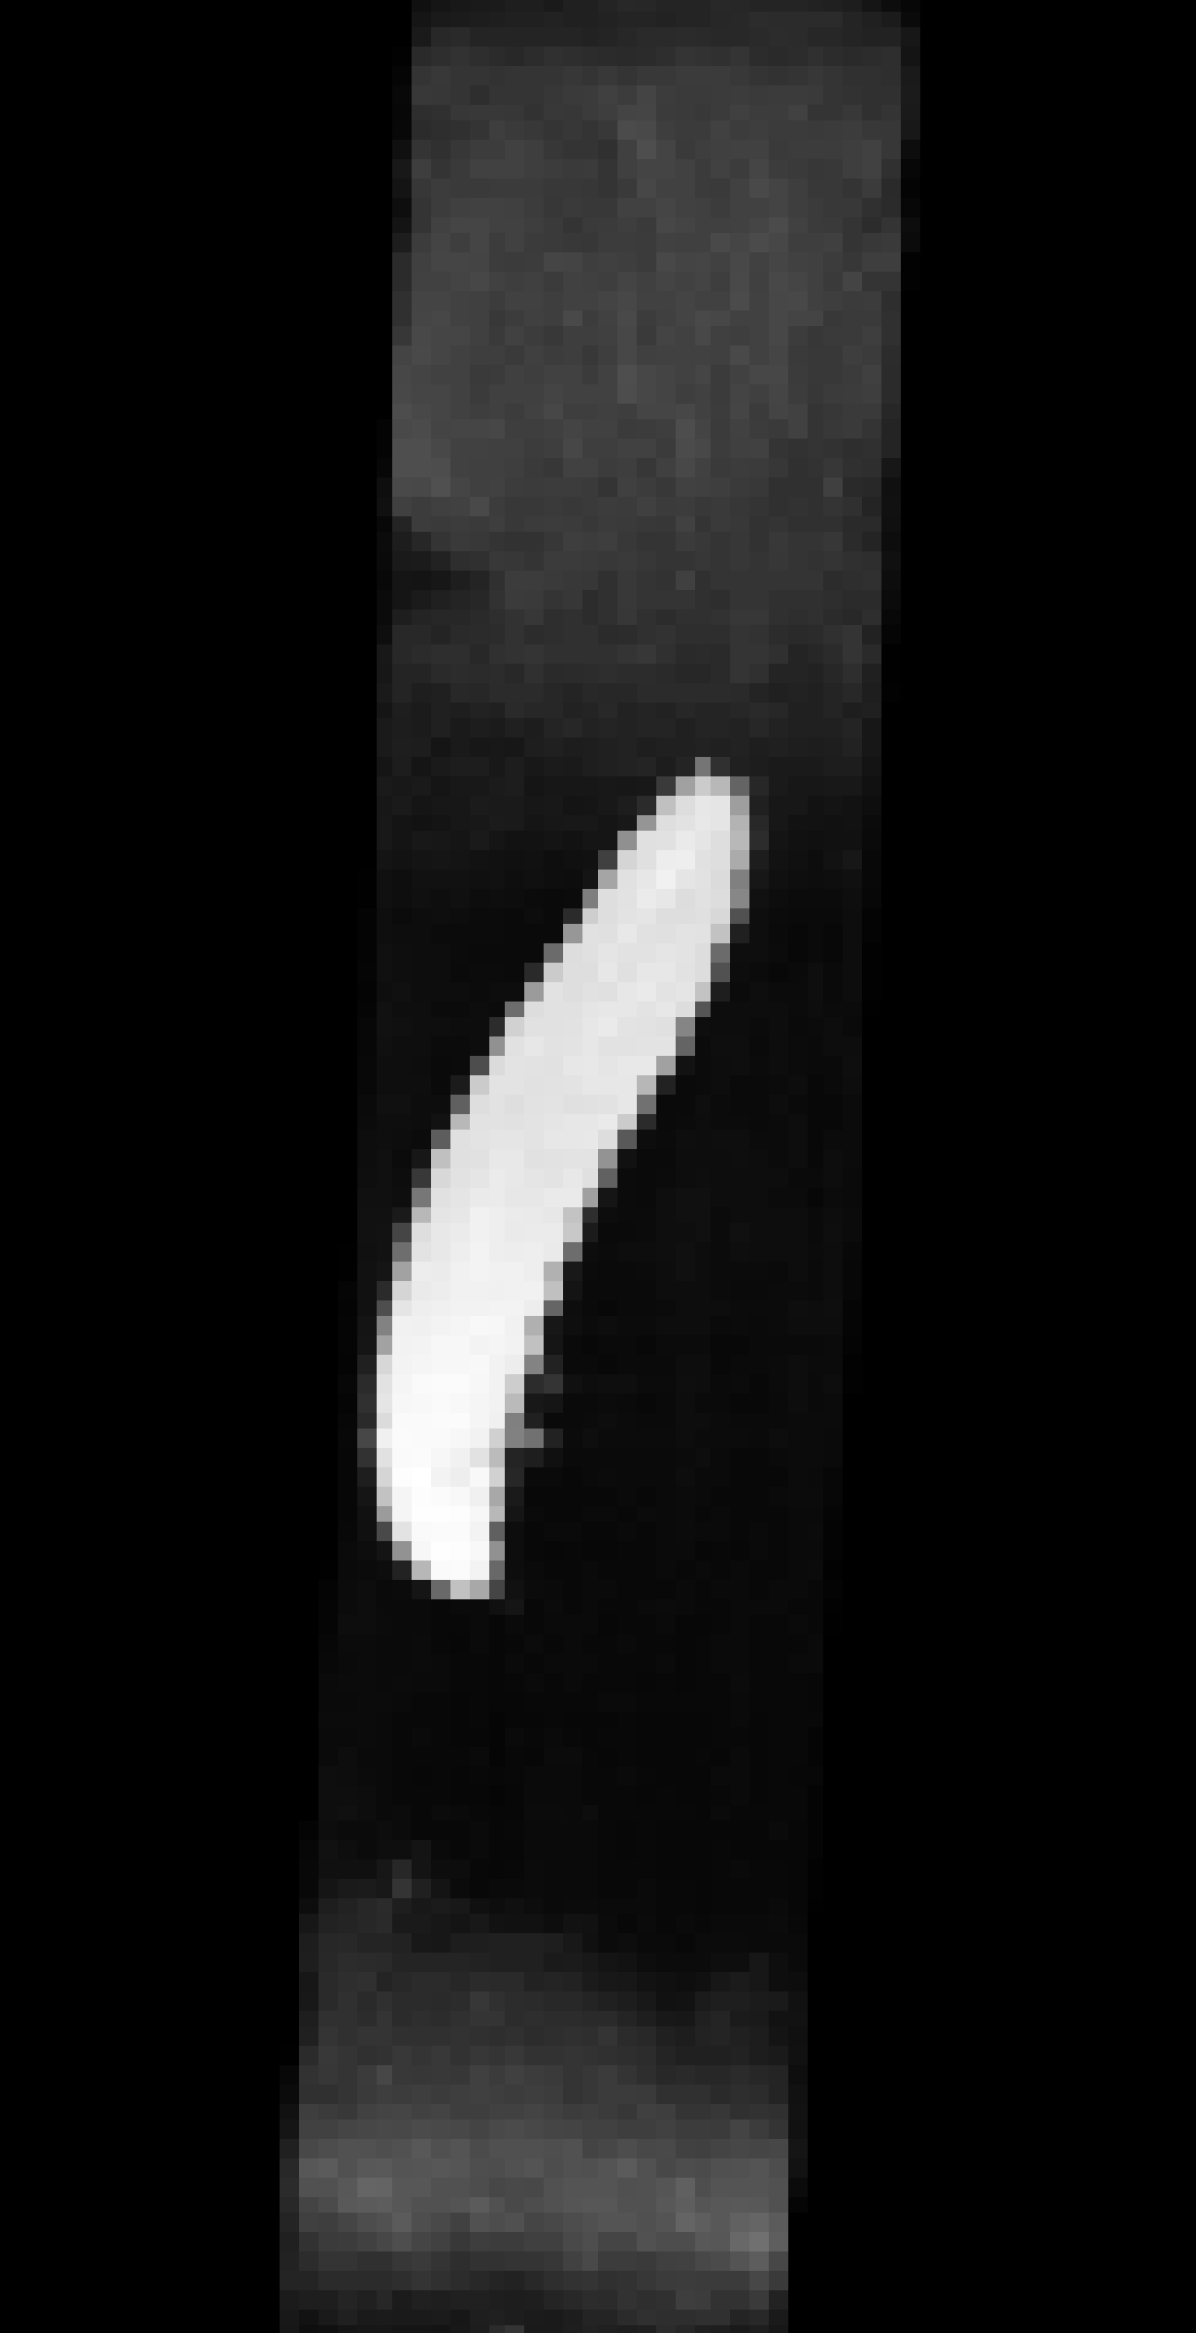
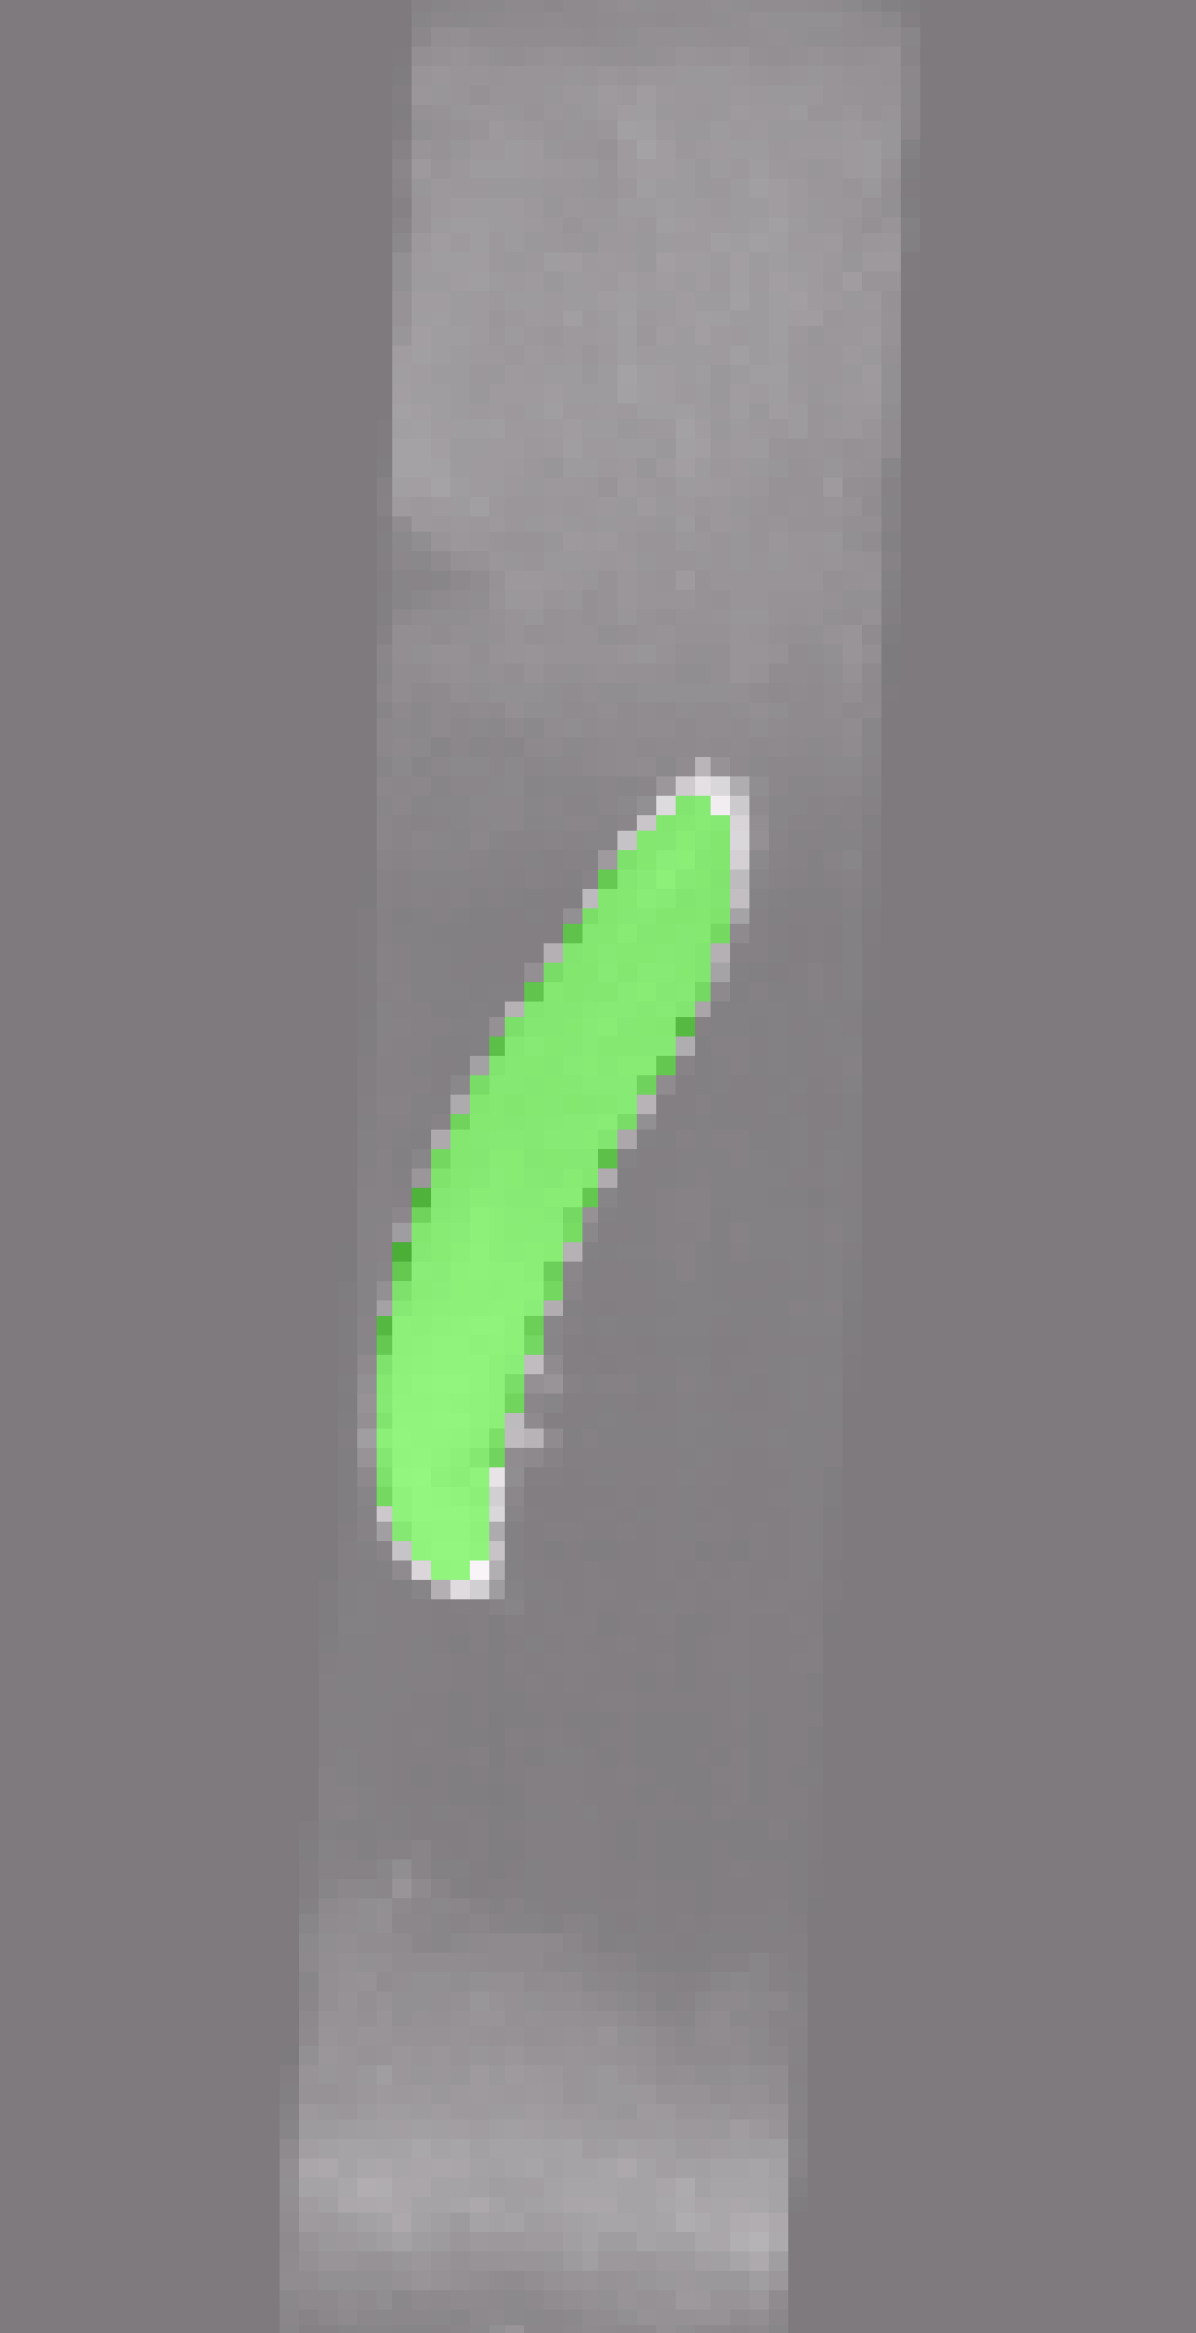
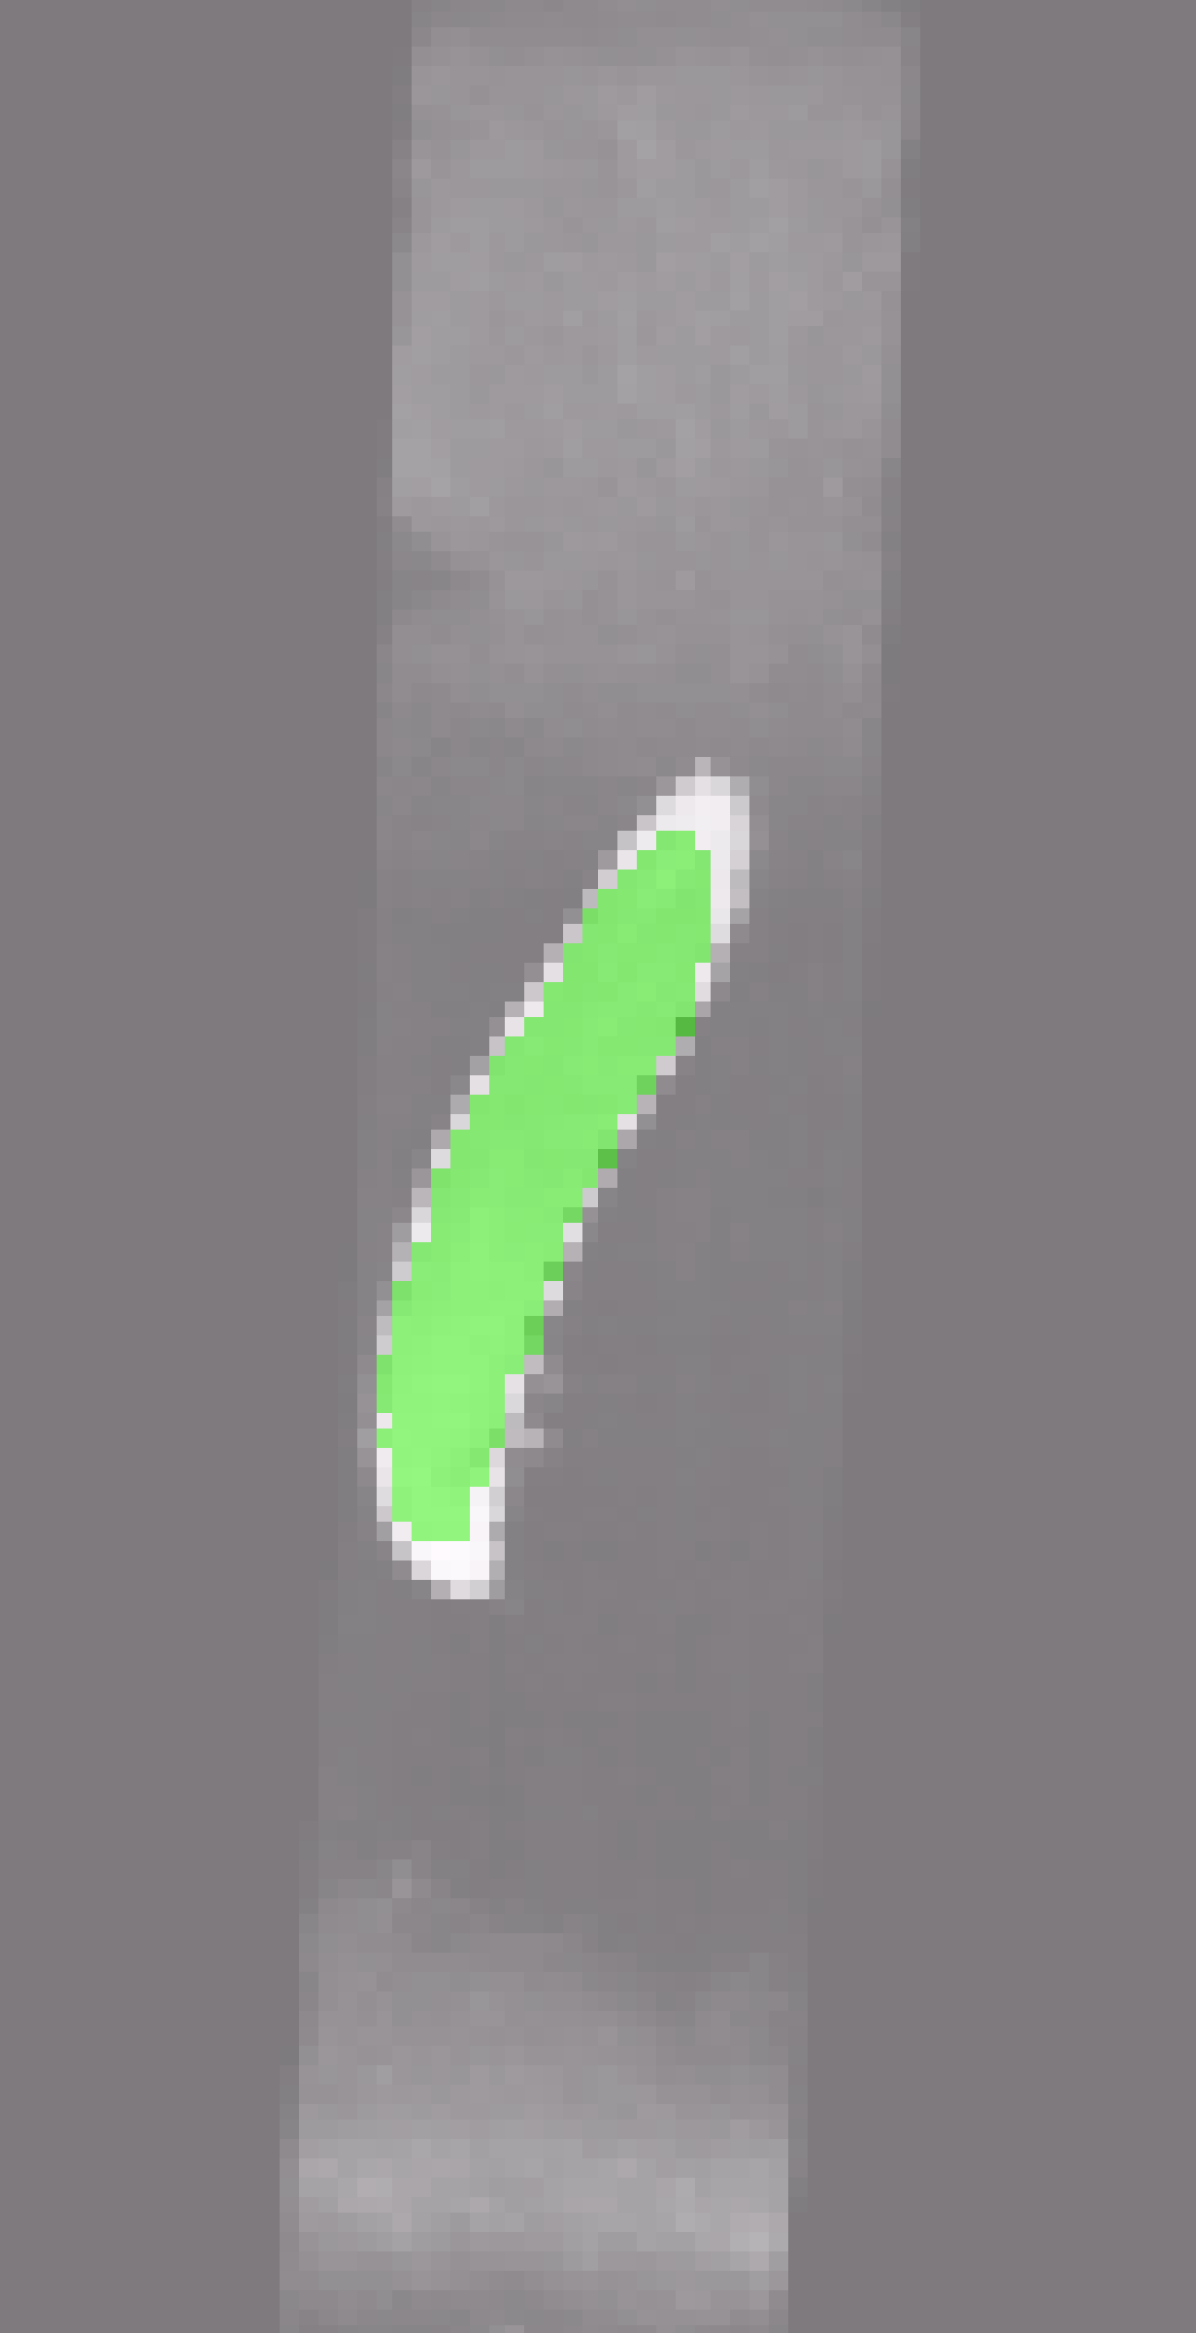
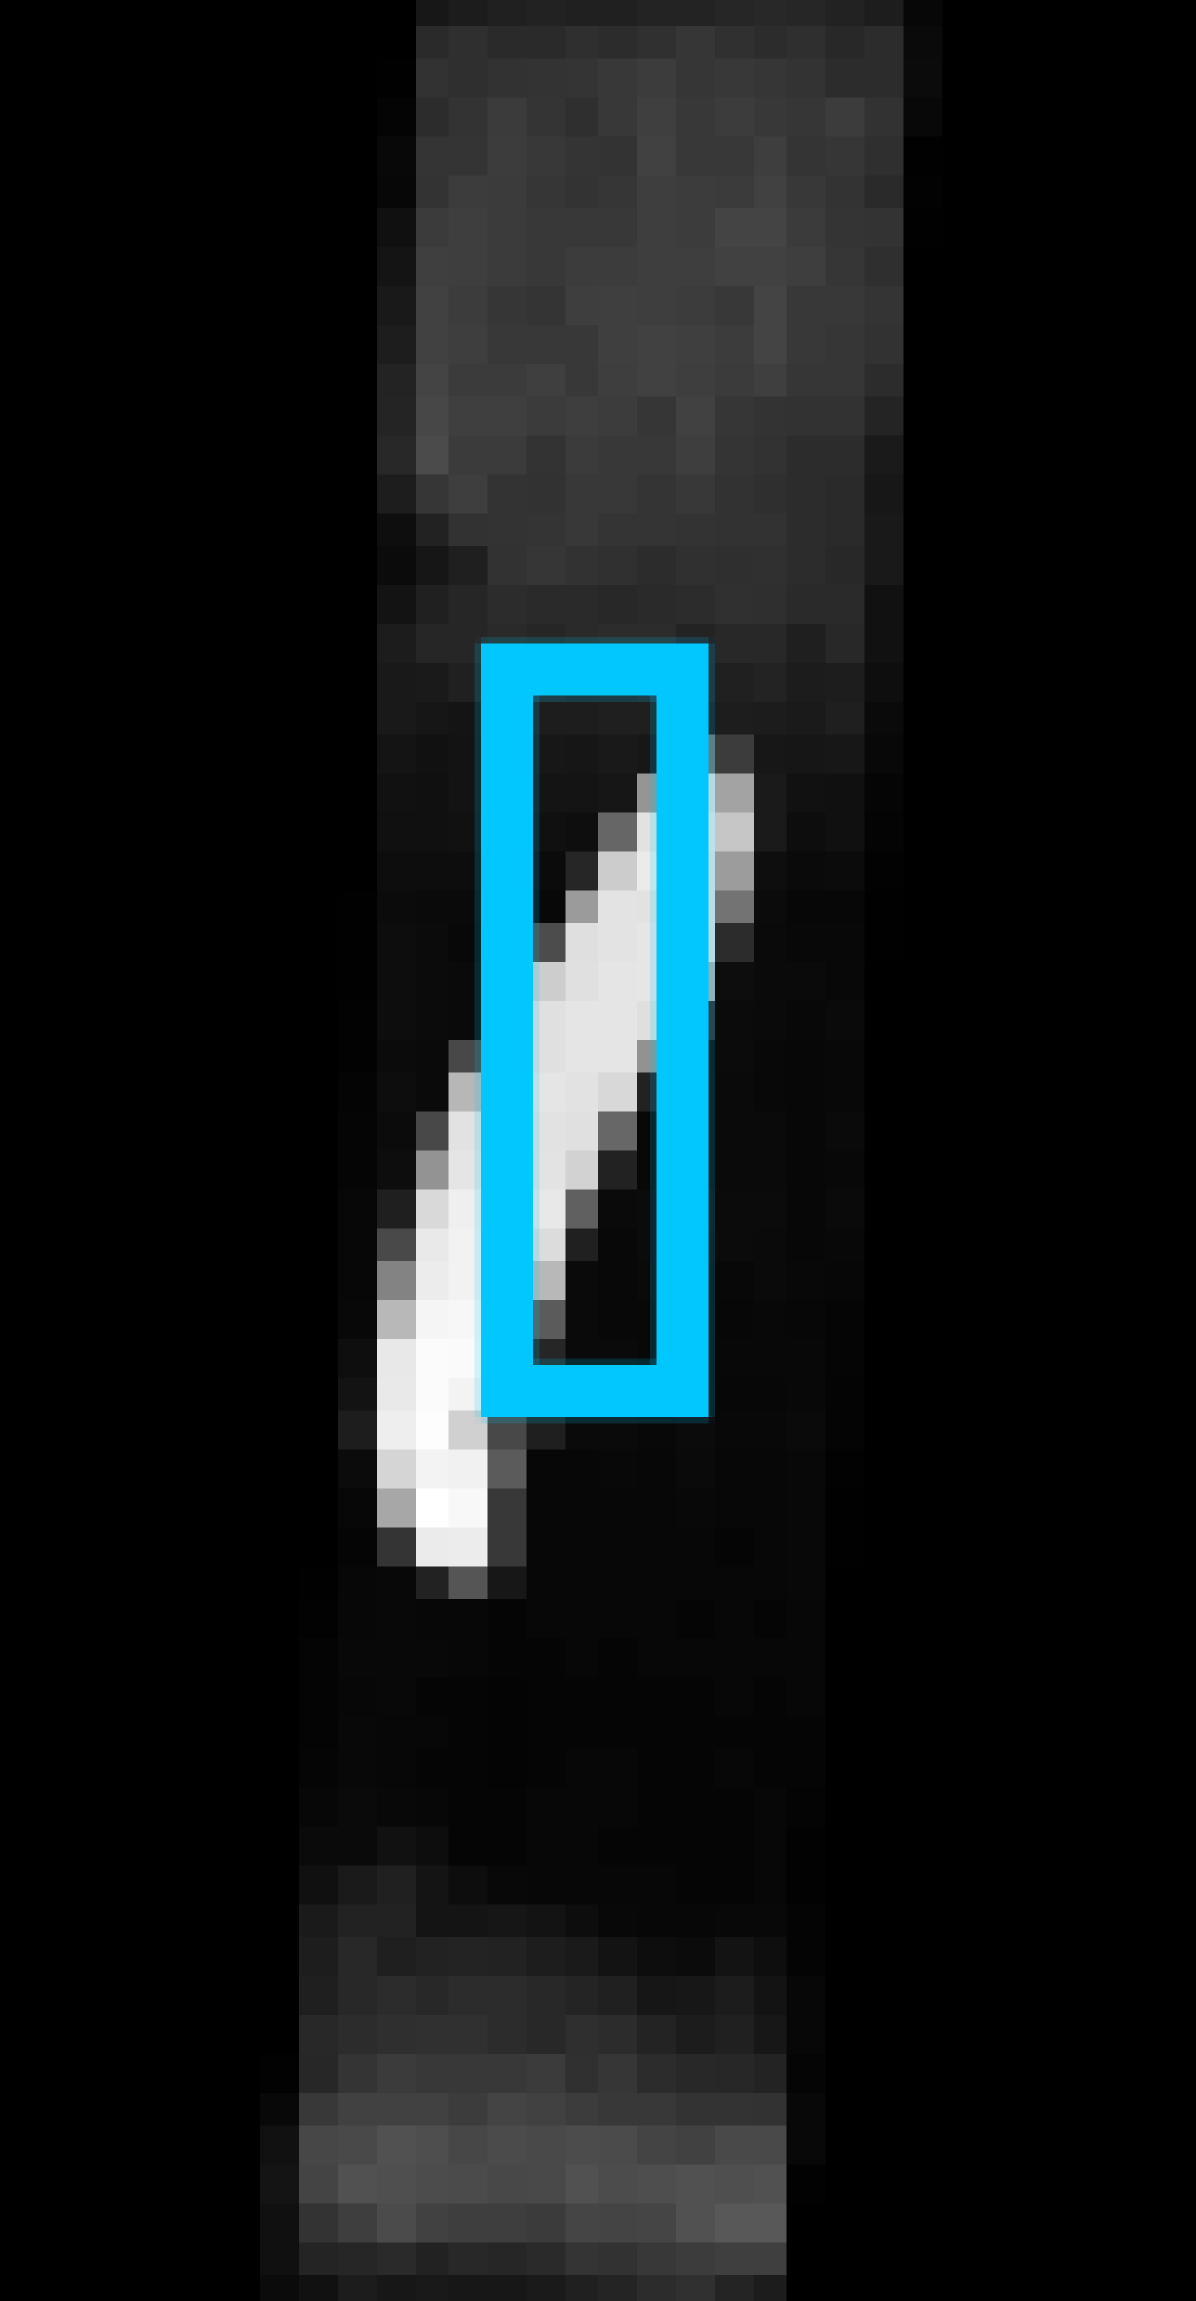
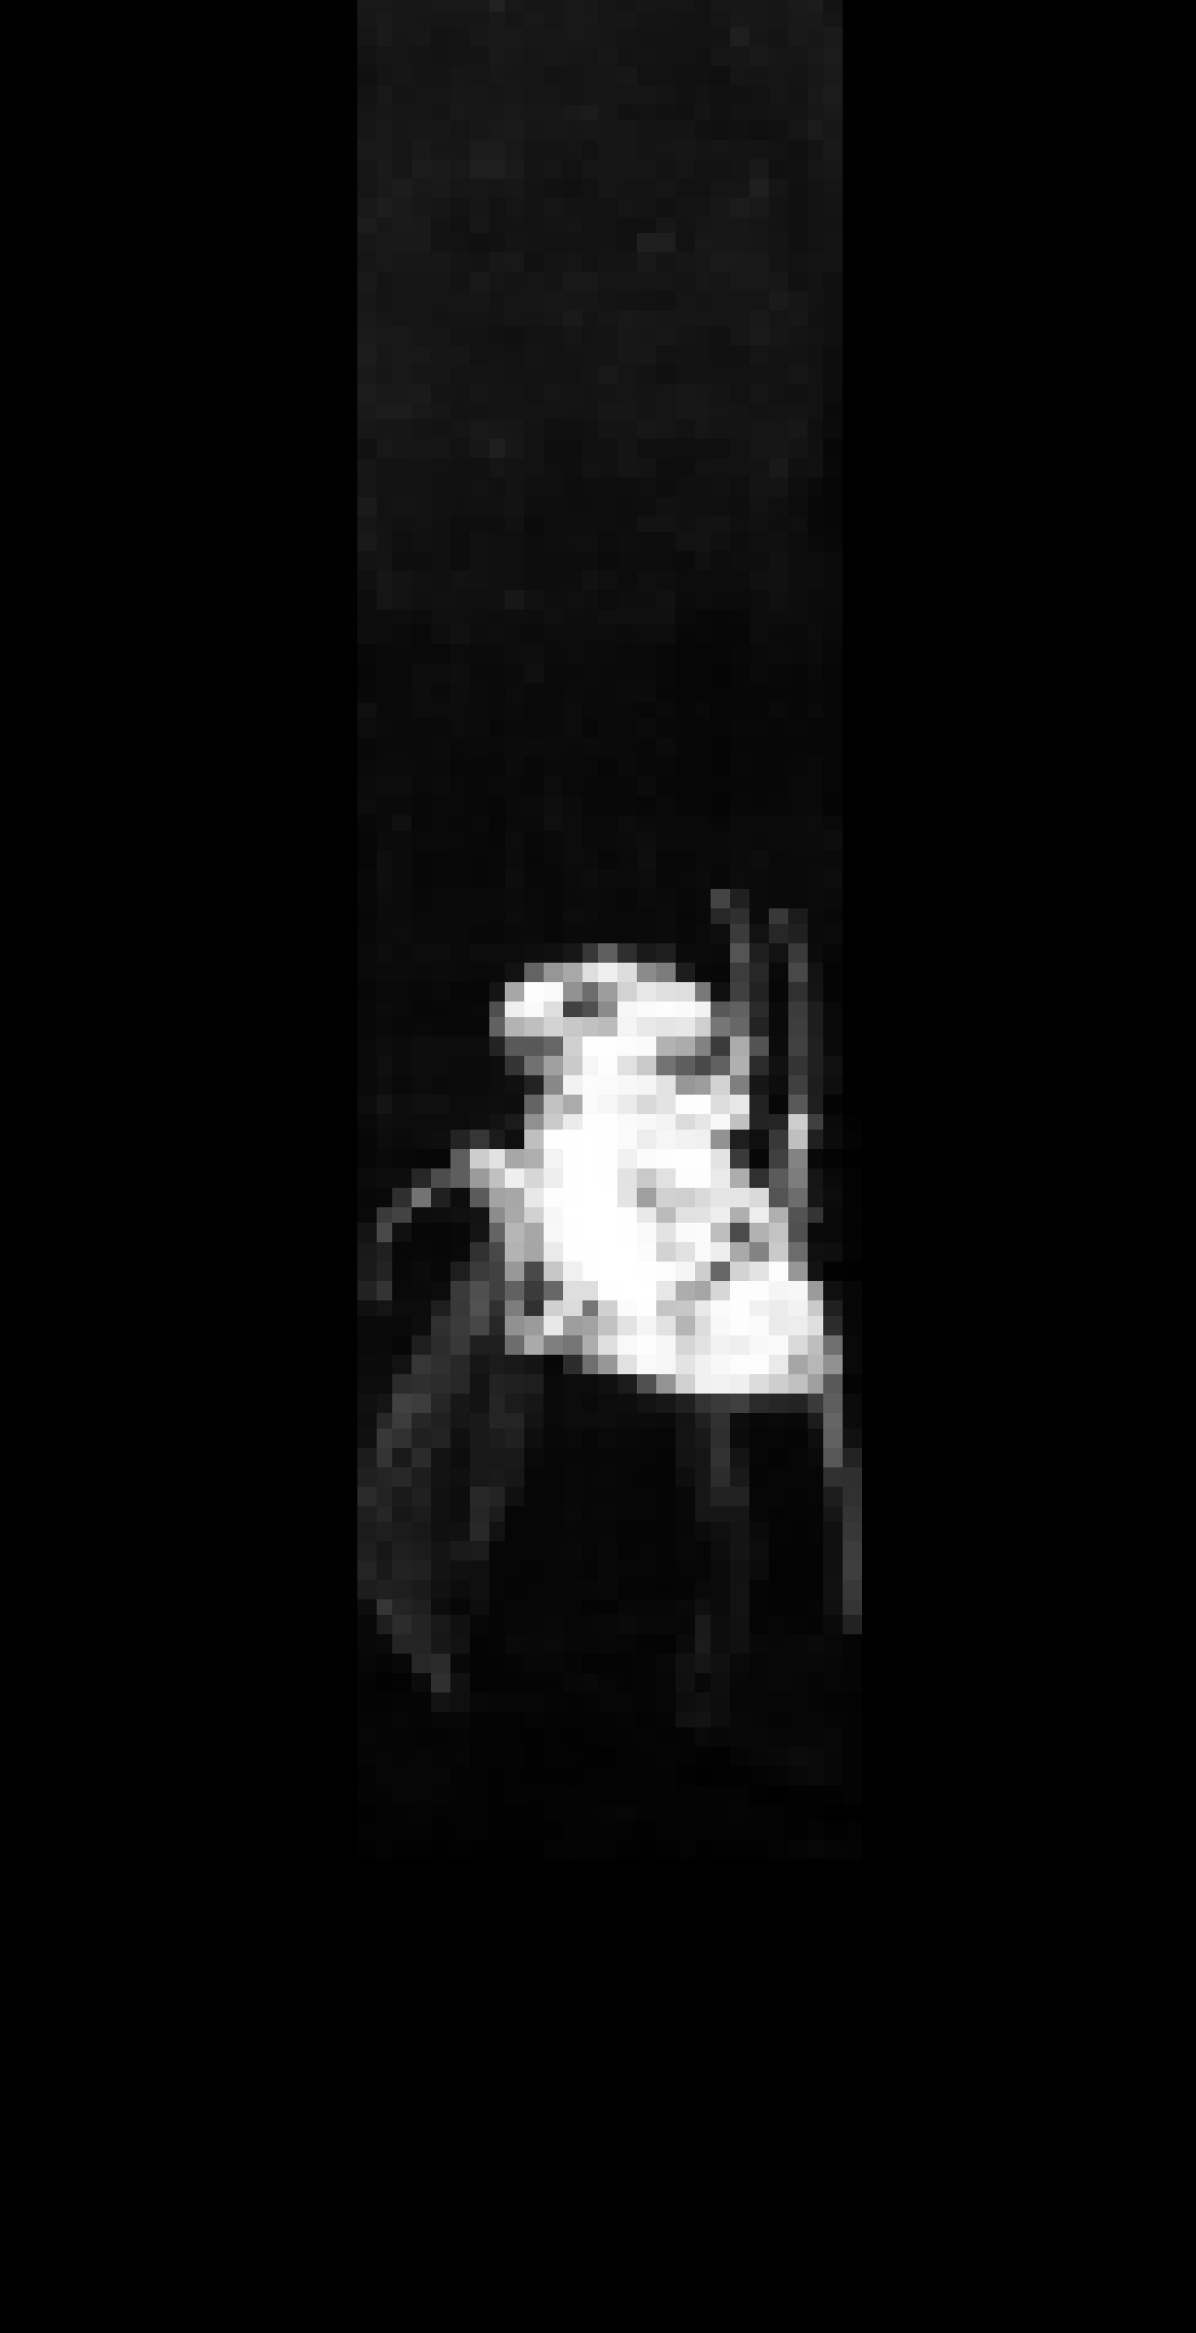
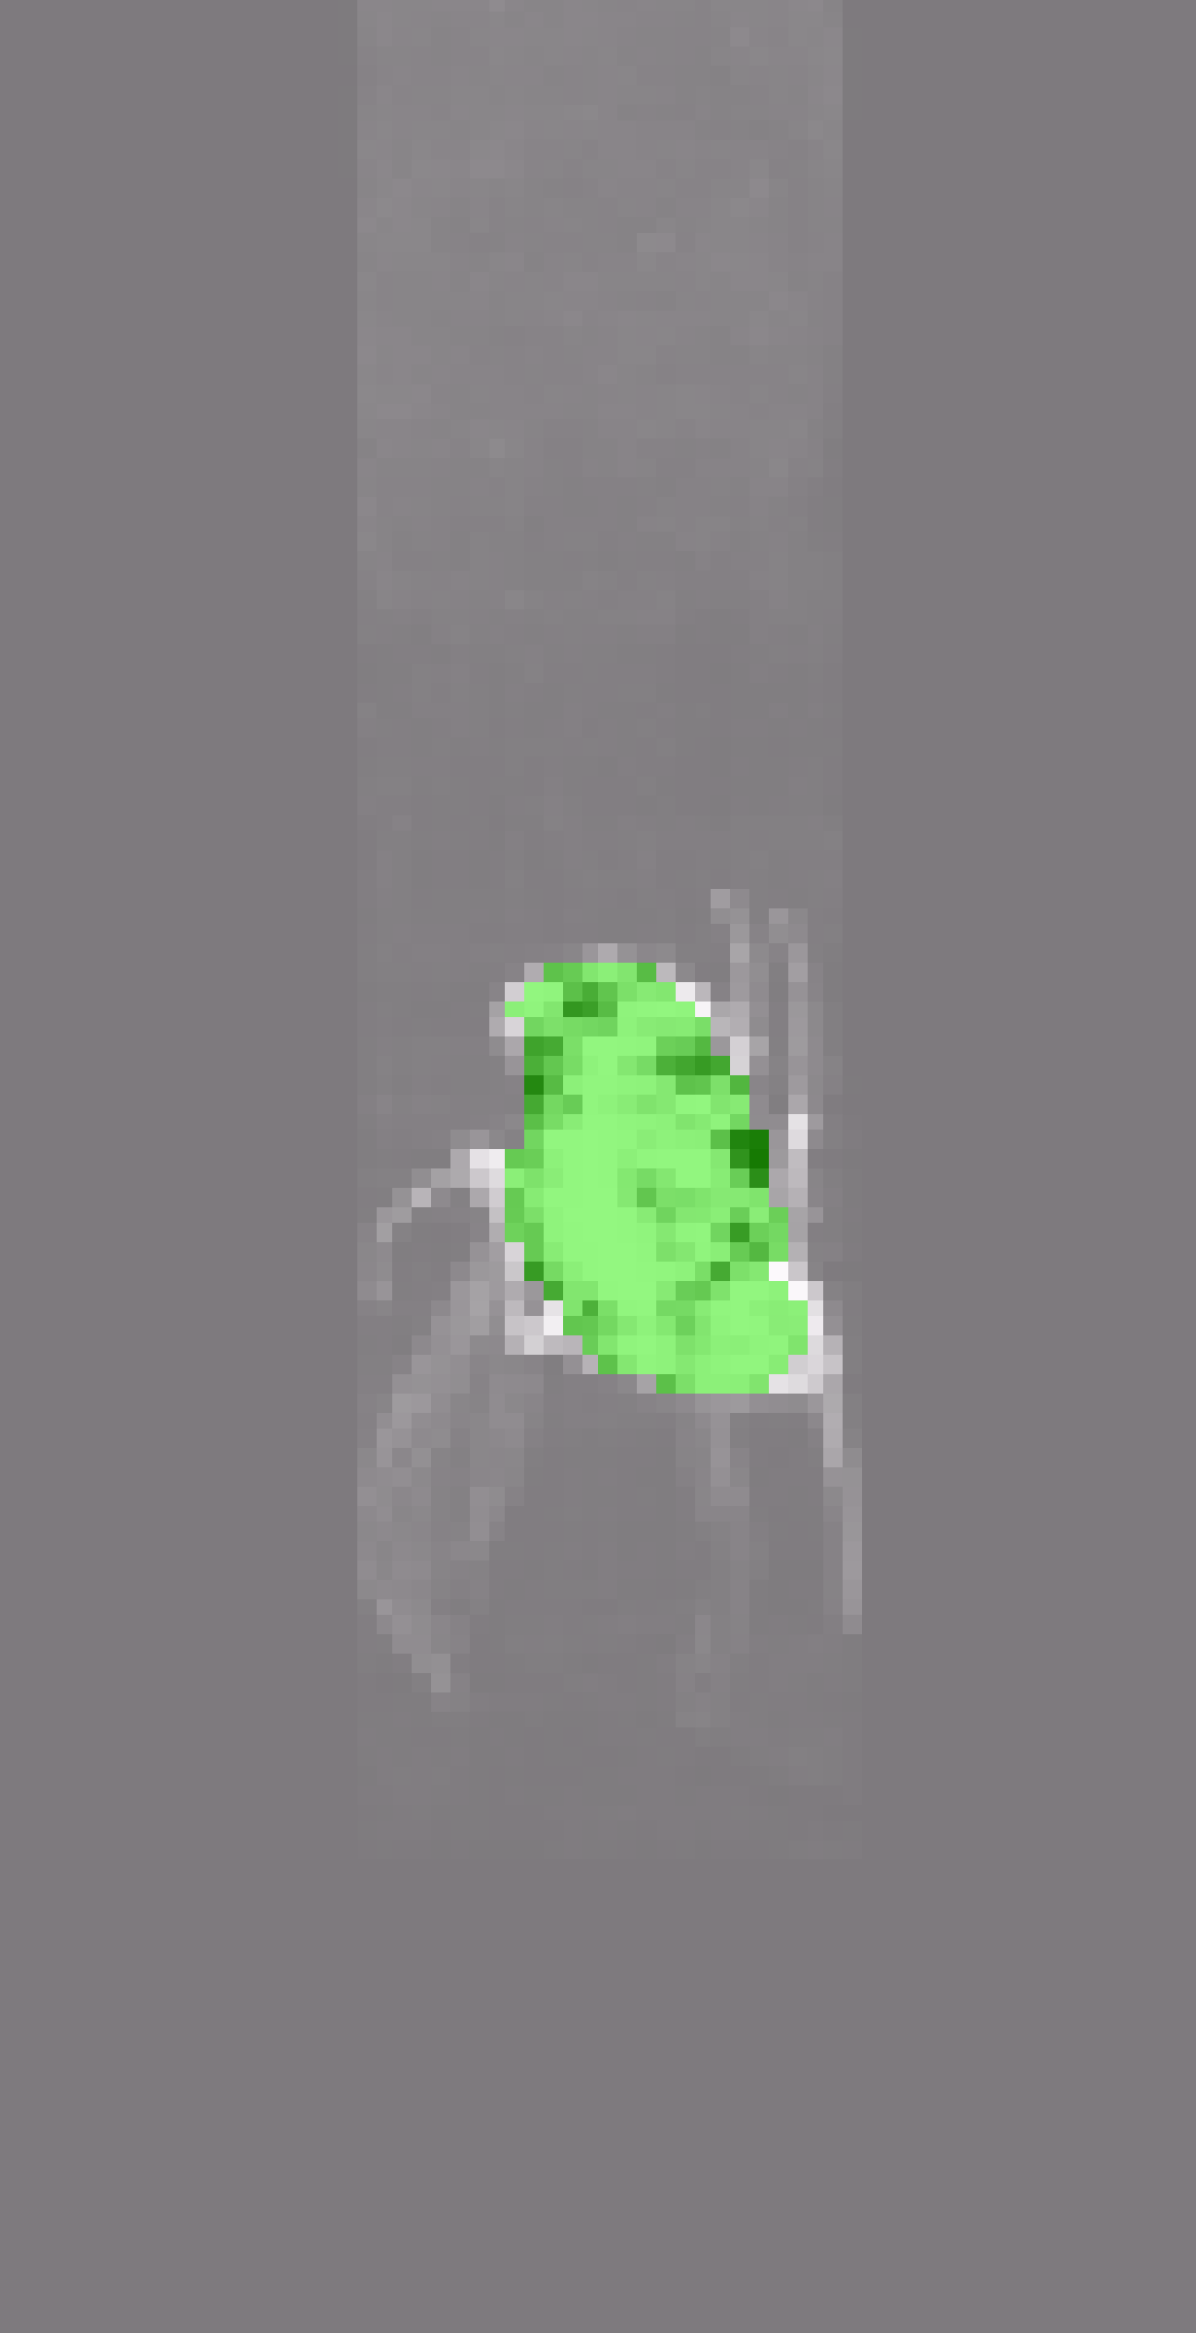
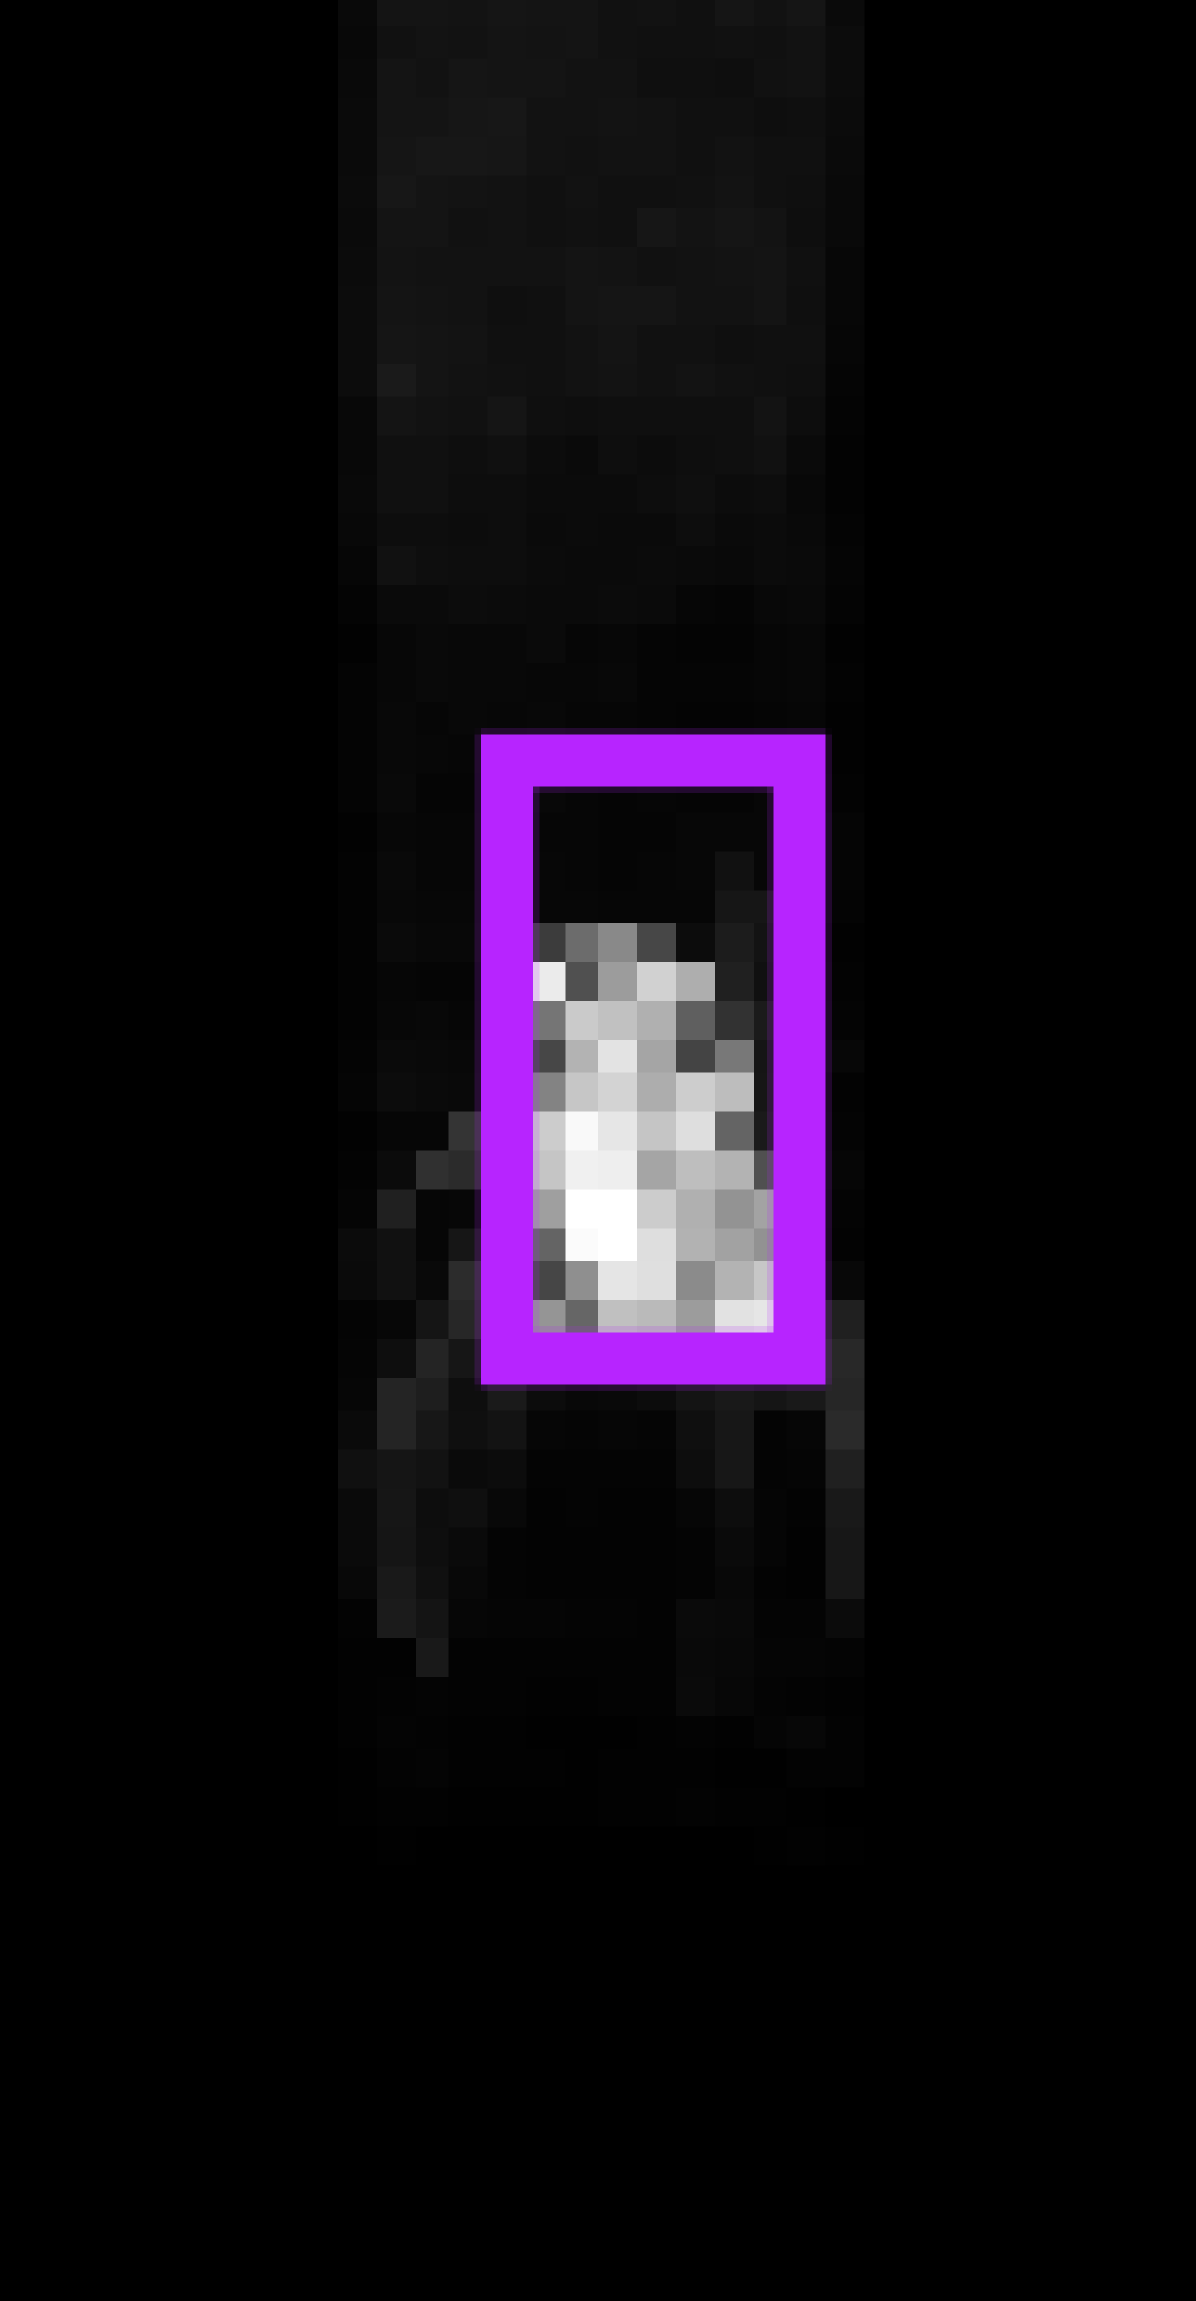
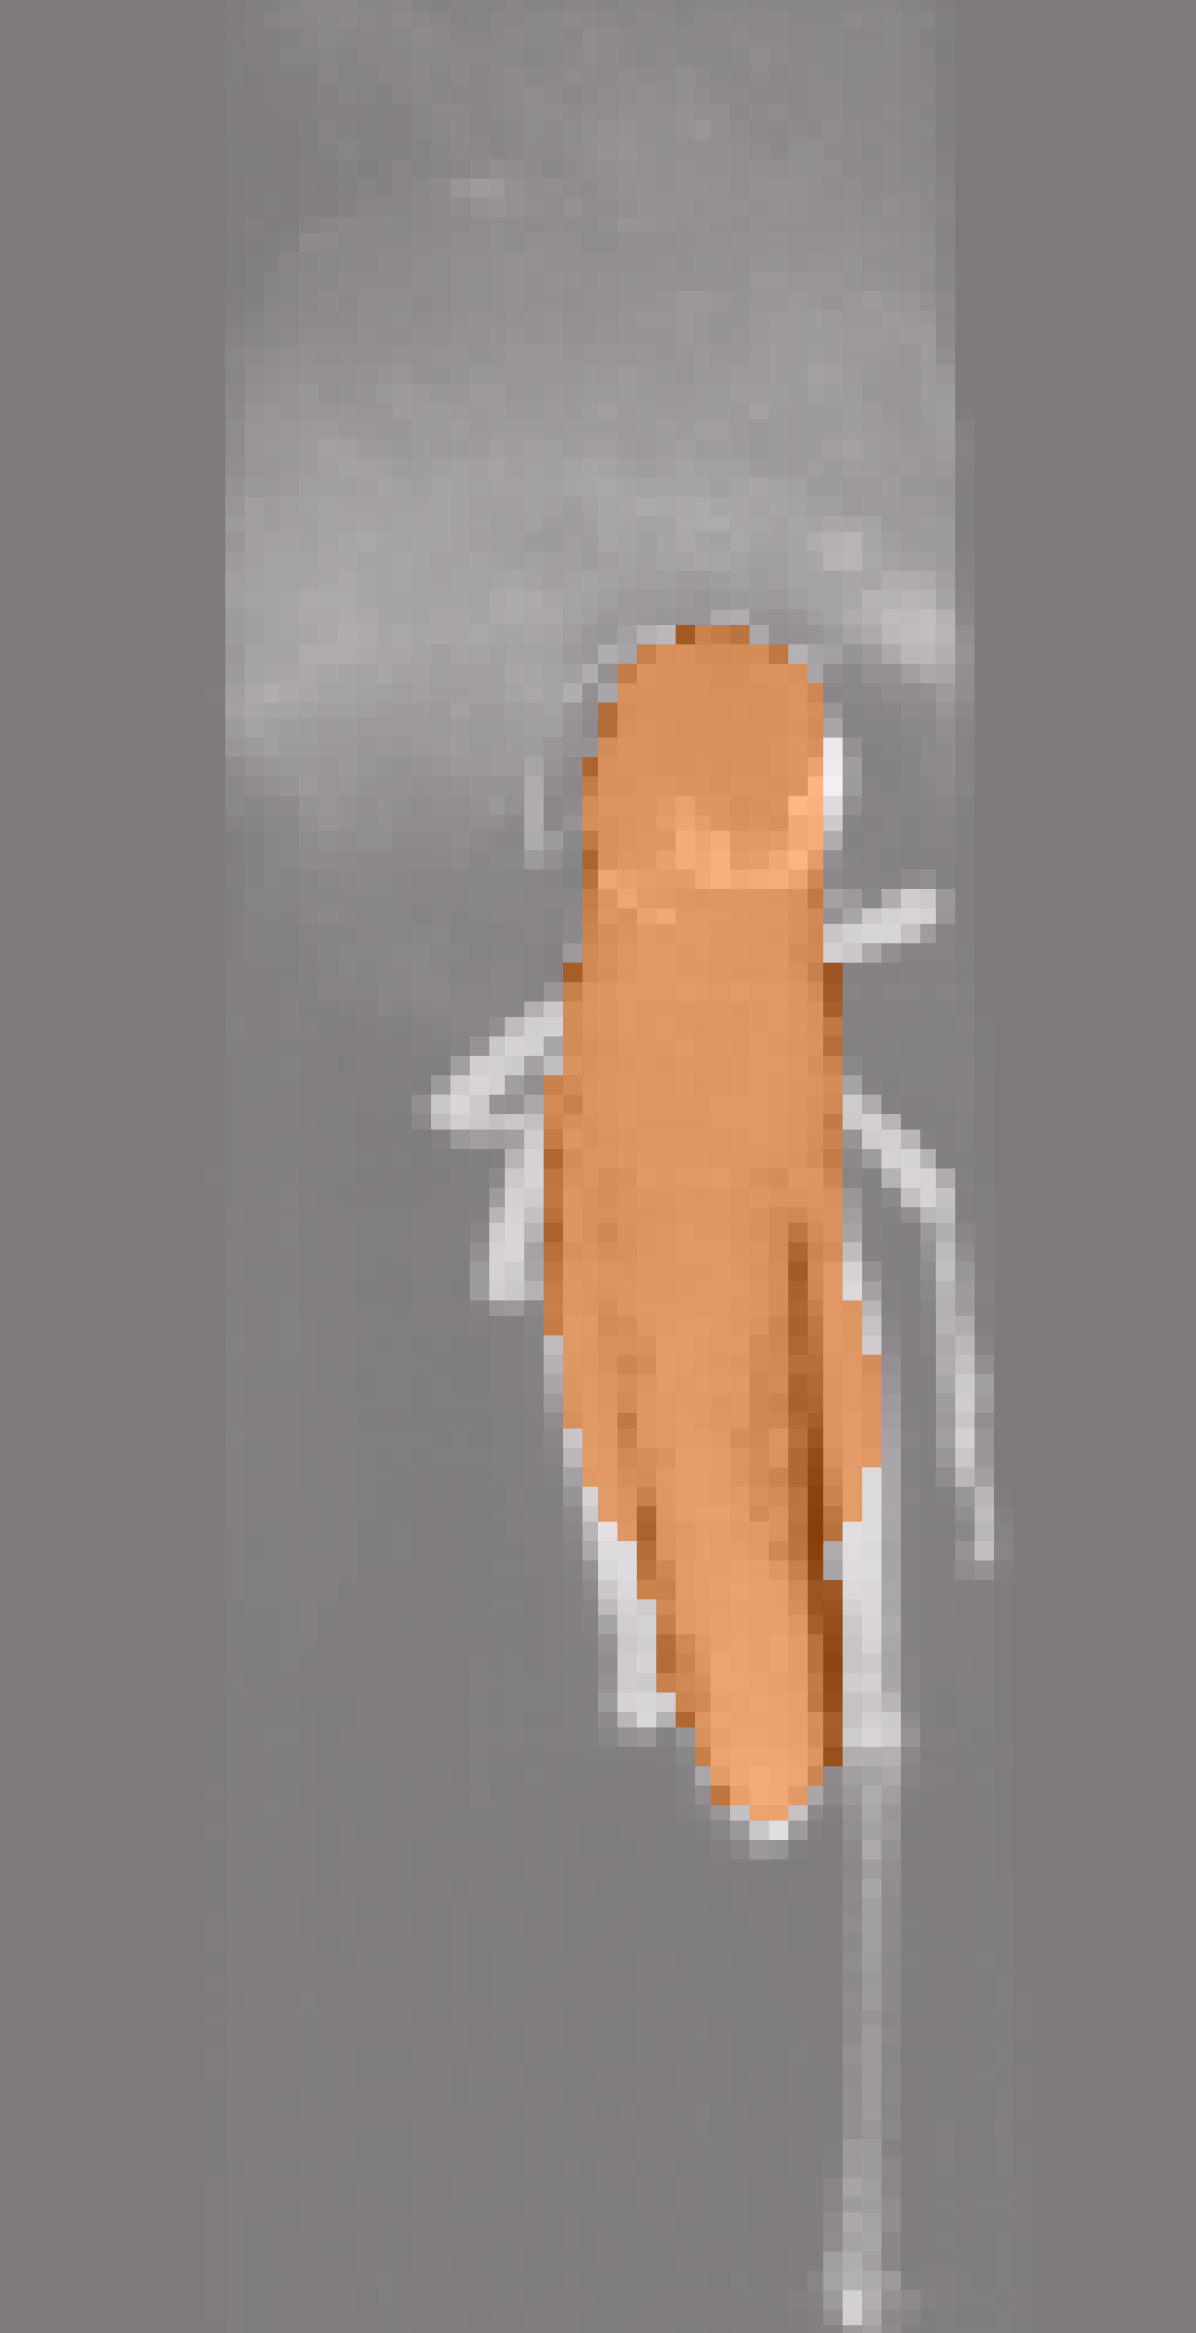
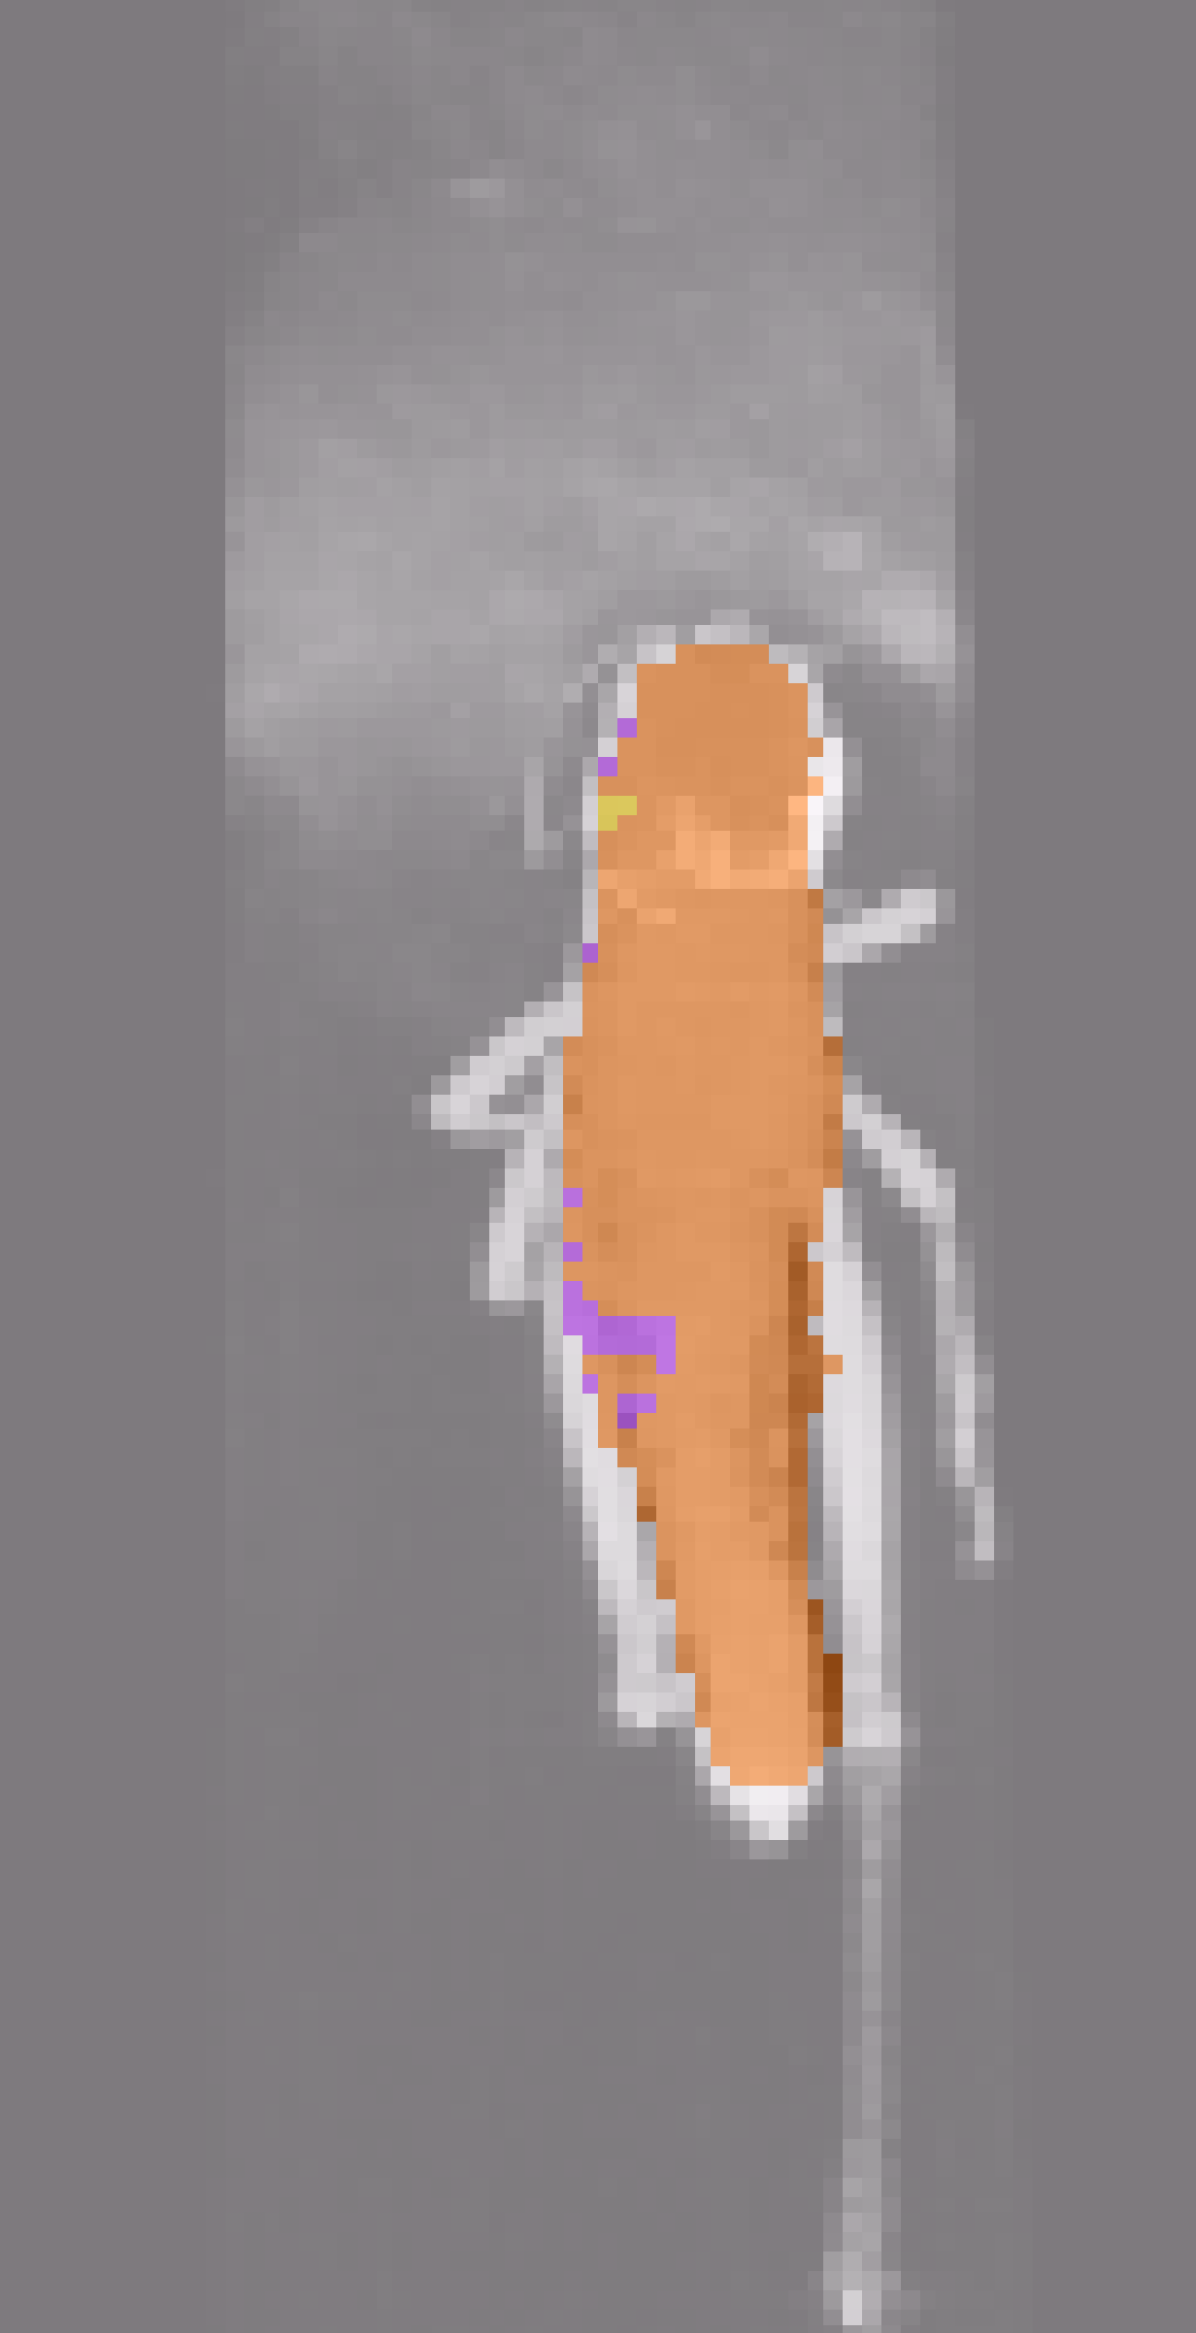
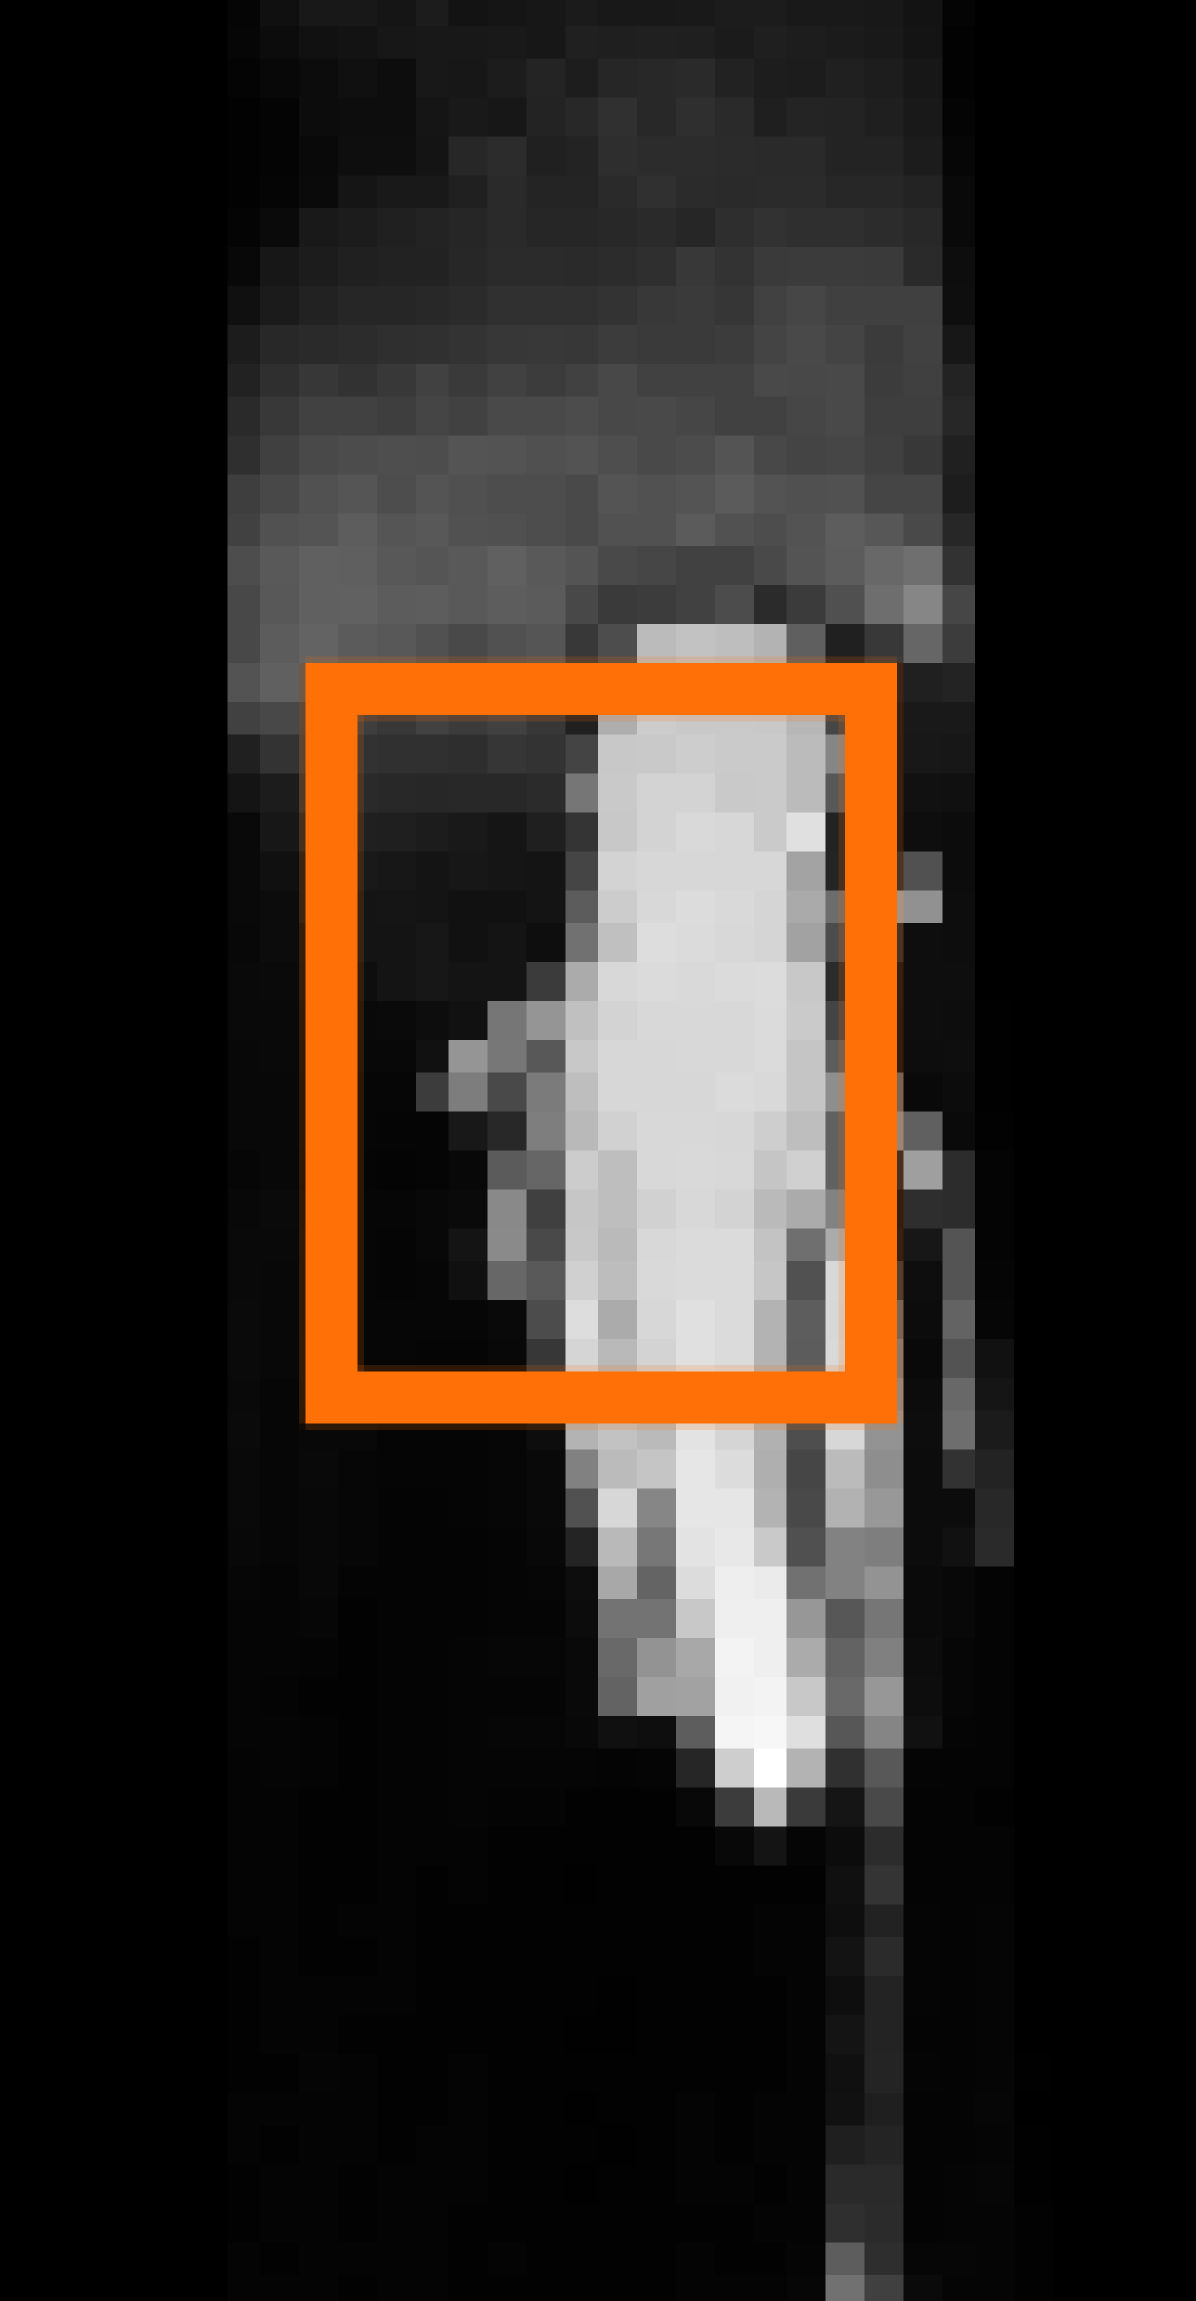
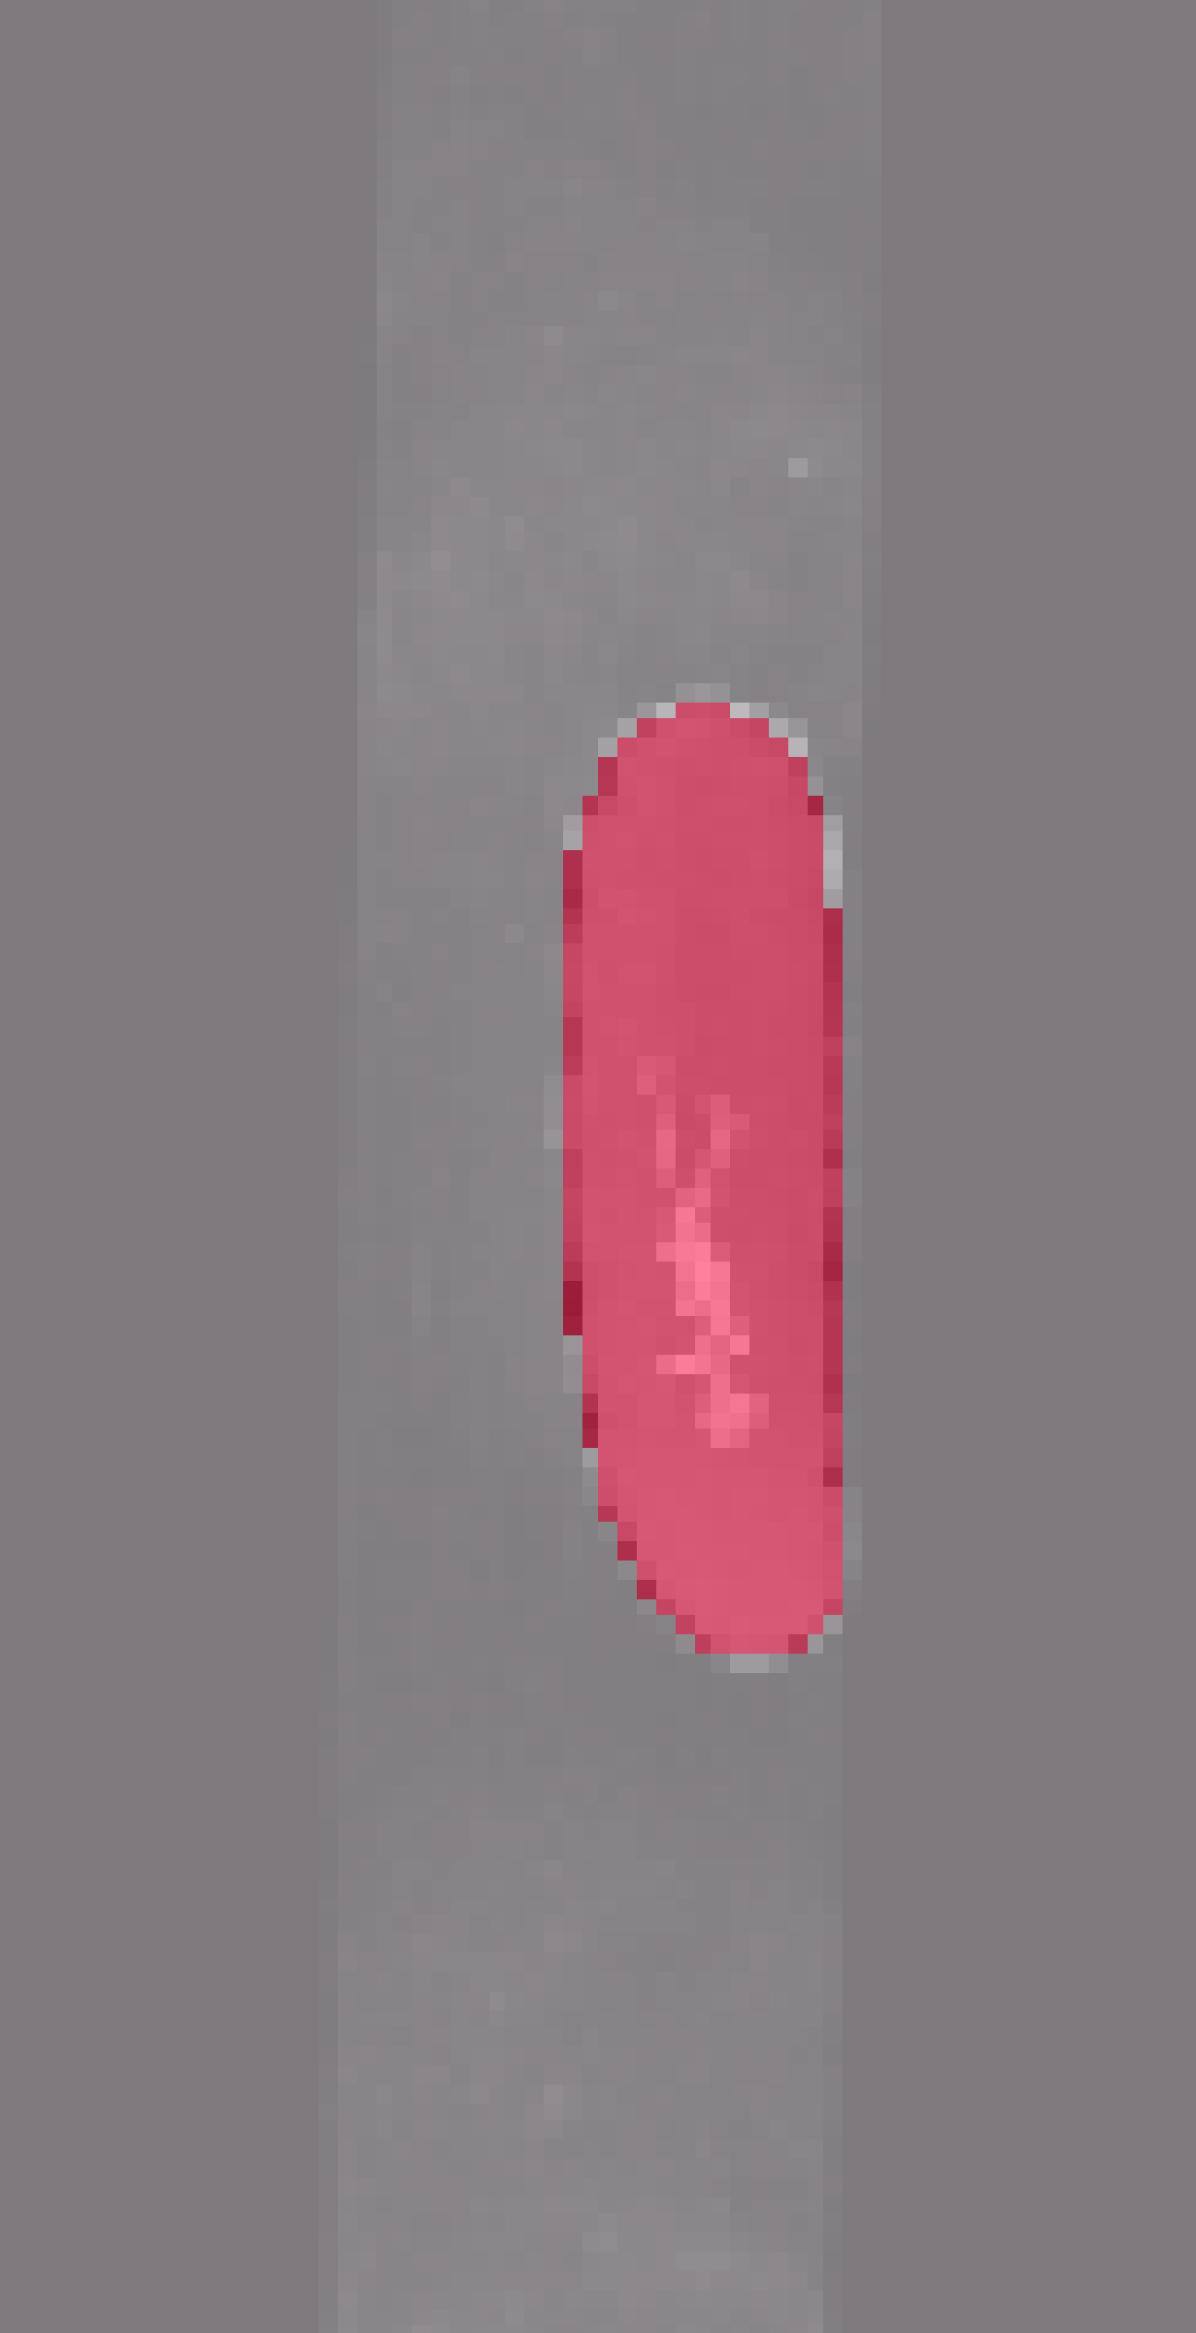
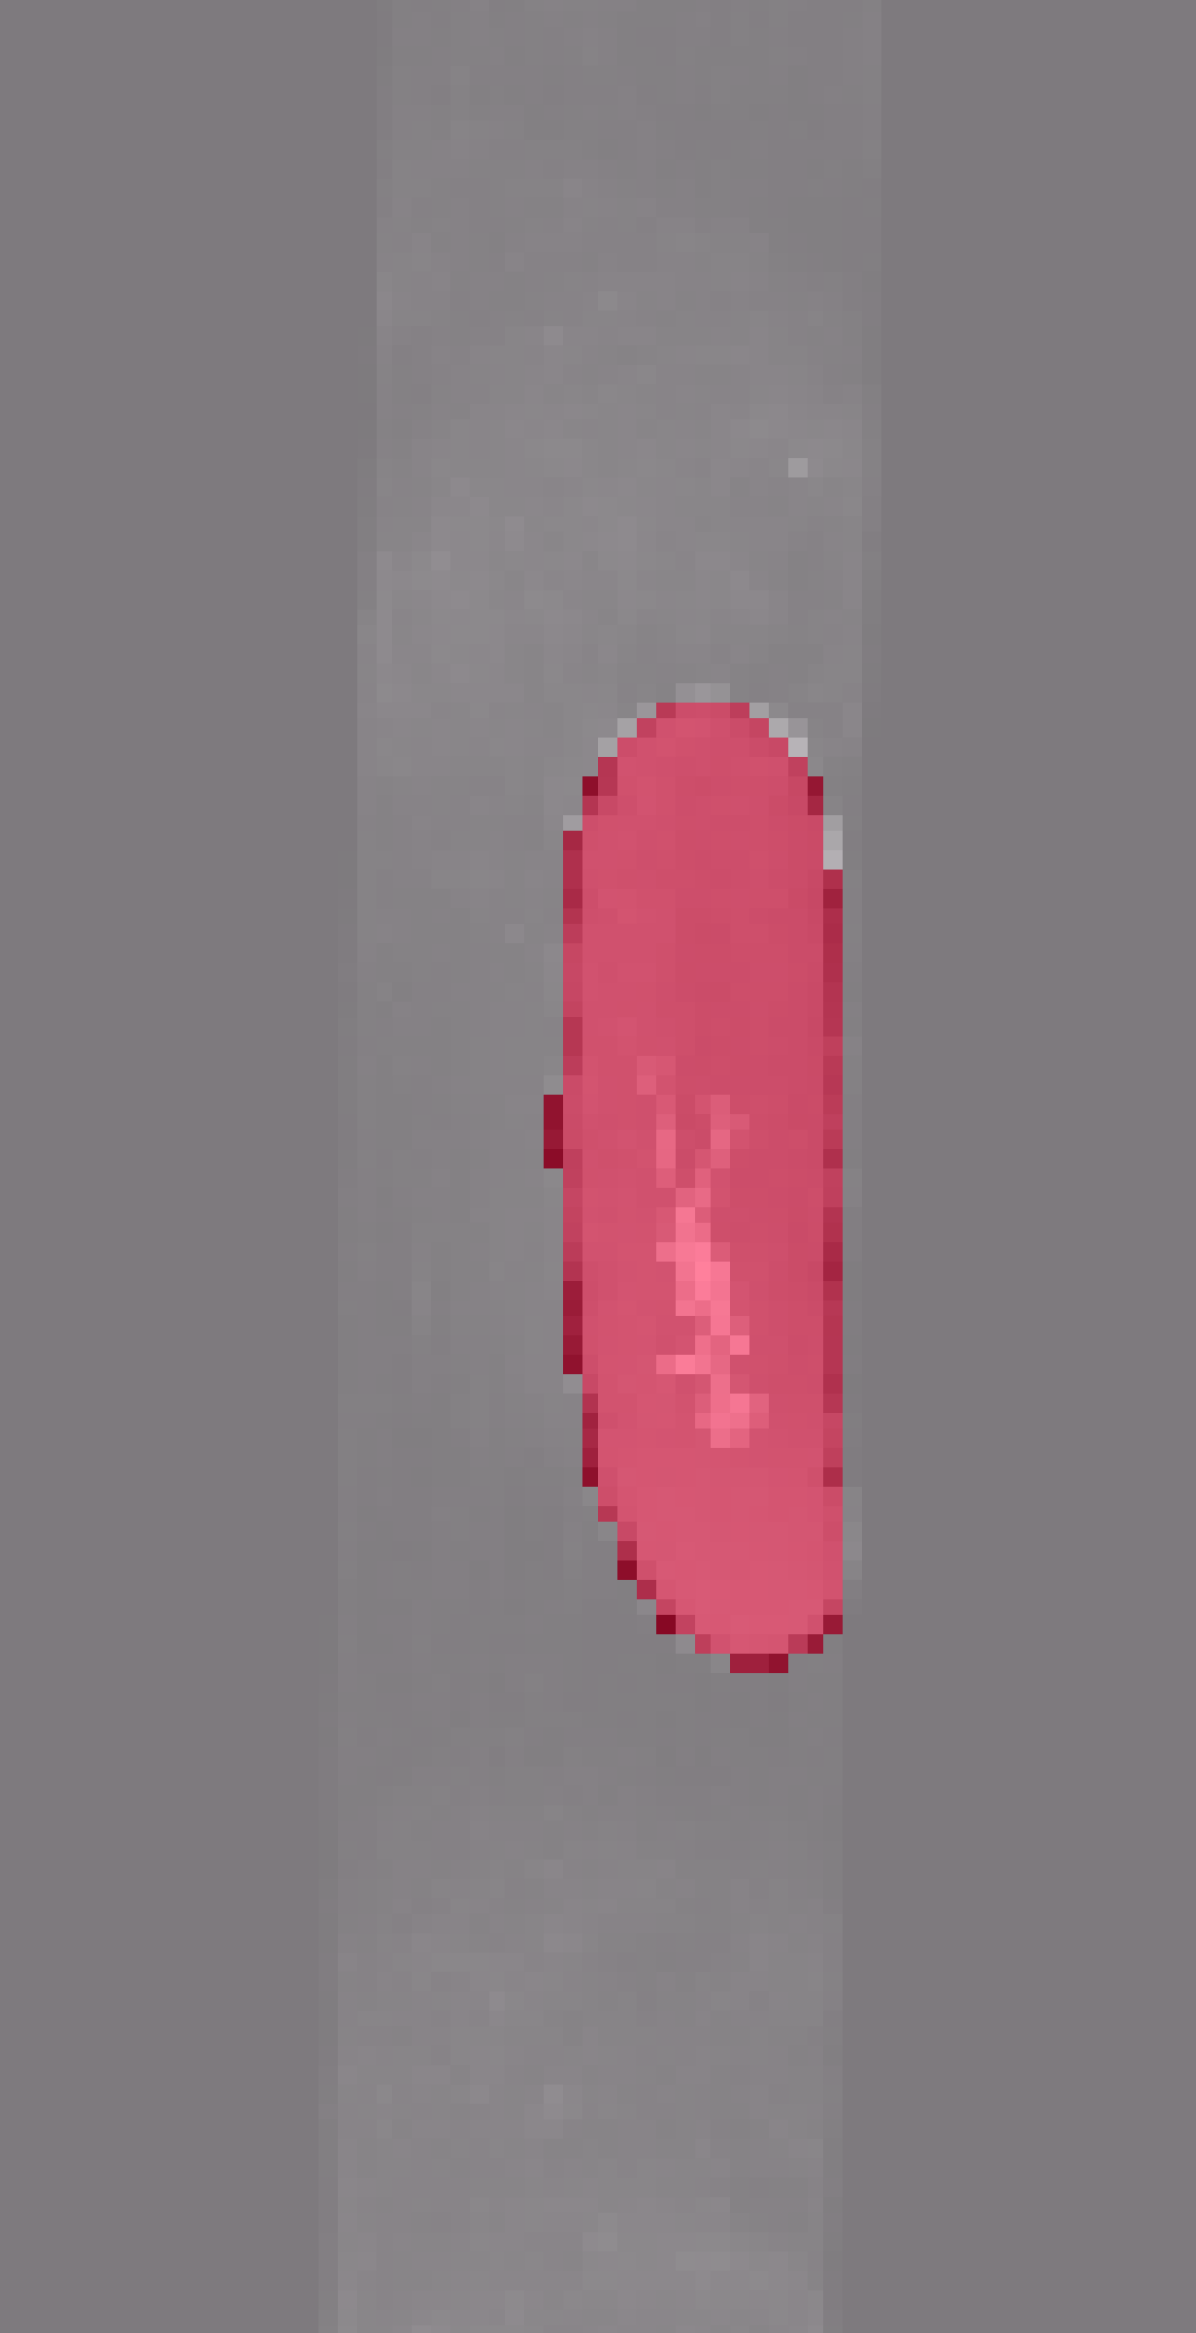
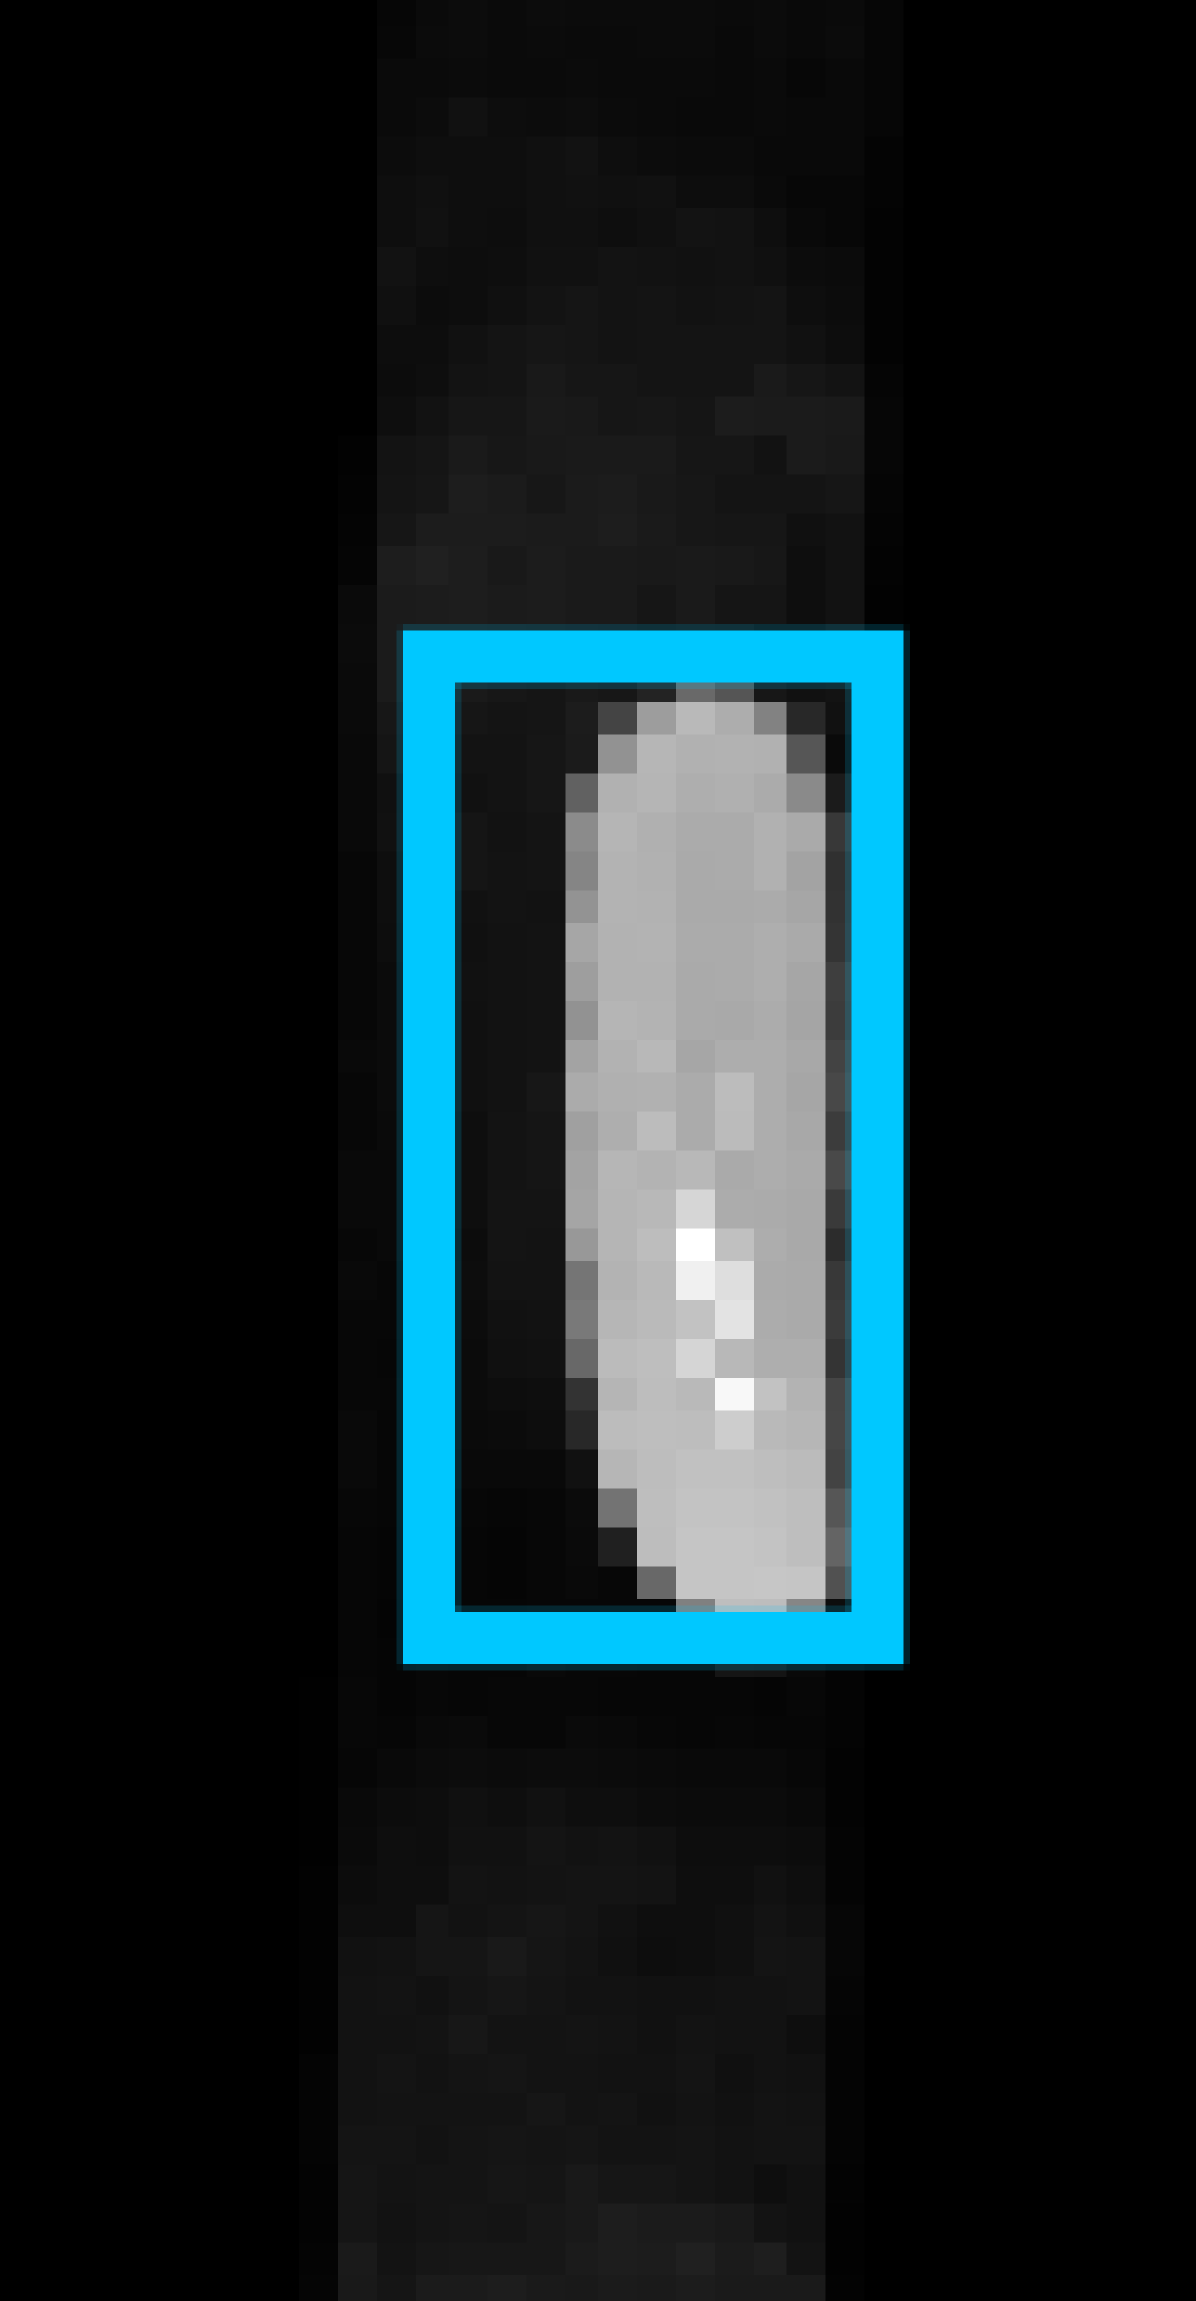
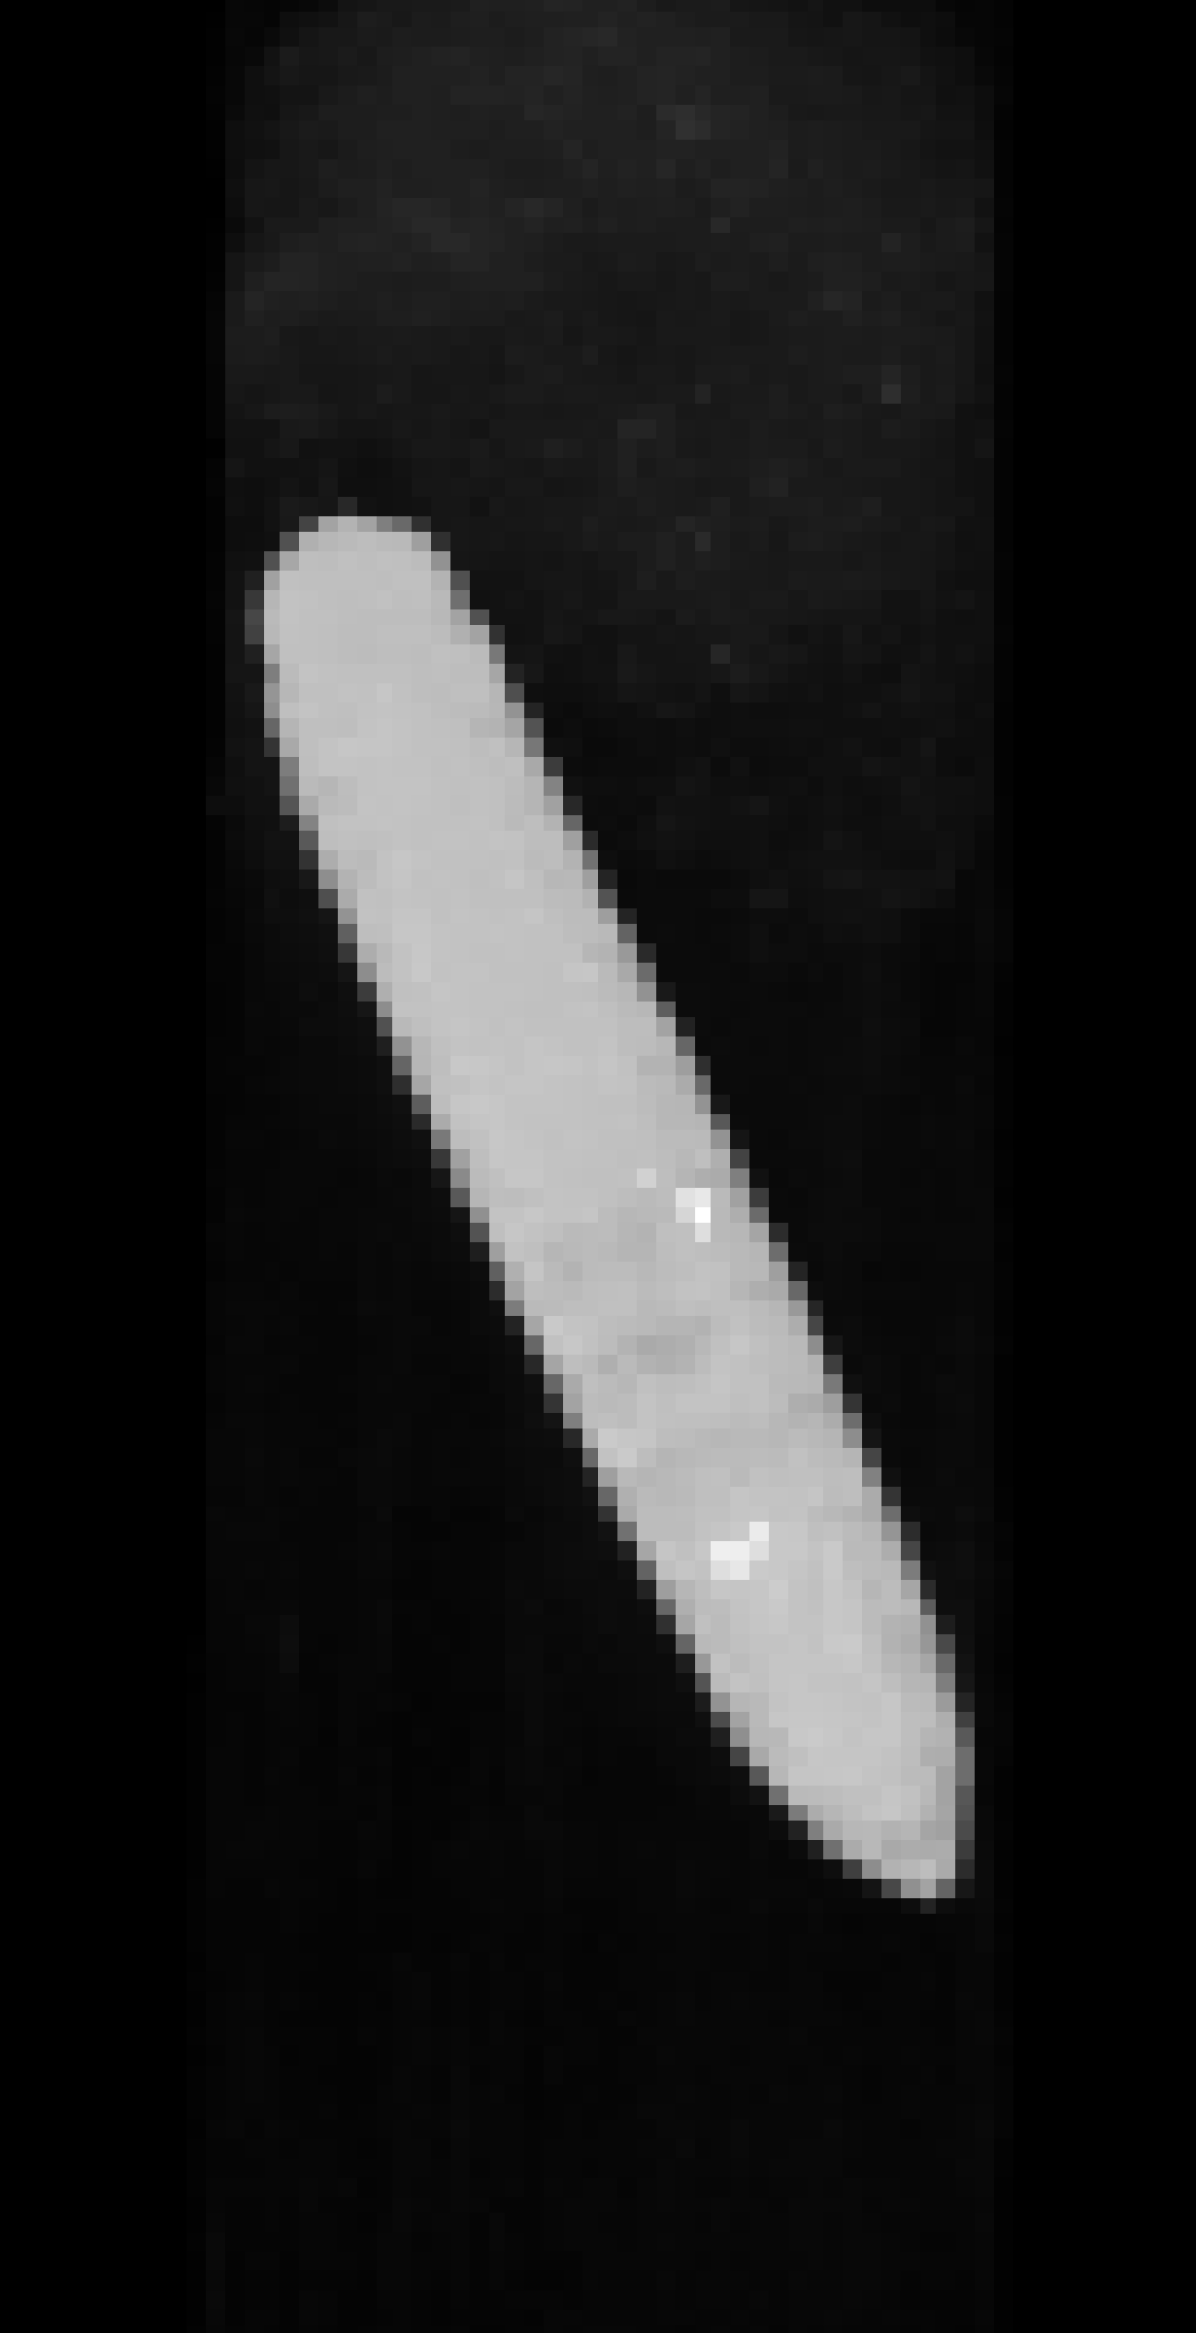
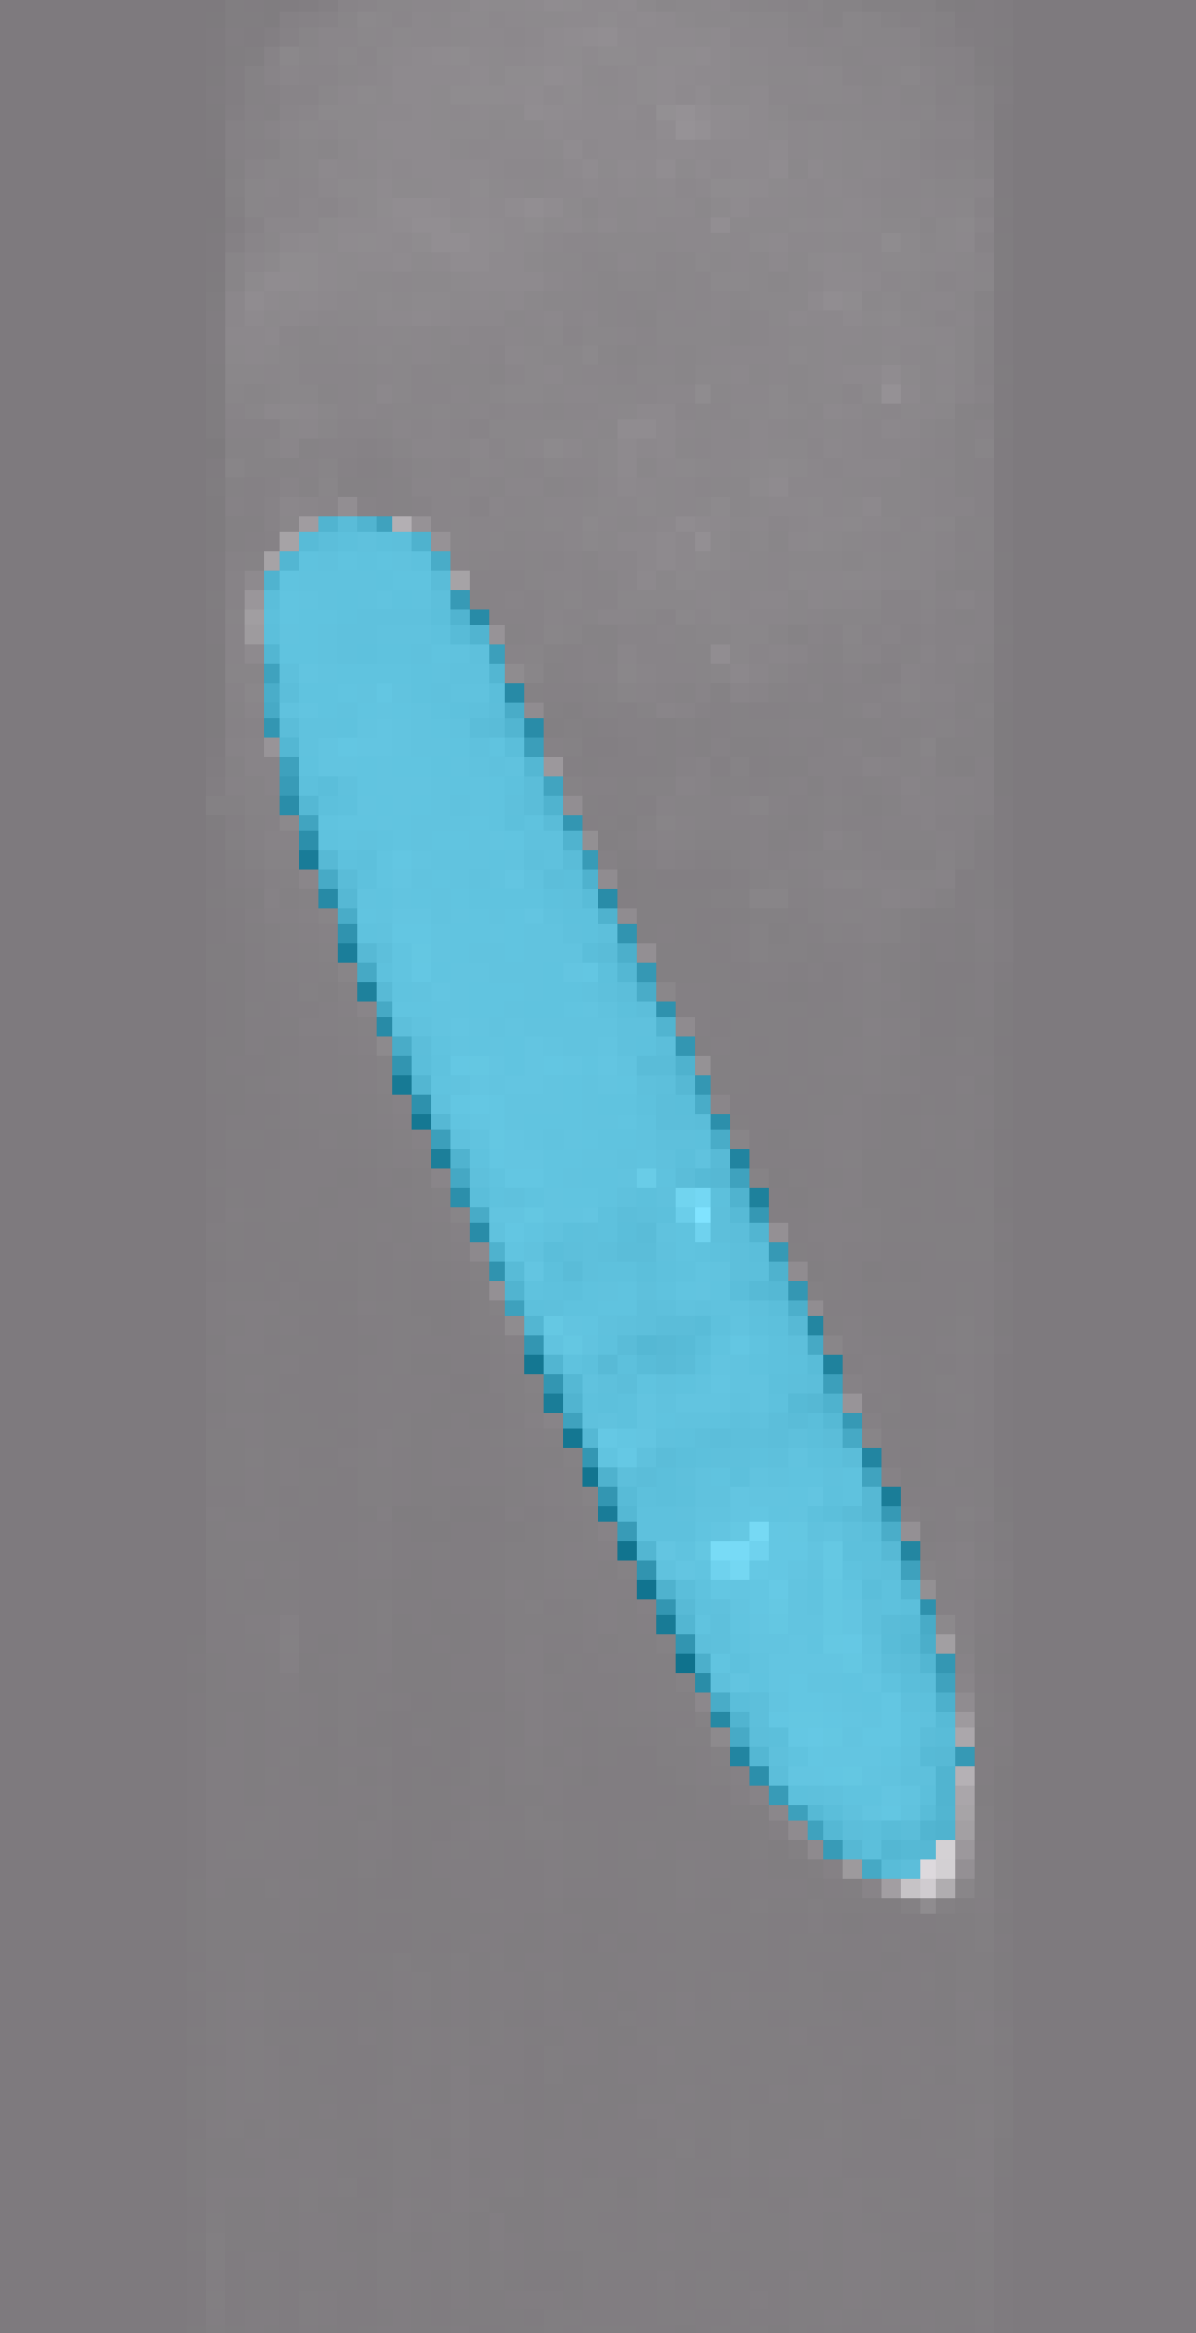
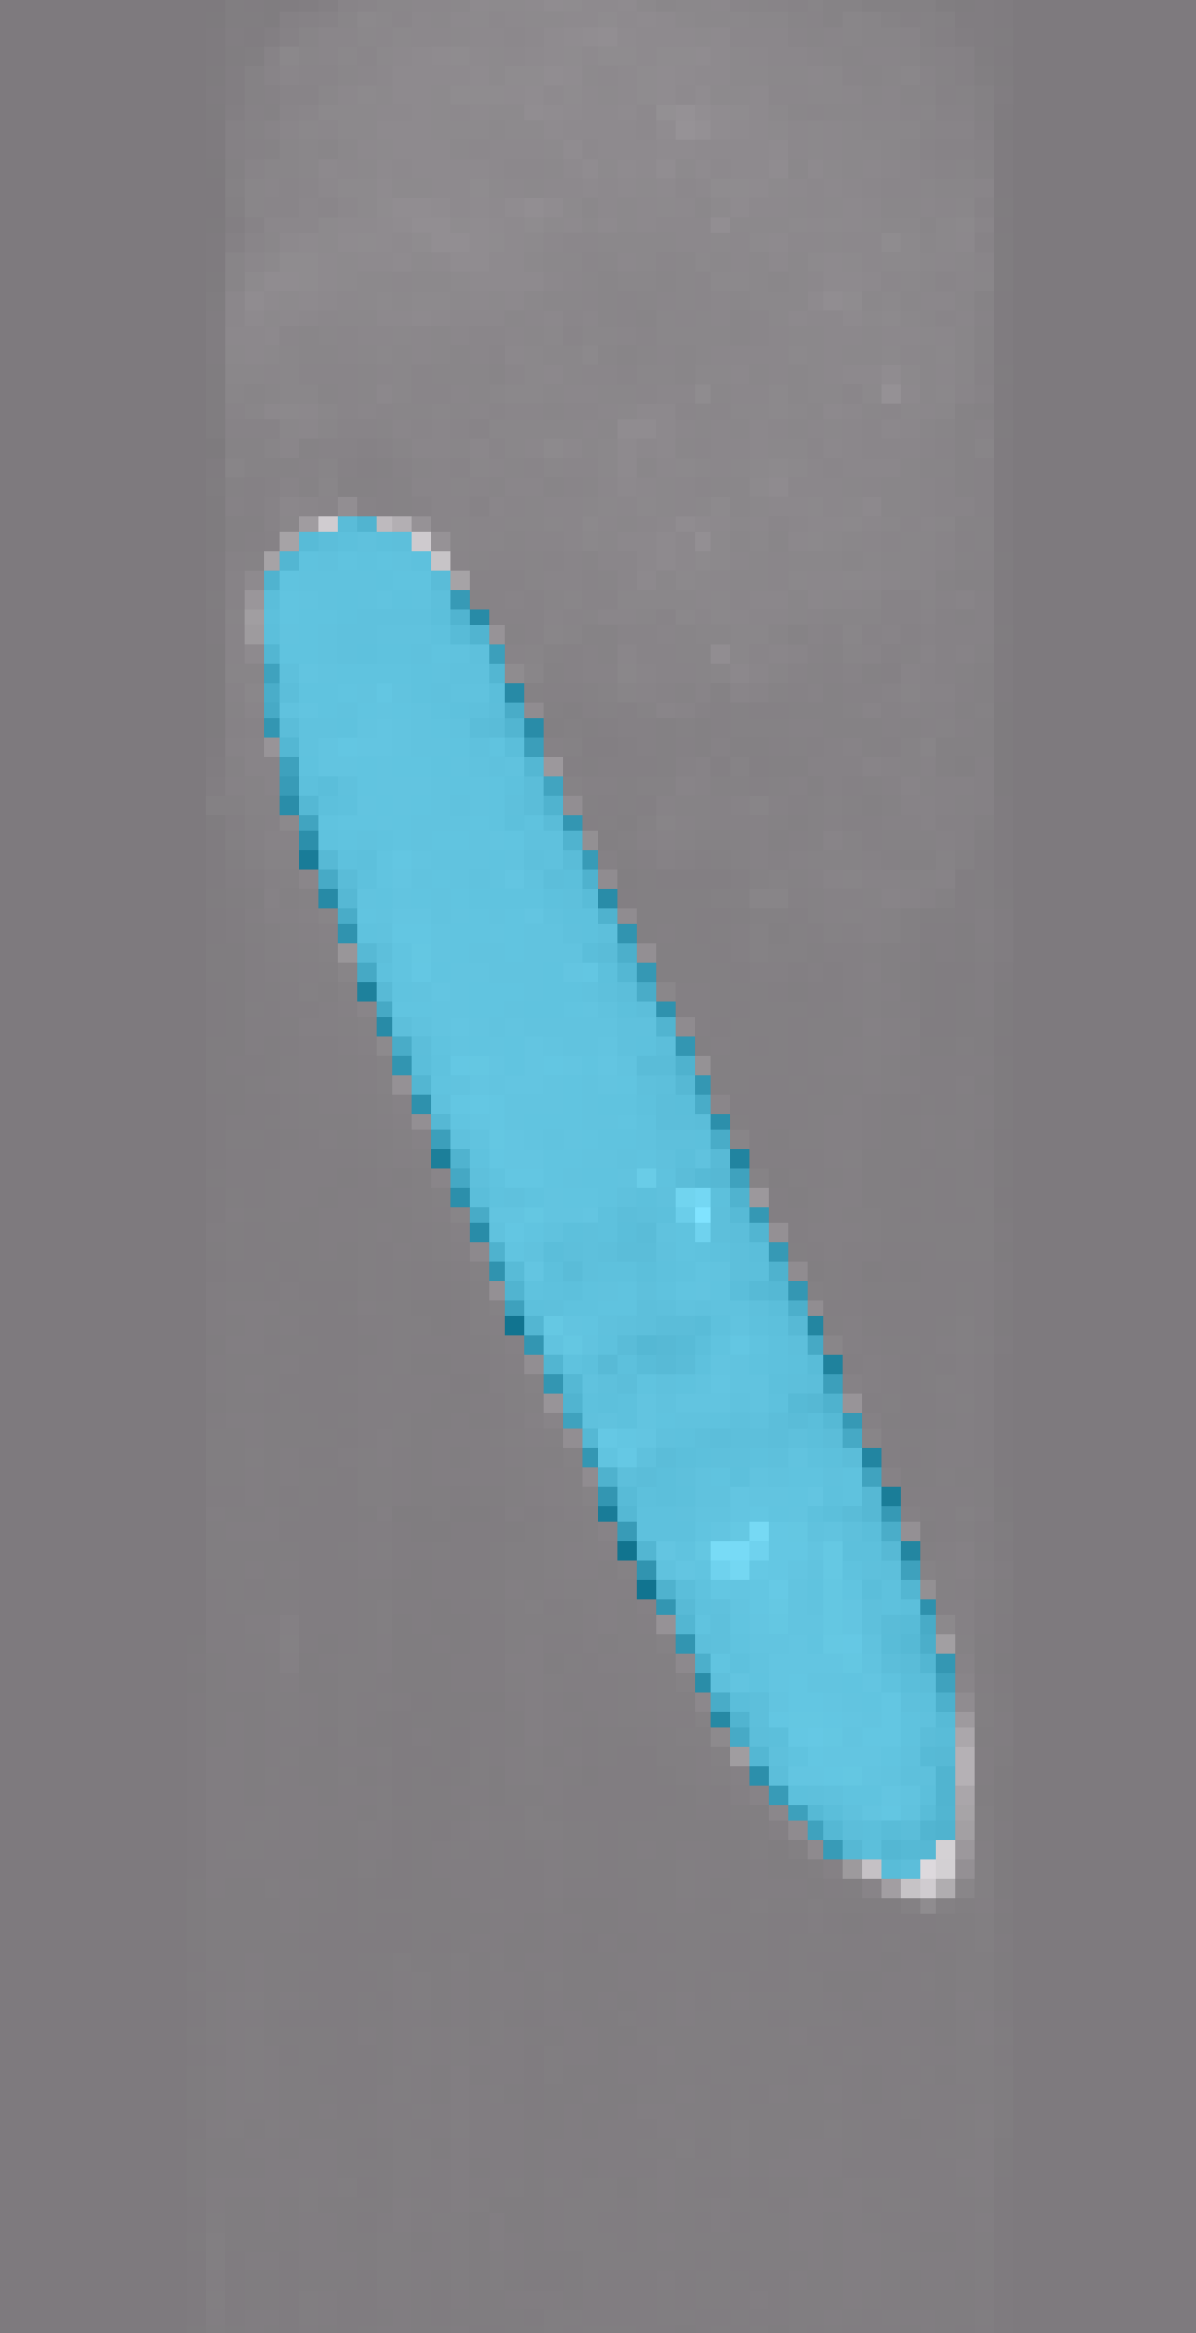
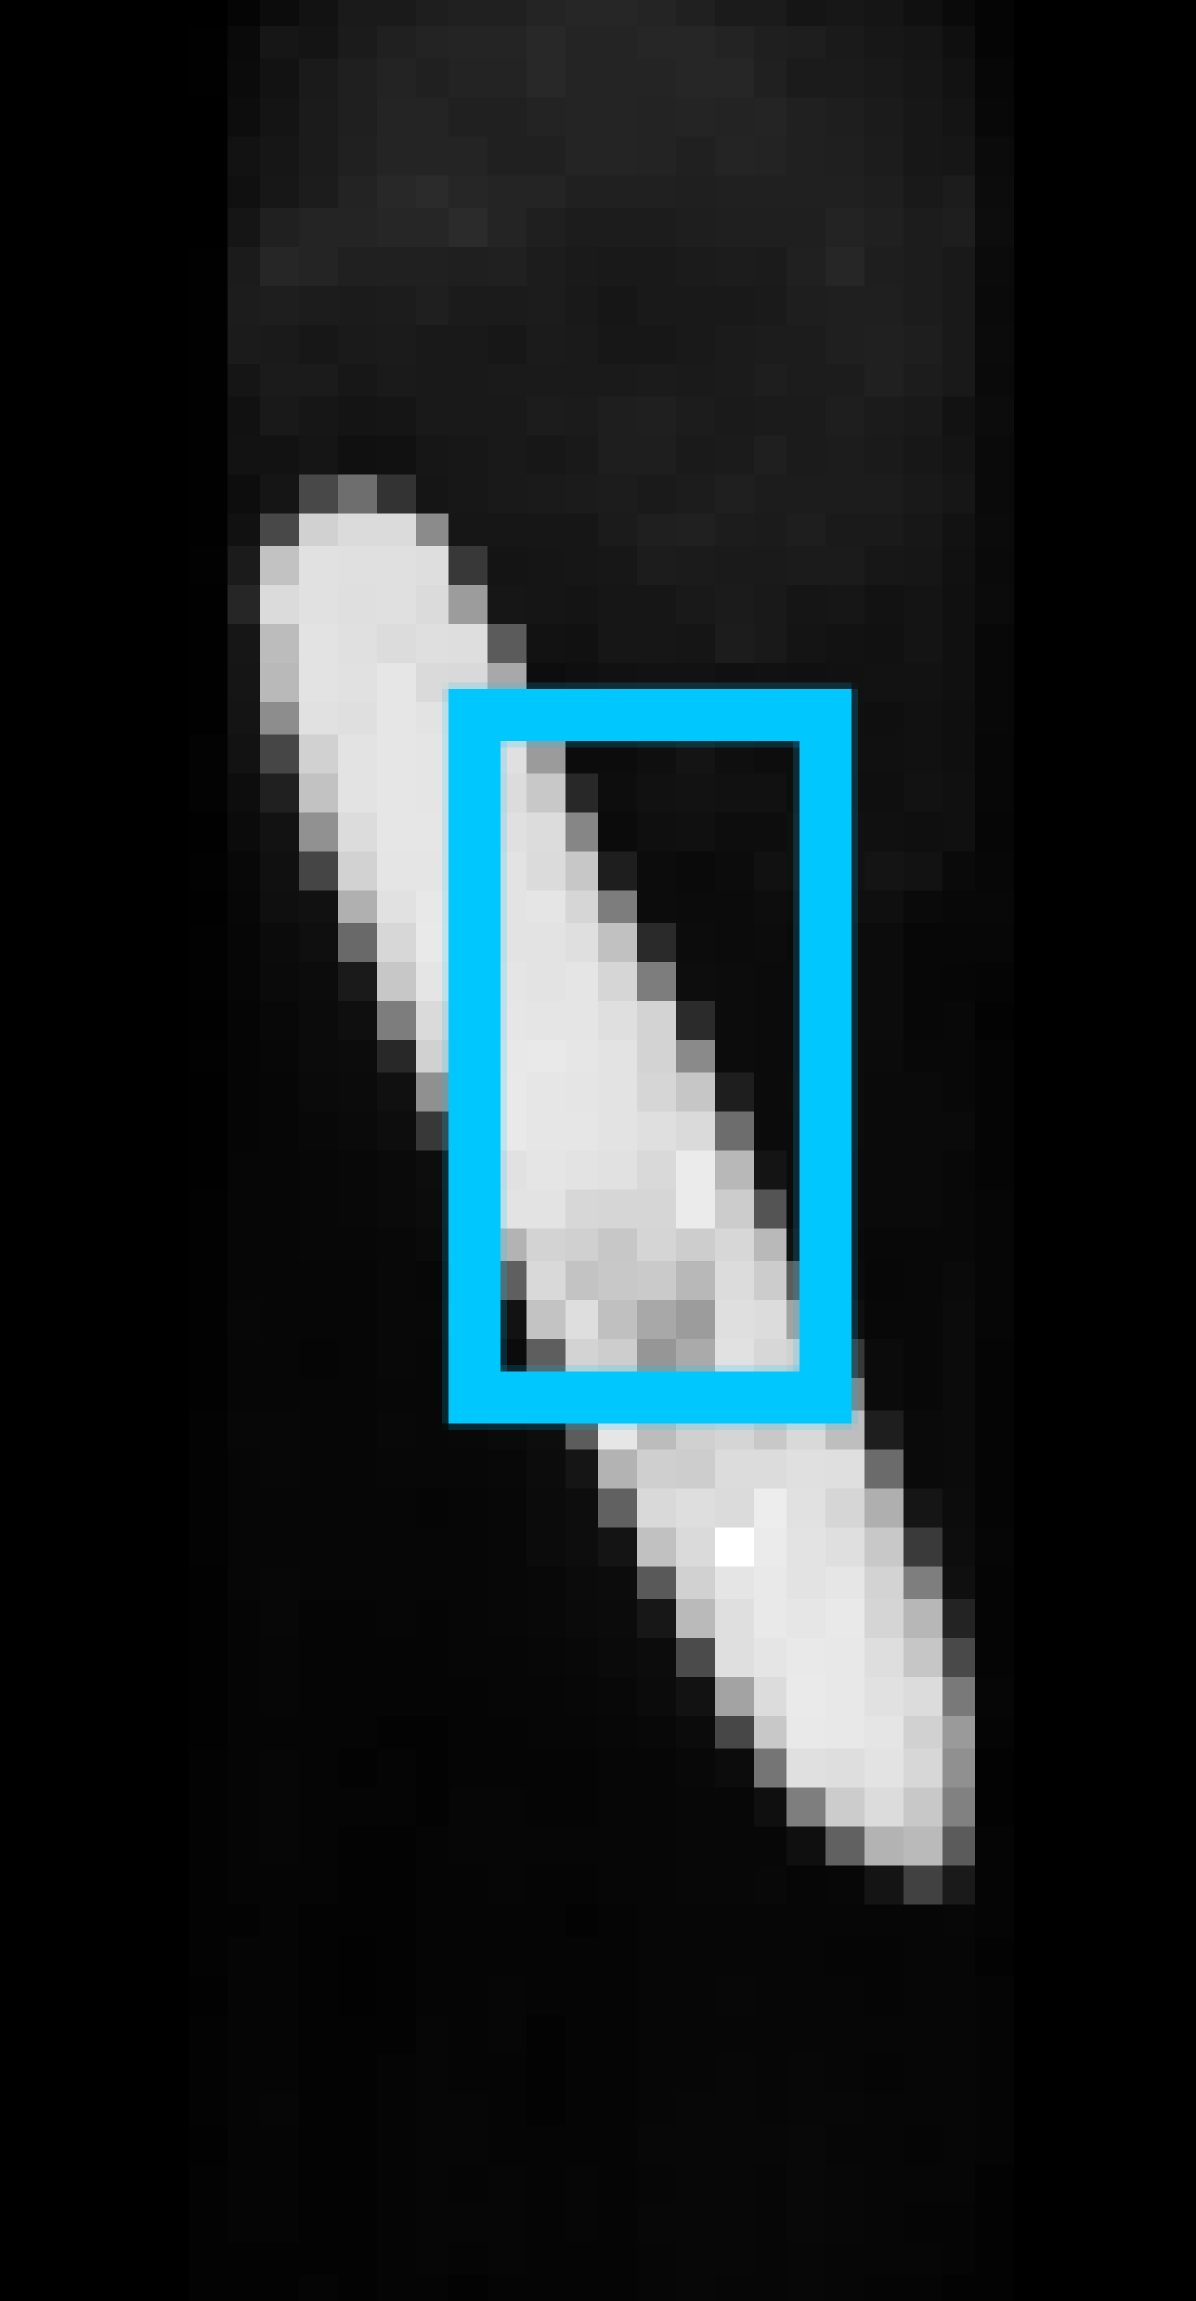
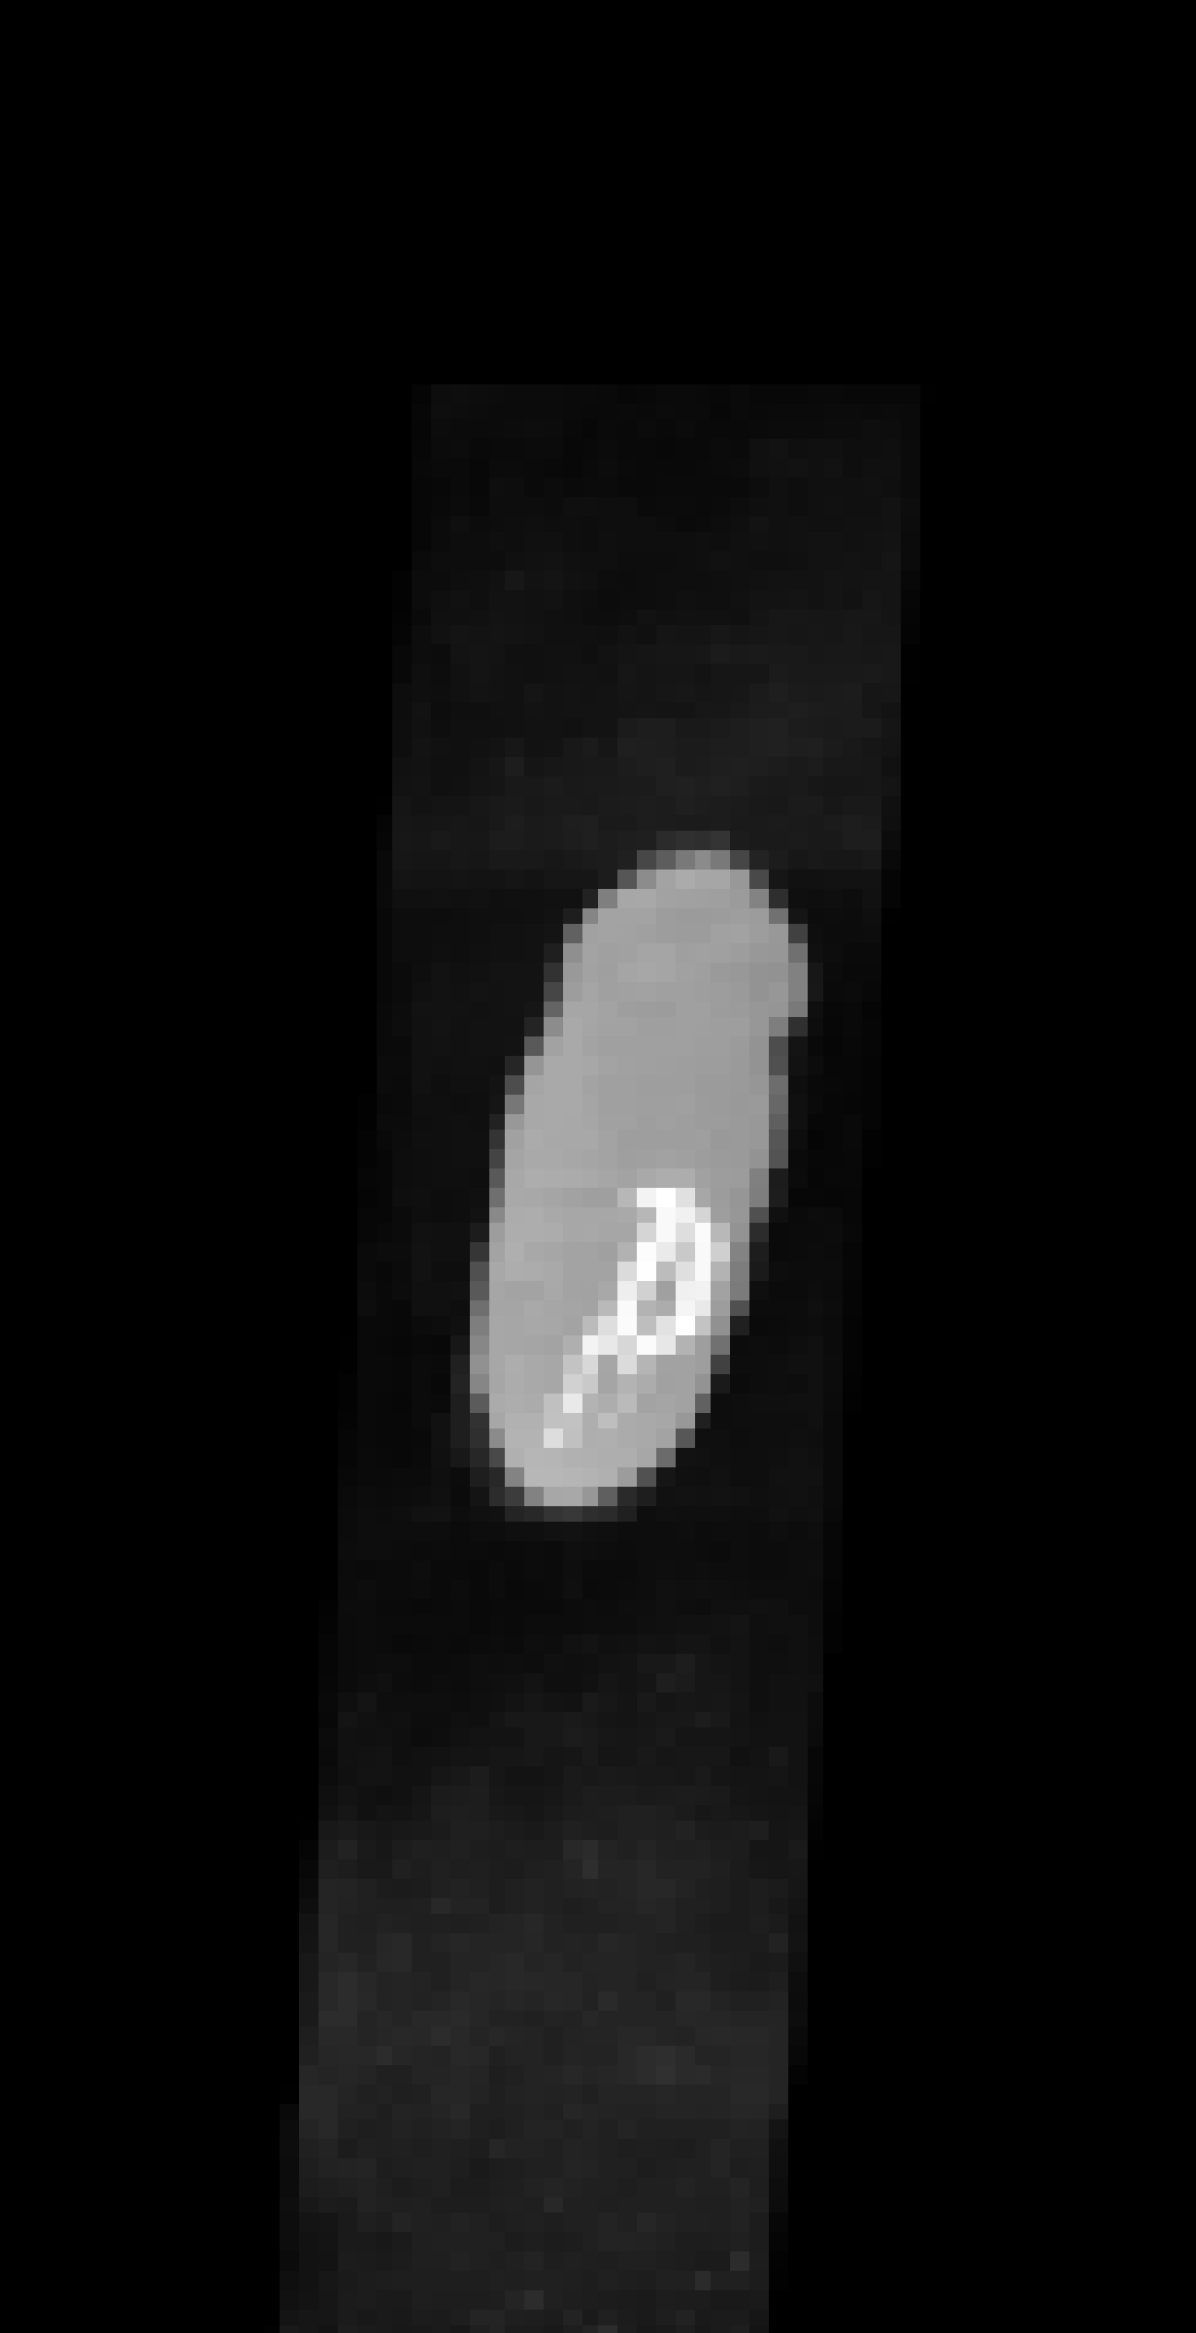
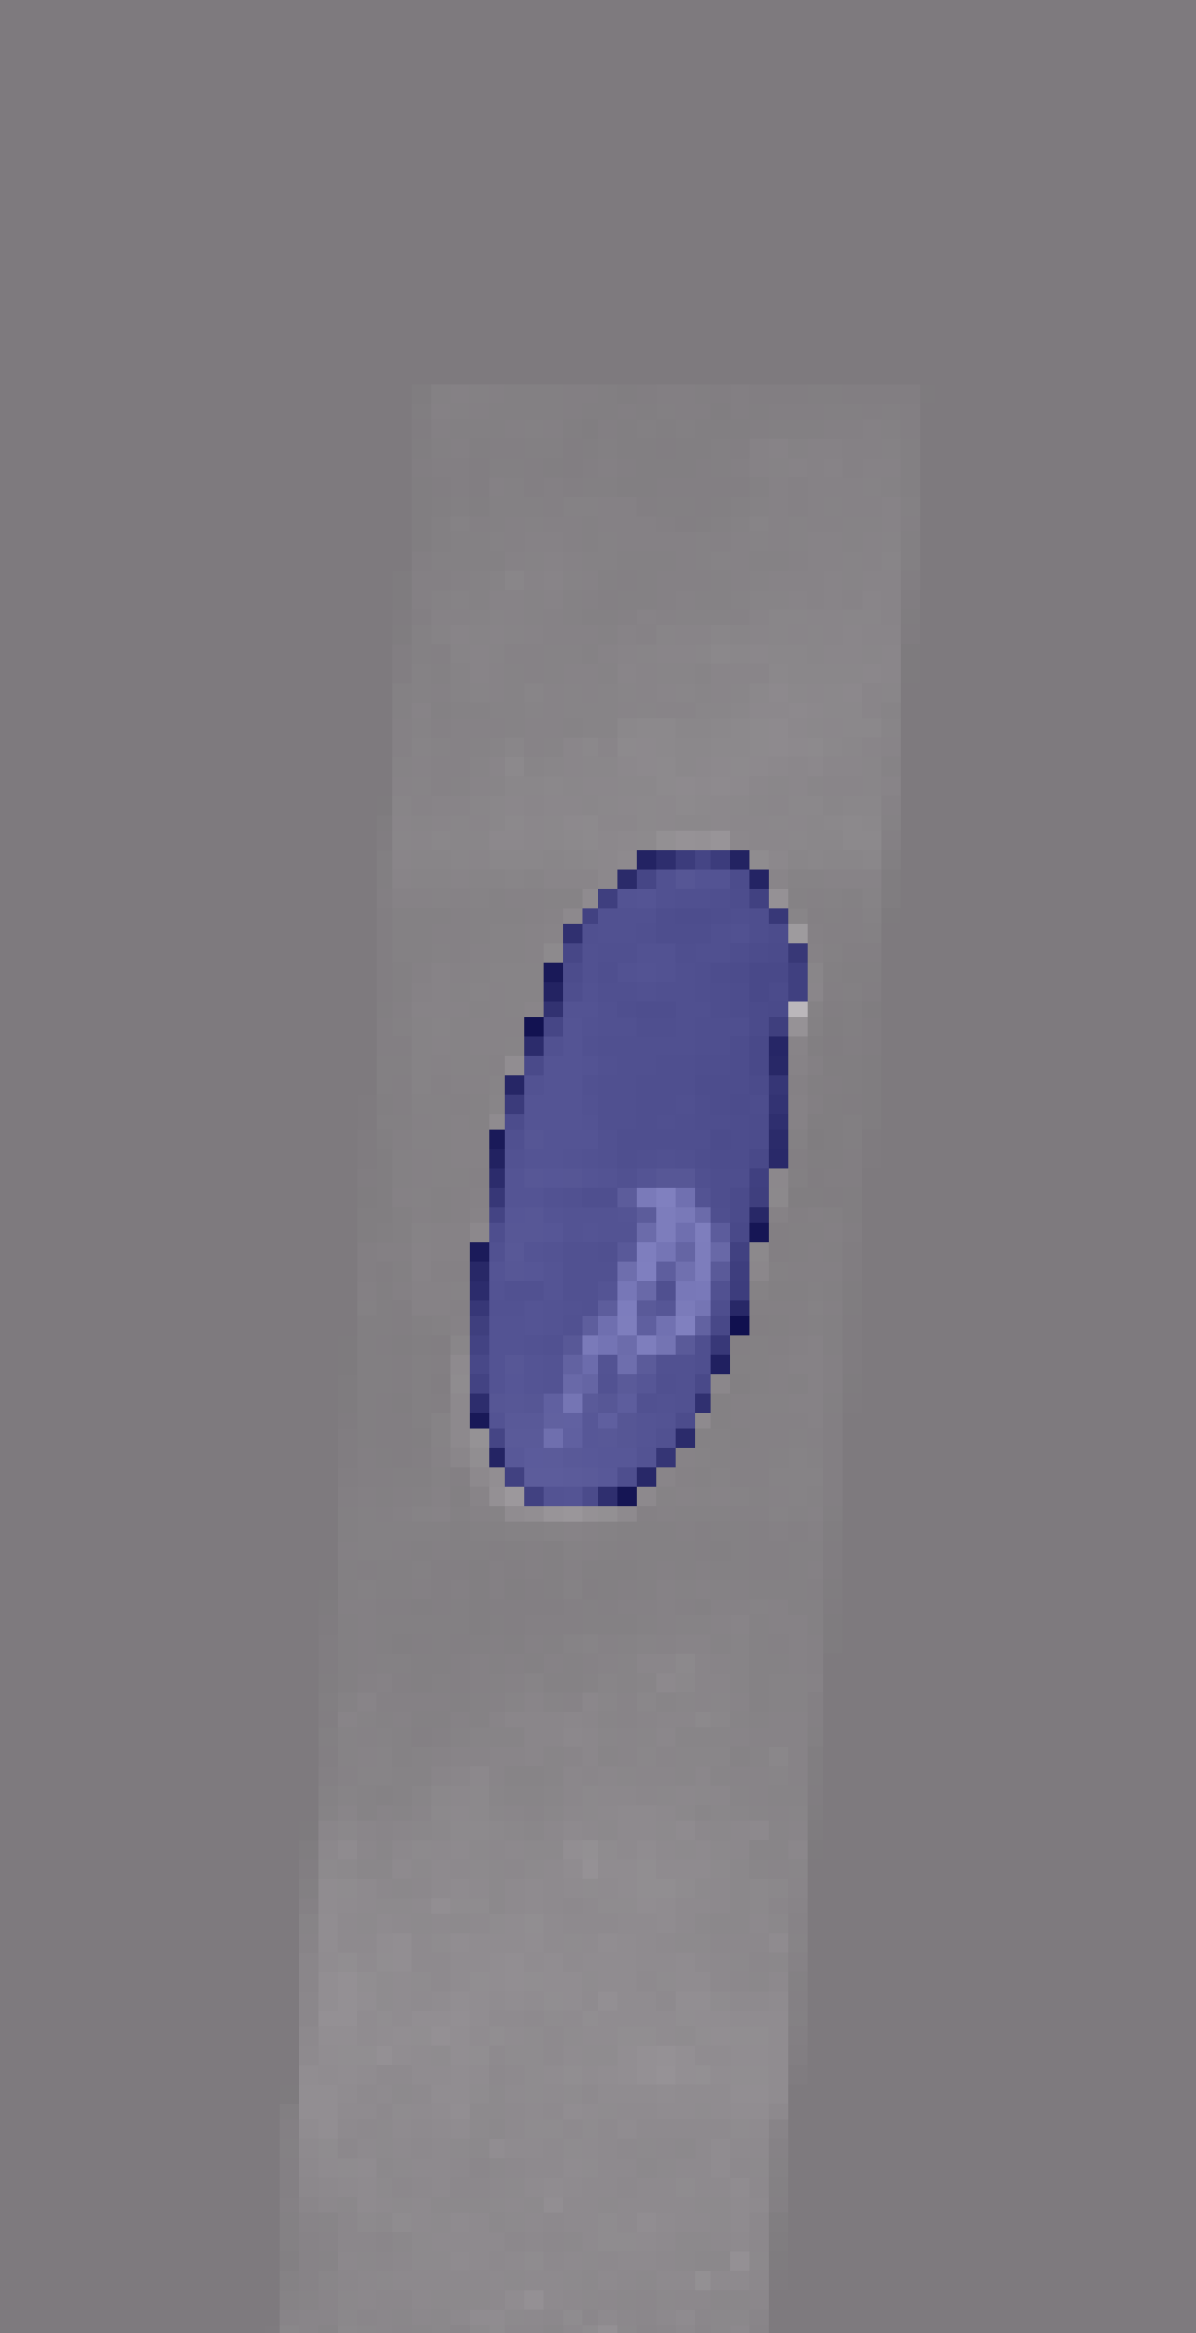
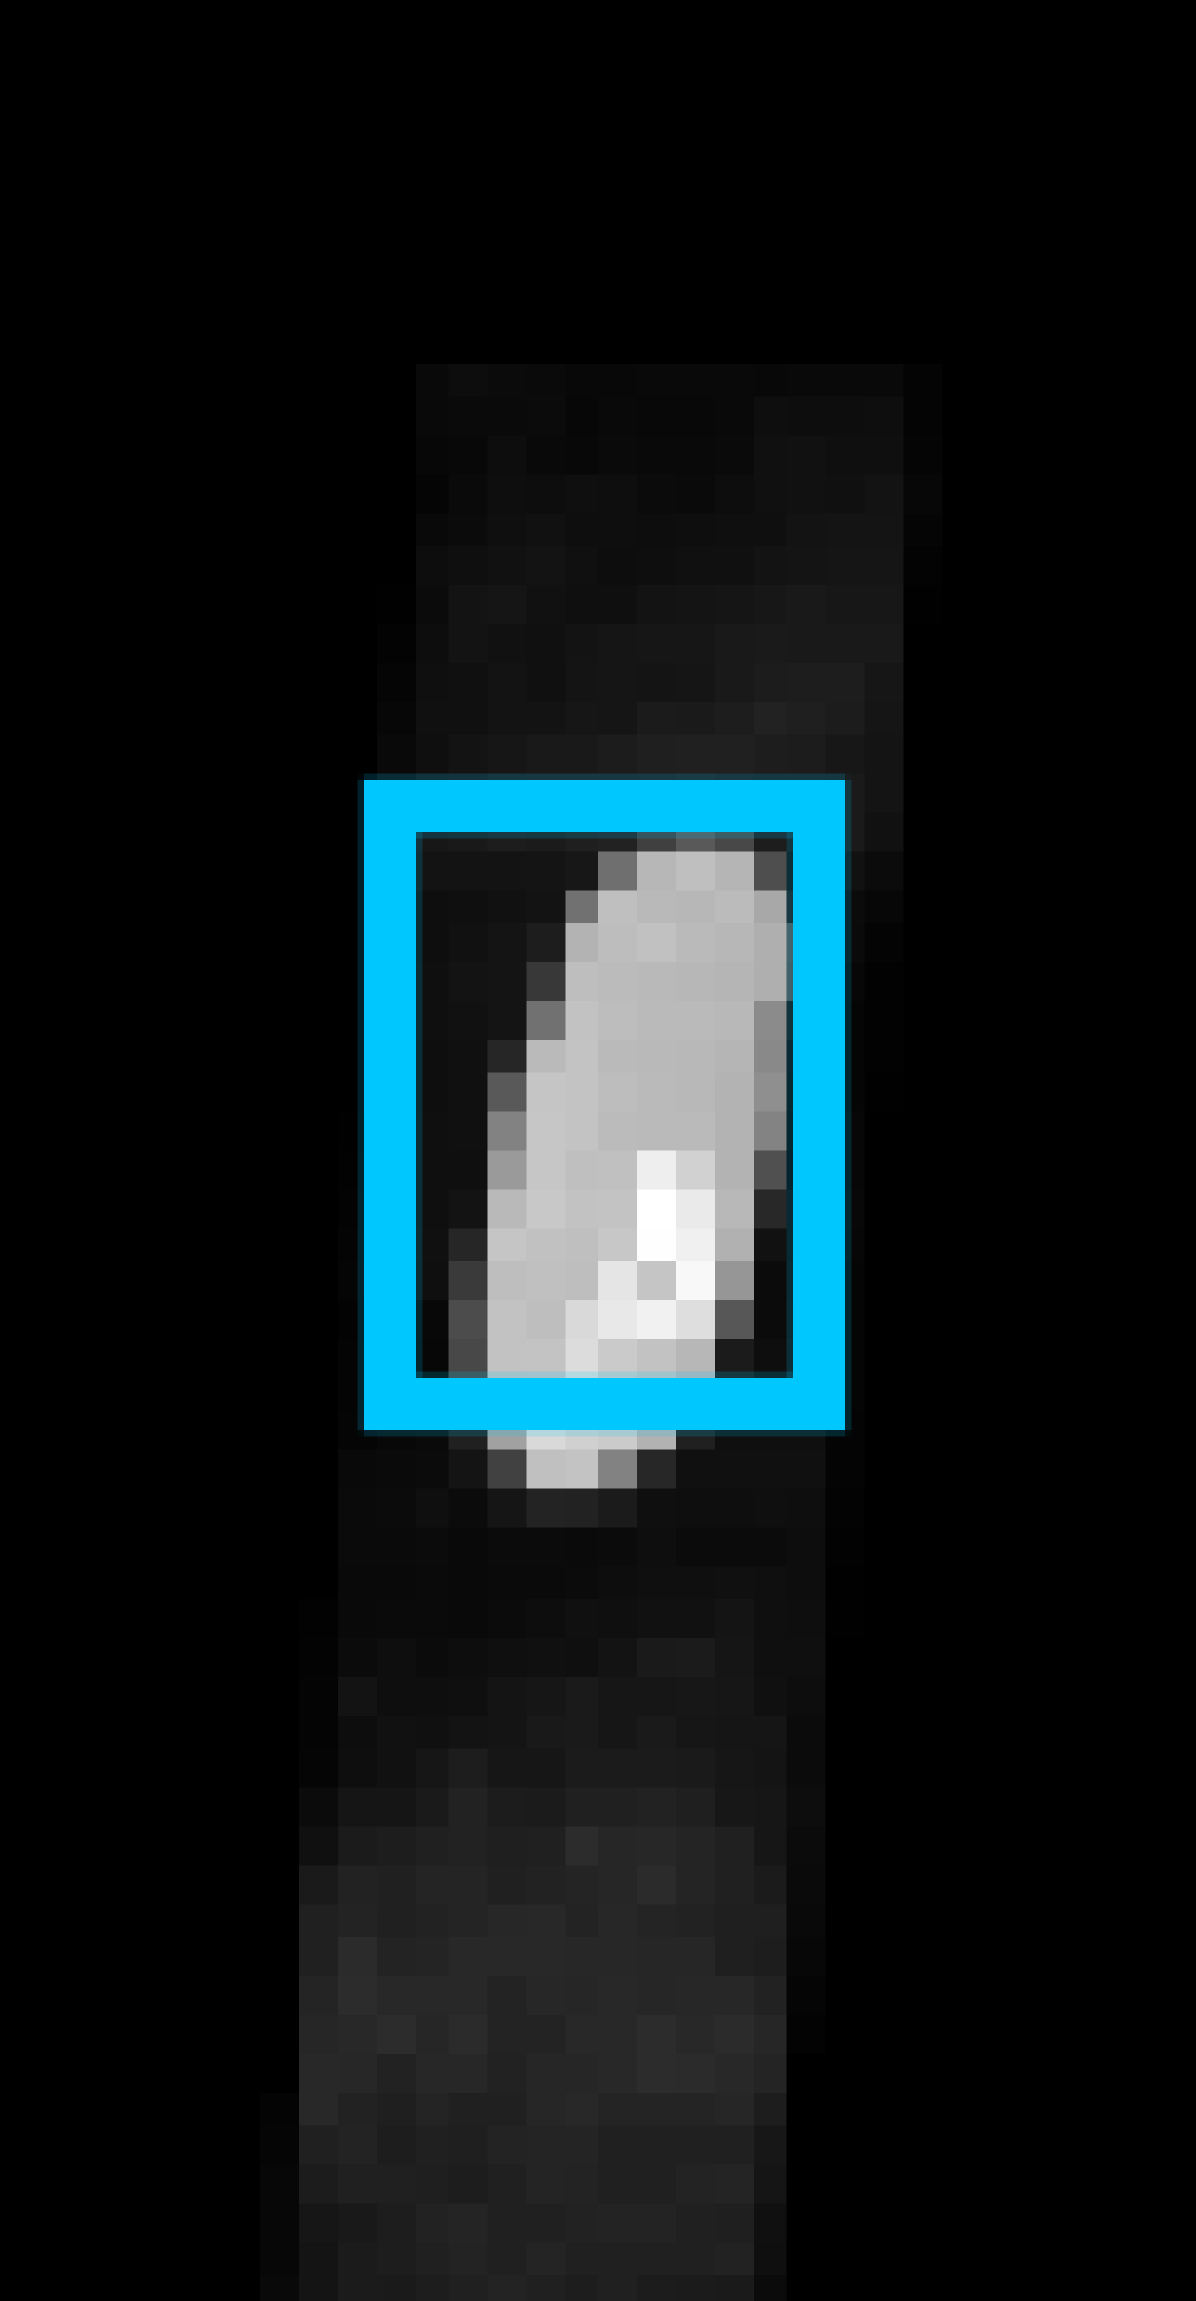
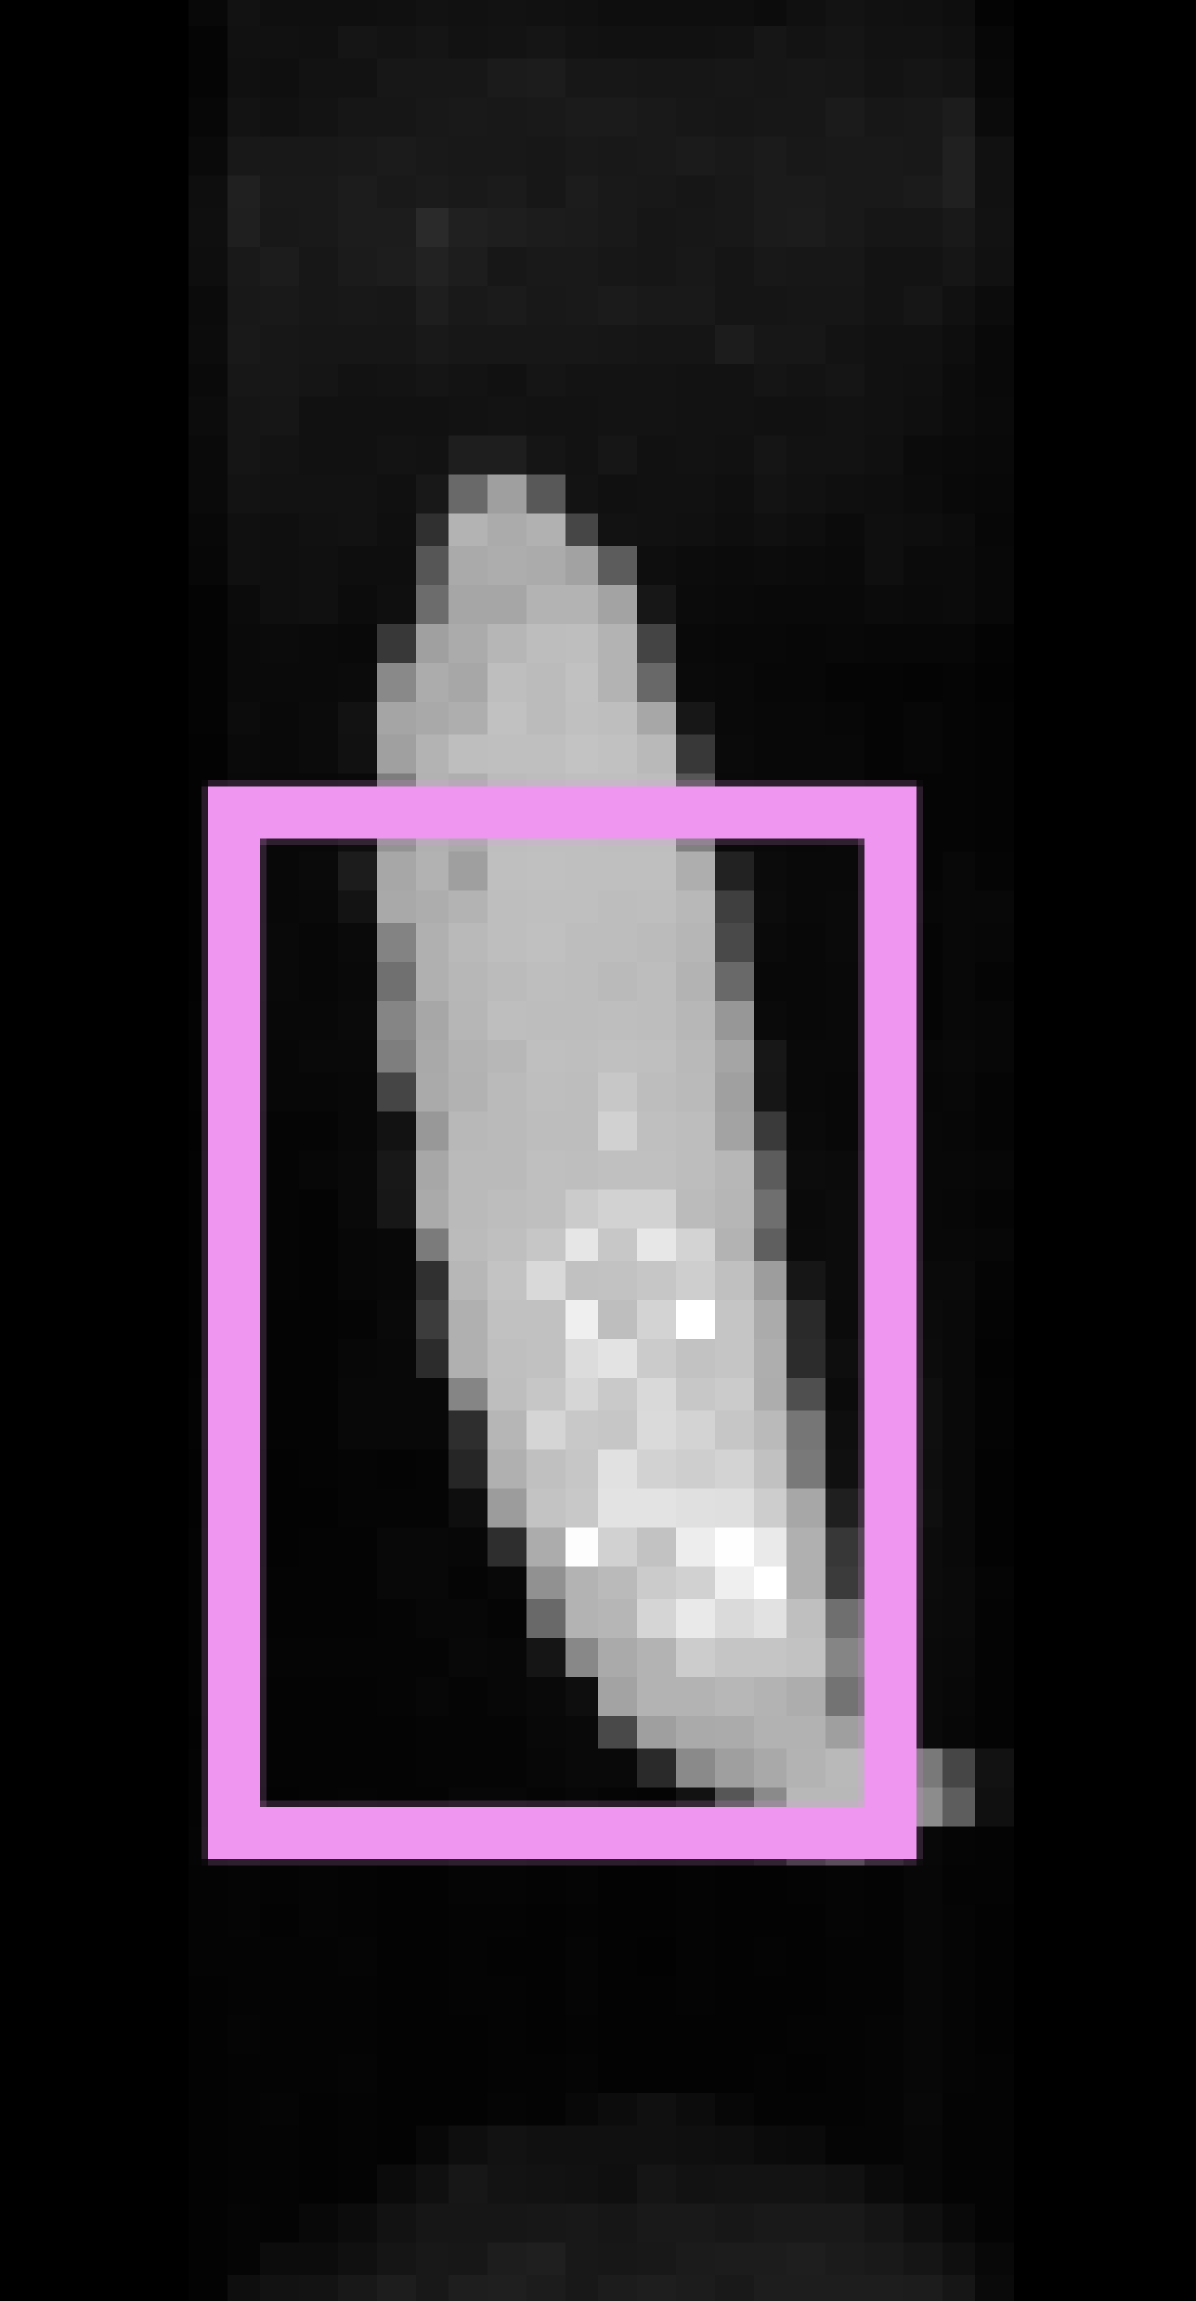
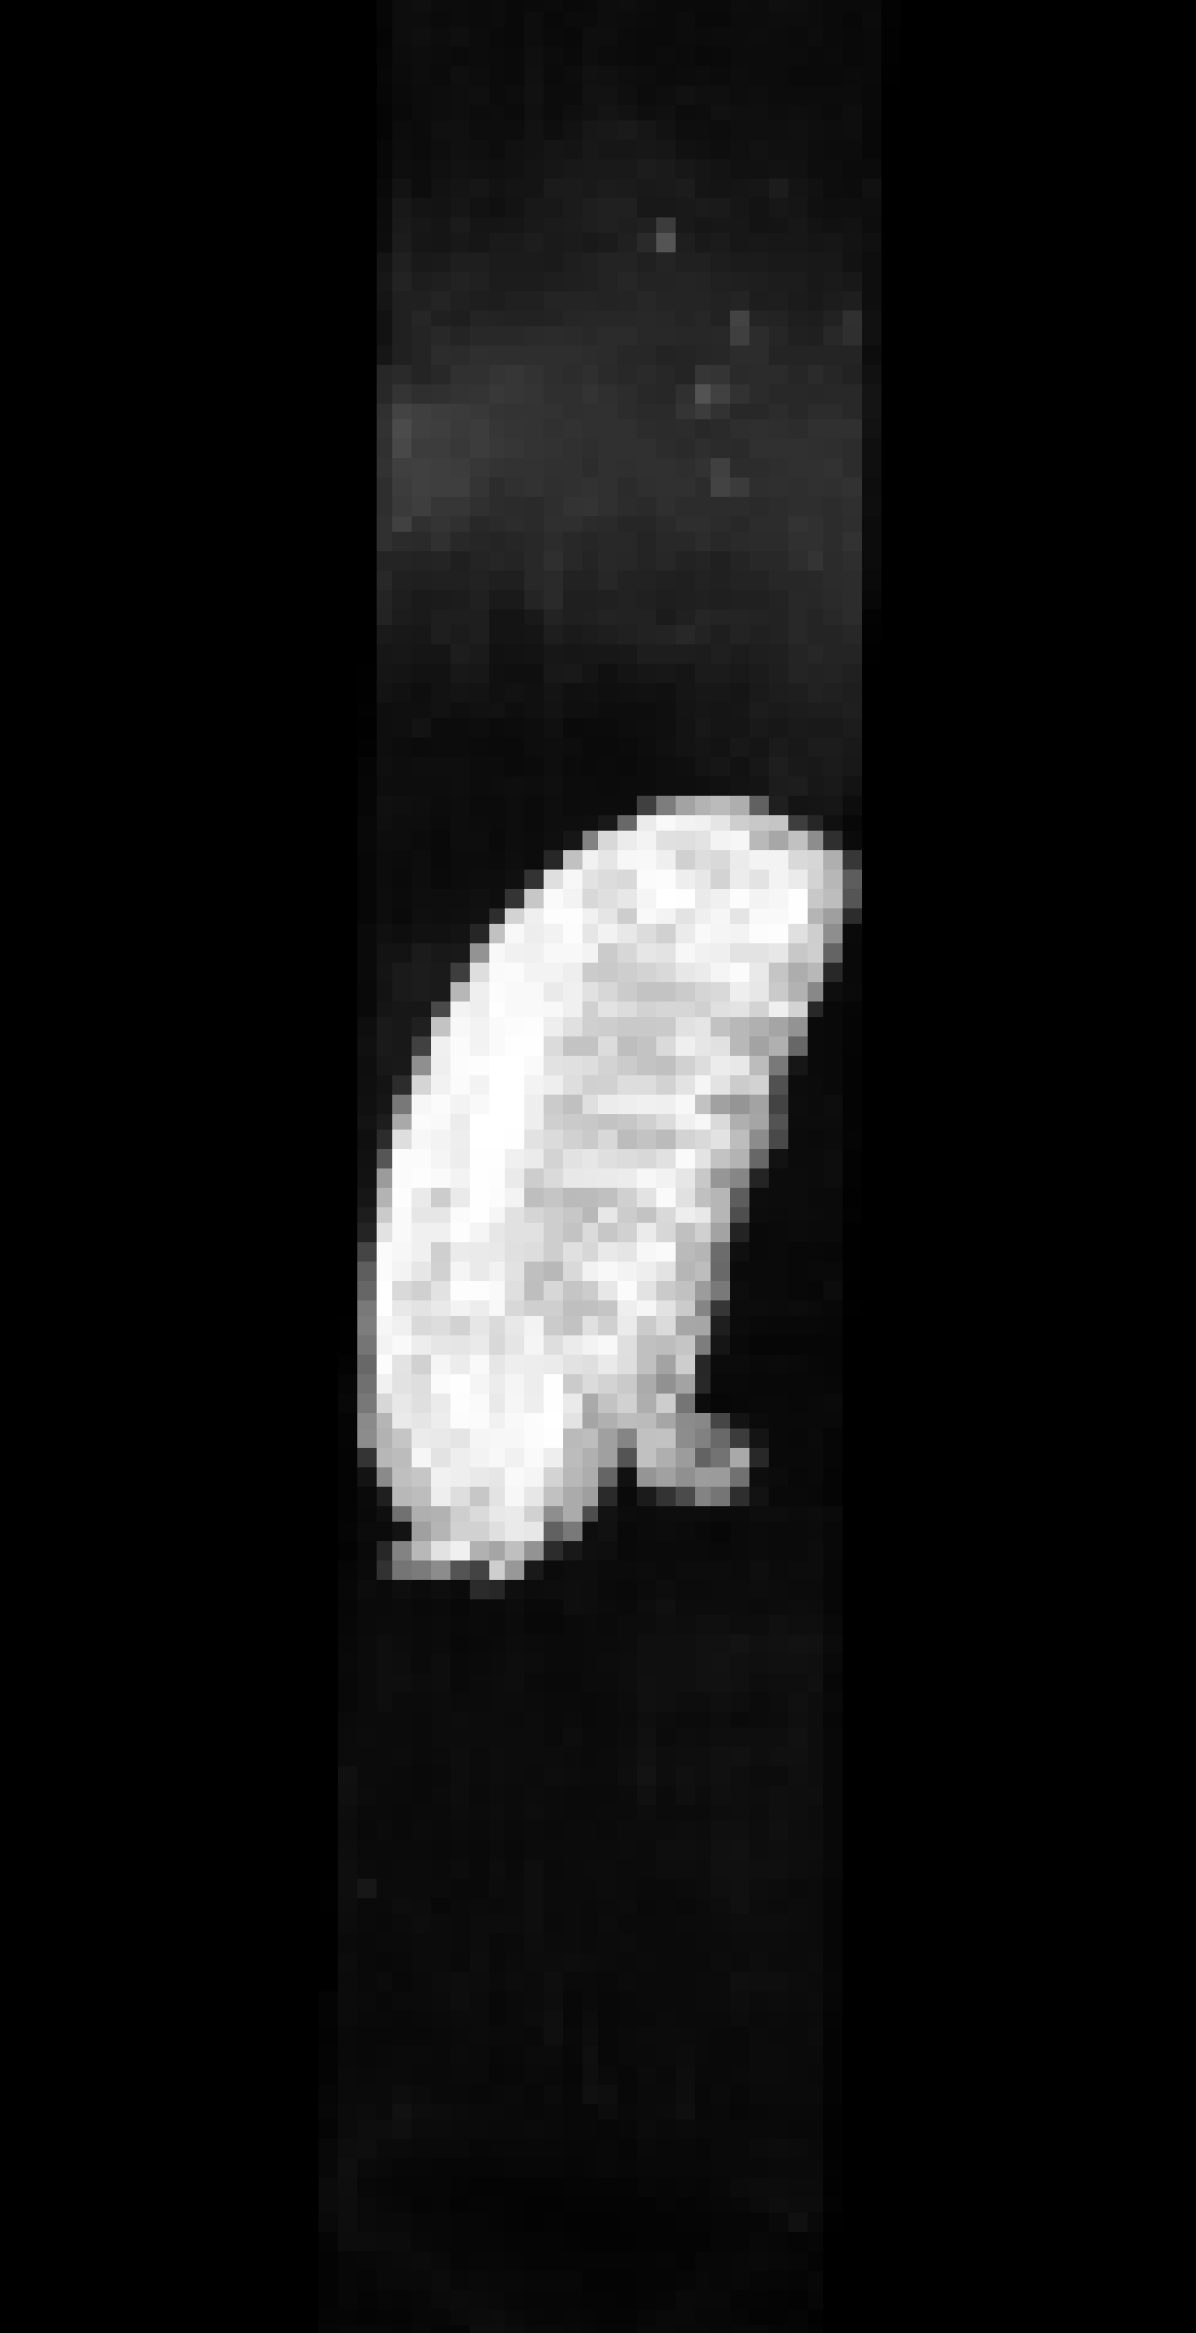
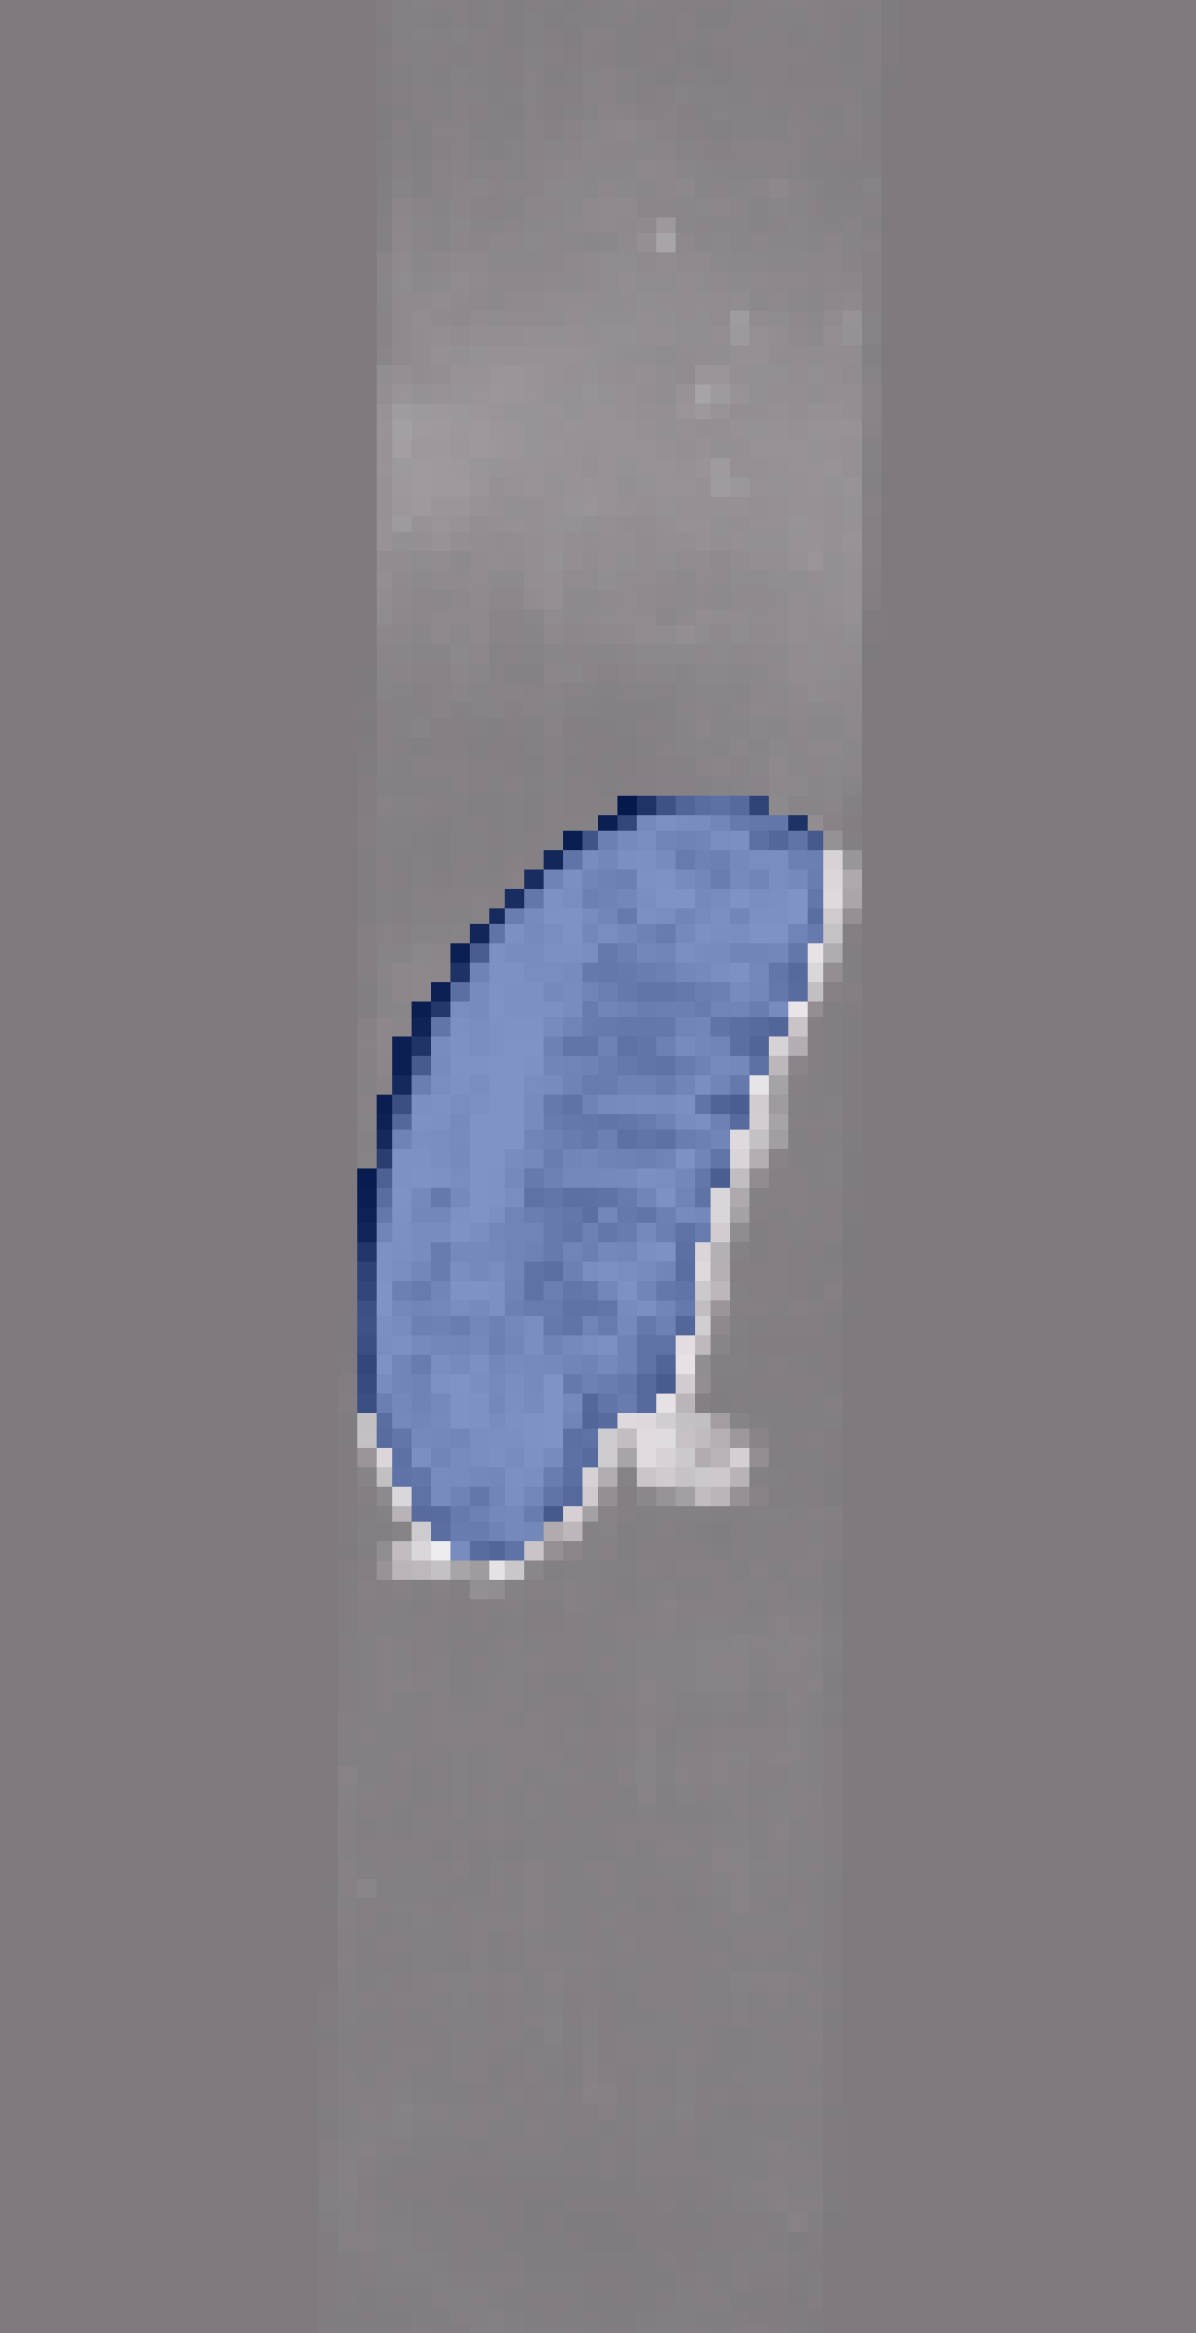
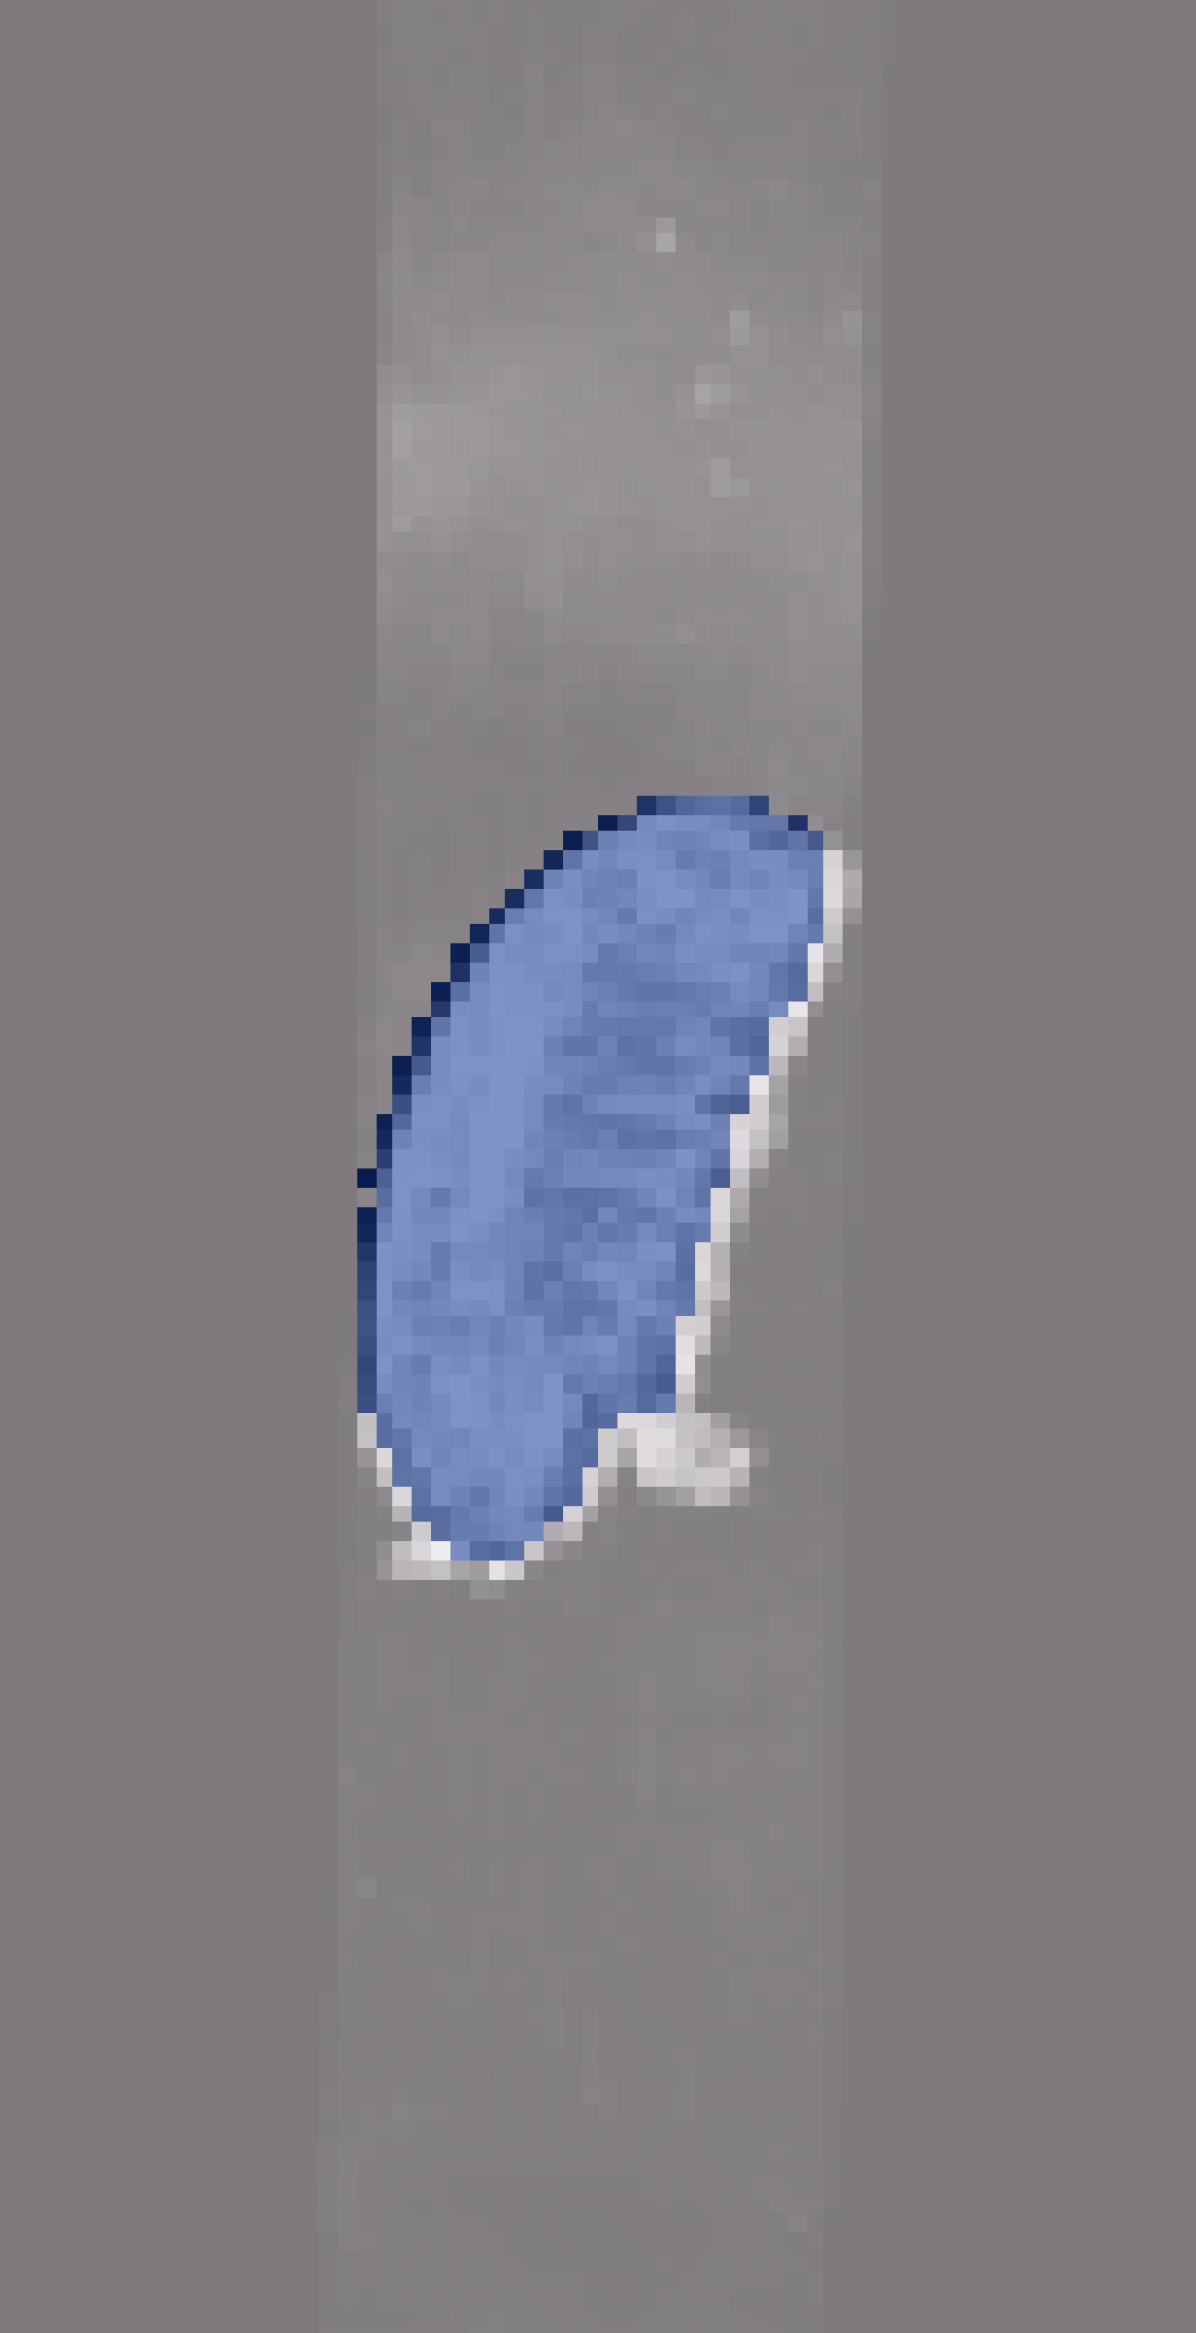
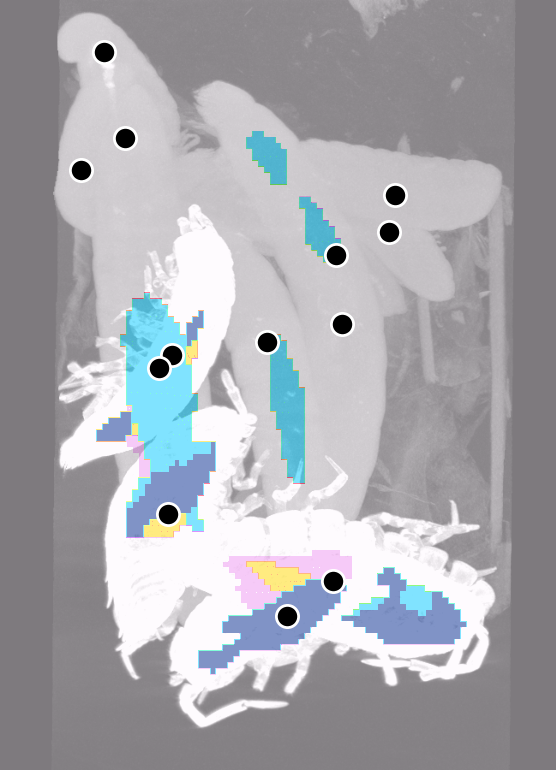
We show the performance of the detection methods in table 2, illustrate detection examples on the classification data in fig. 4, and show detection examples in fig. 5. U-Net outperforms nnDet for localizing the bugs in the mixtures but has is slightly worse when it comes to counting. Furthermore, nnDet has more misclassifications than the U-Net method, despite being good at localizing in the classification images.
| Model | Precision | Recall | Det-L1 | Count Err. |
|---|---|---|---|---|
| U-Net [9] | ||||
| nnDet [5] |


6 Discussion and Conclusion
Classification
When creating the BugNIST dataset, the initial idea was to make a lightweight dataset for 3D volumetric image classification to create interest in volumetric data outside the medical domain. Our aim is to promote the development of methods for volumetric data with a different appearance than typical clinical data. Non-medical data is becoming more frequent and has received less attention than volumetric data from medical scanners.
When planning the data acquisition, we wanted to make sure that the data spanned a wide variety of shapes with natural variation. Therefore, we chose to scan bugs, because their morphology is both varied and relatively complex, and they have good contrast and small details like legs and antennae. We also wanted to ensure that the dataset was sufficiently large to capture the complexity and variance of the chosen types of bugs, and therefore we settled on approximately 750 individuals of each type. We also wanted to utilize the capability of the µCT scanner to ensure that the specimens were imaged at a resolution that was high enough to capture the morphological details of the bugs, such as wings, legs, antennas, hairs, etc., but with a scan time that was not too long. Therefore, we settled with the described setup of scanning multiple bugs together and segmenting them out to individual volumes afterwards.
We classified the individual bugs at varying resolutions with various models, and in all cases, the number of correctly classified bugs was surprisingly high. It seems that the task is easier than we expected. Our initial suspicion was that the different-sized straws and orientation of the bugs were determining the classification. To counteract that, the bugs were aligned and rescaled to have approximately the same size. This did not influence the results much, and we still obtained high classification rates.
Taking a closer look at the chosen bug types, there are significant morphological differences between most bugs. The most similar bugs are the brown and black cricket, the mealworm and the buffalo beetle larvae, and the two types of fly pupae. This was, however, only apparent from the classification of the crickets, which has an accuracy of around 80%. From this, we can conclude that a classification challenge for volumetric data must be more fine-grained for current state-of-the-art classification models to be challenged.
Detection
To challenge the current deep learning models, we created a detection dataset. It is made up of volumes that contain mixtures of several bugs of the same or different species and are combined with other materials to ensure a variation in appearance. Here, the challenge is to determine how many bugs there are in a mixture and their location. But instead of training the model for detection and counting directly on the mixtures, the dataset is designed such that the models must be trained on the volumes of individual bugs and applied to the mixtures.
This shift in domain significantly increases how difficult the analysis problem is. Methods that can solve this problem will, however, also be applicable to solving a wider range of detection problems, where it is essential to learn the appearance of the features that characterize the individually scanned items. Furthermore, this task forces the model to learn different image features than what is needed for classifying the volumes of individually scanned bugs. In the classification problem, the bugs are placed in a volume with practically empty space around them. Here, the models can utilize the shape of the empty space as a feature for the classification. This is not possible in mixtures where several bugs are densely packed and mixed with material that is not present in the training data. Therefore, the detection model must focus on the appearance of the imaged bug and cannot rely on features of the surrounding space.
As an initial investigation for the detection problem, we have tested a multi-class segmentation using a U-Net [36, 9]. Since the individual bug scans are trivially segmented using a threshold and a little image smoothing, the basis for training a U-Net on these images can easily be obtained. Training a U-Net turned out to be significantly more difficult than training a classifier, which is not that surprising since the model must now make pixel-wise labeling using the 13 labels (12 bugs and a background label). We also attempted to use the U-Net to detect bugs in the mixtures. Here, we saw that the model could segment the bugs, but often the label was wrong, and we also ran into the problem of multiple bugs being segmented as one connected component, which was difficult to separate into individual bugs.
Employing the nnDetect [5] as an alternative to U-Net, we saw a decrease in performance. This model is not designed for the type of problem posed here with the built-in domain shift. Based on the results from the detection and counting problem, we can conclude that current state-of-the-art models cannot solve a detection problem that is set up the way that we propose.
Use of BugNIST
Our findings are quite surprising. We did not expect that the classification of 3D data would be so easy, and we did not expect the counting and detection of 3D data would be so difficult.
For a human, 3D volumes are typically difficult to handle. Whether you visualize them as slices, volume- or surface renderings, it requires much manual interaction and handling to get a complete understanding. This is not the case for a 3D deep learning-based classifier that can utilize the full 3D information. The complexity of the individual bug scans is therefore much less than one would expect, meaning that the variation within a class is much smaller than between classes, which is demonstrated by the high classification rates obtained for a range of standard methods.
From the observation of how easy classifying 12 species of bugs is, we expect that more fine-grained classification of volumetric data can also be solved. By more fine-grained, we mean specimens that have high similarity but still belong to different classes. Fine-grained classification would also entail more classes with fewer training samples from each class than we have recorded in the BugNIST dataset. This will, however, require that objects can be scanned as individual specimens, which is possible for objects like bugs.
The most common situation, however, is that you need to detect objects in 3D volumes with other materials. In these cases, it can be a great advantage to have models that can learn to focus on the object of interest and ignore the other materials, like we have set up the challenge for the mixtures in the BugNIST dataset. Other datasets do not pose the detection challenge this way. In other volumetric datasets, the detection is learned in the same domain. The objects of interest are annotated in volumes and the task is to detect objects with the appearance of the context where they are placed. Therefore, the detection models will have both the object’s appearance and its context as input for learning the detection. Separating the two will ensure that the detection model learns the appearance of the object. As we have shown, this is surprisingly difficult, but with BugNIST it is now possible to start investigating and developing models that can handle this challenge.
BugNIST is an extensive dataset that can have other valuable use cases than what we have explored in this paper. It could be used for exploring segmentation methods, generative models, or image registration. The fact that we have scanned many specimens of each species also makes it possible to investigate methods for analyzing the morphological variation of the scanned bugs. Despite the limited scientific interest of the scanned bugs, the methodological developments can be significant. There might be many other uses, that add to the value of the BugNIST dataset.
Conclusion
Creating the BugNIST dataset and investigating its use for classification and detection has given important insights that set the direction for future research. Current state-of-the-art methods are able to classify 3D volumes of individual objects to a high degree of precision, and the expected methodological improvements for classification models that can be obtained from BugNIST will be marginal. This shows that there is a need for a fine-grained volumetric classification dataset. We also find that object detection in volumetric data is much more difficult than classification. This is especially the case when posing the detection problem as we have done in the BugNIST dataset, where there is a set of individually scanned bugs for training the detector and another set of mixed volumes for detecting the bugs. This illustrates that for volumetric image analysis, there are still many unsolved problems and a great need for standard benchmark data for promoting this research. BugNIST is a dataset, that fills out some of this gap and hereby promotes research in deep learning-based methods for 3D volumetric images.
References
- Afshar et al. [2021] P. Afshar, S. Heidarian, N. Enshaei, F. Naderkhani, M. J. Rafiee, A. Oikonomou, F. B. Fard, K. Samimi, K. N. Plataniotis, and A. Mohammadi. Covid-ct-md, covid-19 computed tomography scan dataset applicable in machine learning and deep learning. Scientific Data, 8(1):121, 2021.
- Antonelli et al. [2022] M. Antonelli, A. Reinke, S. Bakas, K. Farahani, A. Kopp-Schneider, B. A. Landman, G. Litjens, B. Menze, O. Ronneberger, R. M. Summers, et al. The medical segmentation decathlon. Nature communications, 13(1):4128, 2022.
- Armato III et al. [2011] S. G. Armato III, G. McLennan, L. Bidaut, M. F. McNitt-Gray, C. R. Meyer, A. P. Reeves, B. Zhao, D. R. Aberle, C. I. Henschke, E. A. Hoffman, et al. The lung image database consortium (lidc) and image database resource initiative (idri): a completed reference database of lung nodules on ct scans. Medical physics, 38(2):915–931, 2011.
- Armato III et al. [2018] S. G. Armato III, H. Huisman, K. Drukker, L. Hadjiiski, J. S. Kirby, N. Petrick, G. Redmond, M. L. Giger, K. Cha, A. Mamonov, et al. Prostatex challenges for computerized classification of prostate lesions from multiparametric magnetic resonance images. Journal of Medical Imaging, 5(4):044501–044501, 2018.
- Baumgartner et al. [2021] M. Baumgartner, P. F. Jäger, F. Isensee, and K. H. Maier-Hein. nndetection: a self-configuring method for medical object detection. In Medical Image Computing and Computer Assisted Intervention–MICCAI 2021: 24th International Conference, Strasbourg, France, September 27–October 1, 2021, Proceedings, Part V 24, pages 530–539. Springer, 2021.
- Cardoso et al. [2022] M. J. Cardoso, W. Li, R. Brown, N. Ma, E. Kerfoot, Y. Wang, B. Murrey, A. Myronenko, C. Zhao, D. Yang, et al. Monai: An open-source framework for deep learning in healthcare. arXiv preprint arXiv:2211.02701, 2022.
- Chaudhary et al. [2021] S. Chaudhary, S. Sadbhawna, V. Jakhetiya, B. N. Subudhi, U. Baid, and S. C. Guntuku. Detecting covid-19 and community acquired pneumonia using chest ct scan images with deep learning. In ICASSP 2021-2021 IEEE International Conference on Acoustics, Speech and Signal Processing (ICASSP), pages 8583–8587. IEEE, 2021.
- Cheng et al. [2017] D. Cheng, M. Liu, J. Fu, and Y. Wang. Classification of mr brain images by combination of multi-cnns for ad diagnosis. In Ninth international conference on digital image processing (ICDIP 2017), volume 10420, pages 875–879. SPIE, 2017.
- Çiçek et al. [2016] Ö. Çiçek, A. Abdulkadir, S. S. Lienkamp, T. Brox, and O. Ronneberger. 3d u-net: learning dense volumetric segmentation from sparse annotation. In Medical Image Computing and Computer-Assisted Intervention–MICCAI 2016: 19th International Conference, Athens, Greece, October 17-21, 2016, Proceedings, Part II 19, pages 424–432. Springer, 2016.
- Dosovitskiy et al. [2021] A. Dosovitskiy, L. Beyer, A. Kolesnikov, D. Weissenborn, X. Zhai, T. Unterthiner, M. Dehghani, M. Minderer, G. Heigold, S. Gelly, J. Uszkoreit, and N. Houlsby. An image is worth 16x16 words: Transformers for image recognition at scale. In International Conference on Learning Representations, 2021.
- Flitton et al. [2015] G. Flitton, A. Mouton, and T. P. Breckon. Object classification in 3d baggage security computed tomography imagery using visual codebooks. Pattern Recognition, 48(8):2489–2499, 2015.
- Girshick [2015] R. Girshick. Fast r-cnn. In Proceedings of the IEEE international conference on computer vision, pages 1440–1448, 2015.
- Girshick et al. [2014] R. Girshick, J. Donahue, T. Darrell, and J. Malik. Rich feature hierarchies for accurate object detection and semantic segmentation. In Proceedings of the IEEE conference on computer vision and pattern recognition, pages 580–587, 2014.
- Harmon et al. [2020] S. A. Harmon, T. H. Sanford, S. Xu, E. B. Turkbey, H. Roth, Z. Xu, D. Yang, A. Myronenko, V. Anderson, A. Amalou, et al. Artificial intelligence for the detection of covid-19 pneumonia on chest ct using multinational datasets. Nature communications, 11(1):4080, 2020.
- He et al. [2016] K. He, X. Zhang, S. Ren, and J. Sun. Deep residual learning for image recognition. In Proceedings of the IEEE conference on computer vision and pattern recognition, pages 770–778, 2016.
- Hu et al. [2018] J. Hu, L. Shen, and G. Sun. Squeeze-and-excitation networks. In Proceedings of the IEEE conference on computer vision and pattern recognition, pages 7132–7141, 2018.
- Huang et al. [2017] G. Huang, Z. Liu, L. Van Der Maaten, and K. Q. Weinberger. Densely connected convolutional networks. In Proceedings of the IEEE conference on computer vision and pattern recognition, pages 4700–4708, 2017.
- Isensee et al. [2021] F. Isensee, P. F. Jaeger, S. A. Kohl, J. Petersen, and K. H. Maier-Hein. nnu-net: a self-configuring method for deep learning-based biomedical image segmentation. Nature methods, 18(2):203–211, 2021.
- Jaeger et al. [2020] P. F. Jaeger, S. A. Kohl, S. Bickelhaupt, F. Isensee, T. A. Kuder, H.-P. Schlemmer, and K. H. Maier-Hein. Retina u-net: Embarrassingly simple exploitation of segmentation supervision for medical object detection. In Machine Learning for Health Workshop, pages 171–183. PMLR, 2020.
- Jeppesen et al. [2020] N. Jeppesen, A. N. Christensen, V. A. Dahl, and A. B. Dahl. Sparse layered graphs for multi-object segmentation. In Proceedings of the IEEE/CVF Conference on Computer Vision and Pattern Recognition, pages 12777–12785, 2020.
- Jin et al. [2020] L. Jin, J. Yang, K. Kuang, B. Ni, Y. Gao, Y. Sun, P. Gao, W. Ma, M. Tan, H. Kang, et al. Deep-learning-assisted detection and segmentation of rib fractures from ct scans: Development and validation of fracnet. EBioMedicine, 62:103106, 2020.
- Ker et al. [2019] J. Ker, S. P. Singh, Y. Bai, J. Rao, T. Lim, and L. Wang. Image thresholding improves 3-dimensional convolutional neural network diagnosis of different acute brain hemorrhages on computed tomography scans. Sensors, 19(9):2167, 2019.
- LeCun et al. [1998] Y. LeCun, L. Bottou, Y. Bengio, and P. Haffner. Gradient-based learning applied to document recognition. Proceedings of the IEEE, 86(11):2278–2324, 1998.
- Lin et al. [2014] T.-Y. Lin, M. Maire, S. Belongie, J. Hays, P. Perona, D. Ramanan, P. Dollár, and C. L. Zitnick. Microsoft coco: Common objects in context. In European conference on computer vision, pages 740–755. Springer, 2014.
- Lin et al. [2017] T.-Y. Lin, P. Goyal, R. Girshick, K. He, and P. Dollár. Focal loss for dense object detection. In Proceedings of the IEEE international conference on computer vision, pages 2980–2988, 2017.
- Liu et al. [2021] Z. Liu, Y. Lin, Y. Cao, H. Hu, Y. Wei, Z. Zhang, S. Lin, and B. Guo. Swin transformer: Hierarchical vision transformer using shifted windows. In Proceedings of the IEEE/CVF international conference on computer vision, pages 10012–10022, 2021.
- Liu et al. [2022a] Z. Liu, H. Hu, Y. Lin, Z. Yao, Z. Xie, Y. Wei, J. Ning, Y. Cao, Z. Zhang, L. Dong, et al. Swin transformer v2: Scaling up capacity and resolution. In Proceedings of the IEEE/CVF conference on computer vision and pattern recognition, pages 12009–12019, 2022a.
- Liu et al. [2022b] Z. Liu, H. Mao, C.-Y. Wu, C. Feichtenhofer, T. Darrell, and S. Xie. A convnet for the 2020s. In Proceedings of the IEEE/CVF Conference on Computer Vision and Pattern Recognition, pages 11976–11986, 2022b.
- Maier-Hein et al. [2018] L. Maier-Hein, M. Eisenmann, A. Reinke, S. Onogur, M. Stankovic, P. Scholz, T. Arbel, H. Bogunovic, A. P. Bradley, A. Carass, et al. Why rankings of biomedical image analysis competitions should be interpreted with care. Nature communications, 9(1):5217, 2018.
- maintainers and contributors [2016] T. maintainers and contributors. Torchvision: Pytorch’s computer vision library. https://github.com/pytorch/vision, 2016.
- Minaee et al. [2021] S. Minaee, Y. Y. Boykov, F. Porikli, A. J. Plaza, N. Kehtarnavaz, and D. Terzopoulos. Image segmentation using deep learning: A survey. IEEE transactions on pattern analysis and machine intelligence, 2021.
- Morozov et al. [2020] S. P. Morozov, A. Andreychenko, N. Pavlov, A. Vladzymyrskyy, N. Ledikhova, V. Gombolevskiy, I. A. Blokhin, P. Gelezhe, A. Gonchar, and V. Y. Chernina. Mosmeddata: Chest ct scans with covid-19 related findings dataset. arXiv preprint arXiv:2005.06465, 2020.
- Munkres [1957] J. Munkres. Algorithms for the assignment and transportation problems. Journal of the society for industrial and applied mathematics, 5(1):32–38, 1957.
- Redmon et al. [2016] J. Redmon, S. Divvala, R. Girshick, and A. Farhadi. You only look once: Unified, real-time object detection. In Proceedings of the IEEE conference on computer vision and pattern recognition, pages 779–788, 2016.
- Ren et al. [2015] S. Ren, K. He, R. Girshick, and J. Sun. Faster r-cnn: Towards real-time object detection with region proposal networks. Advances in neural information processing systems, 28, 2015.
- Ronneberger et al. [2015] O. Ronneberger, P. Fischer, and T. Brox. U-net: Convolutional networks for biomedical image segmentation. In Medical Image Computing and Computer-Assisted Intervention–MICCAI 2015: 18th International Conference, Munich, Germany, October 5-9, 2015, Proceedings, Part III 18, pages 234–241. Springer, 2015.
- Russakovsky et al. [2015] O. Russakovsky, J. Deng, H. Su, J. Krause, S. Satheesh, S. Ma, Z. Huang, A. Karpathy, A. Khosla, M. Bernstein, et al. Imagenet large scale visual recognition challenge. International journal of computer vision, 115(3):211–252, 2015.
- Serte and Demirel [2021] S. Serte and H. Demirel. Deep learning for diagnosis of covid-19 using 3d ct scans. Computers in biology and medicine, 132:104306, 2021.
- Setio et al. [2017] A. A. A. Setio, A. Traverso, T. De Bel, M. S. Berens, C. Van Den Bogaard, P. Cerello, H. Chen, Q. Dou, M. E. Fantacci, B. Geurts, et al. Validation, comparison, and combination of algorithms for automatic detection of pulmonary nodules in computed tomography images: the luna16 challenge. Medical image analysis, 42:1–13, 2017.
- Simpson et al. [2019] A. L. Simpson, M. Antonelli, S. Bakas, M. Bilello, K. Farahani, B. van Ginneken, A. Kopp-Schneider, B. A. Landman, G. Litjens, B. H. Menze, O. Ronneberger, R. M. Summers, P. Bilic, P. F. Christ, R. K. G. Do, M. Gollub, J. Golia-Pernicka, S. Heckers, W. R. Jarnagin, M. McHugo, S. Napel, E. Vorontsov, L. Maier-Hein, and M. J. Cardoso. A large annotated medical image dataset for the development and evaluation of segmentation algorithms. CoRR, abs/1902.09063, 2019. URL http://arxiv.org/abs/1902.09063.
- Timmins et al. [2021] K. M. Timmins, I. C. van der Schaaf, E. Bennink, Y. M. Ruigrok, X. An, M. Baumgartner, P. Bourdon, R. De Feo, T. Di Noto, F. Dubost, et al. Comparing methods of detecting and segmenting unruptured intracranial aneurysms on tof-mras: The adam challenge. Neuroimage, 238:118216, 2021.
- Walsh et al. [2021] C. Walsh, P. Tafforeau, W. Wagner, D. Jafree, A. Bellier, C. Werlein, M. Kühnel, E. Boller, S. Walker-Samuel, J. Robertus, et al. Imaging intact human organs with local resolution of cellular structures using hierarchical phase-contrast tomography. Nature methods, 18(12):1532–1541, 2021.
- Wang et al. [2020a] Q. Wang, N. Bhowmik, and T. P. Breckon. On the evaluation of prohibited item classification and detection in volumetric 3d computed tomography baggage security screening imagery. In 2020 International Joint Conference on Neural Networks (IJCNN), pages 1–8. IEEE, 2020a.
- Wang et al. [2020b] Q. Wang, N. Bhowmik, and T. P. Breckon. Multi-class 3d object detection within volumetric 3d computed tomography baggage security screening imagery. In 2020 19th IEEE International Conference on Machine Learning and Applications (ICMLA), pages 13–18. IEEE, 2020b.
- Withers et al. [2021] P. J. Withers, C. Bouman, S. Carmignato, V. Cnudde, D. Grimaldi, C. K. Hagen, E. Maire, M. Manley, A. Du Plessis, and S. R. Stock. X-ray computed tomography. Nature Reviews Methods Primers, 1(1):18, 2021.
- Xiao et al. [2020] Z. Xiao, B. Liu, L. Geng, F. Zhang, and Y. Liu. Segmentation of lung nodules using improved 3d-unet neural network. Symmetry, 12(11):1787, 2020.
- Xie and Ji [2002] Y. Xie and Q. Ji. A new efficient ellipse detection method. In 2002 International Conference on Pattern Recognition, volume 2, pages 957–960. IEEE, 2002.
- Yang et al. [2021] J. Yang, R. Shi, and B. Ni. Medmnist classification decathlon: A lightweight automl benchmark for medical image analysis. In 2021 IEEE 18th International Symposium on Biomedical Imaging (ISBI), pages 191–195. IEEE, 2021.
- Yang et al. [2023] J. Yang, R. Shi, D. Wei, Z. Liu, L. Zhao, B. Ke, H. Pfister, and B. Ni. Medmnist v2-a large-scale lightweight benchmark for 2d and 3d biomedical image classification. Scientific Data, 10(1):41, 2023.
- Zhou et al. [2021] S. K. Zhou, H. Greenspan, C. Davatzikos, J. S. Duncan, B. Van Ginneken, A. Madabhushi, J. L. Prince, D. Rueckert, and R. M. Summers. A review of deep learning in medical imaging: Imaging traits, technology trends, case studies with progress highlights, and future promises. Proceedings of the IEEE, 109(5):820–838, 2021.