DeepAccident: A Motion and Accident Prediction Benchmark for V2X Autonomous Driving
Abstract
Safety is the primary priority of autonomous driving. Nevertheless, no published dataset currently supports the direct and explainable safety evaluation for autonomous driving. In this work, we propose DeepAccident, a large-scale dataset generated via a realistic simulator containing diverse accident scenarios that frequently occur in real-world driving. The proposed DeepAccident dataset includes 57K annotated frames and 285K annotated samples, approximately 7 times more than the large-scale nuScenes dataset with 40k annotated samples. In addition, we propose a new task, end-to-end motion and accident prediction, which can be used to directly evaluate the accident prediction ability for different autonomous driving algorithms. Furthermore, for each scenario, we set four vehicles along with one infrastructure to record data, thus providing diverse viewpoints for accident scenarios and enabling V2X (vehicle-to-everything) research on perception and prediction tasks. Finally, we present a baseline V2X model named V2XFormer that demonstrates superior performance for motion and accident prediction and 3D object detection compared to the single-vehicle model.
DeepAccident: A Motion and Accident Prediction Benchmark for V2X Autonomous Driving
Tianqi Wang1, Sukmin Kim1,
Ji Wenxuan1, Enze Xie2 *,
Chongjian Ge1, Junsong Chen3,
Zhenguo Li2, Ping Luo1 *
1The University of Hong Kong
2Huawei Noah’s Ark Lab
3Dalian University of Technology
Introduction
In recent years, single-vehicle autonomous driving has achieved significant progress owing to the well-established datasets for autonomous driving, such as KITTI (Geiger et al. 2013), nuScenes (Caesar et al. 2020), Waymo (Sun et al. 2020), etc. Using those datasets, researchers have proposed various representative algorithms for different downstream tasks, including perception (Lang et al. 2019; Shi et al. 2020; Huang et al. 2021; Li et al. 2023) and prediction (Hu et al. 2021; Zhang et al. 2022).
Nevertheless, single-vehicle autonomous driving suffers from performance degradation in distant or occluded areas due to poor or partial visibility of raw sensors. One possible solution is to seek the help of vehicle-to-everything (V2X) communication technology which can provide a complementary perception range or enhanced visibility for the ego vehicle. Based on the additional information source, V2X communication can be further categorized as vehicle-to-vehicle (V2V) and vehicle-to-infrastructure (V2I). Most of the existing V2X datasets (Xu et al. 2022c; Li et al. 2022; Yu et al. 2022) support perception tasks but ignore the critical motion prediction task. The only V2X dataset that supports motion prediction is V2X-seq (Yu et al. 2023), that is recently released, but it requires ground truth vehicle positions, map topology, and traffic light status as inputs, which is impractical for real-world autonomous driving. Moreover, mainstream datasets lack an essential attribute for evaluating the safety of autonomous driving: the inclusion of safety-critical scenarios, such as collision accidents. Existing accident datasets (Sadegh Aliakbarian et al. 2018; Hoon et al. 2019; Xu et al. 2022d) suffer from limitations such as low-resolution images captured from a single forward-facing camera and coarse accident annotation labels.
We propose the DeepAccident dataset, the first V2X autonomous driving dataset supporting end-to-end motion and accident prediction, and various perception tasks. Using the CARLA simulator (Dosovitskiy et al. 2017), we reconstructed diverse real-world driving accidents according to NHTSA pre-crash reports (Najm et al. 2007). For each scenario, four vehicles and one infrastructure are designed to collect full sets of sensor data, including multi-view cameras and LiDAR, with labels for perception and prediction tasks. This setup fills the gap of a lack of safety-critical scenarios in existing V2X datasets. Additionally, we introduce a new end-to-end accident prediction task to predict collision accidents’ occurrence, timing, location, and involved vehicles or pedestrians. An illustration of this task is shown in Figure 1. Lastly, we propose a V2X model named V2XFormer, which demonstrates superior performance compared to the single-vehicle model on the DeepAccident dataset.
Our main contributions can be summarized in three-fold: (i) DeepAccident, the first V2X dataset and benchmark that contains diverse collision accidents, (ii) a new task named end-to-end accident prediction that predicts the occurrence of collision accidents and their specific timing, location, and vehicles or pedestrians involved, and (iii) a V2X model named V2XFormer for both perception and prediction tasks to serve as a baseline for further research.
Related Work
V2X datasets for autonomous driving.
The existing V2X datasets primarily focus on perception tasks, including simulator-generated OPV2V (Xu et al. 2022c) and V2X-Sim (Li et al. 2022), and real-world datasets DAIR-V2X (Yu et al. 2022) and V2X-seq (Yu et al. 2023). V2X-seq is currently the only available dataset that supports the motion prediction task. However, it only supports the traditional motion task, which assumes perfect perception and takes ground truth vehicle locations, map topology, and traffic light status as inputs. Alternatively, end-to-end motion prediction, which takes the raw sensor as input and generates the motion prediction results, has aroused significant research interest recently (Hu et al. 2021; Zhang et al. 2022) due to the potential to extract more semantics from the raw sensor and the time efficiency. In comparison, our proposed DeepAccident dataset provides multi-view camera and LiDAR sensor data and supports all common perception tasks and end-to-end motion and accident prediction task refer to Table 1. Moreover, DeepAccident also has the largest scale compared with existing datasets according to Table 2.
| Dataset | Scenario | Source | Sensor | Tasks | Accident | ||||
| MTV Cameras | LiDAR | Det. | Track. | Seg. | Mot. | ||||
| nuScenes | single | real-world | ✓ | ✓ | ✓ | ✓ | ✓ | ✗ | |
| Waymo | single | real-world | ✓ | ✓ | ✓ | ✓ | ✗ | ✗ | |
| KITTI | single | real-world | ✗ | ✓ | ✓ | ✓ | ✗ | ✗ | |
| OPV2V | V2V | simulator | ✓ | ✓ | ✓ | ✓ | ✗ | ✗ | |
| V2X-Sim | V2V&V2I | simulator | ✓ | ✓ | ✓ | ✓ | ✓ | ✗ | |
| DAIR-V2X | V2I | real-world | ✗ | ✓ | ✓ | ✗ | ✗ | ✗ | ✗ |
| V2X-seq/Perception | V2I | real-world | ✗ | ✓ | ✓ | ✓ | ✗ | ✗ | |
| V2X-Seq/Forecasting | V2I | real-world | ✗ | ✓ | ✓ | ✓ | ✗ | ✗ | ✗ |
| VIENA2 | single | simulator | ✗ | ✗ | ✗ | ✗ | ✗ | ✗ | ✓ |
| GTACrash | single | simulator | ✗ | ✗ | ✗ | ✗ | ✗ | ✗ | ✓ |
| YoutubeCrash | single | real-world | ✗ | ✗ | ✗ | ✗ | ✗ | ✗ | ✓ |
| TAD | single | real-world | ✗ | ✗ | ✗ | ✗ | ✗ | ✗ | ✓ |
| DeepAccident (ours) | V2V&V2I | simulator | ✓ | ✓ | ✓ | ✓ | ✓ | ✓ | ✓ |
| KITTI | nuScenes | Waymo | OPV2V | V2X-Sim | V2X-seq | DeepAccident (ours) | |
| # of annotated samples | 15K | 40K | 230K | 33K | 47K | 36K | 285K |
| # of annotated V2X frames | 0 | 0 | 0 | 11K | 10K | 18K | 57K |
| annotation frequency (Hz) | 1 | 2 | 10 | 10 | 5 | 10 | 10 |
Accident datasets for autonomous driving. Currently, there are few existing accident datasets which only operate within a single vehicle or single infrastructure setting. VIENA2 (Sadegh Aliakbarian et al. 2018) and GTACrash (Hoon et al. 2019) create collisions in the GTA V video game by manually driving or randomly losing control, thus having limited accident diversity and realism. YoutubeCrash (Hoon et al. 2019) and TAD (Xu et al. 2022d) respectively utilize real-world collision video clips captured from vehicle forward cameras or infrastructure surveillance cameras. All these datasets only contain low-resolution forward camera images and oversimplify the accident prediction task as a classification or 2D dangerous vehicle detection task, which is challenging to interpret or use for subsequent planning module in autonomous driving. In contrast, our proposed DeepAccident dataset provides fully detailed accident labels, such as the accident vehicle ids and their future colliding trajectories in the V2X scenario.
Accident scenario generation. The generation of accident scenarios can be categorized as optimization-based and knowledge-based. AdvSim (Wang et al. 2021) and STRIVE (Rempe et al. 2022) belong to the former and generate the perturbed adversary trajectories for other vehicles to attack the fixed ego planner. AdvSim selects adverse vehicles beforehand and optimizes their action profiles with the kinematics bicycle model and black-box optimizations. STRIVE represents the traffic motion as a learned latent vector and leverage gradient-based optimization to optimize the latent vector. However, the optimization-based methods can be prohibitively time-consuming for generating large-scale accident datasets. For instance, generating a single 10-agent 8s scenario takes 6-7 minutes for STRIVE, even several hours for AdvSim. Besides, the optimization-based methods can generate implausible or unrealistic scenarios and thus need additional filtering steps, which adds more computational overhead. Our accident generation method is mostly similar to CARLA’s ScenarioRunner and belongs to the knowledge-based method. It uses rules for adverse agent behaviors and generates corresponding trajectories. The proposed DeepAccident dataset focus on the accidents that happen in intersections. To increase the trajectory diversity, we randomly choose the starting positions, destination directions, and the maximum speed of ego and adverse vehicles.
DeepAccident Dataset
Dataset Generation
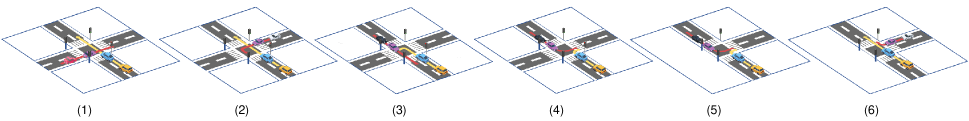
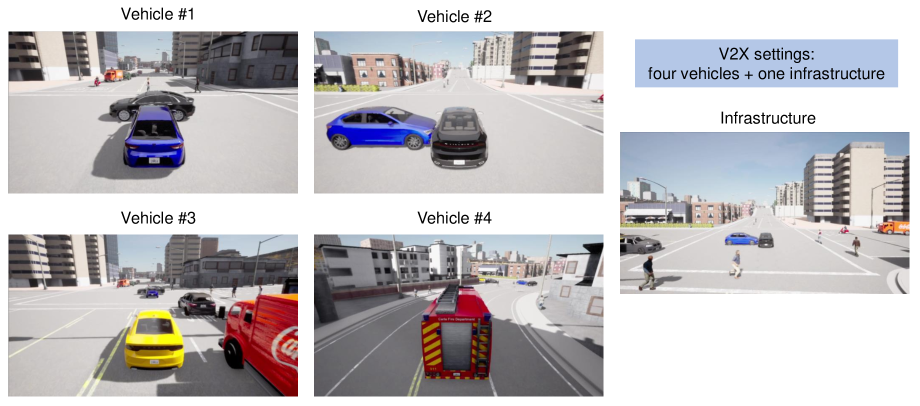
The accident scenarios in DeepAccident are designed following the pre-crash report by NHTSA, in which various types of collision accidents are reported from real-world crash data. We design 12 types of accident scenarios that happen in intersections in DeepAccident, as shown in Figure 2. Our designed accident scenarios generally involve two vehicles with overlapped planned trajectories at signalized and unsignalized intersections. In addition to the two accident vehicles, we spawn two more vehicles, each following behind one of the accident vehicles, to capture diverse viewpoints of the same scene (See Figure 2). Furthermore, full sets of sensors are installed on all four vehicles, and annotated labels are saved independently. Additionally, a full stack of sensors is installed facing toward the intersection on the infrastructure side, resulting in data from four vehicles and one infrastructure of the same scene to support V2X research. The detailed sensor configuration and an illustration example of our V2X setting are provided in the appendix.
Accident generation details. For the two accident vehicles that we choose to collide with each other, we first calculate the intersection point of their planned trajectories and then perturb their initial positions to arrive at a similar time by dividing the arriving distance by the randomly chosen maximum speeds. The two vehicles designed to follow the accident vehicles have the same trajectories as the accident vehicles. Note that accident vehicles will also react to the surrounding traffic using rule-based controllers when necessary, thus altering their arrival times at the accident site. As a result, these accident vehicles may collide at diverse relative positions or angles and could potentially collide with other vehicles to increase trajectory diversity. Despite not being specifically designed, other accident scenarios occurred during data collection, such as vehicles hitting crossing pedestrians and colliding with lane-changing vehicles. These are included in the proposed DeepAccident dataset, with plans to incorporate more scenarios in future versions. Normal scenarios without collisions are also included in DeepAccident to enhance motion diversity. Each scenario will terminate when a collision occurs, the ego vehicle completes its planned trajectory, or the scenario time exceeds 10 seconds.
Dataset Statistics
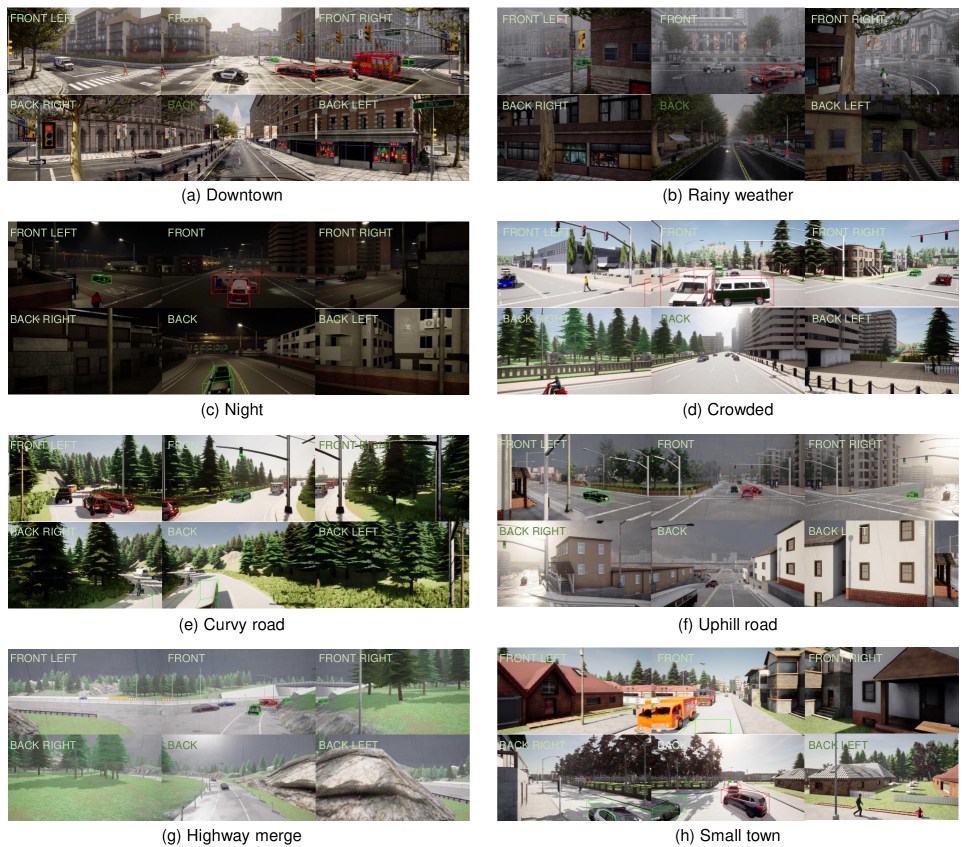
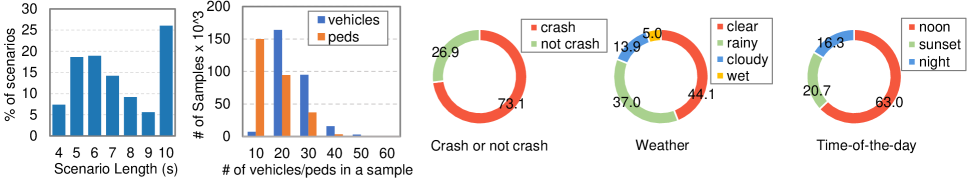
Scenario distribution. During data collection, various random factors such as number of surrounding vehicles and pedestrians, weather, and time-of-day were applied to enhance diversity. As depicted in Figure 3, the DeepAccident dataset demonstrates significant diversity. Detailed statistics are available in the appendix.
Supported tasks. DeepAccident supports various perception tasks such as 3D object detection, tracking, BEV semantic segmentation, and prediction tasks like motion prediction and accident prediction with detailed accident labels. All these tasks can be achieved within V2X settings in DeepAccident, thus stimulating more V2X research.
Dataset size. The proposed DeepAccident comprises a total of 285k annotated samples and 57k annotated V2X frames at a frequency of 10 Hz. Besides, we split the data with a ratio of 0.7, 0.15, and 0.15 for training, validation, and testing splits, resulting in 203k, 41k, and 41k samples, respectively.
End-to-End Motion and Accident Prediction
For this task, we select the camera-based setting to utilize multi-view camera image streams as inputs for generating motion prediction results for the entire scene. These motion prediction results are then post-processed to determine the occurrence of the accident and the accident vehicle ids, accident positions as well as timing (see Figure 1).
Network Structure
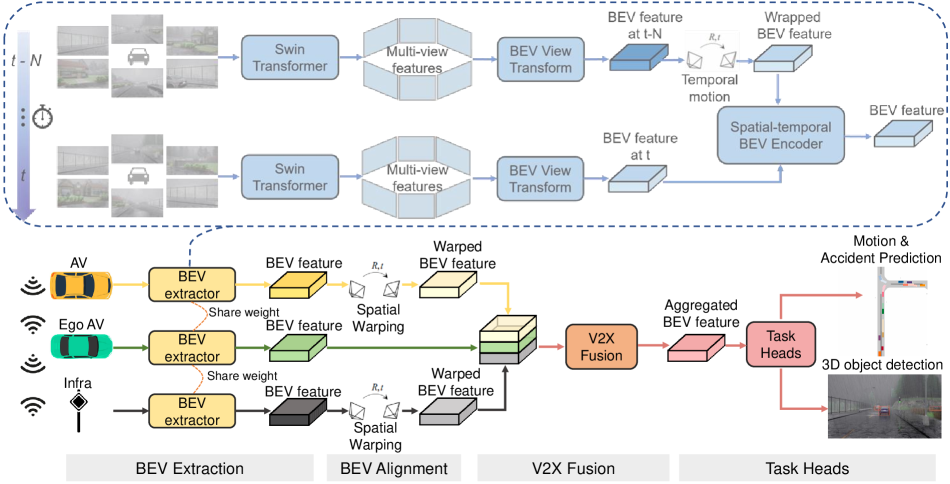
We choose BEVerse (Zhang et al. 2022) as our baseline single-vehicle model due to its support for end-to-end motion prediction. For the V2X setting, we propose a simple yet effective V2X model named V2XFormer due to using SwinTransformer (Liu et al. 2021) as the image feature backbone. As shown in Figure 4, V2XFormer shares the same BEV feature extractor as the single-vehicle model such that each V2X agent would extract a BEV feature centered at its own coordinate system. These BEV features are then spatially wrapped to the ego vehicle coordinate system to concatenate with the ego vehicle BEV feature. To fuse the concatenated BEV features, we utilize the fusion modules of the state-of-the-art V2X methods. The aggregated BEV feature is then fed into the task heads to generate the motion prediction and 3D object detection results. In addition, given the fact that the ego vehicle itself can cause an accident with other vehicles or pedestrians, we also require the network to jointly predict the ego vehicle’s future motion.
Accident Prediction
Post-processing for accident prediction. We post-process the motion prediction results frame-wise to check the occurrence of accident. The performance of accident prediction can be viewed as a safety metric for autonomous driving. From the motion prediction results, which consist of several BEV outputs, including centerness, segmentation, offset, and future flow, we can combine them to get the BEV instance segmentation results like the ones shown in Figure 1 for the current moment as well as the future period. For each timestamp, we can approximate the BEV segmentation results for each object as polygons and then find the polygons with the closest distance and store the object ids and positions to represent the accident candidates for this timestamp. By looking for the timestamp with the closest object distance, we determine whether an accident occurred and provide labels regarding the colliding object ids and positions, and the collision timestamp. In our experiment, we set a threshold for a dangerous distance as 1.0 meters.
Accident prediction accuracy. To evaluate the accuracy of accident prediction compared to ground truth accident information, the same post-process steps are applied to the ground truth motion to determine the occurrence of future accidents. A true positive prediction is when : (i) both the prediction and ground truth indicate the occurrence of an accident, and (ii) the total position difference of the colliding agents between the prediction and the ground truth is less than a threshold. Based on this, we propose a new evaluation metric named Accident Prediction Accuracy (APA) in Equation 1 where we calculate the average accident prediction accuracy over a set of position difference thresholds of {5,10,15} meters:
| (1) |
True Positive metrics. In addition to the APA, we calculate several True Positive metrics (TP metrics) for true positive accident predictions to provide more detailed performance interpretation. This includes the error terms for IDs, positions and time between the ground truth accident and the predicted accident. For TP metrics calculation, we set the position difference threshold to 10 meters when deciding the true positive predictions. As for ID error, if the predicted accident objects’ ids are the same as the ground truth’s, then it equals to zero, otherwise equals to one. For position and time error, we present them using their native units (meters and seconds) and calculate the absolute difference compared to the ground truth. For each TP metric, we calculate the average value over all true positive predictions.
Experiment
Evaluated tasks. To show the usefulness of our proposed DeepAccident dataset as a V2X motion and accident prediction benchmark, we focus on the end-to-end motion and accident prediction task and choose the camera-based setting. Besides, we train another 3D object detection head with the motion head to simultaneously compare the perception ability between the V2X models and the single-vehicle model.
Experiment settings. We use the settings for motion prediction in BEVerse (Zhang et al. 2022) and FIERY (Hu et al. 2021) as our default experiment settings. For 3D object detection, the BEV ranges are [-51.2m, 51.2m] for both X-axis and Y-axis with a 0.8m interval, while for motion prediction, the ranges are [-50.0m, 50.0m] with a 0.5m interval. The models use 1 second of past observations to predict 2 seconds into the future, corresponding to a temporal context of 3 past frames including the current frame and 4 future frames at 2Hz. We choose BEVerse-tiny as the single-vehicle model. For training, we train the models on the training split of DeepAccident for 20 epochs. As for evaluation, we randomly sample five BEV features from the learned motion Gaussian distribution along with the mean of this learned distribution to generate six different motion prediction results. Only the motion prediction result obtained from the mean vector of the learned Gaussian distribution is used to assess motion prediction performance. For accident prediction, we consider a prediction indicating the occurrence of an accident when any of the sampled motion predictions is analyzed to cause a collision accident, prioritizing safety.
We report the performance on DeepAccident’s validation split in the following sections and include results on the testing split in the appendix. We start by comparing different V2X fusion modules and choosing the optimal one. After that, we compare the overall performance of V2X models with different agent configurations to the single-vehicle model and provide further ablation analysis that considers accident visibility, longer prediction horizon, and robustness on pose error and latency. Additionally, we conduct experiments on nuScenes to validate the trained models’ real-world generalization ability.
Evaluation metrics. We use mIOU and VPQ proposed in FIERY (Hu et al. 2021) for the motion prediction task, our proposed APA (Accident Prediction Accuracy) and id error, position error for accident prediction task, and detection mAP averaged over center distance matching thresholds of {1,2,4} meters for 3D object detection task.
| Config | Motion | Accident | Detection | |
| mIOU() | VPQ() | APA() | mAP() | |
| Average Fusion | 52.1 | 39.5 | 67.1 | 36.2 |
| DiscoNet | 54.2 | 42.0 | 68.9 | 38.5 |
| V2X-ViT | 55.1 | 43.2 | 69.1 | 40.1 |
| CoBEVT | 56.2 | 44.0 | 69.5 | 40.8 |
| Config | Motion | Accident | mAP | |||
| mIOU() | VPQ() | APA() | id err() | pos err() | () | |
| Single vehicle | 43.8 | 31.6 | 61.9 | 0.12 | 3.20 | 26.5 |
| ego+behind vehicle | 51.3 | 39.2 | 66.8 | 0.11 | 2.87 | 36.3 |
| ego+other vehicle | 52.1 | 39.9 | 67.4 | 0.10 | 2.85 | 36.6 |
| ego+infra | 52.7 | 40.1 | 68.1 | 0.10 | 2.80 | 36.8 |
| ego+behind+other | 53.6 | 41.2 | 68.4 | 0.08 | 2.87 | 38.1 |
| 4 vehicles | 55.5 | 42.5 | 68.9 | 0.07 | 2.91 | 39.0 |
| 4 vehicles+infra | 56.2 | 44.0 | 69.5 | 0.06 | 2.45 | 40.8 |
V2X fusion module. We choose the five-agent V2X setting, and compare the performance of utilizing average pooling baseline and various state-of-the-art V2X fusion modules as V2XFormer’s fusion module. The V2X fusion methods used include DiscoNet (Li et al. 2021), V2X-ViT (Xu et al. 2022b), and CoBEVT (Xu et al. 2022a). As shown in Table 3, CoBEVT performs the best in all three tasks and we will use this V2X fusion module for the following experiments.
Overall performance. As shown in Table 4, V2X models significantly outperform the single-vehicle baseline in all three tasks. The V2X model with four vehicles and infrastructure exhibits much better performance than the single-vehicle model, with an increase of 12.4, 7.6, and 14.3 in mIOU, APA, and detection mAP, respectively. For the two agent cases, compared to V2X communication with the vehicle behind the ego vehicle (V2X-behind), V2X-other and V2X-infra both demonstrate better performance in all tasks, possibly due to the enhanced visibility on the other side and the broad visibility provided by the infrastructure’s relatively high sensor mounting position. Finally, the gradual incorporation of more V2X agents for communication can lead to gradual improvement in performance across all tasks.
| Prediction horizon | all data | 1s | 2s | 3s | 4s |
| 2s | 61.9 | 74.7 | 28.7 | none | none |
| 3s | 50.5 | 71.5 | 25.7 | 21.2 | none |
| 4s | 35.4 | 56.3 | 20.4 | 14.6 | 10.2 |
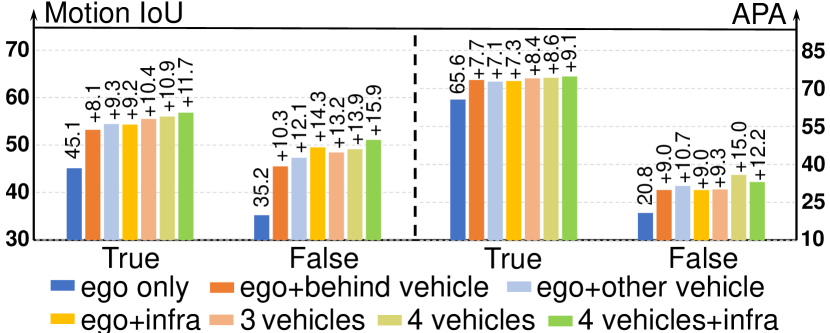
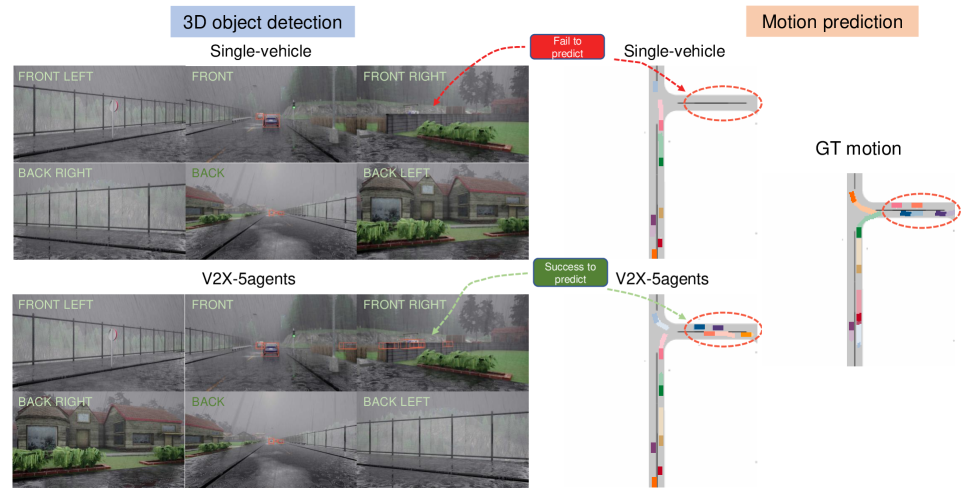
Performance based on accident vehicle visibility. During the observation period, accident vehicles or pedestrians may be temporarily or consistently invisible from the ego vehicle’s perspective, making it challenging to predict their motion with a single-vehicle model and hindering accident prediction. To address this, we evaluate the performance of different V2X models and a single-vehicle model by dividing the evaluation data based on accident vehicle or pedestrian visibility from the ego vehicle side. We define a sample with over half of its observation frames having invisible accident vehicles as an invisible sample for accidents. Figure 5 shows that the performance gap between V2X models and the single-vehicle model is significantly larger when there is limited accident visibility from the ego vehicle side, for both motion prediction and accident prediction tasks. Specifically, V2X-5agent model (4 vehicles + infra) outperforms the single-vehicle model by 15.9 and 12.2 higher mIOU and APA, respectively, for invisible accident scenarios, while the gap is only 11.7 and 9.1 in terms of mIOU and APA for visible accident scenarios.
Longer prediction horizon. We also conduct experiments on predicting longer future motion and choose the single-vehicle model as the baseline. As shown in Table 5, predicting longer future motion achieves worse accident prediction accuracy than the model with a shorter prediction horizon. For example, the model predicting 4s future achieves almost half the APA of the 2s-setting model on all validation data, achieving 35.4 and 61.9, respectively. On the other hand, the 4s-setting model achieves an APA of 10.2 for samples 4s prior to the collision, while other models are unable to predict the accident this early due to their design. These results suggest a trade-off between predicting longer future horizons and achieving satisfactory overall performance.
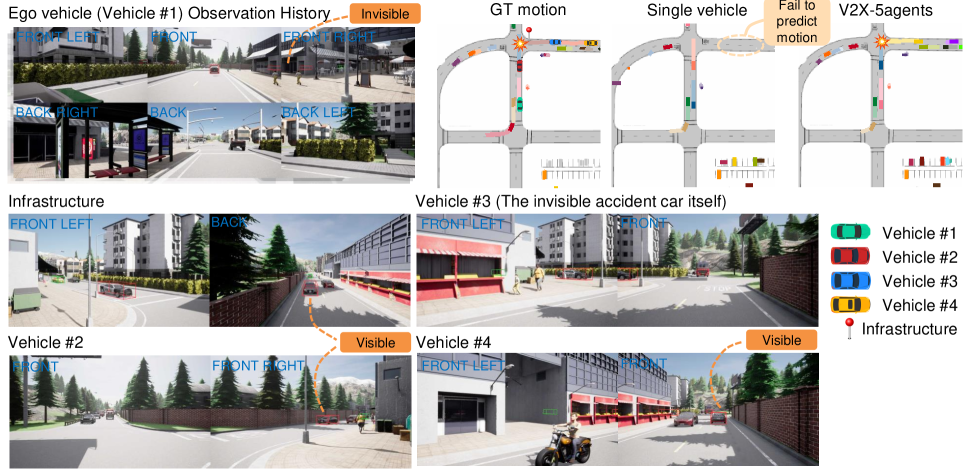
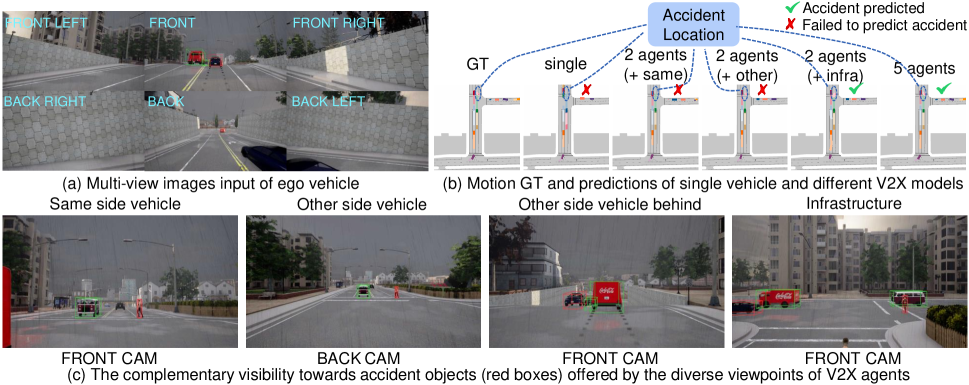
Qualitative results. Figure 6 shows an example where the crossing pedestrian is invisible to the ego vehicle due to the uphill terrain. As a result, the single-vehicle model is unable to detect the pedestrian and fails to predict the upcoming accident. In contrast, the infrastructure provides complementary visibility for the colliding vehicle and pedestrian, allowing the V2X-infra and V2X-5agents models to accurately anticipate the accident.
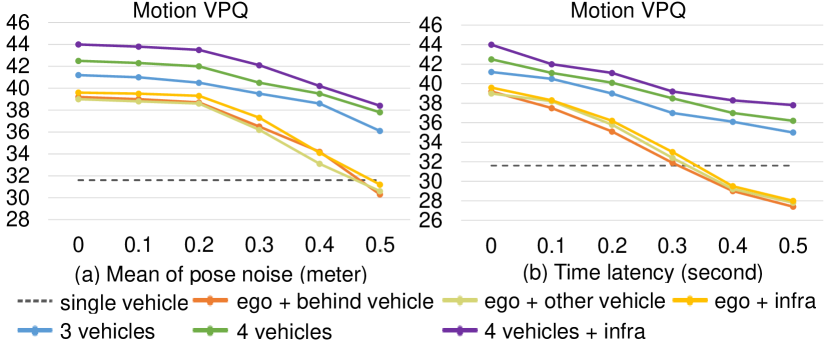
Robustness on pose error and latency. We test the robustness of V2XFormer with different V2X configurations against pose noise (Gaussian noise with a mean from 0.1m to 0.5m and a standard deviation of 0.02m), and delay latency (0.1s to 0.5s). As shown in Figure 7, incorporating more V2X agents provides stronger robustness against pose error and communication latency. Nevertheless, communicating with more agents results in larger data transmission, which can subsequently increase time latency and hinder performance. Therefore, a trade-off is necessary when considering V2X configurations.
Sim2Real Domain Adaptation. To validate the real-world generalization ability of the models trained with our proposed DeepAccident dataset, we fine-tune the trained single vehicle model on nuScenes for five epochs and compare it with the original BEVerse-tiny model that is only trained on nuScenes for motion prediction and 3D object detection tasks. As shown in Table 6, the model trained with both datasets achieves 1.9 higher mAP and 0.8 higher VPQ on the nuScenes validation dataset, indicating the usefulness of our proposed DeepAccident dataset for real-world scenarios.
| Training data | VPQ | mAP |
| nuScenes only | 33.4 | 32.1 |
| DeepAccident + nuScenes | 34.2 (+0.8) | 34.0 (+1.9) |
Conclusion
We propose DeepAccident, the first large-scale V2X autonomous driving dataset that includes various collision accident scenarios commonly encountered in real-world driving. Based on this dataset, we introduce the end-to-end motion and accident prediction task and corresponding metrics to assess the accuracy of accident prediction. DeepAccident contains sensor data and annotation labels from four vehicles and one infrastructure for each scenario, allowing for the V2X research for perception and prediction. Our proposed V2XFormer outperforms the single-vehicle model in both perception and prediction tasks, providing a baseline for future research. The proposed DeepAccident serves as a direct safety benchmark for autonomous driving algorithms and as a supplementary dataset for both single-vehicle and V2X perception research in safety-critical scenarios.
Acknowledgement. This paper is partially supported by the General Research Fund of Hong Kong No.17200622.
References
- Caesar et al. (2020) Caesar, H.; Bankiti, V.; Lang, A. H.; Vora, S.; Liong, V. E.; Xu, Q.; Krishnan, A.; Pan, Y.; Baldan, G.; and Beijbom, O. 2020. nuscenes: A multimodal dataset for autonomous driving. In Proceedings of the IEEE/CVF conference on computer vision and pattern recognition, 11621–11631.
- Dosovitskiy et al. (2017) Dosovitskiy, A.; Ros, G.; Codevilla, F.; Lopez, A.; and Koltun, V. 2017. CARLA: An open urban driving simulator. arXiv 2017. arXiv preprint arXiv:1711.03938.
- Geiger et al. (2013) Geiger, A.; Lenz, P.; Stiller, C.; and Urtasun, R. 2013. Vision meets robotics: The kitti dataset. The International Journal of Robotics Research, 32(11): 1231–1237.
- Hoon et al. (2019) Hoon, K.; Kangwook, L.; Gyeongjo, H.; and Changho, S. 2019. Crash to Not Crash: Learn to Identify Dangerous Vehicles Using a Simulator. In Proceedings of the AAAI Conference on Artificial Intelligence, 978–985.
- Hu et al. (2021) Hu, A.; Murez, Z.; Mohan, N.; Dudas, S.; Hawke, J.; Badrinarayanan, V.; Cipolla, R.; and Kendall, A. 2021. FIERY: future instance prediction in bird’s-eye view from surround monocular cameras. In Proceedings of the IEEE/CVF International Conference on Computer Vision, 15273–15282.
- Huang et al. (2021) Huang, J.; Huang, G.; Zhu, Z.; and Du, D. 2021. Bevdet: High-performance multi-camera 3d object detection in bird-eye-view. arXiv preprint arXiv:2112.11790.
- Lang et al. (2019) Lang, A. H.; Vora, S.; Caesar, H.; Zhou, L.; Yang, J.; and Beijbom, O. 2019. PointPillars: Fast Encoders for Object Detection from Point Clouds. In Proceedings of the IEEE/CVF conference on computer vision and pattern recognition, 12697–12705.
- Li et al. (2023) Li, Y.; Huang, B.; Chen, Z.; Cui, Y.; Liang, F.; Shen, M.; Liu, F.; Xie, E.; Sheng, L.; Ouyang, W.; et al. 2023. Fast-BEV: A Fast and Strong Bird’s-Eye View Perception Baseline. arXiv preprint arXiv:2301.12511.
- Li et al. (2022) Li, Y.; Ma, D.; An, Z.; Wang, Z.; Zhong, Y.; Chen, S.; and Feng, C. 2022. V2X-Sim: Multi-agent collaborative perception dataset and benchmark for autonomous driving. IEEE Robotics and Automation Letters, 7(4): 10914–10921.
- Li et al. (2021) Li, Y.; Ren, S.; Wu, P.; Chen, S.; Feng, C.; and Zhang, W. 2021. Learning Distilled Collaboration Graph for Multi-Agent Perception. In Thirty-fifth Conference on Neural Information Processing Systems (NeurIPS 2021).
- Liu et al. (2021) Liu, Z.; Lin, Y.; Cao, Y.; Hu, H.; Wei, Y.; Zhang, Z.; Lin, S.; and Guo, B. 2021. Swin transformer: Hierarchical vision transformer using shifted windows. In Proceedings of the IEEE/CVF international conference on computer vision, 10012–10022.
- Najm et al. (2007) Najm, W. G.; Smith, J. D.; Yanagisawa, M.; et al. 2007. Pre-crash scenario typology for crash avoidance research. Technical report, United States. National Highway Traffic Safety Administration.
- Rempe et al. (2022) Rempe, D.; Philion, J.; Guibas, L. J.; Fidler, S.; and Litany, O. 2022. Generating Useful Accident-Prone Driving Scenarios via a Learned Traffic Prior. In Conference on Computer Vision and Pattern Recognition (CVPR).
- Sadegh Aliakbarian et al. (2018) Sadegh Aliakbarian, M.; Sadat Saleh, F.; Salzmann, M.; Fernando, B.; Petersson, L.; and Andersson, L. 2018. VIENA2: A Driving Anticipation Dataset. arXiv e-prints, arXiv–1810.
- Shi et al. (2020) Shi, S.; Guo, C.; Jiang, L.; Wang, Z.; Shi, J.; Wang, X.; and Li, H. 2020. PV-RCNN: Point-Voxel Feature Set Abstraction for 3D Object Detection. In Proceedings of the IEEE/CVF Conference on Computer Vision and Pattern Recognition, 10529–10538.
- Sun et al. (2020) Sun, P.; Kretzschmar, H.; Dotiwalla, X.; Chouard, A.; Patnaik, V.; Tsui, P.; Guo, J.; Zhou, Y.; Chai, Y.; Caine, B.; et al. 2020. Scalability in perception for autonomous driving: Waymo open dataset. In Proceedings of the IEEE/CVF conference on computer vision and pattern recognition, 2446–2454.
- Wang et al. (2021) Wang, J.; Pun, A.; Tu, J.; Manivasagam, S.; Sadat, A.; Casas, S.; Ren, M.; and Urtasun, R. 2021. AdvSim: Generating Safety-Critical Scenarios for Self-Driving Vehicles. Conference on Computer Vision and Pattern Recognition (CVPR).
- Xu et al. (2022a) Xu, R.; Tu, Z.; Xiang, H.; Shao, W.; Bolei, Z.; and Ma, J. 2022a. CoBEVT: Cooperative Bird’s Eye View Semantic Segmentation with Sparse Transformers. In Conference on Robot Learning (CoRL).
- Xu et al. (2022b) Xu, R.; Xiang, H.; Tu, Z.; Xia, X.; Yang, M.-H.; and Ma, J. 2022b. V2X-ViT: Vehicle-to-Everything Cooperative Perception with Vision Transformer. In Proceedings of the European Conference on Computer Vision (ECCV).
- Xu et al. (2022c) Xu, R.; Xiang, H.; Xia, X.; Han, X.; Li, J.; and Ma, J. 2022c. Opv2v: An open benchmark dataset and fusion pipeline for perception with vehicle-to-vehicle communication. In 2022 International Conference on Robotics and Automation (ICRA), 2583–2589. IEEE.
- Xu et al. (2022d) Xu, Y.; Huang, C.; Nan, Y.; and Lian, S. 2022d. TAD: A Large-Scale Benchmark for Traffic Accidents Detection from Video Surveillance. arXiv preprint arXiv:2209.12386.
- Yu et al. (2022) Yu, H.; Luo, Y.; Shu, M.; Huo, Y.; Yang, Z.; Shi, Y.; Guo, Z.; Li, H.; Hu, X.; Yuan, J.; and Nie, Z. 2022. Dair-v2x: A large-scale dataset for vehicle-infrastructure cooperative 3d object detection. In Proceedings of the IEEE/CVF Conference on Computer Vision and Pattern Recognition, 21361–21370.
- Yu et al. (2023) Yu, H.; Yang, W.; Ruan, H.; Yang, Z.; Tang, Y.; Gao, X.; Hao, X.; Shi, Y.; Pan, Y.; Sun, N.; Song, J.; Yuan, J.; Luo, P.; and Nie, Z. 2023. V2X-Seq: A large-scale sequential dataset for vehicle-infrastructure cooperative perception and forecasting. In Proceedings of the IEEE/CVF Conference on Computer Vision and Pattern Recognition.
- Zhang et al. (2022) Zhang, Y.; Zhu, Z.; Zheng, W.; Huang, J.; Huang, G.; Zhou, J.; and Lu, J. 2022. Beverse: Unified perception and prediction in birds-eye-view for vision-centric autonomous driving. arXiv preprint arXiv:2205.09743.
Appendix A Ablation Experiments
| Config | Validation | Testing | ||||
| VPQ | APA | mAP | VPQ | APA | mAP | |
| Single vehicle | 31.6 | 61.9 | 26.5 | 30.5 | 61.9 | 25.8 |
| + behind vehicle | 39.2 | 66.8 | 36.3 | 38.9 | 65.8 | 36.0 |
| + other vehicle | 39.0 | 67.2 | 36.5 | 38.7 | 66.2 | 36.1 |
| + infrastructure | 39.6 | 68.1 | 36.8 | 39.1 | 67.3 | 36.2 |
| + behind & other vehicle | 41.2 | 68.4 | 38.1 | 40.5 | 68.0 | 37.8 |
| 4 vehicles | 42.5 | 68.9 | 39.0 | 41.8 | 68.0 | 38.3 |
| 4 vehicles + infra | 44.0 | 69.5 | 40.8 | 43.2 | 68.7 | 39.8 |
Performance comparison on val and test split. In the main paper, we evaluated all experiment results on the validation split of DeepAccident. Table 7 presents a performance comparison of various trained models on both the validation and testing splits. The table shows that the models perform similarly on both splits, with consistent relative performance gaps between models. For example, the V2X model with four vehicles and one infrastructure outperforms the single-vehicle model by 12.4 and 12.7 higher VPQ on the validation and testing splits, achieving 44.0 and 43.2 VPQ, respectively. These results confirm the validity of the split in DeepAccident.
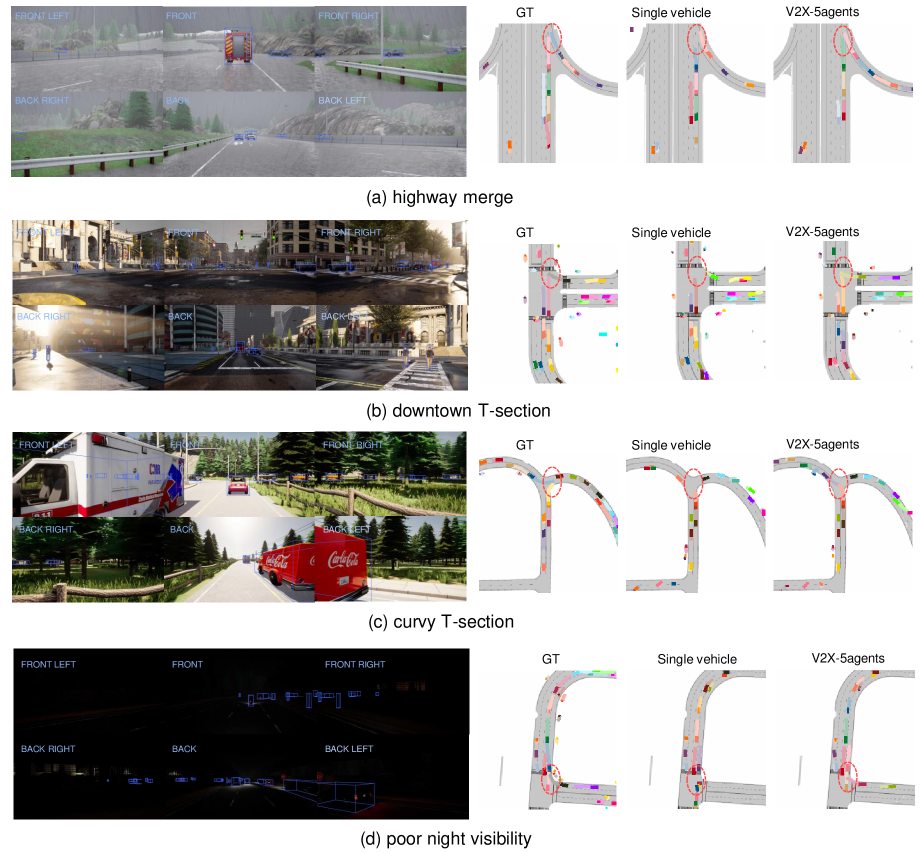
Qualitative results. Figures 9 and 10 present additional qualitative results comparing the V2X-5agents model and the single-vehicle model. These figures demonstrate the improved prediction and perception capabilities of the V2X model over the single-vehicle baseline, particularly in scenarios where the ego vehicle’s visibility is reduced due to occlusion, weather, or lighting conditions.
| Sensor | Description |
| Vehicles | For each vehicle: • Six rgb cameras with 1600 x 900 resolution. horizontal FoV for F/FL/FR/BL/BR cameras. horizontal FoV for the Back camera. • One 32-lane LiDAR mounted on top with 70 meter range, 30° vertical FoV, and 10 Hz rotation frequency. |
| Infrastructure | • Same senor configurations as the vehicles - six rgb cameras and one LiDAR. • Sensors installed on a high position randomly from 3 to 5 meters. |
| V2X communication | • Recorded relative poses between different V2X agents to align the information from different sources. |
Appendix B The DeepAccident Dataset
Scenario Design
V2X setting illustration. As illustrated in Figure 8, for each scenario in our proposed DeepAccident dataset, we have four vehicles and one infrastructure to collect sensor data, thus providing diverse viewpoints and enabling V2X research.
Dataset Statistics
Dataset size & split. While the simulator-based nature of the dataset could have enabled the generation of an unlimited amount of data, we chose to include data on 691 scenarios to maintain a manageable dataset size of roughly 310 GB. In addition, our proposed DeepAccident dataset provides six types of annotated objects, including car, van, truck, motorcycle, cyclist, and pedestrian, and supports numerous perception and prediction tasks. Moreover, we have meticulously divided the DeepAccident dataset into training, validation, and testing splits to make sure all of them contain enough diverse scenarios, such as scenarios with collision accidents and adverse weather and lighting conditions. With a total of 691 scenarios, we allocated the splits with a ratio of 0.7, 0.15, and 0.15 for training, validation, and testing. As such, the training, validation, and testing splits consist of 483, 104, and 104 scenarios, respectively. As a result, the 285k annotated samples were distributed with 203k, 41k, and 41k samples assigned to the training, validation, and testing splits correspondingly.
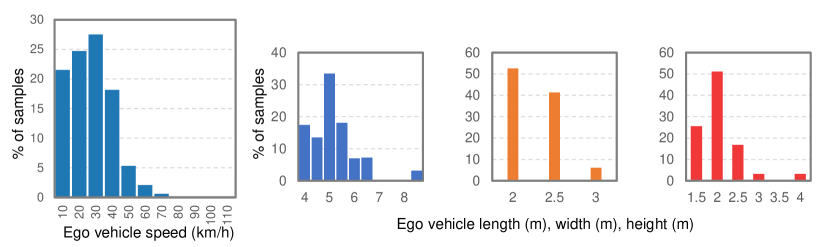
Ego vehicle statistics. Figure 11 shows the ego vehicle statistics of the DeepAccident dataset, including the driving speed and size dimensions. The driving speed of ego vehicle covers a wide range, including high-speed driving cases. Additionally, the ego vehicle size also varies significantly from small cars to huge trucks to offer more viewpoint diversity.
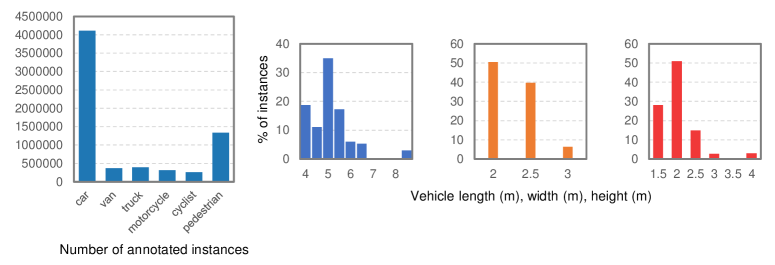
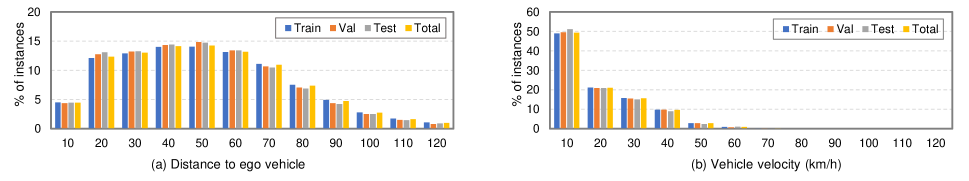
Instance-level statistics. Figure 12 and 13 provide instance-level statistics of the DeepAccident dataset. These figures demonstrate that all six object classes in DeepAccident have substantial amounts of annotated data, while the vehicle classes (car, van, and truck) exhibit a wide range of sizes. Moreover, the speed and distance of surrounding vehicles from the ego vehicle also exhibit significant variation. These results show the instance-level diversity of the proposed DeepAccident dataset.
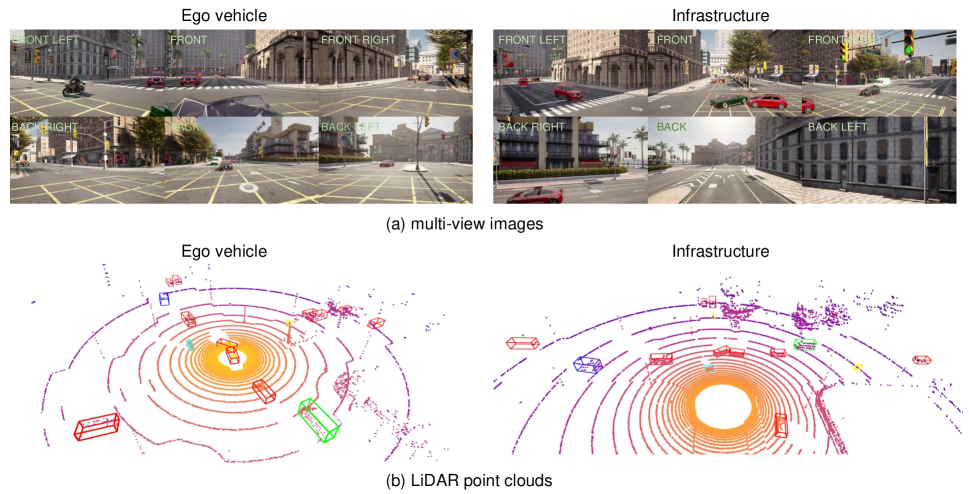
Dataset visualization. Additionally, we provide visualization for the collected camera and LiDAR data in Figure 14 and some showcase accident scenarios captured by infrastructure in Figure 15.