A Data-centric Framework for Improving Domain-specific
Machine Reading Comprehension Datasets
Abstract
Low-quality data can cause downstream problems in high-stakes applications. Data-centric approach emphasizes on improving dataset quality to enhance model performance. High-quality datasets are needed for general-purpose Large Language Models (LLMs) training, as well as for domain-specific models, which are usually small in size as it is costly to engage a large number of domain experts for their creation. Thus, it is vital to ensure high-quality domain-specific training data. In this paper, we propose a framework for enhancing the data quality of original datasets111Code and dataset are available at
https://github.com/IvaBojic/framework. We applied the proposed framework to four biomedical datasets and showed relative improvement of up to 33%/40% for fine-tuning of retrieval/reader models on the BioASQ dataset when using back translation to enhance the original dataset quality.
1 Introduction
Data-centric approach emphasizes the collection of high-quality data as a centrally important step in the model development Jarrahi et al. (2022). While model-centric approaches were more prominent in the past, recently data-centric approaches are also gaining importance Xu et al. (2021); Liu et al. (2021). This trend was especially emphasized since 2021 when Andrew Ng launched his campaign for a more data-centric approach to AI by starting the data-centric competition222https://https-deeplearning-ai.github.io/data-centric-comp, which encouraged participants to increase accuracy by solely improving the datasets while keeping the model fixed.
Large Language Models (LLMs), such as Generative Pre-trained Transformer 3 (GPT-3) Floridi and Chiriatti (2020), generate text that is grammatically correct, fluent, and informative. However, there is little to no control over the data that were used for model training. Consequently, LLMs are prone to hallucinating and providing untruthful outputs Evans et al. (2021). Ironically, this reflects LLMs’ ability to be better at learning the training distribution and consequently follow inverse scaling law Lin et al. (2021). And while some of the recent research efforts are focused on providing explanations of where the LLM’s outputs came from Menick et al. (2022), such research is in its infancy.
In this work, we focus on language models with a Transformer encoder architecture such as BERT Devlin et al. (2018), that extract relevant outputs from a domain-specific evidence-based text corpus. Deep neural networks trained on domain-specific datasets, including those used in Natural Language Processing (NLP), are most heavily dependent on the quality of the training dataset, which is usually small in size Zarcone et al. (2021) as it is costly to engage a large number of domain experts for annotation. It is thus important to create high-quality training data for language models to perform better. In this paper, we propose a data-centric framework for Machine Reading Comprehension (MRC) datasets that increases the original dataset quality by both (i) keeping the size of the original dataset fixed, and (ii) augmenting the original dataset by adding new training samples.
MRC is a Natural Language Understanding (NLU) task. Its goal is to answer questions based on the information provided in a passage Zhang et al. (2020). Training datasets for MRC models come in the form of triplets: passage (i.e., positive context), question, and answer. Typically, the MRC pipeline works in two phases, where a passage retriever is followed by a passage reader (Chen et al., 2017). For a given question, the retriever first extracts a set of relevant passages from a knowledge base (i.e., text corpus), and then the reader selects an answer (e.g., text span) from one of the retrieved passages (Zhu et al., 2021).
2 Related Work
Data-centric approaches can be divided into (i) data quality enhancement methods that keep the original size of the dataset fixed (e.g., data filtering or label consistency checking), and (ii) data augmentation methods that increase the original dataset size (i.e., adding more training samples). Results from the literature on using data-centric approaches to improve model performance in MRC are inconclusive.
Several studies have reported that data filtering can lead to significant model improvements Dou et al. (2020); Sanyal et al. (2021); Mollá (2022). However, this might not hold if data are filtered in a random way Firsanova (2021). Additionally, while increasing labelling consistency and excluding or cleaning noisy data points were shown to improve model performance on the BioASQ dataset Yoon et al. (2022), shortening answers in AASDQA led to a decrease of F1-score by 4% Firsanova (2021).
Adaptation of data augmentation is still comparatively less explored in NLP Feng et al. (2021), with a body of work presenting positive results Kaushik et al. (2019); Khashabi et al. (2020); Qin et al. (2020); Pappas et al. (2022) as well as papers showing little or no improvements for the given task Huang et al. (2020); Chopard et al. (2021); Okimura et al. (2022).
To the best of our knowledge, this paper is the first that proposes framework for data quality enhancement for improving domain-specific MRC datasets by (i) keeping the original dataset size of data the same and (ii) increasing the original dataset size using augmentation methods. Our framework includes methods for (i) a better selection of negative passages for retriever training, and (ii) reformulating questions using paraphrasing, word substitution, and back translation.
Paraphrasing, word substitution, and back translation were previously used as data augmentation methods in various NLP tasks Liu and Hulden (2021); Pappas et al. (2022); Ishii et al. (2022). However, those papers did not look at how each of these methods enhanced the original dataset without increasing its size. Keeping the size of the dataset fixed is necessary in resources-constrained scenarios, as the resources (e.g., time) needed for fine-tuning are proportional to the size of training sets. Moreover, previous studies did not present a cost-benefit analysis of the resources needed to generate extended training sets and perform fine-tuning processes in comparison with the performance increase.
3 A Data-centric Framework for MRC
In our framework, we first generate new training sets using four data quality enhancement methods. We then fine-tune retrieval and reader models on each new training set individually. Secondly, we fine-tune retrieval/reader models continually starting from the best individual checkpoint using enhanced training sets that showed improvements in the first step. Finally, we create new augmented datasets by concatenating all training sets if they show fine-tuning improvements in the first step.
Labels in MRC datasets are triplets which include a passage, a question, and an answer. In MRC datasets, an answer is part of a passage which is also called a positive context. To fine-tune a retrieval model as proposed in Karpukhin et al. (2020), it is necessary to not only provide a positive context of passages that contains the answer to a given question, but also negative contexts. Some previous work employed a method of randomly selecting negative contexts from a text corpus Bojic et al. (2022). Here we propose a method to improve the random selection of negative contexts.
One of the problems with manually collecting labels for MRC datasets is that questions are too similar to their answers Rajpurkar et al. (2018). To solve this, we investigate the use of three different methods applied to the original set of questions: (i) paraphrasing - we use two different language models fine-tuned for paraphrasing; (ii) word substitution - we use two libraries: one to extract a keyword from a given question and another to obtain a list of synonyms for the chosen keyword; and (iii) back translation - we use 25 different machine translation language models to translate a source text into another language, and back into the original language.
3.1 Negative Contexts
To enhance the quality of the negative contexts for each passage, we implemented the following procedure. For each positive context, passages were sorted in ascending order of BERTScore Zhang et al. (2019) similarity with the positive context, and the ones with the lowest score were kept to form negative contexts. A global counting dictionary was maintained to prevent the replication of negative contexts across different training examples. This ensured that each negative context did not exceed the threshold for number of occurrences in total in the whole dataset.
3.2 Questions
In this section, we describe the various techniques used to augment the questions from MRC datasets.
For question paraphrasing, we used two models: T5333https://huggingface.co/Vamsi/T5_Paraphrase_Paws and Pegasus444https://huggingface.co/tuner007/pegasus_paraphrase. To enhance the data quality of an original dataset, for each original question, we used the two aforementioned methods to generate up to five paraphrased questions. Subsequently, we created five different training sets in which we grouped the most, second most, up to the least similar paraphrases for each original question together. The word similarity was calculated using a word vector model from spaCy555https://spacy.io/models/en##en_core_web_lg. We also generated a sixth set comprising a randomly-selected question from the list of five unique paraphrases generated.
In word substitution process, we extracted a keyword from each question with the help of the spaCy library and obtained a list of synonyms for each keyword using Natural Language Tool Kit (NLTK)’s English dictionary, WordNet666https://www.nltk.org/howto/wordnet.html. The top five synonyms were extracted from this list in descending order of word similarity calculated using the aforementioned word vector model from spaCy. We then generated five versions of the training data for each dataset such that in set 1, the keyword for each question was replaced by its most similar synonym; in set 2, the keyword for each question was replaced by its second most similar synonym and so forth, with set 5 containing the questions with the least similar synonyms as substitutes. For keywords with n < 5 synonyms, we kept the question unchanged in the first (5 - n) versions and used the synonyms as substitutes in the remaining n versions. We also created a sixth set in which we randomly selected one of the top five (or n) synonyms to substitute the keyword for each question.
We used Hugging Face Helsinki model777https://huggingface.co/Helsinki-NLP for back translation. In total, we generated 25 different training sets based on the number of downloads for translation from English to the respective languages, followed by the availability of translation models from the respective languages to English. We selected checkpoints based on the number of downloads, taking the top 25 most downloaded.
To understand how different the resulting questions obtained from each of the enhancement methods are, we performed pairwise comparisons between questions from each method using ROUGE-1. Results are shown in Section B.7. Back-translation overall yields the questions most different to the baseline and the other enhancement methods.
3.3 Answers
Since MRC relies on extracting the exact answer (i.e., text span) from a passage, we could not apply any of the automatic data quality enhancement methods that we applied to questions (as explained in the previous section). However, we created new training datasets in which we manually shortened the original answers wherever appropriate. We explained further in Section A.3.
4 Datasets
To test our framework, we made adjustments (see Appendix A) to four biomedical datasets: BioASQ Lamurias et al. (2020), COVID-QA Möller et al. (2020), cpgQA Mahbub et al. (2023) and SleepQA Bojic et al. (2022). We refer the reader to Table 1 for statistics on the final version of datasets that we used in all experiments: original/final size of text corpus, original/final number of labels and finally, train/dev/test split.
Original BioASQ dataset contained over 3k manually-annotated biomedical labels. Questions in these datasets came in four different flavours: factoid, list, yes/no, and summary. We extracted only factoid questions for which the exact answer can be found in the positive context. Original COVID-QA dataset was annotated by biomedical experts and contained 2k labels on COVID-19 pandemic-related topics. Original cpgQA dataset contained 1k manually annotated labels in the domain of clinical practice guidelines. Original SleepQA was a manually annotated dataset in the sleep domain with 5k labels.
| Dataset |
|
|
|
|
|
||||||||||
|---|---|---|---|---|---|---|---|---|---|---|---|---|---|---|---|
| BioASQ | 4265 | 957 | 5821 | 957 | 765/96/96 | ||||||||||
| COVID-QA | 2079 | 1121 | 1327 | 1102 | 896/112/113 | ||||||||||
| cpgQA | 190 | 235 | 1097 | 1097 | 877/110/110 | ||||||||||
| SleepQA | 7000 | 7000 | 5000 | 5000 | 4000/500/500 |
5 Evaluation
We evaluated our framework by performing fine-tuning of retrieval and reader models using BioLinkBERT Yasunaga et al. (2022) and BioBERT BioASQ888https://huggingface.co/gdario/biobert_bioasq respectively. We used BioLinkBERT for retrieval model fine-tuning as it was recently shown to achieve state-of-the-art performance on low-resource bio-MRC tasks Mahbub et al. (2023). BioBERT BioASQ was used for fine-tuning of reader model as proposed in Bojic et al. (2022). Intrinsic evaluation of fine-tuned models was done using automatic metrics on test sets: recall@1 for retrieval and Exact Match (EM) for reader models.
5.1 Fine-tuning on Enhanced Training Sets
Table 2 and Table 3 show recall@1/EM scores respectively for fine-tuned retrieval/reader models after enhancing the method of selecting negative contexts (i.e., using BertScore) for the retrieval training datasets, as well as reformulation of questions using paraphrasing, word substitution, back translation and answer shortening for the training datasets of both models. More specifically:
-
•
The first row (baseline) in each table shows the results of BioLinkBERT/BioBERT BioASQ models fine-tuned on the original datasets.
-
•
Each subsequential row shows the best results for each dataset using the four aforementioned methods for negative contexts (only for the retrieval models) and questions (for both models) enhancement.
-
•
The following row (answer shortening) shows recall@1/EM scores for fine-tuning of models on the training datasets in which the original answers were manually shortened if needed.
-
•
The following row (continual) shows the results of continual fine-tuning: starting from the best individual checkpoint, we fine-tune on the second-best training set, and so on. For example, for reader fine-tuning on the BioASQ dataset, we first took the checkpoint of fine-tuning on the training set created using paraphrasing and then continued fine-tuning on training sets created using back translation. Finally, we took the newest checkpoint and continued fine-tuning on the training set created using word substitution.
-
•
The last row (augmentation) shows recall@1/EM scores for fine-tuning of models on the training datasets created by concatenating all data enhanced training sets if they showed fine-tuning improvements when using individually (i.e., rows 2-6 for retrieval and rows 2-5 for reader models).
For retrieval fine-tuning (Table 2), the most significant improvement of +8.3 (+33%) from baseline was achieved for BioASQ dataset when using back translation on the Catalan language. The enhanced methods of selecting negative contexts and word substitution improved all four datasets, while paraphrasing and back translation caused a decrease in recall@1 scores for SleepQA dataset. Continual retrieval fine-tuning showed improvements when compared to baselines for all datasets, however, only for the COVID-QA and cpgQA datasets it was better than the best results of individual fine-tuning.
| Methods | BioASQ | COVID-QA | cpgQA | SleepQA |
|---|---|---|---|---|
| baseline | 25.0 | 42.5 | 66.4 | 46.8 |
| negatives | 32.3 | 48.7 | 67.3 | 48.4 |
| paraphrasing | 31.2 | 54.0 | 66.4 | 46.6 |
| word substitution | 30.2 | 50.4 | 69.1 | 48.4 |
| back translation | 33.3 | 49.6 | 66.4 | 45.8 |
| answer shortening | 29.2 | 45.1 | 66.4 | 44.8 |
| continual | 29.2 | 62.8 | 70.9 | 47.2 |
| augmentation | 31.2 | 60.2 | 65.5 | 45.0 |
For fine-tuned reader models (Table 3), the most significant improvement of 2.1 (+40%) from baseline was achieved for BioASQ dataset when using back translation on the Dutch language, as well as paraphrasing. Continual reader fine-tuning increased the EM score only for cpgQA dataset compared with the corresponding baselines. Lastly, augmentation was better than the best results of individual fine-tuning only for the SleepQA dataset with the total increase of 2.6 (+4%).
| Methods | BioASQ | COVID-QA | cpgQA | SleepQA |
|---|---|---|---|---|
| baseline | 5.2 | 22.1 | 50.9 | 58.6 |
| paraphrasing | 7.3 | 23.9 | 50.9 | 59.0 |
| word substitution | 6.3 | 22.1 | 50.9 | 59.4 |
| back translation | 7.3 | 23.0 | 46.4 | 59.4 |
| answer shortening | 5.2 | 23.0 | 49.1 | 60.8 |
| continual | 5.2 | 23.9 | N/A* | 58.0 |
| augmentation | 5.2 | 23.9 | N/A* | 61.2 |
Greater relative improvements with back-translation compared to other methods could be supported by this method creating more diverse questions (Section B.7). However, back-translation gains are inconsistent from a dataset to the other. Moreover, we noticed that translation and paraphrasing with Pegasus gave questions noticeably more difference than the other data enhancing techniques.
5.2 Cost-benefit Analysis
In total, the data-centric methods that we described previously enabled us to generate 28 and 24 enhanced training sets for retrieval fine-tuning and reader fine-tuning respectively. Subsequently, we fine-tuned all retrieval/reader models on a single NVIDIA-A40 GPU with 46GB of GPU RAM. Table 4 and Table 5 shows time spent on fine-tuning. For example, we used one GPU for five hours to fine-tune retriever model on BioASQ dataset to achieve 33% improvement in recall@1 score. Meanwhile, we used one GPU for 22 hours to fine-tune retriever model on SleepQA dataset only to achieve a decrease in recall@1 score of 2%.
The last two rows in tables show the time needed for continual/augmentation fine-tuning only. However, in order to determine the order in which to fine-tune for continual learning, or which datasets to use for concatenation, all individual checkpoints need to be created. Hence, to obtain the total time for continual learning/augmentation, one needs to add up times from all previous rows as well.
| Methods | BioASQ | COVID-QA | cpgQA | SleepQA |
|---|---|---|---|---|
| baseline | 0.2 | 0.2 | 0.2 | 0.9 |
| negatives | 0.9 (29%) | 1.1 (15%) | 1.0 (1%) | 9.9 (3%) |
| paraphrasing | 4.3 (25%) | 3.7 (27%) | 3.6 (0%) | 25.4 (1%) |
| substitution | 2.5 (21%) | 1.4 (19%) | 1.8 (4%) | 6.1 (3%) |
| translation | 4.9 (33%) | 6.3 (17%) | 4.9 (0%) | 22.0 (2%) |
| answer shortening | 0.4 (17%) | 0.4 (6%) | 0.4 (0%) | 1.6 (4%) |
| continual | 1.6 (17%) | 1.7 (48%) | 0.7 (7%) | 1.1 (1%) |
| augmentation | 0.9 (25%) | 1.0 (42%) | 0.6 (1%) | 2.6 (4%) |
| Methods | BioASQ | COVID-QA | cpgQA | SleepQA |
|---|---|---|---|---|
| baseline | 0.1 | 0.1 | 0.1 | 0.3 |
| paraphrasing | 1.0 (40%) | 0.9 (8%) | 0.9 (0%) | 5.0 (1%) |
| substitution | 0.3 (21%) | 0.5 (0%) | 0.3 (0%) | 1.1 (1%) |
| translation | 1.0 (40%) | 1.2 (4%) | 1.7 (9%) | 4.0 (1%) |
| answer shortening | 0.1 (0%) | 0.1 (4%) | 0.1 (4%) | 0.2 (4%) |
| continual | 0.2 (0%) | 0.3 (8%) | N/A | 1.4 (1%) |
| augmentation | 0.1 (0%) | 0.1 (8%) | N/A | 0.5 (4%) |
6 Discussion and Conclusions
It is estimated that over 92% of data scientists who work in the Artificial Intelligence field encountered the “data cascades” phenomenon, which denotes downstream problems resulting from low-quality data Sambasivan et al. (2021). One way to improve the original dataset quality is data-centric approach. In this paper, we showed that by enhancing the quality of original datasets, one can achieve model fine-tuning performance improvements for small datasets (e.g., biomedical datasets). However, the results suggest that the effects of data quality enhancement methods on performance improvements are small, and the performance of the test data deteriorates in many cases.
Despite the inconsistency of data-centric methods used in this paper in yielding improvement, two positive conclusions can be drawn. First, when taking into consideration the time needed to create data enhanced training sets as well as performance improvements in fine-tuning, word substitution method is the best, supporting previous findings Feng et al. (2019); Pappas et al. (2022). Unlike other methods, word substitution is not model-based and thus is run for a few minutes, rather than a few hours like back translation and paraphrasing. Second, the best relative improvements were achieved for the BioASQ dataset with the smallest number of labels, a similar finding presented in Okimura et al. (2022).
In addition to the data-centric methods discussed in this work, there are other techniques such as pseudo-labelling Abney (2007); Ruder and Plank (2018); Cui and Bollegala (2019); Zhu and Goldberg (2022), data selection Axelrod et al. (2011); Plank and Van Noord (2011); Ruder and Plank (2017), and pre-training methods Han and Eisenstein (2019); Guo et al. (2020). In future work, we will investigate whether those techniques would produce more reliable and consistent results across different datasets. Moreover, we will also consider approaches that incorporate aspects of multiple techniques, resulting in hybrid data-centric techniques as proposed in Ramponi and Plank (2020).
Acknowledgements
The authors would like to acknowledge the funding support from Nanyang Technological University, Singapore. Josip Car’s post at Imperial College London is supported by the NIHR NW London Applied Research Collaboration.
References
- Abney (2007) Steven Abney. 2007. Semisupervised learning for computational linguistics. CRC Press.
- Axelrod et al. (2011) Amittai Axelrod, Xiaodong He, and Jianfeng Gao. 2011. Domain adaptation via pseudo in-domain data selection. In Proceedings of the 2011 conference on empirical methods in natural language processing, pages 355–362.
- Bojic et al. (2022) Iva Bojic, Qi Chwen Ong, Megh Thakkar, Esha Kamran, Irving Yu Le Shua, Jaime Rei Ern Pang, Jessica Chen, Vaaruni Nayak, Shafiq Joty, and Josip Car. 2022. Sleepqa: A health coaching dataset on sleep for extractive question answering. In Machine Learning for Health, pages 199–217. PMLR.
- Chen et al. (2017) Danqi Chen, Adam Fisch, Jason Weston, and Antoine Bordes. 2017. Reading Wikipedia to answer open-domain questions. arXiv preprint arXiv:1704.00051.
- Chopard et al. (2021) Daphné Chopard, Matthias S Treder, and Irena Spasić. 2021. Learning data augmentation schedules for natural language processing. In Proceedings of the Second Workshop on Insights from Negative Results in NLP, pages 89–102.
- Cui and Bollegala (2019) Xia Cui and Danushka Bollegala. 2019. Self-adaptation for unsupervised domain adaptation. Proceedings-Natural Language Processing in a Deep Learning World.
- Devlin et al. (2018) Jacob Devlin, Ming-Wei Chang, Kenton Lee, and Kristina Toutanova. 2018. Bert: Pre-training of deep bidirectional transformers for language understanding. arXiv preprint arXiv:1810.04805.
- Dou et al. (2020) Zi-Yi Dou, Antonios Anastasopoulos, and Graham Neubig. 2020. Dynamic data selection and weighting for iterative back-translation. arXiv preprint arXiv:2004.03672.
- Evans et al. (2021) Owain Evans, Owen Cotton-Barratt, Lukas Finnveden, Adam Bales, Avital Balwit, Peter Wills, Luca Righetti, and William Saunders. 2021. Truthful ai: Developing and governing ai that does not lie. arXiv preprint arXiv:2110.06674.
- Feng et al. (2021) Steven Y Feng, Varun Gangal, Jason Wei, Sarath Chandar, Soroush Vosoughi, Teruko Mitamura, and Eduard Hovy. 2021. A survey of data augmentation approaches for nlp. arXiv preprint arXiv:2105.03075.
- Feng et al. (2019) Steven Y Feng, Aaron W Li, and Jesse Hoey. 2019. Keep calm and switch on! preserving sentiment and fluency in semantic text exchange. arXiv preprint arXiv:1909.00088.
- Firsanova (2021) Victoria Firsanova. 2021. The advantages of human evaluation of sociomedical question answering systems. International Journal of Open Information Technologies, 9(12):53–59.
- Floridi and Chiriatti (2020) Luciano Floridi and Massimo Chiriatti. 2020. Gpt-3: Its nature, scope, limits, and consequences. Minds and Machines, 30(4):681–694.
- Guo et al. (2020) Han Guo, Ramakanth Pasunuru, and Mohit Bansal. 2020. Multi-source domain adaptation for text classification via distancenet-bandits. In Proceedings of the AAAI conference on artificial intelligence, volume 34, pages 7830–7838.
- Han and Eisenstein (2019) Xiaochuang Han and Jacob Eisenstein. 2019. Unsupervised domain adaptation of contextualized embeddings for sequence labeling. arXiv preprint arXiv:1904.02817.
- Huang et al. (2020) William Huang, Haokun Liu, and Samuel R Bowman. 2020. Counterfactually-augmented snli training data does not yield better generalization than unaugmented data. arXiv preprint arXiv:2010.04762.
- Ishii et al. (2022) Etsuko Ishii, Yan Xu, Samuel Cahyawijaya, and Bryan Wilie. 2022. Can question rewriting help conversational question answering? arXiv preprint arXiv:2204.06239.
- Jarrahi et al. (2022) Mohammad Hossein Jarrahi, Ali Memariani, and Shion Guha. 2022. The principles of data-centric ai (dcai). arXiv preprint arXiv:2211.14611.
- Karpukhin et al. (2020) Vladimir Karpukhin, Barlas Oguz, Sewon Min, Patrick Lewis, Ledell Wu, Sergey Edunov, Danqi Chen, and Wen-tau Yih. 2020. Dense passage retrieval for open-domain question answering. In Proceedings of the 2020 Conference on Empirical Methods in Natural Language Processing (EMNLP), pages 6769–6781, Online. Association for Computational Linguistics.
- Kaushik et al. (2019) Divyansh Kaushik, Eduard Hovy, and Zachary C Lipton. 2019. Learning the difference that makes a difference with counterfactually-augmented data. arXiv preprint arXiv:1909.12434.
- Khashabi et al. (2020) Daniel Khashabi, Tushar Khot, and Ashish Sabharwal. 2020. More bang for your buck: Natural perturbation for robust question answering. arXiv preprint arXiv:2004.04849.
- Lamurias et al. (2020) Andre Lamurias, Diana Sousa, and Francisco M Couto. 2020. Generating biomedical question answering corpora from q&a forums. IEEE Access, 8:161042–161051.
- Lin et al. (2021) Stephanie Lin, Jacob Hilton, and Owain Evans. 2021. Truthfulqa: Measuring how models mimic human falsehoods. arXiv preprint arXiv:2109.07958.
- Liu and Hulden (2021) Ling Liu and Mans Hulden. 2021. Backtranslation in neural morphological inflection. In Proceedings of the Second Workshop on Insights from Negative Results in NLP, pages 81–88.
- Liu et al. (2021) Zhengzhong Liu, Guanxiong Ding, Avinash Bukkittu, Mansi Gupta, Pengzhi Gao, Atif Ahmed, Shikun Zhang, Xin Gao, Swapnil Singhavi, Linwei Li, et al. 2021. A data-centric framework for composable nlp workflows. arXiv preprint arXiv:2103.01834.
- Mahbub et al. (2023) Maria Mahbub, Edmon Begoli, Susana Martins, Alina Peluso, Suzanne Tamang, and Gregory Peterson. 2023. cpgqa: A benchmark dataset for machine reading comprehension tasks on clinical practice guidelines and a case study using transfer learning. IEEE Access.
- Martín Galván et al. (2023) Laura Martín Galván, Enrique Fernández-Rodicio, Javier Sevilla Salcedo, Álvaro Castro-González, and Miguel A Salichs. 2023. Using deep learning for implementing paraphrasing in a social robot. In Ambient Intelligence—Software and Applications—13th International Symposium on Ambient Intelligence, pages 219–228. Springer.
- Menick et al. (2022) Jacob Menick, Maja Trebacz, Vladimir Mikulik, John Aslanides, Francis Song, Martin Chadwick, Mia Glaese, Susannah Young, Lucy Campbell-Gillingham, Geoffrey Irving, et al. 2022. Teaching language models to support answers with verified quotes. arXiv preprint arXiv:2203.11147.
- Mollá (2022) Diego Mollá. 2022. Query-focused extractive summarisation for biomedical and covid-19 complex question answering. arXiv preprint arXiv:2209.01815.
- Möller et al. (2020) Timo Möller, Anthony Reina, Raghavan Jayakumar, and Malte Pietsch. 2020. Covid-qa: A question answering dataset for covid-19. In Proceedings of the 1st Workshop on NLP for COVID-19 at ACL 2020.
- Okimura et al. (2022) Itsuki Okimura, Machel Reid, Makoto Kawano, and Yutaka Matsuo. 2022. On the impact of data augmentation on downstream performance in natural language processing. In Proceedings of the Third Workshop on Insights from Negative Results in NLP, pages 88–93.
- Pappas et al. (2022) Dimitris Pappas, Prodromos Malakasiotis, and Ion Androutsopoulos. 2022. Data augmentation for biomedical factoid question answering. arXiv preprint arXiv:2204.04711.
- Plank and Van Noord (2011) Barbara Plank and Gertjan Van Noord. 2011. Effective measures of domain similarity for parsing. In Proceedings of the 49th Annual Meeting of the Association for Computational Linguistics: Human Language Technologies, pages 1566–1576.
- Qin et al. (2020) Libo Qin, Minheng Ni, Yue Zhang, and Wanxiang Che. 2020. Cosda-ml: Multi-lingual code-switching data augmentation for zero-shot cross-lingual nlp. arXiv preprint arXiv:2006.06402.
- Rajpurkar et al. (2018) Pranav Rajpurkar, Robin Jia, and Percy Liang. 2018. Know what you don’t know: Unanswerable questions for SQuAD. arXiv preprint arXiv:1806.03822.
- Ramponi and Plank (2020) Alan Ramponi and Barbara Plank. 2020. Neural unsupervised domain adaptation in nlp—a survey. arXiv preprint arXiv:2006.00632.
- Ruder and Plank (2017) Sebastian Ruder and Barbara Plank. 2017. Learning to select data for transfer learning with bayesian optimization. arXiv preprint arXiv:1707.05246.
- Ruder and Plank (2018) Sebastian Ruder and Barbara Plank. 2018. Strong baselines for neural semi-supervised learning under domain shift. arXiv preprint arXiv:1804.09530.
- Sambasivan et al. (2021) Nithya Sambasivan, Shivani Kapania, Hannah Highfill, Diana Akrong, Praveen Paritosh, and Lora M Aroyo. 2021. “everyone wants to do the model work, not the data work”: Data cascades in high-stakes ai. In proceedings of the 2021 CHI Conference on Human Factors in Computing Systems, pages 1–15.
- Sanyal et al. (2021) Atindriyo Sanyal, Vikram Chatterji, Nidhi Vyas, Ben Epstein, Nikita Demir, and Anthony Corletti. 2021. Fix your models by fixing your datasets. arXiv preprint arXiv:2112.07844.
- Shorten et al. (2021) Connor Shorten, Taghi M Khoshgoftaar, and Borko Furht. 2021. Text data augmentation for deep learning. Journal of big Data, 8(1):1–34.
- Xu et al. (2021) Liang Xu, Jiacheng Liu, Xiang Pan, Xiaojing Lu, and Xiaofeng Hou. 2021. Dataclue: A benchmark suite for data-centric nlp. arXiv preprint arXiv:2111.08647.
- Yasunaga et al. (2022) Michihiro Yasunaga, Jure Leskovec, and Percy Liang. 2022. Linkbert: Pretraining language models with document links. arXiv preprint arXiv:2203.15827.
- Yoon et al. (2022) Wonjin Yoon, Jaehyo Yoo, Sumin Seo, Mujeen Sung, Minbyul Jeong, Gangwoo Kim, and Jaewoo Kang. 2022. Data-centric and model-centric approaches for biomedical question answering. In Experimental IR Meets Multilinguality, Multimodality, and Interaction: 13th International Conference of the CLEF Association, CLEF 2022, Bologna, Italy, September 5–8, 2022, Proceedings, pages 204–216. Springer.
- Yu et al. (2018) Jianfei Yu, Minghui Qiu, Jing Jiang, Jun Huang, Shuangyong Song, Wei Chu, and Haiqing Chen. 2018. Modelling domain relationships for transfer learning on retrieval-based question answering systems in e-commerce. In Proceedings of the Eleventh ACM International Conference on Web Search and Data Mining, pages 682–690.
- Zarcone et al. (2021) Alessandra Zarcone, Jens Lehmann, and Emanuël AP Habets. 2021. Small data in nlu: Proposals towards a data-centric approach. In 35th Conference on Neural Information Processing Systems (NeurIPS 2021).
- Zhang et al. (2019) Tianyi Zhang, Varsha Kishore, Felix Wu, Kilian Q Weinberger, and Yoav Artzi. 2019. Bertscore: Evaluating text generation with bert. arXiv preprint arXiv:1904.09675.
- Zhang et al. (2020) Zhuosheng Zhang, Hai Zhao, and Rui Wang. 2020. Machine reading comprehension: The role of contextualized language models and beyond. arXiv preprint arXiv:2005.06249.
- Zhu et al. (2021) Fengbin Zhu, Wenqiang Lei, Chao Wang, Jianming Zheng, Soujanya Poria, and Tat-Seng Chua. 2021. Retrieving and reading: A comprehensive survey on open-domain question answering. arXiv preprint arXiv:2101.00774.
- Zhu and Goldberg (2022) Xiaojin Zhu and Andrew B Goldberg. 2022. Introduction to Semi-Supervised Learning. Springer Nature.
Appendix A Datasets
A.1 Dataset Construction
In this subsection, we describe how we built the final version of datasets from Table 1. Where necessary, we divided passages from the original text corpus into one or more parts, so their length was less than 300 words. This step was done so that all passages were of a similar length across different datasets and that the same model hyperparameters can be used for fine-tuning retrieval and reader models. We then removed those labels for which the answer could not be found in the corresponding positive context. Finally, we divided each original dataset into three parts (in the ratio of 80:10:10) to create training, development, and test sets. Table 1 shows the original number of passages in each text corpora, the original number of labels, and the final numbers after the aforementioned adjustments were done.
A.2 Data Cleaning
BioASQ: The original dataset did not include positive passages, but instead contained links to the journal articles where the answers can be found. To obtain positive passages, we first retrieved them from the individual links provided in the dataset, and then divided them into passages of no longer than 300 words. Only triplets that contain the exact answers in the retrieved passages were included in the final dataset. We encountered a challenge that, of the 5,821 triplets of the factoid type identified, only 16% had the exact answers that could be found in the provided passages.
COVID-QA: We first divided the original corpus into passages containing no more than 300 words. We also removed redundant keywords, such as ’introduction:’, ’introductions:’, ’objective:’, ’objectives:’, ’conclusion:’, ’conclusions:’, ’method:’, ’methods:’, ’background:’, ’backgrounds:’, ’result:’, ’results:’, ’result(s):’, and ’aim:’. Additionally, we eliminated leading and trailing spaces and changed all letters to lowercase. To ensure dataset accuracy, further manual cleaning was carried out. This includes filling in incomplete words, removing medical abbreviations, and correcting missing brackets such as "()" and "[]".
cpgQA: To prepare the text corpus, we partitioned passages into segments of no more than 300 words, resulting in a corpus of 235 passages. Unfortunately, this division caused some answers to be separated from their corresponding positive contexts due to issues such as inaccurate sentence tokenization and answer fragmentation between two adjacent passages. These discrepancies were addressed through manual intervention. It should be noted that no labels were excluded from the original dataset as a result of this cleaning procedure.
SleepQA The original dataset already contained passages shorter than 300 words, and all answers were found in their provided passages. We eliminated leading and trailing spaces and changed all letters to lowercase.
A.3 Shortening Answers
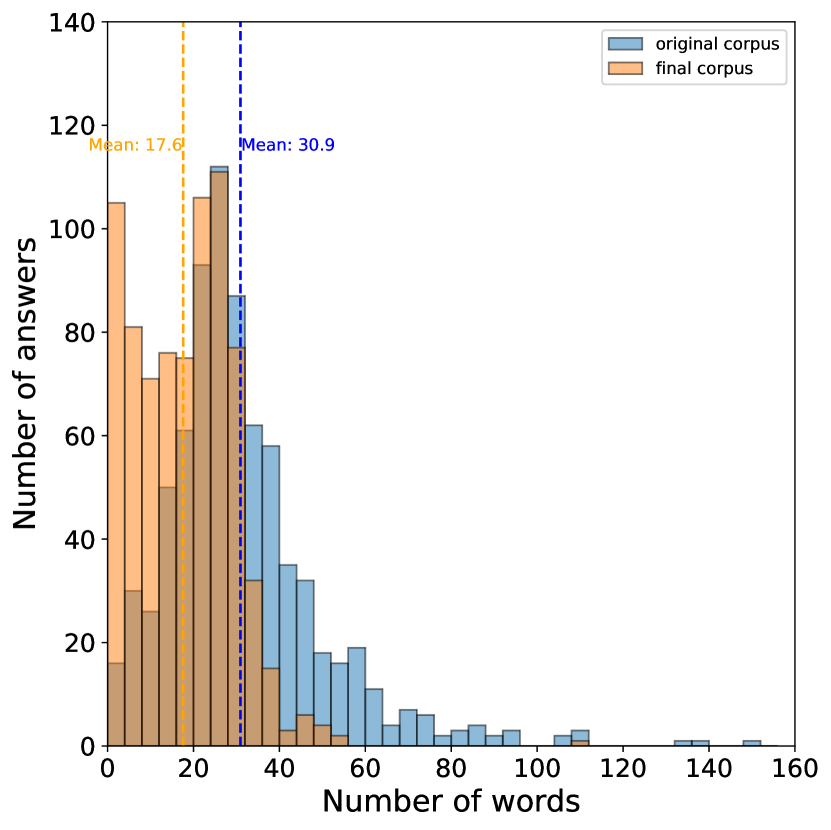
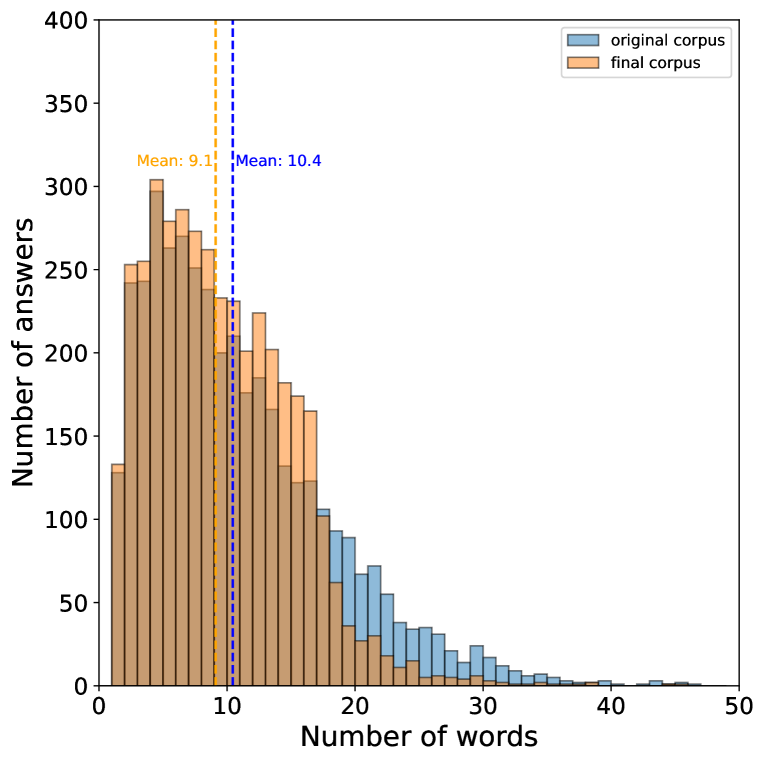
BioASQ: The original answers varied from two to more than 120 words in length. Our focus was on shortening the answers which were excessively long, and thus all answers longer than 30 words were manually reviewed. The primary adjustments made to the answers involved isolating the main response to the corresponding question, thereby truncating lengthy sentences into shorter phrases. This approach effectively reduced answer length for both the test and training sets by a significant degree. The mean answer length for the training set decreased from 30.9 to 17.6 words (Figure 1), while the mean answer length for the test set decreased from 26.1 to 18.4 words (Figure 2).

COVID-QA: In the original dataset, the length of the answers was not more than 120 words. However, some answers contained incomplete words at the beginning and/or end of sentences. To improve the dataset’s accuracy, these words were either manually removed or completed. Moreover, scientific abbreviations were eliminated manually to improve the accuracy of exact matches. Unfortunately, this had no significant effect on the mean length of answers for both the training and test sets. This result can be attributed to the training set’s prevalence of sentences with only one or two abbreviations. In other cases, completing the incomplete words also had no effect on the mean word count.
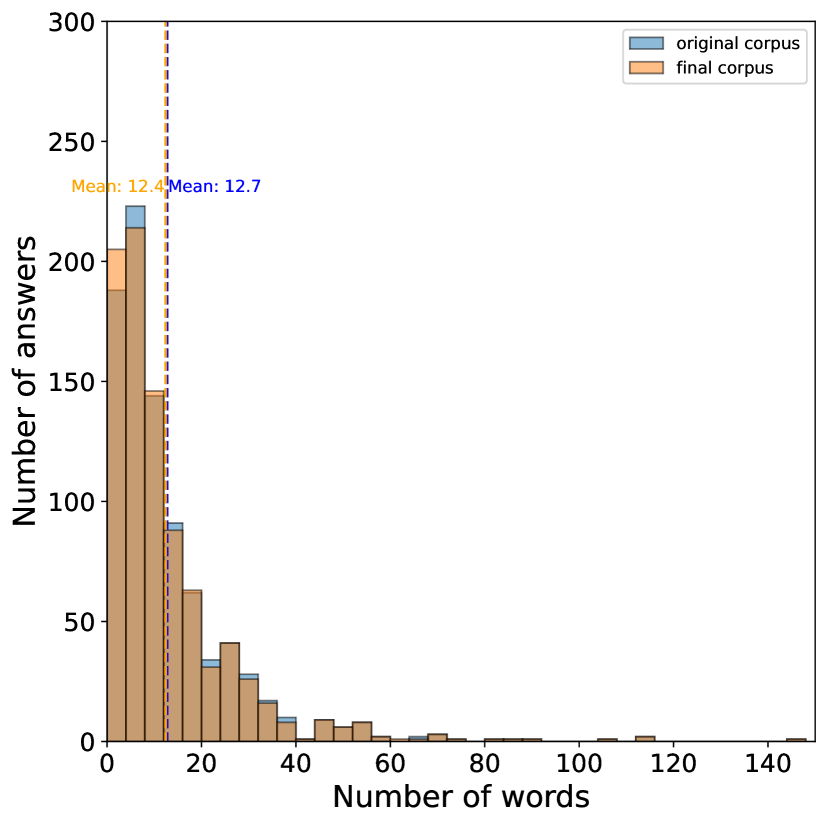
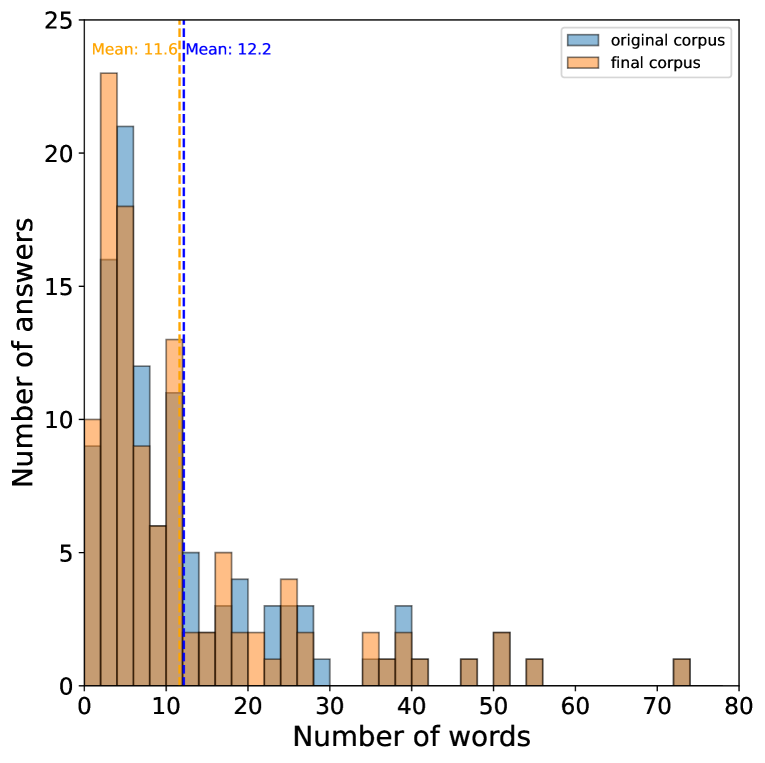
cpgQA: In both the training and test sets, answers were shortened manually by removing extraneous phrases and articles (such as "a/an/the") from the beginning of the responses. After shortening, the mean answer length in the training set reduced from 12.7 words to 12.4 words, whereas for the test set, the mean answer length reduced from 12.1 words to 11.6 words. The minimal difference in the mean number of words is due to the fact that most answers in the original dataset were clear and concise.
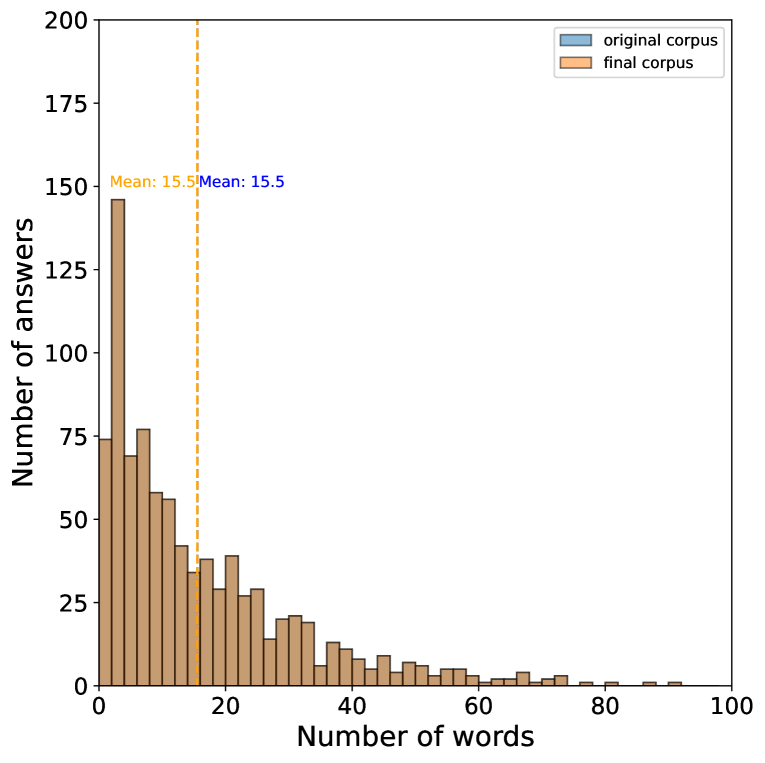
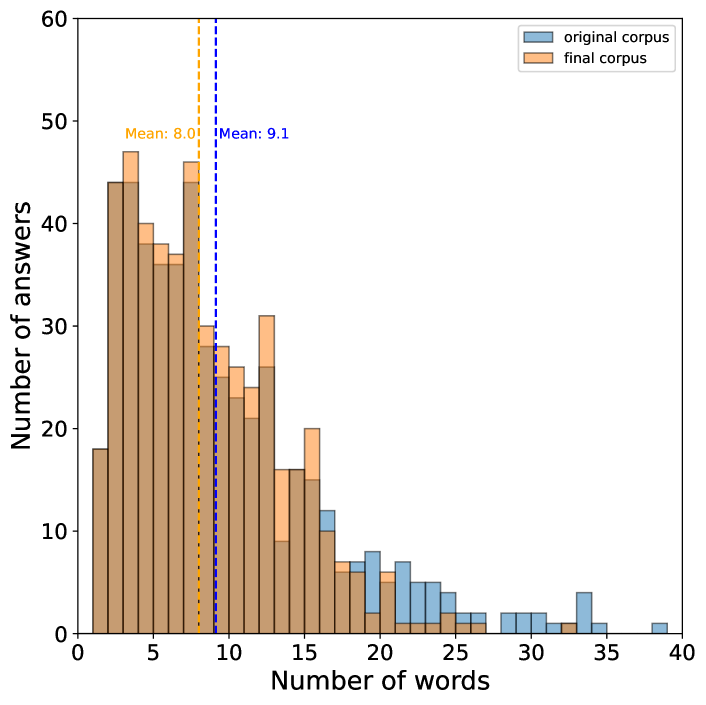
sleepQA: The initial average answer lengths for the sleepQA dataset are 10.15 and 9.13 for the train and test set respectively, making it the dataset with the shortest average answer length among all datasets studied. We focused on cutting down answers more than 15 words long, which range up to 40 words long. The was done by extracting the main phrases of the answers that directly respond to the associated questions. The resulting cleaned answers are in the form of shorter, more concise phrases instead of wordy full sentences. The final average answer lengths after the cleaning process are 9.11 and 8.01 for the train and test set respectively.
Appendix B Evaluation
B.1 Model Hyperparameters
Hyperparameters of retrieval models fine-tuning are shown in Table 6, and of reader models in Table 7. When fine-tuning retrieval models on training sets in which method of selecting the negative contexts for each passage was enhanced, we changed other negatives hyperparameters to reflect the number of negative contexts in the corresponding training set (e.g., 1 to 5). Additionally, when fine-tuning reader models on different datasets, we set eval step to 50 for BioASQ, COVID-QA and cpgQA datasets and 500 for the SleepQA dataset. The reason behind this is because the SleepQA dataset has 4,000 labels in the train set, while the other datasets have less than 1,000 labels. For continual retrieval fine-tuning, we set the num train epochs to 60, and for reader to 30. Other parameters were left the same.
| Hyperparameter | Value |
|---|---|
| batch size | 32 |
| dev batch size | 32 |
| adam eps | |
| adam betas | (0.9, 0.999) |
| max grad norm | 1.0 |
| log batch step | 100 |
| train rolling loss step | 100 |
| weight decay | 0.0 |
| learning rate | |
| warmup steps | 100 |
| gradient accumulation steps | 1 |
| num train epochs | 30/60* |
| eval per epoch | 1 |
| hard negatives | 0 |
| other negatives | 1(2,3,4,5)* |
| val av rank hard neg | 0 |
| val av rank other neg | 10 |
| val av rank bsz | 128 |
| val av rank max qs | 10000 |
| Hyperparameter | Value |
|---|---|
| eval step | 50/500* |
| batch size | 32 |
| dev batch size | 32 |
| adam eps | |
| adam betas | (0.9, 0.999) |
| max grad norm | 1.0 |
| log batch step | 100 |
| train rolling loss step | 100 |
| weight decay | 0.0 |
| learning rate | |
| warmup steps | 0 |
| gradient accumulation steps | 1 |
| num train epochs | 10/30* |
| Methods | BioASQ | COVID-QA | cpgQA | SleepQA |
|---|---|---|---|---|
| baseline | 25.0 | 42.5 | 66.4 | 46.8 |
| BertScore (1 neg) | 31.2 | 41.6 | 66.4 | 47.2 |
| BertScore (2 neg) | 28.1 | 48.7 | 67.3 | 45.8 |
| BertScore (3 neg) | 32.3 | 45.1 | 67.3 | 47.4 |
| BertScore (4 neg) | 29.2 | 45.1 | 63.6 | 46.6 |
| BertScore (5 neg) | 30.2 | 48.7 | 61.8 | 48.4 |
| generation time | 1.3 | 1.3 | 0.7 | 28.3 |
B.2 Negative Contexts
Using the enhanced method of selecting negative contexts, we produced five different training sets for each dataset (see Table 8). Although generally, this method produced enhanced training sets for each dataset, it is not possible to conclude which number of negatives improved the fine-tuning process the best, as this is very much dataset-specific. The last row in Table 8 shows the time (in hours) needed to generate all five training sets for each dataset using A100 GPU 40GB. While for most of the datasets, the generation process took around one hour, for SleepQA it took more than one day.
B.3 Paraphrasing
For question paraphrasing, we used T5 and Pegasus as they are based on Transformer architecture and utilize transfer learning, in which resource-rich sources can be efficiently adapted for resource-poor target fields, such as the domain-specific datasets Yu et al. (2018).
| Methods | set 1 | set 2 | set 3 | set 4 | set 5 | set 6 |
|---|---|---|---|---|---|---|
| BioASQ (T5) | 0.997 | 0.991 | 0.979 | 0.962 | 0.927 | 0.970 |
| BioASQ (Pegasus) | 0.953 | 0.932 | 0.917 | 0.886 | 0.846 | 0.903 |
| COVID-QA (T5) | 0.996 | 0.987 | 0.970 | 0.949 | 0.904 | 0.959 |
| COVID-QA (Pegasus) | 0.959 | 0.940 | 0.918 | 0.890 | 0.849 | 0.909 |
| cpgQA (T5) | 0.995 | 0.987 | 0.973 | 0.954 | 0.920 | 0.967 |
| cpgQA (Pegasus) | 0.960 | 0.946 | 0.930 | 0.910 | 0.883 | 0.925 |
| SleepQA (T5) | 0.996 | 0.985 | 0.969 | 0.947 | 0.906 | 0.960 |
| SleepQA (Pegasus) | 0.974 | 0.957 | 0.938 | 0.915 | 0.880 | 0.933 |
Previous research showed that the Pegasus method produces paraphrases that are semantically more different, while the T5 method is found to keep more of the original meaning Martín Galván et al. (2023). We found that the Pegasus consistently produces the same set of paraphrased questions, regardless of the number generated. For T5, we generated paraphrased questions up to 50 times, after which we took the first five unique paraphrases. For several questions (between 3% for cpgQA dataset and 12% for COVID-QA dataset), T5 failed to produce the required number of unique paraphrases, for which cases we added the original question to the set of five paraphrased questions. Although we used two different libraries, question paraphrasing failed to enhance training set quality for cpgQA dataset altogether. Generating training sets took around 15 hours for SleepQA dataset and 3 hours for other datasets on one NVIDIA TESLA P100 GPU 16GB (Kaggle).
| Methods | set 1 | set 2 | set 3 | set 4 | set 5 | set 6 |
|---|---|---|---|---|---|---|
| BioASQ (T5) | 25.0 | 29.2 | 26.0 | 26.0 | 24.0 | 24.0 |
| BioASQ (Pegasus) | 28.1 | 31.2 | 31.2 | 29.2 | 31.2 | 30.2 |
| COVID-QA (T5) | 49.6 | 48.7 | 44.2 | 47.8 | 46.0 | 54.0 |
| COVID-QA (Pegasus) | 45.1 | 44.2 | 43.4 | 43.4 | 46.9 | 46.9 |
| cpgQA (T5) | 65.5 | 65.5 | 65.5 | 66.4 | 65.5 | 66.4 |
| cpgQA (Pegasus) | 63.6 | 62.7 | 60.0 | 62.7 | 65.5 | 69.0 |
| SleepQA (T5) | 43.6 | 46.6 | 42.4 | 46.4 | 44.2 | 43.6 |
| SleepQA (Pegasus) | 43.2 | 39.8 | 45.0 | 39.0 | 38.0 | 41.0 |
B.4 Word Substitution
Word substitution is the process of substituting similar words (such as synonyms or words with similar embeddings) from the original data Pappas et al. (2022). This method for enhancing the original training sets increased almost all recall@1/EM scores for all datasets for both retrieval/reader fine-tuning, except for the reader models for cpgQA and COVID-QA datasets. In cases where applying word substitution on the original dataset did not increase the EM scores for the reader fine-tuning, the scores stayed the same as the corresponding baselines (i.e., this method did not worsen them). Moreover, the generation of training sets took only 11 minutes for SleepQA dataset and around two minutes for other datasets on one NVIDIA TESLA P100 GPU 16GB (Kaggle).
| Methods | set 1 | set 2 | set 3 | set 4 | set 5 | set 6 |
|---|---|---|---|---|---|---|
| BioASQ (T5) | 4.2 | 6.2 | 4.2 | 3.1 | 6.2 | 4.2 |
| BioASQ (Pegasus) | 6.2 | 7.3 | 7.3 | 6.2 | 6.2 | 6.2 |
| COVID-QA (T5) | 21.2 | 19.5 | 20.4 | 23.9 | 20.4 | 19.5 |
| COVID-QA (Pegasus) | 22.1 | 18.6 | 18.6 | 20.4 | 23.0 | 19.5 |
| cpgQA (T5) | 50.9 | 49.1 | 48.2 | 50.9 | 48.2 | 50.0 |
| cpgQA (Pegasus) | 46.4 | 46.4 | 47.3 | 44.5 | 46.4 | 49.1 |
| SleepQA (T5) | 57.4 | 57.6 | 58.2 | 58.4 | 58.8 | 58.2 |
| SleepQA (Pegasus) | 58.2 | 57.8 | 58.0 | 58.2 | 57.2 | 59.0 |
| Datasets | set 1 | set 2 | set 3 | set 4 | set 5 | set 6 |
|---|---|---|---|---|---|---|
| BioASQ | 0.999 | 0.998 | 0.997 | 0.996 | 0.994 | 0.997 |
| COVID-QA | 0.997 | 0.996 | 0.995 | 0.993 | 0.988 | 0.993 |
| cpgQA | 0.998 | 0.997 | 0.996 | 0.994 | 0.989 | 0.995 |
| SleepQA | 0.996 | 0.993 | 0.992 | 0.990 | 0.986 | 0.991 |
| Datasets | set 1 | set 2 | set 3 | set 4 | set 5 | set 6 |
|---|---|---|---|---|---|---|
| BioASQ | 28.1 | 24.0 | 28.1 | 27.1 | 30.2 | 21.9 |
| COVID-QA | 49.6 | 49.6 | 50.4 | 46.9 | 48.7 | 48.7 |
| cpgQA | 63.6 | 68.2 | 67.3 | 69.1 | 67.3 | 66.4 |
| SleepQA | 45.8 | 48.4 | 46.4 | 46.8 | 43.0 | 46.0 |
| Datasets | set 1 | set 2 | set 3 | set 4 | set 5 | set 6 |
|---|---|---|---|---|---|---|
| BioASQ | 5.2 | 6.2 | 5.2 | 5.2 | 6.2 | 6.2 |
| COVID-QA | 21.2 | 21.2 | 21.2 | 22.1 | 21.2 | 19.5 |
| cpgQA | 50.0 | 50.0 | 50.9 | 50.0 | 50.9 | 50.9 |
| SleepQA | 57.8 | 58.6 | 58.8 | 59.4 | 58.0 | 58.0 |
B.5 Back Translation
The main idea behind back translation method is to use machine translation from a source to a pivot language and back, obtaining paraphrases. In total, we generated 25 different training sets for Spanish (es), French (fr), German (de), Russian (ru), Chinese (zh), Arabic (ar), Dutch (nl), Finnish (fi), Hungarian (hu), Multiple Languages (mul), Ukrainian (uk), Hindi (hi), Danish (da), Czech (cs), Romance Languages (roa), Bulgarian (bg), Catalan (ca), Afrikaans (af), Estonian (et), Turkic Languages (trk), Slavik Languages (sla), Indonesian (id), Slovak (sk), Tagalog (tl), and Kinyarwanda (rw) pivot languages. Back translation has been used as a data augmentation method for several different NLP tasks Feng et al. (2021); Shorten et al. (2021). Generally, it produced the best results for BioASQ dataset. The generation of training sets took 10 hours for SleepQA dataset and around two hours for other datasets on one NVIDIA TESLA P100 GPU 16GB (Kaggle). Results are in Table 15 and Table 16.
| Methods | BioASQ | COVID-QA | cpgQA | SleepQA |
|---|---|---|---|---|
| en-es-en | 31.2 | 48.7 | 62.7 | 45.4 |
| en-fr-en | 29.2 | 47.8 | 60.9 | 44.8 |
| en-de-en | 27.1 | 45.1 | 61.8 | 41.6 |
| en-ru-en | 31.2 | 40.7 | 54.5 | 39.8 |
| en-zh-en | 30.2 | 46.9 | 61.8 | 42.2 |
| en-ar-en | 30.2 | 49.6 | 56.4 | 41.2 |
| en-nl-en | 31.2 | 40.7 | 64.5 | 44.8 |
| en-fi-en | 27.1 | 48.7 | 61.8 | 40.6 |
| en-hu-en | 29.2 | 49.6 | 66.4 | 41.6 |
| en-mul-en | 25.0 | 43.4 | 57.3 | 39.4 |
| en-uk-en | 28.1 | 45.1 | 64.5 | 40.8 |
| en-hi-en | 27.1 | 44.2 | 59.1 | 38.4 |
| en-da-en | 29.2 | 44.2 | 60.0 | 43.8 |
| en-cs-en | 27.1 | 43.4 | 63.6 | 45.8 |
| en-roa-en | 29.2 | 47.8 | 60.9 | 42.0 |
| en-bg-en | 29.2 | 43.4 | 58.2 | 40.0 |
| en-ca-en | 33.3 | 41.6 | 60.0 | 41.2 |
| en-af-en | 30.2 | 46.9 | 61.8 | 37.2 |
| en-et-en | 29.2 | 46.0 | 58.2 | 40.2 |
| en-trk-en | 18.8 | 23.9 | 35.5 | 19.6 |
| en-sla-en | 25.0 | 45.1 | 63.6 | 43.6 |
| en-id-en | 30.2 | 47.8 | 63.6 | 40.4 |
| en-sk-en | 30.2 | 48.7 | 57.3 | 44.2 |
| en-tl-en | 30.2 | 41.6 | 64.5 | 40.8 |
| en-rw-en | 28.1 | 29.2 | 50.0 | 34.4 |
| Methods | BioASQ | COVID-QA | cpgQA | SleepQA |
|---|---|---|---|---|
| en-es-en | 4.2 | 21.2 | 40.0 | 58.2 |
| en-fr-en | 6.2 | 20.4 | 45.5 | 58.4 |
| en-de-en | 7.3 | 21.2 | 46.4 | 57.4 |
| en-ru-en | 3.1 | 18.6 | 45.5 | 58.4 |
| en-zh-en | 6.2 | 21.2 | 43.6 | 58.8 |
| en-ar-en | 5.2 | 23.0 | 44.5 | 58.2 |
| en-nl-en | 7.3 | 21.2 | 45.5 | 57.6 |
| en-fi-en | 6.2 | 20.4 | 44.5 | 58.0 |
| en-hu-en | 6.2 | 19.5 | 43.6 | 58.2 |
| en-mul-en | 3.1 | 19.5 | 43.6 | 57.0 |
| en-uk-en | 6.2 | 18.6 | 40.9 | 59.4 |
| en-hi-en | 5.2 | 20.4 | 40.9 | 57.4 |
| en-da-en | 6.2 | 23.0 | 43.6 | 59.4 |
| en-cs-en | 4.2 | 19.5 | 43.6 | 58.0 |
| en-roa-en | 6.2 | 18.6 | 43.6 | 57.6 |
| en-bg-en | 6.2 | 21.2 | 43.6 | 59.2 |
| en-ca-en | 5.2 | 18.6 | 43.6 | 58.2 |
| en-af-en | 7.3 | 20.4 | 44.5 | 59.0 |
| en-et-en | 6.2 | 20.4 | 43.6 | 58.0 |
| en-trk-en | 4.2 | 15.9 | 39.1 | 56.4 |
| en-sla-en | 6.2 | 18.6 | 44.5 | 57.6 |
| en-id-en | 3.1 | 17.7 | 44.5 | 57.2 |
| en-sk-en | 5.2 | 21.2 | 44.5 | 58.6 |
| en-tl-en | 4.2 | 22.1 | 46.4 | 58.4 |
| en-rw-en | 5.2 | 17.7 | 40.0 | 56.2 |
B.6 Mean and Standard Deviation
Table 17 shows the mean and standard deviation for different data quality enhancement methods for retrieval fine-tuning. Table 18 shows the mean and standard deviation for different data quality enhancement methods for reader fine-tuning.
| Methods | BioASQ | COVID-QA | cpgQA | SleepQA |
|---|---|---|---|---|
| negatives | ||||
| paraphrasing (T5) | ||||
| paraphrasing (Pegasus) | ||||
| substitution | ||||
| translation |
| Methods | BioASQ | COVID-QA | cpgQA | SleepQA |
|---|---|---|---|---|
| paraphrasing (T5) | ||||
| paraphrasing (Pegasus) | ||||
| substitution | ||||
| translation |
B.7 Similarity Between Enhancement Methods
In the following tables, we show the average similarity computed with ROUGE-1 metric between questions generated through each of the enhancement techniques, over all four datasets {BioASQ,CovidQA,cpgQA,SleepQA}, with Retrieval (first four tables) then Reader (next four).
| \collectcellBase.\endcollectcell | \collectcellPara/PG\endcollectcell | \collectcellPara/T5\endcollectcell | \collectcellSubst.\endcollectcell | \collectcellTransl.\endcollectcell | |
|---|---|---|---|---|---|
| Base. | \collectcell 1 00.0\endcollectcell | ||||
| Para/PG | \collectcell 8 0.44\endcollectcell | \collectcell 1 00.0\endcollectcell | |||
| Para/T5 | \collectcell 9 1.49\endcollectcell | \collectcell 7 6.73\endcollectcell | \collectcell 1 00.0\endcollectcell | ||
| Subst. | \collectcell 9 5.11\endcollectcell | \collectcell 7 6.25\endcollectcell | \collectcell 8 6.98\endcollectcell | \collectcell 1 00.0\endcollectcell | |
| Transl. | \collectcell 5 7.68\endcollectcell | \collectcell 5 1.10\endcollectcell | \collectcell 5 6.98\endcollectcell | \collectcell 5 5.01\endcollectcell | \collectcell 1 00.0\endcollectcell |
| \collectcell Base. | \collectcell Para/PG | \collectcell Para/T5 | \collectcell Subst. | \collectcell Transl. | |
|---|---|---|---|---|---|
| Base. | \collectcell 1 00.0\endcollectcell | ||||
| Para/PG | \collectcell 7 4.63\endcollectcell | \collectcell 1 00.0\endcollectcell | |||
| Para/T5 | \collectcell 8 3.33\endcollectcell | \collectcell 6 6.06\endcollectcell | \collectcell 1 00.0\endcollectcell | ||
| Subst. | \collectcell 9 5.33\endcollectcell | \collectcell 7 0.89\endcollectcell | \collectcell 7 9.73\endcollectcell | \collectcell 1 00.0\endcollectcell | |
| Transl. | \collectcell 7 6.44\endcollectcell | \collectcell 6 2.60\endcollectcell | \collectcell 6 9.50\endcollectcell | \collectcell 7 2.97\endcollectcell | \collectcell 1 00.0\endcollectcell |
| \collectcell Base. | \collectcell Para/PG | \collectcell Para/T5 | \collectcell Subst. | \collectcell Transl. | |
|---|---|---|---|---|---|
| Base. | \collectcell 1 00.0\endcollectcell | ||||
| Para/PG | \collectcell 7 1.08\endcollectcell | \collectcell 1 00.0\endcollectcell | |||
| Para/T5 | \collectcell 8 0.96\endcollectcell | \collectcell 6 2.79\endcollectcell | \collectcell 1 00.0\endcollectcell | ||
| Subst. | \collectcell 9 4.62\endcollectcell | \collectcell 6 7.01\endcollectcell | \collectcell 7 6.93\endcollectcell | \collectcell 1 00.0\endcollectcell | |
| Transl. | \collectcell 7 1.06\endcollectcell | \collectcell 5 8.85\endcollectcell | \collectcell 6 4.82\endcollectcell | \collectcell 6 7.36\endcollectcell | \collectcell 1 00.0\endcollectcell |
| \collectcell Base. | \collectcell Para/PG | \collectcell Para/T5 | \collectcell Subst. | \collectcell Transl. | |
|---|---|---|---|---|---|
| Base. | \collectcell 1 00.0\endcollectcell | ||||
| Para/PG | \collectcell 7 7.43\endcollectcell | \collectcell 1 00.0\endcollectcell | |||
| Para/T5 | \collectcell 8 6.30\endcollectcell | \collectcell 7 0.98\endcollectcell | \collectcell 1 00.0\endcollectcell | ||
| Subst. | \collectcell 9 2.95\endcollectcell | \collectcell 7 1.09\endcollectcell | \collectcell 7 9.79\endcollectcell | \collectcell 1 00.0\endcollectcell | |
| Transl. | \collectcell 7 9.05\endcollectcell | \collectcell 6 5.98\endcollectcell | \collectcell 7 3.53\endcollectcell | \collectcell 7 3.20\endcollectcell | \collectcell 1 00.0\endcollectcell |
| \collectcell Base. | \collectcell Para/PG | \collectcell Para/T5 | \collectcell Subst. | \collectcell Transl. | |
|---|---|---|---|---|---|
| Base. | \collectcell 1 00.0\endcollectcell | ||||
| Para/PG | \collectcell 8 0.44\endcollectcell | \collectcell 1 00.0\endcollectcell | |||
| Para/T5 | \collectcell 9 1.49\endcollectcell | \collectcell 7 6.73\endcollectcell | \collectcell 1 00.0\endcollectcell | ||
| Subst. | \collectcell 9 7.71\endcollectcell | \collectcell 7 8.51\endcollectcell | \collectcell 8 9.46\endcollectcell | \collectcell 1 00.0\endcollectcell | |
| Transl. | \collectcell 8 6.72\endcollectcell | \collectcell 7 2.32\endcollectcell | \collectcell 8 2.66\endcollectcell | \collectcell 8 4.86\endcollectcell | \collectcell 1 00.0\endcollectcell |
| \collectcell Base. | \collectcell Para/PG | \collectcell Para/T5 | \collectcell Subst. | \collectcell Transl. | |
|---|---|---|---|---|---|
| Base. | \collectcell 1 00.0\endcollectcell | ||||
| Para/PG | \collectcell 7 2.11\endcollectcell | \collectcell 1 00.0\endcollectcell | |||
| Para/T5 | \collectcell 8 3.33\endcollectcell | \collectcell 6 4.65\endcollectcell | \collectcell 1 00.0\endcollectcell | ||
| Subst. | \collectcell 9 3.84\endcollectcell | \collectcell 6 7.50\endcollectcell | \collectcell 7 8.59\endcollectcell | \collectcell 1 00.0\endcollectcell | |
| Transl. | \collectcell 6 6.01\endcollectcell | \collectcell 5 4.99\endcollectcell | \collectcell 6 0.87\endcollectcell | \collectcell 6 1.55\endcollectcell | \collectcell 1 00.0\endcollectcell |
| \collectcell Base. | \collectcell Para/PG | \collectcell Para/T5 | \collectcell Subst. | \collectcell Transl. | |
|---|---|---|---|---|---|
| Base. | \collectcell 1 00.0\endcollectcell | ||||
| Para/PG | \collectcell 7 9.46\endcollectcell | \collectcell 1 00.0\endcollectcell | |||
| Para/T5 | \collectcell 8 6.09\endcollectcell | \collectcell 7 2.62\endcollectcell | \collectcell 1 00.0\endcollectcell | ||
| Subst. | \collectcell 9 5.58\endcollectcell | \collectcell 7 5.34\endcollectcell | \collectcell 8 2.15\endcollectcell | \collectcell 1 00.0\endcollectcell | |
| Transl. | \collectcell 8 0.67\endcollectcell | \collectcell 6 8.91\endcollectcell | \collectcell 7 5.40\endcollectcell | \collectcell 7 7.41\endcollectcell | \collectcell 1 00.0\endcollectcell |
| \collectcell Base. | \collectcell Para/PG | \collectcell Para/T5 | \collectcell Subst. | \collectcell Transl. | |
|---|---|---|---|---|---|
| Base. | \collectcell 1 00.0\endcollectcell | ||||
| Para/PG | \collectcell 6 8.15\endcollectcell | \collectcell 1 00.0\endcollectcell | |||
| Para/T5 | \collectcell 8 5.57\endcollectcell | \collectcell 6 2.76\endcollectcell | \collectcell 1 00.0\endcollectcell | ||
| Subst. | \collectcell 9 0.92\endcollectcell | \collectcell 6 1.59\endcollectcell | \collectcell 7 7.38\endcollectcell | \collectcell 1 00.0\endcollectcell | |
| Transl. | \collectcell 6 3.06\endcollectcell | \collectcell 5 1.40\endcollectcell | \collectcell 5 9.00\endcollectcell | \collectcell 5 7.15\endcollectcell | \collectcell 1 00.0\endcollectcell |