Resolving nonlinear recombination dynamics in semiconductors via ultrafast excitation correlation spectroscopy: Photoluminescence versus photocurrent detection
Abstract
We explore the application of excitation correlation spectroscopy to detect nonlinear photophysical dynamics in two distinct semiconductor classes through time-integrated photoluminescence and photocurrent measurements. In this experiment, two variably delayed femtosecond pulses excite the semiconductor, and the time-integrated photoluminescence or photocurrent component arising from the nonlinear dynamics of the populations induced by each pulse is measured as a function of inter-pulse delay by phase-sensitive detection with a lock-in amplifier. We focus on two limiting materials systems with contrasting optical properties: a prototypical lead-halide perovskite (LHP) solar cell, in which primary photoexcitations are charge photocarriers, and a single-component organic-semiconductor diode, which features Frenkel excitons as primary photoexcitations. The photoexcitation dynamics perceived by the two detection schemes in these contrasting systems are distinct. Nonlinear-dynamic contributions in the photoluminescence detection scheme arise from contributions to radiative recombination in both materials systems, while photocurrent arises directly in the LHP but indirectly following exciton dissociation in the organic system. Consequently, the basic photophysics of the two systems are reflected differently when comparing measurements with the two detection schemes. Our results indicate that photoluminescence detection in the LHP system provides valuable information about trap-assisted and Auger recombination processes, but that these processes are convoluted in a non-trivial way in the photocurrent response and are therefore difficult to differentiate. In contrast, the organic-semiconductor system exhibits more directly correlated responses in the nonlinear photoluminescence and photocurrent measurements, as charge carriers are secondary excitations only generated through exciton dissociation processes. We propose that bimolecular annihilation pathways mainly contribute to the generation of charge carriers in single-component organic semiconductor devices. Overall, our work highlights the utility of excitation correlation spectroscopy in modern semiconductor materials research, particularly in the analysis of nonlinear photophysical processes, which are deterministic for their electronic and optical properties.
Molecular Engineering & Sciences Institute, University of Washington, Seattle, WA 98195, United States
\alsoaffiliationSchool of Physics, Georgia Institute of Technology, Atlanta, GA 30332, United States
\alsoaffiliationSchool of Materials Science and Engineering, Georgia Institute of Technology, Atlanta, GA 30332, United States
{tocentry}
![[Uncaptioned image]](/html/2304.00390/assets/Figures/TOC.png)
1 Introduction
Probing photoexcitation dynamics is a cornerstone of materials characterization in optoelectronics. Photoexcitations may undergo radiative recombination, defect trapping/detrapping, and high-order processes such as bimolecular and Auger recombination, among others. These recombination dynamics often give rise to a nonlinear response with respect to photoexcitation density, and in turn, they can be determined by resolving time-dependent populations. Researchers commonly probe the nonlinear response using intensity-dependent (i) steady-state photoluminescence and photocurrent experiments, in which a deviation of the signal from a linear response, is observed 1, (ii) time-resolved photoluminescence 2, 3 or (iii) transient absorption spectroscopies 4, 5, 6. However, delimiting the distinct nonlinear regimes can be ambiguous between these techniques, and may become complex as the system’s components increase. Originally described by von der Linde and Rosen 7, 8, excitation correlation (EC) spectroscopy provides the means to characterize the nonlinear response with great sensitivity as it is based on double amplitude modulation and phase-sensitive detection. In addition, it maps the time evolution of nonlinear contributions. In EC spectroscopy, we amplitude-modulate two replica ultrafast pulses at frequencies and , such that demodulating at a reference frequency using lock-in detection isolates the nonlinear component. EC spectroscopy has been widely used to characterize the carrier lifetimes of several inorganic semiconductors 9, 10, 11, 12, 13. Despite its utility, neither the organic nor the lead halide perovskite (LHP) semiconductor community uses it as a routine technique. Only recently, Srimath Kandada et al. employed it to describe the defect density and energetic depth in \ceCH3NH3PbBr3 thin films and \ceCsPbBr3 nanocrystals 14. The Moran group presented a variation of the EC spectroscopy, utilizing a tunable narrow excitation wavelength to characterize layered perovskite quantum-well structures 15, 16, 17. We have previously implemented ECPL to describe defect states in mix-halide mix-cation metal halide perovskites 18, 19.
In this article, we implement EC spectroscopy with both photoluminescence (PL) and photocurrent (PC) detection to characterize the nonlinear response of two photodiodes, a LHP in a solar cell, and an organic semiconductor single-component vertical diode. We describe in detail the interpretation of EC signatures using simplified kinetic recombination models that exemplify the class of nonlinear dynamics in these materials systems. First, we discuss the typical photophysical processes that result in ECS signals for the case of LHP. We show that trap-assisted and Auger recombination dominate the nonlinear response of LHP devices in PL detection (ECPL) at low and high fluence, respectively. In PC detection (ECPC) the nonlinear components are due to bimolecular and Auger recombination, however, these contributions cannot be easily distinguished with this detection scheme. We also describe the photophysical scenario of the organic semiconductor diode leading to ECS signal. In this case, where the primary excitation is a Frenkel exciton, and charge carriers are not directly injected, ECPL and ECPC provide complementary information about the population evolution of excitons and charges.
2 Results
2.1 Nonlinear dynamics in lead-halide perovskites
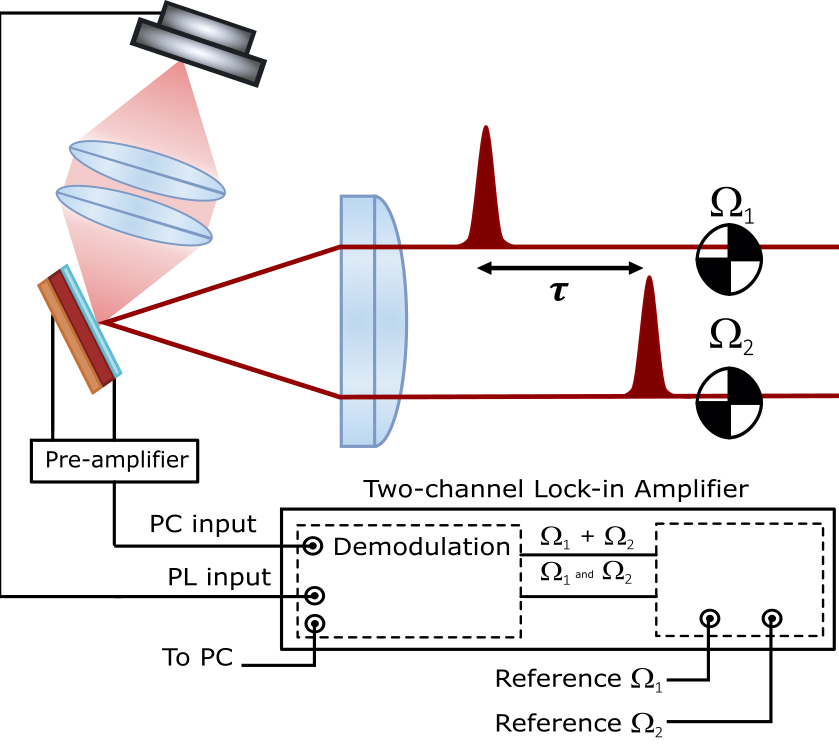
We prepared inverted devices with a mixed-cation mixed-halide perovskite of composition \ceFA_0.83Cs_0.17Pb(I_0.85Br_0.15)_3 referred to in the text as Cs17Br15, where \ceFA+ refers to the formamidinium cation. Fig. S1(a), in Supplementary Material, shows the linear absorption and PL spectra of a Cs17Br15 film on ITO/MeO-2PACz. Our supplementary material and previous work 19 provide further details on the device structure and characterization. Briefly, these films and fabrication procedures yield performance of around 15.90% power conversion efficiency for the best devices. The external quantum efficiency (EQE) measurement is shown in Fig. S2 in Supplementary Material. We emphasize that we perform both ECPL and ECPC on completed device stacks, with typical PL quantum yields in the range of 0.8%. To perform ECPL and ECPC, we excite the sample with a 220 fs pulse with an energy of 2.638 eV and variable fluence between 1 and 40 J cm-2. A schematic representation of the EC experiment is represented in Fig. 1, and more details about our implementation are described in the appendix.
Because metal-halide hybrid perovskites are direct bandgap semiconductors, their recombination kinetics involve photocarriers undergoing second-order (bimolecular) radiative recombination of electrons and holes, pseudo-first order radiative recombination of photogenerated minority carriers with the majority carriers, first-order deep-trap assisted non-radiative recombination, and third-order Auger recombination 20, 21, 22. These terms are well described by equations 1, 2 and 3, where is the bimolecular rate constant, the carrier trapping rate constant, the trap recombination rate constant, and the Auger recombination rate constant. Additionally, and correspond to empty and occupied trap sites. The generation of electrons and holes is assumed to be direct, then their generation populations are considered as initial conditions when solving the differential equations. Note that we do not take into account non-geminate association and dissociation of excitons explicitly since it does not add a distinct recombination order, and additionally, excitons are not generated, nor stable at room temperature 23.
| (1) |
| (2) |
| (3) |
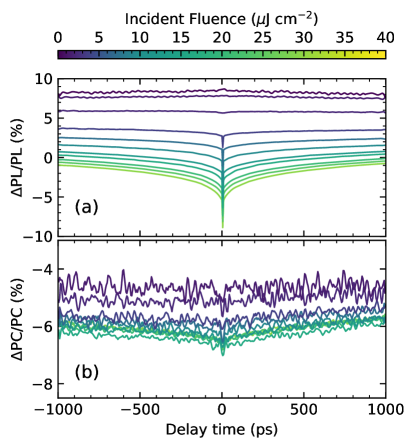
A distinct model assuming shallow donors has been used to describe \ceCH3NH3PbBr3 14, where shallow traps dope the semiconductor. Based on this model, we expect to observe positive subnanosecond dynamics due to fast trapping in shallow traps, accompanied by an increase in the ECPL response as the excitation fluence increases. However, this model does not apply to the Cs17Br15 devices in our study, as discussed below. The ECPL and ECPC measurements are shown in Fig. 2(a) and Fig. 2(b), respectively. The time traces show the percentage of the nonlinear signal recovery as we scan the delay between the two pulses, the symmetry between the negative and positive delays indicates that the pulses had a comparable intensity. For the ECPL, At low fluence, we observe a nonlinear response with slow dynamics. The magnitude of the nonlinear response decreases as the fluence increases until it changes sign at the highest fluences. We rule out the shallow donor model as these experimental signatures do not match the model’s prediction that Kandada et al. described in Ref 14. The ECPL signal in Fig 2(a), shows two distinct regimes: at low fluence, a slow positive trace, and at high fluence, a fast negative nonlinearity. In contrast, the ECPC response, shown in Fig. 2(b), shows only negative contributions, with no change in the sign of the signal as the fluence increases. To rationalize the information provided by each technique, we interpret the EC measurements of LHPs in terms of the recombination model. Equations 1, 2 and 3 do not have an analytical solution. However, by making a series of assumptions described below we can understand the contributions of the specific processes to the nonlinear photoluminescence and photocurrent.
2.1.1 Trap-Assisted Recombination
We follow the assumptions made by previous works on trap-assisted recombination 24, 9. Specifically, we assume that we are working at low excitation density, such that Auger recombination does not dominate and can be neglected. Additionally, in materials with low PL quantum yield, as is the case for LHPs, nonradiative trap-assisted pathways typically dominate the carrier recombination such that . Consequently, there is an approximate solution for the electron and hole densities, which reads as:
| (4) | |||
| (5) |
We will discuss first the case of ECPL. The detected PL is defined in equation 6. The temporal function describing carriers generated by each pulse is assumed to be a delta function. We then split the integral describing the total PL intensity in two: one term considering the carriers photoexcited before the second pulse and another one with carriers photoexcited after the second pulse. Here, and correspond to the evolution of the carriers according to equations 4-5 after the first pulse arrives, the initial conditions are simply the carriers generated by the first pulse, . and correspond to the evolution of the carriers after the second pulse. These carrier densities are described with the same expression but with distinct initial conditions, and , as we need to consider residual carriers generated by the first pulse.
| (6) |
After integrating equation 6 and subtracting the individual pulse contributions (), we obtain the nonlinear component of the photoluminescence intensity () given in equation 7. Note that the nonlinear term has a positive value, as expected since trap-filling results in a reduction of non-radiative decay pathways. We note that under these assumptions the follows the same decay as conventional time-resolved experiments. Experimentally, in the ECPL measurements at low fluence shown in Fig. 2(a), we observe a slow decay rate, which is not entirely captured in the time window of the experiment. This is consistent with equation 7, as the typical values for carriers’ lifetimes in LHPs are between the nanosecond and microsecond range. The supplementary material shows the time-resolved photoluminescence experiments in Fig. S3.
| (7) |
We performed a similar analysis for the case of photocurrent detection. The signal measured is defined by equation 8. We ignore the spatial distribution of the carriers and the extraction of carriers for the sake of simplicity. These assumptions affect the magnitude of the nonlinear signal. We interpret the nonlinear photocurrent arising from carriers’ interactions. The time-resolved PL (see Fig S3) indicates that the recombination kinetics in open-circuit and short-circuit conditions are very similar. Therefore, we justify using the same photophysical scenarios to interpret ECPL and ECPC. It is worth remembering that in ECPC the time resolution arises from the delay between the pulse delays instead of from the carrier device extraction. Consequently, we only need the device charge extraction to be faster than the modulation frequency, which is the case by several orders of magnitude.
| (8) |
Under the assumption that trap-assisted recombination dominates at low fluences, the integrands correspond to the monoexponential decay equations . This is a linear function with the excitation density, therefore the nonlinear photocurrent is zero. Trap-assisted recombination does not result in a nonlinear PC response, making ECPC insensitive to traps. However, in the experimental ECPC measurements in Fig. 2(b), the nonlinear component at low fluence is not zero, and it has a negative value. Therefore, as discussed below, higher-order processes such as bimolecular recombination and Auger recombination must be responsible for the observed nonlinear photocurrent.
2.1.2 Bimolecular Recombination
We now consider the case where bimolecular recombination is the dominant recombination pathway. In the Supplementary Material, we show that if , then the ECPL response is zero. This approach of ignoring completely the monomolecular recombination does not give an expression for ECPC as the integrals diverge. To attain an approximate analytical expression for the ECPC response, we assume that both bimolecular recombination, , and monomolecular trapping, , are present. Also, we assume that holes and electrons have similar trapping rates such that . This scenario is described by equation 9, and the corresponding solution for the population evolution is shown in equation 10.
| (9) |
| (10) |
After integrating equation 8 and subtracting the individual pulses contribution (), we obtain an expression (equation 11) that describes the nonlinear photocurrent, , where . Note that in the limiting cases where there is no bimolecular recombination (), the nonlinear contribution to PC is zero, and at a long delay (), the expression also goes to zero as the pulses do not overlap in time. Consequently, we can conclude that the nonlinear photocurrent arises from bimolecular recombination and not from carrier trapping, but the time evolution follows the carrier trapping dynamics.
| (11) |
According to equation 11, the nonlinear PC must have a negative sign, congruent with the experimental results shown in Fig. 2(b). The ECPC measurements, similarly to ECPL, show slow time dynamics, which is expected as they both follow the time evolution of the carrier population. Additionally, note that in this scenario, the ratio between the bimolecular recombination and the carrier trapping rates dictates the magnitude of the nonlinear PC component.
We have neglected the spatial aspect of the carrier dynamics, which is relevant as we excite the sample in a small area of the sample. Carrier dynamics simulations considering carrier diffusion, carrier trapping, and bimolecular recombination, have been carried out by Zhou et al. 17 for perovskite quantum wells. They observe negative decaying nonlinear photocurrent at longer times, congruent with the slow traces shown in Fig. 2(b). So far, we have rationalized the slow dynamics and the sign of the ECPL and ECPC response at low fluences. Experimentally, as we increase the fluence, we observe a change in sign in the ECPL signal (Fig. 2(a)), while the ECPC response increases in magnitude but remains negative. As the fluence increases, Auger recombination becomes more significant and dominates the recombination kinetics. We will now rationalize the effect of Auger recombination in the nonlinear photoluminescence and photocurrent.
2.1.3 Auger Recombination
We next consider the scenario in which the carrier recombination is dominated by Auger scattering, a third-order process that occurs at high carrier density. Again, assuming that holds in the high-fluence regime, we describe the kinetics using the rate equation 12. The solution of this equation is presented in equation 13. Here, corresponds to the monomolecular recombination rate constant, and corresponds to the Auger recombination rate constant.
| (12) |
| (13) |
In this particular case, the expressions for the nonlinear photoluminescence and photocurrent are more complex to evaluate than in the previous scenarios.
In the Supplementary Information, we show that both the photoluminescence and photocurrent exhibit negative nonlinear components due to Auger recombination.
This negative contribution explains the fluence-dependent features that we observe for both ECPL and ECPC.
In ECPL, when we transition from a trap-dominated recombination scenario with a positive nonlinear component to an Auger-recombination-dominated scenario with a negative nonlinear component, a change of sign is expected.
This transition is not expected in ECPC, as both recombination processes (bimolecular and Auger recombination) that result in nonlinear signals lead to negative nonlinear components, making it difficult to distinguish between the two scenarios.
Additionally, we note that the ECPL experiments, Fig. 2(a), show subnanosecond dynamics at the highest fluence (i.e. the sharp decay around zero time delay).
We assign these fast features to a large population of carriers recombining through Auger pathways at early times.
2.1.4 Summary of nonlinear dynamics in lead halide perovskites
In summary, we have described the nonlinear responses caused by the distinct photophysical processes for both photoluminescence and photocurrent. We highlight the possibility of distinguishing between trap-assisted and Auger-dominated recombination regimes employing ECPL, as the contributions to the nonlinear response have opposite signs. The excitation density at which the ECPL signal changes sign indicates a change in the dominant process, which is related to the number of traps, meaning that ECPL is a good technique to characterize trap densities in LHPs. On the other hand, in ECPC, the nonlinear signal arising from bimolecular recombination and Auger recombination have the same sign (negative), monomolecular recombination by itself does not result in a nonlinear signal. Therefore, ECPC does not provide as rich information about trap density as ECPL since the signatures are convoluted and difficult to isolate. Recent work by Zhou et al. 15, 17 explores the implementation of a similar experimental setup to characterize carrier diffusion, this idea is not expanded in this work as large time scales (tens of nanoseconds), that exceed our implementation capabilities, are needed.
2.2 Nonlinear dynamics in organic semiconductors
In organic semiconductors, the primary photoexcitation is a neutral exciton. Charge carriers are generated after the dissociation of the exciton, which can occur through several mechanisms in the neat semiconductor. One such mechanism is the formation of an intermediate charge transfer state prior to charge separation 25, although the precise mechanism for this process is not clear and is certainly not trivial. Another mechanism for exciton dissociation is to overcome the exciton binding energy by promoting the exciton to a higher energy excited state, . This can be achieved by coherent two-step photo-excitation pathways using femtosecond-pulse excitation, described as an excitation from to and subsequently from to . The process generates a high-energy state prone to relaxation to charged excitations (polarons) and triplet-excitons 4, 26, 27. Alternatively, the state can be reached through energy transfer between excitons in a process known as exciton-exciton annihilation 4, 26, 27, 28, this is the mechanism proposed for this work, as discussed below.
The two detection methods used in the EC spectroscopy presented here are each sensitive to different excited-state species produced optically in organic semiconductors. While the charge carriers were both the emissive species and the PC-detected species in lead-halide perovskites, excitons and charges can be observed individually in the neat ITIC-4F devices studied here. Excitons correspond to the detected emissive species (Fig. S1(b)in Supplemental Material), and charges, arising from subsequent exciton dissociation, result in the detected PC. The ECPL experiment then provides insights into the processes leading to exciton recombination, while ECPC provides information on those resulting in charge-carrier generation. In this work, we assess the photophysical processes occurring in neat ITIC-4F. We prepared a single component device with an architecture ITO/ZnO/ITIC-4F/\ceMoO_3/Ag, and measured both ECPL and ECPC. The absorption and PL emission spectra of ITIC-4F are shown in Fig. S1(b) in Supplemental Material. Further details about the device preparation are presented in the Supplementary Material. The pump pulse used for these EC spectroscopy experiments has an energy of 1.823 eV.
2.2.1 Nonlinear photoluminescence
Consider the simple model in equation 14, where the monomolecular rate incorporates all monomolecular processes, including radiative and non-radiative relaxation pathways, and is the bimolecular exciton annihilation rate. This model is mathematically equivalent to the equation 9 discussed for LHPs. As shown above, equation 14 can be solved analytically and leads to the expression for the nonlinear photoluminescence shown in equation 15. We define equivalently.
| (14) |
| (15) |
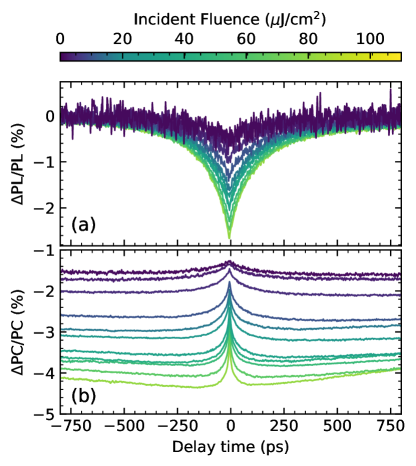
Fig. 3(a) shows the experimental ECPL response for a range of fluences between 1 and 100 J cm-2. It can be observed that the magnitude of the nonlinear response increases with fluence as expected since exciton-exciton annihilation becomes more significant as the exciton density increases. By fitting the measured traces to equation 15, we extracted a value of monomolecular recombination rate of s-1. We extract the bimolecular rate using the experimental setup discussed by Riley et al. in Ref. 3 and obtained a value of cm3 s-1, similar to those reported previously in the literature 3. A summary of the analysis and fitted data are shown in Supplementary Material. In the experimental configuration of Ref. 3, the material is excited with a single pulse whose amplitude is modulated by a mechanical chopper. The bimolecular exciton-exciton rate was obtained after analyzing the fluence dependence of photoluminescence intensity.
In this section, by using a simple model including monomolecular and exciton-exciton recombination, we show that ECPL follows the excitons population time evolution through the nonlinear photoluminescence generated in organic semiconducting materials. More complex scenarios involving coexisting excitonic species have been analyzed previously 11, 13. In those cases, the additional exciton dynamics afflict the spectral integrated response, as the one measured in our work. Spectrally resolving the signal is necessary to distinguish nonlinear dynamics from distinct emissive species with similar emission energy.
2.2.2 Nonlinear photocurrent
To interpret the photocurrent response in organic semiconductors, we will focus on a simple model for charge carrier population dynamics described by equation 16. In this model, the photocarriers are generated through the function which depends on the photophysical process that results in charges. We acknowledge that the generation of photocarriers in neat organic semiconductors, and a complete description of their dynamics, is a complex problem and that multiple techniques are needed to provide a robust physical picture. However, in this work, we focus on the contributions that ECS can bring to the field, and thus we provide our hypothesis of the photophysical scenario in this materials class.
In our simplified model, we assume that the dynamics of electron and hole carriers are comparable, which is very likely as the system is not doped. Additionally, is the monomolecular decay rate of the carriers and is the non-geminate recombination rate. Note that equation 16 is similar to equations 9 and 14. From this, we can deduce that the nonlinear photocurrent (ECPC) will have a negative sign due to the non-geminate recombination experienced by the carriers and that the time trace will follow the carrier’s time evolution. In this case, however, we need to consider a time-dependent generation term. We cannot assume it to be a delta function. This makes an analytical solution challenging.
| (16) |
Experimentally, in the ECPC response, shown in Figs. 3(b) and 4(b), we observe a “rising” feature. We interpret this feature as the generation time of charge carriers. Note that as the incident fluence increases, the generation rate increases as well. Based on this experimental observation we discuss possible generation mechanisms below.
Consider the case of a charge carrier being generated through a two-step excitation, as has been proposed for several polymeric materials 4, 27, 26, 29. For this case, since the photocarriers are directly pumped, the generation function is . We can discard this as the dominant mechanism as we expect it to manifest, in the ECPC, as a maximum in the absolute signal when the two pulses temporally overlap. Instead, experimentally we observe a minimum. A similar experiment as the one presented here probed the two-step excitation pathway and observed that the response follows the exciton decay dynamics 29. At high fluences, they observed a “rise” time interpreted as a fast relaxation from a hot vibrational state to followed by a subsequent excitation from to . The rise time that we observed is too long to correspond to any relaxation time which is usually in the sub-picosecond time scale 29.
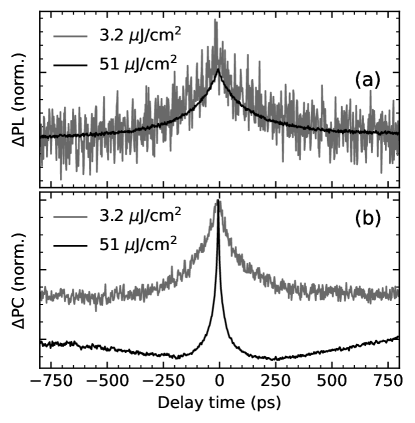
Other possible mechanisms are charge generation after bimolecular exciton-exciton annihilation 26 and a recently proposed monomolecular exciton dissociation 30. In both cases, the generation rates will depend on the population of the excitons. In the bimolecular exciton-exciton annihilation pathway, the generation function would be proportional to the square of the exciton population, . While for monomolecular exciton dissociation, the generation rate is proportional to the exciton population, . Notice in Fig. 3(b), further exemplified in Fig. 4(b), that the “rise” of the nonlinear response is dependent on the excitation density. Since excitons population evolution depends on the excitation density, both mechanisms show the same trend to become faster as the fluence increases. However, since we observed experimentally a more dramatic effect in the photocurrent detection scheme than in the photoluminescence scheme, shown in Fig. 4, we hypothesize that the dominant generation mechanism is bimolecular annihilation of the exciton population.
Furthermore, the charge lifetime observed in ECPC (Fig. 3(b)) is considerably longer than the exciton lifetime (Fig. 3(a)). We cannot quantify it as it is outside of the instrument’s temporal window. As the fluence increases, we observe that the decay of the charge becomes more significant, indicating that the bimolecular recombination of carriers becomes more important as expected from the simple model presented above. Finally, we acknowledge that there are other causes of nonlinear photocurrent that were not discussed in this work, e.g., the current limitation due to the external resistance series 31. We tried to minimize these effects by performing the measurements at a low fluence range.
2.2.3 Summary of nonlinear dynamics in organic semiconductors
We have shown how ECPL can be used to extract photophysical parameters like monomolecular and bimolecular decay rate constants. In the ECPC experiments we interpret the ”rising” features around zero time delay as the time-dependent generation of charge carriers, which becomes faster with increasing fluence. We suggest that charge carriers are generated through bimolecular annihilation pathways. Since the fluence dependence of the generation time might originate from a second-order charge generation process, . Other mechanisms could also be involved, however, due to the strong photoluminescence nonlinearity observed, we expect bimolecular exciton-exciton annihilation to be the dominant pathway toward charge generation. To further clarify the complete photophysical scenario, systematic experiments using complementary techniques (e.g. transient absorption and time-resolved photoluminescence spectroscopies) are needed and recommended as future endeavors.
3 Discussion
In this work, we presented two scenarios in which the nonlinear PL and PC detection schemes provide distinct and complementary information. In the case of lead-halide perovskites, the same excited-state species contribute to both the nonlinear PL and PC. Therefore via ECPL and ECPC, we follow the population of the same species; however, this species leads to distinct nonlinear responses in each of the physical observables. This offers the possibility to selectively study photophysical processes experienced by the excited species based on the detection scheme. For example, we showed that while ECPL shows a response due to trap-assisted recombination, the ECPC is insensitive to traps themselves. The magnitude of ECPC, instead, is given by bimolecular recombination, a process to which ECPL is insensitive. As mentioned above, Zhou et al. 17 have taken advantage of this to characterize carrier diffusion in layered perovskites using photocurrent detection.
For the case of organic semiconductors, we probe exclusively the excitons that recombine radiatively or those that dissociate and generate charge carriers, with each detection scheme, photoluminescence, and photocurrent respectively. In that sense, the work presented here adds to the existing toolbox of ultrafast photoluminescence and photocurrent techniques 32, 33, with the additional feature that the magnitude of the response can be used to describe the rates responsible for the nonlinearities. In this material, both ECPL and ECPC have negative nonlinear responses which are directly related to the exciton-exciton bimolecular annihilation rate and the charge carrier bimolecular recombination respectively. As the excitonic scenarios become complex, the magnitude of the nonlinear signal provides insight into nonlinear processes occurring on the ultrafast scale hidden to steady-state measurements or that appear convoluted in time-resolved techniques.
As mentioned in the Introduction, recent reports describe a variation of the ECS probe, utilizing a tunable narrow excitation wavelength to characterize layered perovskite quantum-well structures 15, 16, 17. We note that in their interpretation there is ambiguity in the distinction between the incoherent and coherent contributions to the nonlinear response. The measured spectra are interpreted as 2D excitation spectra, but we highlight that there is no well-defined phase resolution in the excitation-pulse wavepackets, and the measurements are thus purely incoherent as in the work presented here. This incoherent response arises from the dependence of the physical observable on the intensity of the excitation due to the population evolution (e.g., trap recombination and exciton-exciton recombination), rather than a coherent nonlinear response as in coherent multidimensional spectroscopies 34, 35, 36, 37, 38. We also note that these 2D measurements that implement phase modulation may also contain incoherent contributions due to nonlinear population dynamics picked up by the phase demodulation detection scheme 39, 40, 41. We thus underline the difference between the technique presented in this article and 2D coherent excitation. Earlier, ECS-like experiments have been interpreted using Feynmann diagrams 16, 15. We emphasize that this is not precise, since Feynmann diagrams indicate optical transitions among states and their coherent correlation but do not include the interactions among their populations. This imprecision is addressed in recent literature recognizing recombination dynamics as the only origin of the measured nonlinearity 42. Due to their distinct origin, they provide distinct information. While 2D coherent excitation experiments provide information regarding dephasing rates and coherent correlations between excited states, the ECS experiments provide information uniquely about population mixing. In this work, we expand on the signal-generation mechanisms associated with population mixing. Together with previous examples 7, 8, 10, 11, 12, 13, 14, 18, 19; our work adds another tool to the modern semiconductor community for the characterization of nonlinear photophysical processes.
4 Conclusion
We have observed and rationalized the main nonlinear signatures in the photoluminescence and photocurrent of lead-halide perovskite and organic semiconductor devices. For the case of LHPs, the ECPL has nonlinear components due to trap-assisted and Auger recombination with opposite behavior, sublinear and supralinear. The fluence dependence of ECPL provides rich information about defect density, ultrafast dynamics, and Auger recombination. Meanwhile, in ECPC, the nonlinear signature originates from bimolecular and Auger recombination, both of which are supralinear processes. In ECPC, the nonlinear contributions are convoluted and difficult to distinguish. In organic semiconductors, we describe ECPL as a sensitive technique for determining exciton-annihilation rates. On the other hand, ECPC represents a valuable tool to study charge generation through photo-excitation. The experimental data suggest that ECPC can follow the population dynamics of free charges including their generation dynamics. Additionally, from the rise time observed in ECPC, we hypothesize that bimolecular annihilation corresponds to a significant pathway for charge carrier generation.
We expect EC spectroscopy to have an impact, particularly in the field of organic electronics, where it can shine further insight into the physical nature of excited states and the generation mechanisms leading to charge carriers. Besides the case of study of single component materials, mixed systems with complex fluence-dependent photophysical processes will also benefit from EC spectroscopy. For example, in recent studies of perovskite-sensitized TTA-UC, the intensity dependence of photoluminescence shows an interplay of processes with distinct nonlinearities 1 which could be better resolved by EC spectroscopy as well as their time-resolved dynamics.
5 Appendix
6 Excitation Correlation Spectroscopy
In our implementation, 1030 nm, 220 fs pulses are generated in an ultrafast laser system at a 100 kHz repetition rate (PHAROS Model PH1-20-0200-02-10, Light Conversion). A portion of the laser beam is sent into a commercial optical parametric amplifier (ORPHEUS, Light Conversion). The pulse trains are then split 50/50 by a beam splitter cube, where one of the beams is directed to a motorized linear stage (LTS300, Thorlabs), allowing for control of the delay between the two pulses. Each pulse is modulated with a chopper at the frequencies of 373 and 199 Hz, respectively, and the pulses are then focused onto the sample with a 100 mm focal length lens. The total integrated response and the nonlinear component are obtained simultaneously by demodulating both the fundamental and the sum of the modulation frequency. Photoluminescence detection (ECPL): The emitted PL is filtered with a long-pass filter to get rid of the pump, and then it is focused into a photoreceiver (New Focus 2031 PR) connected to a lock-in amplifier (HF2LI, Zurich Instruments). Photocurrent detection (ECPC): The device is connected to a Zurich Instruments HF2TA Current Amplifier used to convert the current output of the sample device to voltage, as well as to supply an external bias to the device. The current amplifier is connected to a lock-in amplifier (HF2LI, Zurich Instruments). The photocurrent measurements presented here were acquired with no external applied bias.
6.1 Signal recovery from lock-in amplifier
Additionally, in this appendix, we expand on the experimental details for measuring the nonlinear component utilizing double modulation lock-in detection. The intention is to provide two examples of nonlinear photophysics processes recovered through double demodulation and to bring attention to the fiendish experimental details. We follow reference 9 for the case of trap-assisted recombination. We define the generation rate to take into account the repetition rate and to be a square wave to mimic the chopper.
| (17) |
Remember that the square wave function that alternates between 0 and 1 is given as:
| (18) |
Consider the cases where the reference signal, with which the signal is demodulated, corresponds to a sine function or a square wave. Also, we will ignore the phase as this can be easily set experimentally.
6.2 Trap-assisted recombination
We take and both pulses to have the same intensity. Then, using the equations 8 we integrate which corresponds to the response of the detector. Since is much longer than the carrier lifetime we integrate from zero to infinity instead and obtain the intensity:
| (19) |
All the constants were grouped with the response of the detector.
We mimic the demodulation of the lock-in amplifier by multiplying the signal by:
| (20) |
. Then we average over a long time such that oscillating components vanish. Then the intensity recovery for each modulation frequency is:
| (21) |
| (22) |
Note that part of the mixed term is recovered in the single modulation since . Now, we expand the mixed term to:
| (23) |
After we demodulate at the sum frequency and average a long time. The only terms that survive come from the last sum, when and are the same. Then:
| (24) |
Note that demodulating using a sine function recovers only the coefficient of the Fourier series.
| (25) |
6.3 Bimolecular Annihilation
We choose the delay between the pulses to be zero for simplicity. From the equation above, the total photoluminescence detected is:
| (26) |
We define . Then, we do a second-order Taylor expansion, and .
| (27) |
Remember that the square wave is an idempotent function.
| (28) |
Then after demodulating with a square function, we obtained:
| (29) |
| (30) |
The authors thank Prof. Ajay Ram Srimath Kandada for fruitful discussions on the ECPL and ECPC experimental techniques and data analysis, and Victoria Quiros-Cordero for rigorous proofreading. The preparation of perovskite samples, devices, and their characterization and analysis, and writing of the corresponding manuscript sections by ERG, YS, DSG, and CSA was supported by the U.S. Department of Energy’s Office of Energy Efficiency and Renewable Energy (EERE) under the Solar Energy Technologies Office 24 Award Number DE-EE0008747. The preparation of the organic-semiconductor samples was carried out by KY, supported by the Swiss National Science Foundation (200020_184819). Their optical characterization and analysis, and writing of the corresponding manuscript sections by ERG, KY, YZ, NB, and CSA were supported by the National Science Foundation (DMR-1904293). In addition, KY acknowledges the Swiss Academy of Sciences and Universität Bern for additional travel grants. Part of this work was carried out using the shared facilities of the UW Molecular Engineering Materials Center (MEM-C), a Material Research Science and Engineering Center (DMR-1719797) supported by the U.S. National Science Foundation.
See the Supplementary Information for details of the setup, solar cell, and diode used. Additionally, it contains details on the ECPL and ECPC models and curve-fitting parameters.
References
- VanOrman et al. 2021 VanOrman, Z. A.; Drozdick, H. K.; Wieghold, S.; Nienhaus, L. Bulk halide perovskites as triplet sensitizers: progress and prospects in photon upconversion. J. Mater. Chem. C 2021, 9, 2685–2694
- Herz et al. 2004 Herz, L. M.; Silva, C.; Grimsdale, A. C.; Müllen, K.; Phillips, R. T. Time-dependent energy transfer rates in a conjugated polymer guest-host system. Phys. Rev. B 2004, 70, 165207
- Riley et al. 2022 Riley, D. B.; Sandberg, O. J.; Li, W.; Meredith, P.; Armin, A. Quasi-Steady-State Measurement of Exciton Diffusion Lengths in Organic Semiconductors. Phys. Rev. Appl. 2022, 17, 024076
- Silva et al. 2001 Silva, C.; Dhoot, A. S.; Russell, D. M.; Stevens, M. A.; Arias, A. C.; MacKenzie, J. D.; Greenham, N. C.; Friend, R. H.; Setayesh, S.; Müllen, K. Efficient exciton dissociation via two-step photoexcitation in polymeric semiconductors. Phys. Rev. B 2001, 64, 125211
- Daniel et al. 2007 Daniel, C.; Westenhoff, S.; Makereel, F.; Friend, R. H.; Beljonne, D.; Herz, L. M.; Silva, C. Monte Carlo Simulation of Exciton Bimolecular Annihilation Dynamics in Supramolecular Semiconductor Architectures. J. Phys. Chem. C 2007, 111, 19111–19119
- Firdaus et al. 2020 Firdaus, Y. et al. Long-range exciton diffusion in molecular non-fullerene acceptors. Nat. Commun. 2020, 11, 5220
- von der Linde et al. 1981 von der Linde, D.; Kuhl, J.; Rosengart, E. Picosecond correlation effects in the hot luminescence of \ceGaAs. J. Lumin 1981, 24-25, 675–678
- Rosen et al. 1981 Rosen, D.; Doukas, A. G.; Budansky, Y.; Katz, A.; Alfano, R. R. Time resolved luminescence of photoexcited p‐type gallium arsenide by population mixing. Appl. Phys. Lett. 1981, 39, 935–937
- Johnson et al. 1988 Johnson, M. B.; McGill, T. C.; Hunter, A. T. Picosecond time‐resolved photoluminescence using picosecond excitation correlation spectroscopy. J. Appl. Phys. 1988, 63, 2077–2082
- Chilla et al. 1993 Chilla, J. L. A.; Buccafusca, O.; Rocca, J. J. Origin of photoluminescence signals obtained by picosecond-excitation correlation measurements. Phys. Rev. B 1993, 48, 14347–14355
- Pau et al. 1998 Pau, S.; Kuhl, J.; Khan, M. A.; Sun, C. J. Application of femtosecond-excitation correlation to the study of emission dynamics in hexagonal \ceGaN. Phys. Rev. B 1998, 58, 12916–12919
- Hirori et al. 2006 Hirori, H.; Matsuda, K.; Miyauchi, Y.; Maruyama, S.; Kanemitsu, Y. Exciton Localization of Single-Walled Carbon Nanotubes Revealed by Femtosecond Excitation Correlation Spectroscopy. Phys. Rev. Lett. 2006, 97, 257401
- Miyauchi et al. 2009 Miyauchi, Y.; Matsuda, K.; Kanemitsu, Y. Femtosecond excitation correlation spectroscopy of single-walled carbon nanotubes: Analysis based on nonradiative multiexciton recombination processes. Phys. Rev. B 2009, 80, 235433
- Srimath Kandada et al. 2016 Srimath Kandada, A. R.; Neutzner, S.; D’Innocenzo, V.; Tassone, F.; Gandini, M.; Akkerman, Q. A.; Prato, M.; Manna, L.; Petrozza, A.; Lanzani, G. Nonlinear Carrier Interactions in Lead Halide Perovskites and the Role of Defects. J. Am. Chem. Soc. 2016, 138, 13604–13611
- Zhou et al. 2019 Zhou, N.; Hu, J.; Ouyang, Z.; Williams, O. F.; Yan, L.; You, W.; Moran, A. M. Nonlinear Photocurrent Spectroscopy of Layered 2D Perovskite Quantum Wells. J. Phys. Chem. Lett. 2019, 10, 7362–7367, PMID: 31711289
- Ouyang et al. 2020 Ouyang, Z.; Zhou, N.; Hu, J.; Williams, O. F.; Yan, L.; You, W.; Moran, A. M. Nonlinear fluorescence spectroscopy of layered perovskite quantum wells. J. Chem. Phys 2020, 153, 134202
- Zhou et al. 2021 Zhou, N.; Ouyang, Z.; Yan, L.; McNamee, M. G.; You, W.; Moran, A. M. Elucidation of Quantum-Well-Specific Carrier Mobilities in Layered Perovskites. J. Phys. Chem. Lett. 2021, 12, 1116–1123
- Perini et al. 2022 Perini, C. A. R.; Rojas-Gatjens, E.; Ravello, M.; Castro-Mendez, A.-F.; Hidalgo, J.; An, Y.; Kim, S.; Lai, B.; Li, R.; Silva-Acuña, C.; Correa-Baena, J.-P. Interface Reconstruction from Ruddlesden–Popper Structures Impacts Stability in Lead Halide Perovskite Solar Cells. Advanced Materials 2022, 34, 2204726
- Shi et al. 2022 Shi, Y.; Rojas-Gatjens, E.; Wang, J.; Pothoof, J.; Giridharagopal, R.; Ho, K.; Jiang, F.; Taddei, M.; Yang, Z.; Sanehira, E. M.; Irwin, M. D.; Silva-Acuña, C.; Ginger, D. S. (3-Aminopropyl)trimethoxysilane Surface Passivation Improves Perovskite Solar Cell Performance by Reducing Surface Recombination Velocity. ACS Energy Letters 2022, 7, 4081–4088
- Stranks et al. 2014 Stranks, S. D.; Burlakov, V. M.; Leijtens, T.; Ball, J. M.; Goriely, A.; Snaith, H. J. Recombination Kinetics in Organic-Inorganic Perovskites: Excitons, Free Charge, and Subgap States. Phys. Rev. Applied 2014, 2, 034007
- deQuilettes et al. 2019 deQuilettes, D. W.; Frohna, K.; Emin, D.; Kirchartz, T.; Bulovic, V.; Ginger, D. S.; Stranks, S. D. Charge-Carrier Recombination in Halide Perovskites. Chem. Rev. 2019, 119, 11007–11019
- Kiligaridis et al. 2021 Kiligaridis, A.; Frantsuzov, P. A.; Yangui, A.; Seth, S.; Li, J.; An, Q.; Vaynzof, Y.; Scheblykin, I. G. Are Shockley-Read-Hall and ABC models valid for lead halide perovskites? Nat. Commun. 2021, 12, 3329
- Ziffer et al. 2016 Ziffer, M. E.; Mohammed, J. C.; Ginger, D. S. Electroabsorption Spectroscopy Measurements of the Exciton Binding Energy, Electron–Hole Reduced Effective Mass, and Band Gap in the Perovskite CH3NH3PbI3. ACS Photonics 2016, 3, 1060–1068
- Borgwardt et al. 2015 Borgwardt, M.; Sippel, P.; Eichberger, R.; Semtsiv, M. P.; Masselink, W. T.; Schwarzburg, K. Excitation correlation photoluminescence in the presence of Shockley-Read-Hall recombination. J. Appl. Phys. 2015, 117, 215702
- Paquin et al. 2011 Paquin, F.; Latini, G.; Sakowicz, M.; Karsenti, P.-L.; Wang, L.; Beljonne, D.; Stingelin, N.; Silva, C. Charge Separation in Semicrystalline Polymeric Semiconductors by Photoexcitation: Is the Mechanism Intrinsic or Extrinsic? Phys. Rev. Lett. 2011, 106, 197401
- Stevens et al. 2001 Stevens, M. A.; Silva, C.; Russell, D. M.; Friend, R. H. Exciton dissociation mechanisms in the polymeric semiconductors poly(9,9-dioctylfluorene) and poly(9,9-dioctylfluorene-co-benzothiadiazole). Phys. Rev. B 2001, 63, 165213
- Silva et al. 2002 Silva, C.; Russell, D. M.; Dhoot, A. S.; Herz, L. M.; Daniel, C.; Greenham, N. C.; Arias, A. C.; Setayesh, S.; Müllen, K.; Friend, R. H. Exciton and polaron dynamics in a step-ladder polymeric semiconductor: the influence of interchain order. Journal of Physics: Condensed Matter 2002, 14, 9803
- Köhler and Bässler 2015 Köhler, A.; Bässler, H. Electronic processes in organic semiconductors: An introduction; John Wiley & Sons, 2015
- Gambetta et al. 2005 Gambetta, A.; Virgili, T.; Lanzani, G. Ultrafast excitation cross-correlation photoconductivity in polyfluorene photodiodes. Appl. Phys. Lett. 2005, 86, 253509
- Price et al. 2022 Price, M. B. et al. Free charge photogeneration in a single component high photovoltaic efficiency organic semiconductor. Nature Communications 2022, 13, 2827
- Zeiske et al. 2022 Zeiske, S.; Li, W.; Meredith, P.; Armin, A.; Sandberg, O. J. Light intensity dependence of the photocurrent in organic photovoltaic devices. Cell Reports Physical Science 2022, 3, 101096
- Bakulin et al. 2016 Bakulin, A. A.; Silva, C.; Vella, E. Ultrafast Spectroscopy with Photocurrent Detection: Watching Excitonic Optoelectronic Systems at Work. J. Phys. Chem. Lett. 2016, 7, 250–258
- Bakulin et al. 2012 Bakulin, A. A.; Rao, A.; Pavelyev, V. G.; van Loosdrecht, P. H. M.; Pshenichnikov, M. S.; Niedzialek, D.; Cornil, J.; Beljonne, D.; Friend, R. H. The Role of Driving Energy and Delocalized States for Charge Separation in Organic Semiconductors. Science 2012, 335, 1340–1344
- Tekavec et al. 2007 Tekavec, P. F.; Lott, G. A.; Marcus, A. H. Fluorescence-detected two-dimensional electronic coherence spectroscopy by acousto-optic phase modulation. J. Chem. Phys 2007, 127, 214307
- Nardin et al. 2013 Nardin, G.; Autry, T. M.; Silverman, K. L.; Cundiff, S. T. Multidimensional coherent photocurrent spectroscopy of a semiconductor nanostructure. Opt. Express 2013, 21, 28617–28627
- Vella et al. 2016 Vella, E.; Li, H.; Grégoire, P.; Tuladhar, S. M.; Vezie, M. S.; Few, S.; Bazán, C. M.; Nelson, J.; Silva-Acuña, C.; Bittner, E. R. Ultrafast decoherence dynamics govern photocarrier generation efficiencies in polymer solar cells. Sci. Rep. 2016, 6, 1–12
- Grégoire et al. 2017 Grégoire, P.; Vella, E.; Dyson, M.; Bazán, C. M.; Leonelli, R.; Stingelin, N.; Stavrinou, P. N.; Bittner, E. R.; Silva, C. Excitonic coupling dominates the homogeneous photoluminescence excitation linewidth in semicrystalline polymeric semiconductors. Phys. Rev. B 2017, 95, 180201
- Gutiérrez-Meza et al. 2021 Gutiérrez-Meza, E.; Malatesta, R.; Li, H.; Bargigia, I.; Srimath Kandada, A. R.; Valverde-Chávez, D. A.; Kim, S.-M.; Li, H.; Stingelin, N.; Tretiak, S.; Bittner, E. R.; Silva-Acuña, C. Frenkel biexcitons in hybrid HJ photophysical aggregates. Sci. Adv. 2021, 7, eabi5197
- Grégoire et al. 2017 Grégoire, P.; Srimath Kandada, A. R.; Vella, E.; Tao, C.; Leonelli, R.; Silva, C. Incoherent population mixing contributions to phase-modulation two-dimensional coherent excitation spectra. J. Chem. Phys 2017, 147, 114201
- Kalaee et al. 2019 Kalaee, A. A. S.; Damtie, F.; Karki, K. J. Differentiation of True Nonlinear and Incoherent Mixing of Linear Signals in Action-Detected 2D Spectroscopy. J. Phys. Chem. A 2019, 123, 4119–4124
- Bargigia et al. 2022 Bargigia, I.; Gutiérrez-Meza, E.; Valverde-Chávez, D. A.; Marques, S. R.; Srimath Kandada, A. R.; Silva, C. Identifying incoherent mixing effects in the coherent two-dimensional photocurrent excitation spectra of semiconductors. J. Chem. Phys. 2022, 157, 204202
- McNamee et al. 2023 McNamee, M. G.; Ouyang, Z.; Yan, L.; Gan, Z.; Zhou, N.; Williams, O. F.; You, W.; Moran, A. M. Uncovering Transport Mechanisms in Perovskite Materials and Devices with Recombination-Induced Action Spectroscopies. J. Phys. Chem. C 2023, 127, 2782–2791
See pages - of SI.pdf