Adaptive Sparse Pairwise Loss for Object Re-Identification
Abstract
Object re-identification (ReID) aims to find instances with the same identity as the given probe from a large gallery. Pairwise losses play an important role in training a strong ReID network. Existing pairwise losses densely exploit each instance as an anchor and sample its triplets in a mini-batch. This dense sampling mechanism inevitably introduces positive pairs that share few visual similarities, which can be harmful to the training. To address this problem, we propose a novel loss paradigm termed Sparse Pairwise (SP) loss that only leverages few appropriate pairs for each class in a mini-batch, and empirically demonstrate that it is sufficient for the ReID tasks. Based on the proposed loss framework, we propose an adaptive positive mining strategy that can dynamically adapt to diverse intra-class variations. Extensive experiments show that SP loss and its adaptive variant AdaSP loss outperform other pairwise losses, and achieve state-of-the-art performance across several ReID benchmarks. Code is available at https://github.com/Astaxanthin/AdaSP.
1 Introduction
Object re-identification (ReID) is one of the most important vision tasks in visual surveillance. It aims at associating person/vehicle images with the same identity captured by different cameras in diverse scenarios. Recently, with the prosperity of deep neural networks in computer vision community, ReID tasks have rapidly progressed towards more sophisticated feature extractors [44, 61, 60, 40, 37, 8] and more elaborate losses [43, 57, 58, 45]. Benefiting from quantifying the semantic similarity/distance of two images, metric losses are widely employed with the identity loss to improve ranking precision in the ReID task [35].
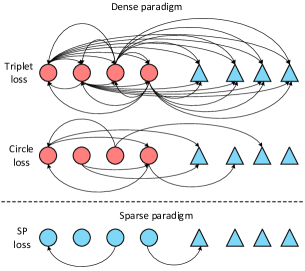

Generally, metric losses serve for metric learning that aims to map raw signals into a low-dimensional embedding space where instances of intra-class are clustered and that of inter-class are separated. The pairwise framework, such as triplet loss [19] and circle loss [45], employs anchors to pull their positive pairs while pushing negatives apart. Most existing pairwise losses [19, 38, 14, 45] devote to exploiting all instances in a mini-batch, and densely anchoring each of them (which we term dense pairwise method) to sample its triplets. Although some hard sample mining methods [50, 51, 45, 7] are developed to accelerate convergence or improve performance, these losses are still computed in a dense manner (i.e. top rows in Fig. 1). This dense design inevitably introduces harmful positive pairs [43, 1] that share few visual similarities and likely lead to bad local minima of optimization [54] for metric learning, due to large intra-class variations (Fig. 2a) caused by illumination changes, occlusion, different viewpoints, etc.
In this work, we anticipate that it is not necessary to employ all instances within a mini-batch since most of them are either trivial or harmful pairs. To this end, we propose a novel loss paradigm termed Sparse Pairwise (SP) loss that only leverages the most informative pairs for each class in a mini-batch without relying on dense instance-level anchors, as shown in Fig. 1 (bottom row). For the object ReID tasks, we empirically discover that using only few pairs of each class is sufficient for the loss computation as long as the appropriate ones are mined. Based on the proposed loss framework, we conduct a rigorous investigation of the positive mining strategy.
Compared to negative mining which has been actively studied [42, 14, 54], positive mining remains under-explored. Generally, an appropriate positive pair should be capable of adapting to different levels of intra-class variations. For example, an occluded pedestrian in a side viewpoint or dark illumination almost shares no visual similarities with his front perspective in Fig. 2a, while the instance (blue bounding box) in a clear illumination without any occlusions can bridge them, thus forming an appropriate pair for training. To obtain appropriate positive pairs, some works [43, 25, 55] attempt to excavate “moderate” or easy positive pairs, yet still rely on dense anchors.
In this work, we first propose a least-hard positive mining strategy to address large intra-class variations. Inspired by a geometric insight, we find that the hardest positive pair in a class shapes the radius of the largest hypersphere covering all intra-class samples. Nevertheless, it can be excessively large and thus introduces overwhelming visual differences on account of large intra-class variations. In this case, the least-hard positive pair that constructs the smallest hypersphere can be utilized instead as a more appropriate one sharing noticeable visual similarities (Fig. 2a). In addition, to handle classes with diverse intra-class variations (Fig. 2), we develop an adaptive mining approach that automatically reweights these two kinds of positive pairs, which shapes a dynamic intra-class hypersphere according to the particular situation of the class. The main contributions of this paper are summarized as follows:
-
•
We propose a novel pairwise loss framework – Sparse Pairwise loss – that only leverages few informative positive/negative pairs for each class in a mini-batch.
-
•
We propose a least-hard positive mining strategy to address large intra-class variations and further endow it with an adaptive mechanism according to different levels of intra-class variations in each mini-batch.
-
•
The proposed AdaSP loss is evaluated on various person/vehicle ReID datasets and outperforms existing dense pairwise losses across different benchmarks.
2 Related Work
Object ReID. Object ReID, including person and vehicle re-identification, is widely applied in intelligent surveillance systems across non-overlapping cameras [4, 20]. Currently, feature representation learning and deep metric learning have become routine steps for ReID tasks by replacing handcrafted features [13, 36] and distance metric learning [24, 53, 31] in early studies. To alleviate the misalignment in feature representations, many studies [44, 61, 5, 27, 48, 60, 40, 37] combine local aggregated features with global representation and achieve significant improvements in person/vehicle ReID tasks. Recently, the vision transformer [8, 46] has been introduced into ReID studies [18, 40, 26] to obtain more discriminative feature representations. Besides, Fu et al. [10, 11] manage to perform pre-training on a large-scale unlabeled person ReID dataset to improve the generalization performance.
Deep metric learning. Metric learning mainly focuses on designing a metric loss that is capable of maximizing intro-similarities while minimizing inter-similarities in the embedding space. By treating each instance as an anchor, many pairwise metric losses, such as triplet loss [19] and its variants [58, 57, 5, 12], quadruplet loss [3], and lifted structure loss [38], demand the similarities of anchor-positive pairs to be higher than that of anchor-negatives. To further empower hard samples, multi-similarity loss [50], rank listed loss [51] and circle loss [45] reweight each pair according to its relative similarities and its optimal state, respectively. Beyond ReID and image retrieval tasks, Prannay et al. [22] propose a supervised contrastive loss to address image classification tasks. However, these pairwise losses highly rely on instance-level anchors and require densely mining positive pairs for each anchor.
Hard sample mining. To alleviate the dominance of trivial triplets during the training, hard sample mining plays a critical role in metric learning. Alexander et al. [19] empirically demonstrate that triplet loss with mining the hardest positive and negative pairs in a mini-batch outperforms that with sampling all triplets. However, the hardest pairs likely cause bad local minima of optimization [42, 38, 56, 54] when the anchor-positive pairs are far less similar than the anchor-negatives, especially for large intra-class variations. The solution to this problem is approximately concentrating on mining “less-hard” negatives/positives. For instance, on the one hand, Florian et al. [42] utilize semi-hard negative pairs whose similarities are lower than their anchor-positives, while Ben et al. [14] and Bhavya et al. [47] excavate smart hard negatives and optimal hard negatives to avoid choosing the excessively hard ones. On the other hand, Hailin et al. [43] select moderate positive pairs to reduce the influence of large intra-class variations, while other studies [55, 25] directly conduct easy positive mining for the triplet generation.
3 Methodology
3.1 Sparse Pairwise Loss
Given a mini-batch that consists of random classes and each with instances, we denote the normalized embedding vector of the th instance in the th class as . Correspondingly, the metric between any two instances can be described by their dot product similarity. Instead of treating each instance as an anchor, we propose a Sparse Pairwise (SP) loss to separately excavate a positive and a negative pair for each class. The SP loss for a mini-batch can be formulated as:
| (1) |
Where is a temperature parameter. denotes the similarity of the chosen negative pair for the th class from its all negative pairs. In this work, we simply mine the hardest one since it describes the minimum distance between classes and represents the most informative pair across all negative pairs. Correspondingly, the soft version of the hardest negative similarity is adopted:
| (2) |
In analogy, represents the appropriate positive similarity, which will be described in detail in Section 3.2 and 3.3. Superficially, the SP loss demands the hardest negative similarity of each class to be smaller than its appropriate positive similarity. While essentially, it treats each class as a unit and maximizes the difference between its inter-class and intra-class similarities in a sparse manner, which is different from other pairwise approaches that densely generate loss items with each corresponding to a single instance.
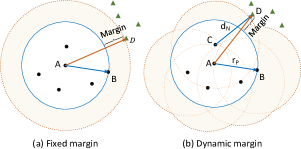
Implicit dynamic margin. Another advantage of the proposed SP loss is that it does not require an explicit margin as a hyper-parameter which is broadly exploited in many dense pairwise losses [45, 50, 19] to enlarge the difference between positives and negatives. Instead, an implicit dynamic margin is imposed by SP loss, as shown in Fig. 3b. Supposing the positive pair forms the radius, noted by , of a hypersphere () that covers all intra-class samples, SP loss requires the minimum inter-class distance, , to grow above the intra-class radius. As a result, according to the inequality , negative samples, geometrically, are excluded outside a dynamic border generated by the union of hyperspheres with the radius of . Hereafter, if we treat the center of as an anchor like other dense losses, the margin between its positive and negative pairs varies from to due to , while the dense pairwise losses usually configure a fixed pre-defined margin, as shown in Fig. 3a.
3.2 Least-hard Positive Mining
Generally, the similarity of the hardest positive pair in the th class can be generated by a soft version:
| (3) |
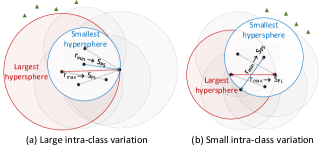
Geometrically, the hardest positive pair shapes the radius of a hypersphere that is centered at either instance of the pair and covers all other instances within this class, as shown in Fig. 4a. Similarly, each instance paired with its farthest positive sample can shape an intra-class hypersphere with different radii. Correspondingly, the similarity of the th positive pair can be given by:
| (4) |
Therefore, hyperspheres with different sizes can be obtained from each class, and conspicuously, the one constructed by the hardest positive pair is the largest hypersphere (Fig. 4). However, intricate illumination, intensive occlusion, and different viewpoints usually cause a large intra-class variation, which inevitably leads to an excessive visual difference of positive pairs, especially for the hardest one. For this case, inflating the similarity of the hardest pair in the embedding space will largely contradict the original data features and thus mislead the feature learning.
To address this problem, we soften the hard mining strategy by selecting the least-hard positive pair that constructs the smallest hypersphere (Fig. 4a), and the similarity of the least-hard positive pair can be given by:
| (5) | ||||
Noticeably, the least-hard positive pair is still a hard pair for the instance centered at the smallest hypersphere, while it produces a weaker learning signal than the hardest one across the entire class, which can effectively reduce the influence of large intra-class variations.
Bad local minima of optimization. Dense pairwise losses suffer from bad local minima of optimization during training in a dataset with large intra-class variation and low inter-class variations [54]. Because in this situation, it is very likely that an anchor image is more similar to its hardest negative instances than its positives. We consider them harmful triplets. Therefore, anchors play an important role in introducing harmful triplets. On the contrary, SP loss can largely reduce the possibility of forming harmful triplets due to the anchor-free design and least-hard mining strategy. Apart from quantitative results, we also provide a theoretical proof to demonstrate that the expected percentage of harmful positive pairs sampled by SP in a mini-batch is lower than that by the dense sampling approaches, which is shown in Supplementary Materials.
3.3 Adaptive Positive Mining
Mining the positive pair that constructs the smallest hypersphere can work well for the categories with large intra-class variations. While for the data with small intra-class variations, the hardest positive pair can contribute to an accelerated training process. Unfortunately, a fixed sampling strategy is unable to cope with both situations dynamically. To this end, we propose an adaptive weighting strategy that dynamically balances these two positive pairs according to different intra-class variations. However, it is infeasible to accurately quantify the intra-class variations from merely a mini-batch in the embedding space, since it varies according to batch sampling, data augmentation, and training stages.
In this work, we posit that the difference between the largest and the smallest intra-class hyperspheres can be employed to approximate the feature variations within a category. Concretely, for the early training stage, the pairwise similarities computed in the embedding space change fast and the largest hypersphere is excessively huge. For this case, it is less risky to mine the least-hard positive pair to conduct metric learning. While in the late training stage, the pairwise similarities are updated in a slow and robust manner. If the intra-class variation of a class is small, its largest and smallest hyperspheres are close in a small size, shown in Fig. 4b. In contrast, the difference between both intra-class hyperspheres will be relatively intensive if a large intra-class variation is observed.
Therefore, to measure their difference in a robust training stage, we compute the harmonic mean of the hardest and the least-hard similarities for the th class in a mini-batch, which is given by:
| (6) |
Correspondingly, if a large gap is observed between the hardest and the least-hard positive similarities, the harmonic mean is close to the smaller one, i.e. the hardest positive similarity. While if their similarities are close, the harmonic mean will approach their normal mean. Moreover, the harmonic mean increases as the growth of the hardest positive similarity, which can largely reveal the significance of the hardest positive pair.
As a result, we employ the harmonic mean of similarities (without gradient backpropagation) as an adaptive weight to balance the hardest and the least-hard positive pairs for each class:
| (7) |
By employing the above weight for positive pairs, the weighted positive similarity can be given by:
| (8) |
Accordingly, the entire metric loss for a mini-batch in Eq. 1 can be rewritten as:
| (9) |
From the geometric perspective, the weighted positive similarities indicate a dynamic hypersphere with a varying radius, which enables the loss to automatically adapt to different levels of intra-class variations.
Comparison with existing methods. Dense pairwise losses are generated from anchor-positive and anchor-negative pairs. Most of them [38, 51, 22] densely sample each positive pair and mine hard negative pairs to establish triplets for metric learning. Some recent studies have focused on mining informative positive pairs to accelerate training convergence, as shown in Tab. 1. The triplet [19] and the circle loss [45] exploit the hardest anchor-positive pairs. To avoid bad local minima caused by large intra-class variations, the MS [50] and the MP loss [43] select anchor-positive pairs according to the similarities of the hardest negative pairs. The EP [55] loss directly adopts the easiest anchor-positive pair to construct a triplet. Instead of relying on instance-level anchors, the proposed SP loss mines informative positive pairs for each class. SP-H and SP-LH aim to mine the hardest and the least-hard positive pairs. AdaSP dynamically changes positive similarities according to the levels of intra-class variations.
4 Experiments
To demonstrate the advantage of SP loss in object ReID tasks, we first compare the performance of single SP loss to that of other current metric losses, including triplet loss [19], multi-similarity (MS) loss [50], circle loss [45], supervised contrastive (SupCon) loss [22] and easy positive (EP) triplet loss [55], on three person ReID dataset (Market-1501 [62], DukeMTMC-reID [41], MSMT17 [52]) and two vehicle datasets (VeRi-776 [32], VehicleID [33]). Second, we explore the robustness of metric losses towards increasing intra-class variations. Afterwards, we adopt different network architectures to evaluate the improvement of ReID performance achieved by combining the proposed AdaSP with identity loss. In addition, we also investigate the effect of hyper-parameters of SP loss on the performance of ReID tasks. At last, we extensively evaluate AdaSP loss on seven person/vehicle benchmarks and compare them to state-of-the-art approaches.
| Dataset | MSMT17 | Market-1501 | DukeMTMC | VeRi-776 | VehicleID | |||||||
|---|---|---|---|---|---|---|---|---|---|---|---|---|
| Small | Medium | |||||||||||
| Loss | mAP | R1 | mAP | R1 | mAP | R1 | mAP | R1 | R1 | R5 | R1 | R5 |
| Triplet-BH [19] | 57.4 | 79.6 | 79.4 | 89.6 | 86.3 | 93.5 | 77.2 | 94.3 | 85.8 | 97.4 | 80.4 | 95.9 |
| MS [50] | 45.4 | 69.5 | 70.6 | 82.8 | 78.9 | 90.6 | 73.0 | 92.5 | 82.5 | 95.6 | 80.2 | 94.3 |
| Circle [45] | 56.1 | 78.6 | 78.7 | 88.8 | 86.0 | 93.7 | 72.9 | 92.7 | 84.5 | 96.7 | 81.1 | 95.8 |
| SupCon [22] | 38.2 | 61.9 | 64.5 | 79.7 | 73.5 | 86.2 | 70.3 | 89.6 | 79.7 | 97.1 | 73.8 | 94.0 |
| EP [55] | 41.1 | 67.8 | 67.4 | 82.0 | 76.0 | 90.4 | 57.2 | 93.2 | 74.5 | 87.2 | 71.2 | 82.4 |
| SP-H | 61.0 | 82.0 | 80.5 | 89.6 | 87.5 | 94.3 | 75.3 | 93.0 | 85.6 | 98.4 | 80.0 | 95.4 |
| SP-LH | 58.4 | 80.8 | 77.0 | 87.7 | 83.8 | 93.4 | 77.2 | 94.6 | 87.0 | 97.9 | 81.9 | 95.7 |
| AdaSP | 60.7 | 82.3 | 80.1 | 89.5 | 86.8 | 94.1 | 77.6 | 94.8 | 86.4 | 98.3 | 81.8 | 95.9 |
Datasets and evaluation metrics.
Four person ReID datasets, including CUHK03 [30], Market-1501 [62], DukeMTMC-reID [41], MSMT17 [52], and three vehicle ReID datasets, including VeRi-776 [32], VehicleID [33], VERI-WILD [34] are employed to evaluate our method. The details of each dataset are summarized in Tab. S1 (Supplementary Materials). We employ the widely adopted metrics including mean Average Precision (mAP), Rank1 (CMC@1), and Rank5 (CMC@5) to quantify ReID results.
Implementation details.
For person ReID tasks, we adopt the popular implementation of MGN [48] with instance batch normalization (IBN) [39] in Fast-ReID [17] as the backbone unless specified. The size of the embedding feature is set to . The input image size is set to or in different experiments. For vehicle ReID tasks, we adopt ResNet-50 [16] with IBN as the backbone. The size of the embedding feature is set to . The input image size is set to for all experiments. For both tasks, the overall loss consists of an identity loss (i.e. cross-entropy loss) and a metric loss (SP loss for our approach):
| (10) |
Adam optimizer [23] with a weight decay factor of e- and a warmup strategy with the base learning rate of e- are adopted. We train the network for epochs on all datasets apart from the largest VERI-WILD ( epochs). The batch size is set to for VeRi-776 as well as all person ReID datasets and for VehicleID/VERI-WILD.
4.1 Comparison with Other Pairwise Losses
In this section, we first evaluate and compare SP loss with other metric losses on MSMT17, Market-1501, DukeMTMC-reID, VeRi-776, and VehicleID datasets. To achieve a fair comparison, we keep the same experimental settings apart from the metric loss. The number of instances is first set to for all datasets. The size of input person images is set to . The performance comparison is shown in Tab. 2. It can be seen that SupCon loss achieves very limited performance on all datasets, as it samples all positive pairs for each anchor, which not only fails to strengthen informative pairs but also likely introduces harmful triplets. Although EP loss mines the easiest positives for each anchor, which can avoid introducing harmful triplets, it only achieves an mAP of on MSMT because it lacks the enhancement of hard but not harmful positive pairs. By mining less-hard positives and negatives, MS loss outperforms both SupCon and EP losses, while still falling behind the best methods. In addition, the triplet-BH loss and the circle loss achieve comparable performance on person ReID datasets because they essentially share the same mining strategy, i.e. the hardest positives/negatives for each anchor. For SP loss, it can be observed that SP-H loss outperforms other dense pairwise losses on almost all datasets apart from VeRi-776, suggesting that sparse pairs are sufficient for the learning. In addition, SP-H outperforms SP-LH on the three person ReID datasets while achieving lower R1 than SP-LH on the vehicle ReID datasets. This may be because the majority of classes in person and vehicle datasets contain small and large intra-class variations, respectively, in the situation with 8 instances per identity. Overall, AdaSP achieves the best or the second-best performance across all datasets since it leverages dynamic positive pairs to adapt to different levels of intra-class variations.
4.2 Ablation Study
| Backbone | Loss | MSMT17 | Market1501 | DukeMTMC | CUHK03-L | CUHK03-D | |||||
|---|---|---|---|---|---|---|---|---|---|---|---|
| mAP | R1 | mAP | R1 | mAP | R1 | mAP | R1 | mAP | R1 | ||
| ResNet-50 | Triplet-BH | 52.6 | 77.1 | 81.8 | 92.6 | 73.9 | 86.1 | 64.1 | 66.1 | 60.9 | 63.5 |
| AdaSP | 56.9 | 80.7 | 86.4 | 95.1 | 78.6 | 89.0 | 67.1 | 69.1 | 65.0 | 67.8 | |
| ResNet-101 | Triplet-BH | 56.3 | 79.2 | 84.2 | 93.2 | 76.6 | 87.2 | 66.9 | 69.2 | 63.2 | 65.4 |
| AdaSP | 59.5 | 82.1 | 87.6 | 95.0 | 79.6 | 89.8 | 69.6 | 71.2 | 67.7 | 69.2 | |
| ViT-base | Triplet-BH | 61.0∗ | 81.8∗ | 86.8∗ | 94.7∗ | 79.3∗ | 88.8∗ | 72.4 | 74.5 | 69.9 | 71.6 |
| AdaSP | 62.2 | 82.0 | 87.0 | 94.3 | 80.0 | 89.0 | 77.4 | 79.4 | 75.3 | 77.5 | |
| DeiT-base | Triplet-BH | 61.4∗ | 81.9∗ | 86.6∗ | 94.4∗ | 78.9∗ | 89.3∗ | 70.9 | 72.1 | 67.8 | 70.2 |
| AdaSP | 61.3 | 82.5 | 87.0 | 94.5 | 79.6 | 89.5 | 76.7 | 78.7 | 73.5 | 75.7 | |
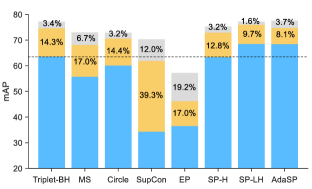
Robustness to increasing intra-class variations.
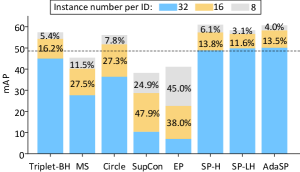
To show the advantages of SP loss on large intra-class variations, we further increase the number of instances per identity from to and , respectively. The experimental results are exhibited in Fig. 5. It can be seen that all metric losses suffer from a performance decline after increasing the instance number per identity in a mini-batch. This is mainly because the intra-class variations become intensive as the number of samples in a class rises. However, a significant difference in sensitivity towards the rising intra-class variations is observed among different metric losses. Specifically, the mAP performance of SupCon and EP losses dropped by more than after increasing the instance number to . The circle and MS losses also lost more than mAP performance. The triplet loss with batch hard mining seems much less insensitive towards the rising intra-class variations than other losses, which, however, still performs worse than the three variants of SP loss. This indicates that our SP loss, even the hardest version SP-H, is less sensitive and more robust to large intra-class variations than other dense pairwise losses.
Moreover, it can be observed that when instances per identity are sampled, SP-H achieves the best performance, while after increasing the instance number, the minimal performance decline is achieved by SP-LH. This phenomenon suggests that the least-hard positive mining can substantially reduce the sensitivity towards increasing intra-class variations. Moreover, AdaSP draws the advantages from both SP-H and SP-LH, thus achieving the best mAP performance after enlarging the intra-class variations. Similar results can be concluded on the VeRi-776 dataset, shown in Fig. S1 in the Supplementary Materials.
Generalizing to different networks.
In order to demonstrate the advantage of SP loss on improving ReID performance when combined with identity loss, we replace the triplet loss with AdaSP and implement an extensive evaluation using different networks on four person ReID datasets. The size of input images is set to . The experimental results are exhibited in Tab. 3. Combined with the cross-entropy loss, AdaSP outperforms triplet loss on almost all datasets and all networks. Especially for ResNet-50 and ResNet-101, more than of mAP improvement is observed on each dataset. Additional results on ResNet50-IBN, ResNet-152 and MGN [48] are exhibited in Tab. S2 in Supplementary Material. These encouraging experimental results suggest that the proposed AdaSP loss is capable of generating discriminative feature representations for pedestrian instances across different network architectures and can replace triplet loss to effectively work with cross-entropy loss.
| 0.01 | 0.05 | 0.1 | 0.2 | 0.3 | 0.4 | 0.5 | |
|---|---|---|---|---|---|---|---|
| mAP | 66.0 | 66.8 | 67.1 | 67.0 | 66.6 | 65.8 | 65.6 |
| R1 | 84.9 | 85.3 | 85.5 | 85.4 | 85.0 | 84.9 | 84.9 |
| 0.01 | 0.02 | 0.03 | 0.04 | 0.05 | 0.06 | 0.07 | 0.08 | 0.09 | |
|---|---|---|---|---|---|---|---|---|---|
| mAP | 63.3 | 66.1 | 66.9 | 67.1 | 66.6 | 66.0 | 65.8 | 65.0 | 64.6 |
| R1 | 83.4 | 85.4 | 85.4 | 85.5 | 84.7 | 84.7 | 84.5 | 84.0 | 83.2 |
| Method | Backbone | Input size | MSMT17 | Market1501 | DukeMTMC | CUHK03-L | CUHK03-D | |||||
|---|---|---|---|---|---|---|---|---|---|---|---|---|
| mAP | R1 | mAP | R1 | mAP | R1 | mAP | R1 | mAP | R1 | |||
| MGN [48] | ResNet-50 | 384128 | – | – | 86.9 | 95.7 | 78.4 | 88.7 | 67.4 | 68.0 | 66.0 | 66.8 |
| OSNet [63] | OSNet | 256128 | 52.9 | 78.7 | 84.9 | 94.8 | 73.5 | 88.6 | – | – | 67.8 | 72.3 |
| BAT-net [9] | GoogLeNet | 256128 | 56.8 | 79.5 | 87.4 | 95.1 | 77.3 | 87.7 | 76.1 | 78.6 | 73.2 | 76.2 |
| ABD-Net [2] | ResNet-50 | 384128 | 60.8 | 82.3 | 88.3 | 95.6 | 78.6 | 89.0 | – | – | – | – |
| RGA-SC [59] | ResNet-50 | 256128 | 57.5 | 80.3 | 88.4 | 96.1 | – | – | 77.4 | 81.1 | 74.5 | 79.6 |
| ISP [64] | HRNet-W32 | 256128 | – | – | 88.6 | 95.3 | 80.0 | 89.6 | 74.1 | 76.5 | 71.4 | 75.2 |
| CDNet [28] | CDNet | 256128 | 54.7 | 78.9 | 86.0 | 95.1 | 76.8 | 88.6 | – | – | – | – |
| Nformer ∗ [49] | ResNet-50 | 256128 | 59.8 | 77.3 | 91.1 | 94.7 | 83.5 | 89.4 | 78.0 | 77.2 | 74.7 | 77.3 |
| AdaSP | ResNet-50 | 256 128 | 64.7 | 84.3 | 89.0 | 95.1 | 81.5 | 90.6 | 80.5 | 82.1 | 78.0 | 80.2 |
| AdaSP | ResNet-50 | 384 128 | 67.1 | 85.5 | 89.8 | 95.5 | 83.0 | 91.7 | 82.4 | 84.6 | 80.1 | 82.0 |
| Method | VeRi | VehicleID | VERI-WILD | |||||||||||
|---|---|---|---|---|---|---|---|---|---|---|---|---|---|---|
| Small | Medium | Large | Small | Medium | large | |||||||||
| mAP | R1 | R1 | R5 | R1 | R5 | R1 | R5 | mAP | R1 | mAP | R1 | mAP | R1 | |
| VANet [6] | 66.3 | 89.8 | 88.1 | 97.3 | 83.2 | 95.1 | 80.4 | 93.0 | – | – | – | – | – | – |
| PART [15] | 74.3 | 94.3 | 78.4 | 92.3 | 75.0 | 88.3 | 74.2 | 86.4 | – | – | – | – | – | – |
| SEVER [21] | 79.6 | 96.4 | 79.9 | 95.2 | 77.6 | 91.1 | 75.3 | 88.3 | 80.9 | 94.5 | 75.3 | 92.7 | 67.7 | 89.5 |
| SGFD [29] | 81.0 | 96.7 | 86.8 | 97.4 | 83.5 | 95.6 | 80.8 | 93.7 | – | – | – | – | – | – |
| HRC∗ [60] | 81.9 | 96.8 | 87.8 | 98.1 | 81.7 | 96.3 | 78.5 | 93.5 | 85.2 | 94.0 | 80.0 | 91.6 | 72.2 | 88.0 |
| UFDN [40] | 81.5 | 96.4 | 88.4 | – | 84.8 | – | 80.6 | – | 84.6 | – | 79.4 | – | 72.0 | – |
| AdaSP | 82.7 | 96.7 | 89.3 | 98.4 | 85.6 | 96.7 | 83.0 | 94.9 | 89.2 | 96.2 | 84.8 | 95.0 | 78.7 | 92.1 |
Impact of hyper-parameters.
In this section, we explore the impact of hyper-parameters, including the weight of SP loss in Eq. 10 and its temperature , on both person and vehicle ReID datasets. We first vary from to for MSMT17. The experimental results, exhibited in Tab. 4, suggest that the overall performance is not sensitive to the weight and the mAP can remain above when falls into , while the best performance is achieved when is set to 0.1. The temperature is then configured from to with an interval of and the experimental results are shown in Tab. 5. It can be seen that the best mAP performance is achieved when the temperature is . We then conduct a similar experiment on the VeRi-776 dataset to explore hyper-parameters’ impact on Vehicle ReID tasks. The experimental results are shown in Tab. S3 and Tab. S4 in Supplementary Materials. The best mAP is achieved at a temperature of and a loss weight of . Based on the above parameter study, we adopt the optimal hyper-parameters for all experiments in this work.
4.3 Comparison with State-of-the-art Methods
We compare AdaSP loss with the state-of-the-art ReID methods based on CNN network architectures on four person ReID datasets and three vehicle ReID benchmarks. The experimental results are shown in Tab. 6 and Tab. 7. It can be observed from Tab. 6 that AdaSP outperforms MGN and ABD-Net at the same input size of by a large margin. Compared to other approaches with the input size of , AdaSP achieves the best mAP of and on the MSMT17 and CUHK03-D datasets, which is and higher than the SOTA approach Nformer, respectively. For the vehicle ReID benchmarks, our approach achieves the best performance on almost all evaluation metrics across all datasets. Especially for the largest dataset VERI-WILD, AdaSP outperforms HRC[60] and UFDN [40] by at least on the mAP performances across the three test sets.
5 Conclusion
In this paper, we propose a sparse pairwise loss that only requires excavating one positive and one negative pair for each class in a mini-batch to form metric loss items. Aiming to avoid sampling harmful positive pairs from the identities with large intra-class variations, we develop a least-hard positive mining approach and further endow it with an adaptive strategy. We implemented a careful evaluation of the proposed SP/AdaSP loss on both person and vehicle ReID datasets. Quantitative experimental results suggest that our loss outperforms current metric losses and achieves state-of-the-art performance on most benchmarks.
Acknowledgement
This work was supported by National Natural Science Foundation of China (Grant No.62103228).
References
- [1] Song Bai, Xiang Bai, and Qi Tian. Scalable person re-identification on supervised smoothed manifold. In Proceedings of the IEEE Conference on Computer Vision and Pattern Recognition, pages 2530–2539, 2017.
- [2] Tianlong Chen, Shaojin Ding, Jingyi Xie, Ye Yuan, Wuyang Chen, Yang Yang, Zhou Ren, and Zhangyang Wang. Abd-net: Attentive but diverse person re-identification. In Proceedings of the IEEE/CVF international conference on computer vision, pages 8351–8361, 2019.
- [3] Weihua Chen, Xiaotang Chen, Jianguo Zhang, and Kaiqi Huang. Beyond triplet loss: a deep quadruplet network for person re-identification. In Proceedings of the IEEE conference on computer vision and pattern recognition, pages 403–412, 2017.
- [4] Ying-Cong Chen, Xiatian Zhu, Wei-Shi Zheng, and Jian-Huang Lai. Person re-identification by camera correlation aware feature augmentation. IEEE transactions on pattern analysis and machine intelligence, 40(2):392–408, 2017.
- [5] De Cheng, Yihong Gong, Sanping Zhou, Jinjun Wang, and Nanning Zheng. Person re-identification by multi-channel parts-based cnn with improved triplet loss function. In Proceedings of the iEEE conference on computer vision and pattern recognition, pages 1335–1344, 2016.
- [6] Ruihang Chu, Yifan Sun, Yadong Li, Zheng Liu, Chi Zhang, and Yichen Wei. Vehicle re-identification with viewpoint-aware metric learning. In Proceedings of the IEEE/CVF international conference on computer vision, pages 8282–8291, 2019.
- [7] Zelu Deng, Yujie Zhong, Sheng Guo, and Weilin Huang. Insclr: Improving instance retrieval with self-supervision. In Proceedings of the AAAI Conference on Artificial Intelligence, volume 36, pages 516–524, 2022.
- [8] Alexey Dosovitskiy, Lucas Beyer, Alexander Kolesnikov, Dirk Weissenborn, Xiaohua Zhai, Thomas Unterthiner, Mostafa Dehghani, Matthias Minderer, Georg Heigold, Sylvain Gelly, et al. An image is worth 16x16 words: Transformers for image recognition at scale. arXiv preprint arXiv:2010.11929, 2020.
- [9] Pengfei Fang, Jieming Zhou, Soumava Kumar Roy, Lars Petersson, and Mehrtash Harandi. Bilinear attention networks for person retrieval. In Proceedings of the IEEE/CVF international conference on computer vision, pages 8030–8039, 2019.
- [10] Dengpan Fu, Dongdong Chen, Jianmin Bao, Hao Yang, Lu Yuan, Lei Zhang, Houqiang Li, and Dong Chen. Unsupervised pre-training for person re-identification. In Proceedings of the IEEE/CVF conference on computer vision and pattern recognition, pages 14750–14759, 2021.
- [11] Dengpan Fu, Dongdong Chen, Hao Yang, Jianmin Bao, Lu Yuan, Lei Zhang, Houqiang Li, Fang Wen, and Dong Chen. Large-scale pre-training for person re-identification with noisy labels. In Proceedings of the IEEE/CVF Conference on Computer Vision and Pattern Recognition, pages 2476–2486, 2022.
- [12] Weifeng Ge. Deep metric learning with hierarchical triplet loss. In Proceedings of the European Conference on Computer Vision (ECCV), pages 269–285, 2018.
- [13] Douglas Gray and Hai Tao. Viewpoint invariant pedestrian recognition with an ensemble of localized features. In European conference on computer vision, pages 262–275. Springer, 2008.
- [14] Ben Harwood, Vijay Kumar BG, Gustavo Carneiro, Ian Reid, and Tom Drummond. Smart mining for deep metric learning. In Proceedings of the IEEE International Conference on Computer Vision, pages 2821–2829, 2017.
- [15] Bing He, Jia Li, Yifan Zhao, and Yonghong Tian. Part-regularized near-duplicate vehicle re-identification. In Proceedings of the IEEE/CVF Conference on Computer Vision and Pattern Recognition, pages 3997–4005, 2019.
- [16] Kaiming He, Xiangyu Zhang, Shaoqing Ren, and Jian Sun. Deep residual learning for image recognition. In Proceedings of the IEEE conference on computer vision and pattern recognition, pages 770–778, 2016.
- [17] Lingxiao He, Xingyu Liao, Wu Liu, Xinchen Liu, Peng Cheng, and Tao Mei. Fastreid: A pytorch toolbox for general instance re-identification. arXiv preprint arXiv:2006.02631, 2020.
- [18] Shuting He, Hao Luo, Pichao Wang, Fan Wang, Hao Li, and Wei Jiang. Transreid: Transformer-based object re-identification. In Proceedings of the IEEE/CVF international conference on computer vision, pages 15013–15022, 2021.
- [19] Alexander Hermans, Lucas Beyer, and Bastian Leibe. In defense of the triplet loss for person re-identification. arXiv preprint arXiv:1703.07737, 2017.
- [20] Sultan Daud Khan and Habib Ullah. A survey of advances in vision-based vehicle re-identification. Computer Vision and Image Understanding, 182:50–63, 2019.
- [21] Pirazh Khorramshahi, Neehar Peri, Jun-cheng Chen, and Rama Chellappa. The devil is in the details: Self-supervised attention for vehicle re-identification. In European Conference on Computer Vision, pages 369–386. Springer, 2020.
- [22] Prannay Khosla, Piotr Teterwak, Chen Wang, Aaron Sarna, Yonglong Tian, Phillip Isola, Aaron Maschinot, Ce Liu, and Dilip Krishnan. Supervised contrastive learning. Advances in Neural Information Processing Systems, 33:18661–18673, 2020.
- [23] Diederik P Kingma and Jimmy Ba. Adam: A method for stochastic optimization. arXiv preprint arXiv:1412.6980, 2014.
- [24] Martin Koestinger, Martin Hirzer, Paul Wohlhart, Peter M Roth, and Horst Bischof. Large scale metric learning from equivalence constraints. In 2012 IEEE conference on computer vision and pattern recognition, pages 2288–2295. IEEE, 2012.
- [25] Elad Levi, Tete Xiao, Xiaolong Wang, and Trevor Darrell. Rethinking preventing class-collapsing in metric learning with margin-based losses. In Proceedings of the IEEE/CVF International Conference on Computer Vision, pages 10316–10325, 2021.
- [26] Dengjie Li, Siyu Chen, Yujie Zhong, Fan Liang, and Lin Ma. Dip: Learning discriminative implicit parts for person re-identification. arXiv preprint arXiv:2212.13906, 2022.
- [27] Dangwei Li, Xiaotang Chen, Zhang Zhang, and Kaiqi Huang. Learning deep context-aware features over body and latent parts for person re-identification. In Proceedings of the IEEE conference on computer vision and pattern recognition, pages 384–393, 2017.
- [28] Hanjun Li, Gaojie Wu, and Wei-Shi Zheng. Combined depth space based architecture search for person re-identification. In Proceedings of the IEEE/CVF Conference on Computer Vision and Pattern Recognition, pages 6729–6738, 2021.
- [29] Ming Li, Xinming Huang, and Ziming Zhang. Self-supervised geometric features discovery via interpretable attention for vehicle re-identification and beyond. In Proceedings of the IEEE/CVF International Conference on Computer Vision, pages 194–204, 2021.
- [30] Wei Li, Rui Zhao, Tong Xiao, and Xiaogang Wang. Deepreid: Deep filter pairing neural network for person re-identification. In Proceedings of the IEEE conference on computer vision and pattern recognition, pages 152–159, 2014.
- [31] Shengcai Liao and Stan Z Li. Efficient psd constrained asymmetric metric learning for person re-identification. In Proceedings of the IEEE international conference on computer vision, pages 3685–3693, 2015.
- [32] Hongye Liu, Yonghong Tian, Yaowei Yang, Lu Pang, and Tiejun Huang. Deep relative distance learning: Tell the difference between similar vehicles. In Proceedings of the IEEE conference on computer vision and pattern recognition, pages 2167–2175, 2016.
- [33] Xinchen Liu, Wu Liu, Tao Mei, and Huadong Ma. A deep learning-based approach to progressive vehicle re-identification for urban surveillance. In European conference on computer vision, pages 869–884. Springer, 2016.
- [34] Yihang Lou, Yan Bai, Jun Liu, Shiqi Wang, and Lingyu Duan. Veri-wild: A large dataset and a new method for vehicle re-identification in the wild. In Proceedings of the IEEE/CVF conference on computer vision and pattern recognition, pages 3235–3243, 2019.
- [35] Hao Luo, Youzhi Gu, Xingyu Liao, Shenqi Lai, and Wei Jiang. Bag of tricks and a strong baseline for deep person re-identification. In Proceedings of the IEEE/CVF conference on computer vision and pattern recognition workshops, pages 0–0, 2019.
- [36] Tetsu Matsukawa, Takahiro Okabe, Einoshin Suzuki, and Yoichi Sato. Hierarchical gaussian descriptor for person re-identification. In Proceedings of the IEEE conference on computer vision and pattern recognition, pages 1363–1372, 2016.
- [37] Dechao Meng, Liang Li, Xuejing Liu, Yadong Li, Shijie Yang, Zheng-Jun Zha, Xingyu Gao, Shuhui Wang, and Qingming Huang. Parsing-based view-aware embedding network for vehicle re-identification. In Proceedings of the IEEE/CVF conference on computer vision and pattern recognition, pages 7103–7112, 2020.
- [38] Hyun Oh Song, Yu Xiang, Stefanie Jegelka, and Silvio Savarese. Deep metric learning via lifted structured feature embedding. In Proceedings of the IEEE conference on computer vision and pattern recognition, pages 4004–4012, 2016.
- [39] Xingang Pan, Ping Luo, Jianping Shi, and Xiaoou Tang. Two at once: Enhancing learning and generalization capacities via ibn-net. In Proceedings of the European Conference on Computer Vision (ECCV), pages 464–479, 2018.
- [40] Wen Qian, Hao Luo, Silong Peng, Fan Wang, Chen Chen, and Hao Li. Unstructured feature decoupling for vehicle re-identification. In European Conference on Computer Vision, pages 336–353. Springer, 2022.
- [41] Ergys Ristani, Francesco Solera, Roger Zou, Rita Cucchiara, and Carlo Tomasi. Performance measures and a data set for multi-target, multi-camera tracking. In European conference on computer vision, pages 17–35. Springer, 2016.
- [42] Florian Schroff, Dmitry Kalenichenko, and James Philbin. Facenet: A unified embedding for face recognition and clustering. In Proceedings of the IEEE conference on computer vision and pattern recognition, pages 815–823, 2015.
- [43] Hailin Shi, Yang Yang, Xiangyu Zhu, Shengcai Liao, Zhen Lei, Weishi Zheng, and Stan Z Li. Embedding deep metric for person re-identification: A study against large variations. In European conference on computer vision, pages 732–748. Springer, 2016.
- [44] Yumin Suh, Jingdong Wang, Siyu Tang, Tao Mei, and Kyoung Mu Lee. Part-aligned bilinear representations for person re-identification. In Proceedings of the European conference on computer vision (ECCV), pages 402–419, 2018.
- [45] Yifan Sun, Changmao Cheng, Yuhan Zhang, Chi Zhang, Liang Zheng, Zhongdao Wang, and Yichen Wei. Circle loss: A unified perspective of pair similarity optimization. In Proceedings of the IEEE/CVF Conference on Computer Vision and Pattern Recognition, pages 6398–6407, 2020.
- [46] Hugo Touvron, Matthieu Cord, Matthijs Douze, Francisco Massa, Alexandre Sablayrolles, and Hervé Jégou. Training data-efficient image transformers & distillation through attention. In International Conference on Machine Learning, pages 10347–10357. PMLR, 2021.
- [47] Bhavya Vasudeva, Puneesh Deora, Saumik Bhattacharya, Umapada Pal, and Sukalpa Chanda. Loop: Looking for optimal hard negative embeddings for deep metric learning. In Proceedings of the IEEE/CVF International Conference on Computer Vision, pages 10634–10643, 2021.
- [48] Guanshuo Wang, Yufeng Yuan, Xiong Chen, Jiwei Li, and Xi Zhou. Learning discriminative features with multiple granularities for person re-identification. In Proceedings of the 26th ACM international conference on Multimedia, pages 274–282, 2018.
- [49] Haochen Wang, Jiayi Shen, Yongtuo Liu, Yan Gao, and Efstratios Gavves. Nformer: Robust person re-identification with neighbor transformer. In Proceedings of the IEEE/CVF Conference on Computer Vision and Pattern Recognition, pages 7297–7307, 2022.
- [50] Xun Wang, Xintong Han, Weilin Huang, Dengke Dong, and Matthew R Scott. Multi-similarity loss with general pair weighting for deep metric learning. In Proceedings of the IEEE/CVF Conference on Computer Vision and Pattern Recognition, pages 5022–5030, 2019.
- [51] Xinshao Wang, Yang Hua, Elyor Kodirov, Guosheng Hu, Romain Garnier, and Neil M Robertson. Ranked list loss for deep metric learning. In Proceedings of the IEEE/CVF conference on computer vision and pattern recognition, pages 5207–5216, 2019.
- [52] Longhui Wei, Shiliang Zhang, Wen Gao, and Qi Tian. Person transfer gan to bridge domain gap for person re-identification. In Proceedings of the IEEE conference on computer vision and pattern recognition, pages 79–88, 2018.
- [53] Fei Xiong, Mengran Gou, Octavia Camps, and Mario Sznaier. Person re-identification using kernel-based metric learning methods. In European conference on computer vision, pages 1–16. Springer, 2014.
- [54] Hong Xuan, Abby Stylianou, Xiaotong Liu, and Robert Pless. Hard negative examples are hard, but useful. In European Conference on Computer Vision, pages 126–142. Springer, 2020.
- [55] Hong Xuan, Abby Stylianou, and Robert Pless. Improved embeddings with easy positive triplet mining. In Proceedings of the IEEE/CVF Winter Conference on Applications of Computer Vision, pages 2474–2482, 2020.
- [56] Baosheng Yu, Tongliang Liu, Mingming Gong, Changxing Ding, and Dacheng Tao. Correcting the triplet selection bias for triplet loss. In Proceedings of the European Conference on Computer Vision (ECCV), pages 71–87, 2018.
- [57] Ye Yuan, Wuyang Chen, Yang Yang, and Zhangyang Wang. In defense of the triplet loss again: Learning robust person re-identification with fast approximated triplet loss and label distillation. In Proceedings of the IEEE/CVF Conference on Computer Vision and Pattern Recognition Workshops, pages 354–355, 2020.
- [58] Kaiwei Zeng, Munan Ning, Yaohua Wang, and Yang Guo. Hierarchical clustering with hard-batch triplet loss for person re-identification. In Proceedings of the IEEE/CVF Conference on Computer Vision and Pattern Recognition, pages 13657–13665, 2020.
- [59] Zhizheng Zhang, Cuiling Lan, Wenjun Zeng, Xin Jin, and Zhibo Chen. Relation-aware global attention for person re-identification. In Proceedings of the ieee/cvf conference on computer vision and pattern recognition, pages 3186–3195, 2020.
- [60] Jiajian Zhao, Yifan Zhao, Jia Li, Ke Yan, and Yonghong Tian. Heterogeneous relational complement for vehicle re-identification. In Proceedings of the IEEE/CVF International Conference on Computer Vision, pages 205–214, 2021.
- [61] Liming Zhao, Xi Li, Yueting Zhuang, and Jingdong Wang. Deeply-learned part-aligned representations for person re-identification. In Proceedings of the IEEE international conference on computer vision, pages 3219–3228, 2017.
- [62] Liang Zheng, Liyue Shen, Lu Tian, Shengjin Wang, Jingdong Wang, and Qi Tian. Scalable person re-identification: A benchmark. In Proceedings of the IEEE international conference on computer vision, pages 1116–1124, 2015.
- [63] Kaiyang Zhou, Yongxin Yang, Andrea Cavallaro, and Tao Xiang. Omni-scale feature learning for person re-identification. In Proceedings of the IEEE/CVF International Conference on Computer Vision, pages 3702–3712, 2019.
- [64] Kuan Zhu, Haiyun Guo, Zhiwei Liu, Ming Tang, and Jinqiao Wang. Identity-guided human semantic parsing for person re-identification. In European Conference on Computer Vision, pages 346–363. Springer, 2020.
Supplementary Materials
1.1 Proof
Unlike traditional dense sampling methods that may suffer from sampling harmful pairs, the proposed Sparse Pairwise (SP) loss can effectively avoid introducing harmful positive pairs when combined with our least-hard positive mining strategy. Here, we provide a simple theoretical proof to demonstrate the expected percentage of harmful pairs sampled by SP in a mini-batch is lower than that by the traditional dense sampling methods.
Let us assume that harmful positive pairs always have lower visual similarities than real positive pairs (which is true in general). Given a mini-batch with IDs and each ID contains instances, which shape a positive similarity matrix , dense methods sample positive pairs with the lowest similarities in each row of . While our approach utilizes the pair with the highest similarity from the positive pairs sampled by dense methods. Suppose there are harmful positive pairs for each ID, which results in two situations according to the value of :
Situation I: . SP does not encounter harmful pairs because at least positive pairs with similarity smaller than the pair sampled by SP, while there are only harmful pairs. However, dense methods definitely sample harmful pairs and its expectation of sampling harmful pairs is assumed to be .
Situation II: . SP is possibly sampling harmful pairs and its sampling expectation is assumed to be since it only samples one positive pair for each ID. Meanwhile, the expectation of dense methods for sampling harmful pairs is given by:
| (S1) |
where denotes the expectation of dense methods for the ID that SP does not sample a harmful pair.
Assume the numbers of ID with and in a mini-batch are and , respectively. The expected percentage of harmful pairs sampled by SP and dense approaches in a mini-batch can be given by:
| (S2) |
| (S3) |
Therefore, is concluded. Especially for the ID with , SP can completely avoid sampling harmful positive pairs.
1.2 Additional Results
| Person | #ID | #images | Vehicle | #ID | #images |
|---|---|---|---|---|---|
| CUHK03 | 1467 | 13164 | VeRi-776 | 776 | 49357 |
| Market-1501 | 1501 | 32668 | VehicleID | 26328 | 221567 |
| DukeMTMC | 1404 | 36411 | VERI-WILD | 40671 | 416314 |
| MSMT17 | 4101 | 126441 | – | – | – |
Robustness to increasing intra-class variations.
To demonstrate the robustness of SP loss towards increasing intra-class variations, we also evaluate various metric losses on the VeRi-776 dataset. The experimental results are exhibited in Fig. S1. Consistent with the results on the MSMT17 dataset, shown in the main text, all metric losses still suffer from a performance decline as the intra-class variations increase. It can be observed that the EP loss achieves very limited mAP even though instances per identity are utilized. Besides, the performance of SupCon loss drops sharply and the MS loss loses more than of mAP with a growing number of instances. The triplet loss still outperforms other dense pairwise losses and achieves comparable performance with our SP-H loss. However, it can be seen that SP loss variants with the least-hard and the adaptive positive mining strategies lose less than of mAP when the instance number increases to , indicating considerable robustness toward increasing intra-class variations.
| Backbone | Loss | MSMT17 | Market1501 | DukeMTMC | CUHK03-L | CUHK03-D | |||||
|---|---|---|---|---|---|---|---|---|---|---|---|
| mAP | R1 | mAP | R1 | mAP | R1 | mAP | R1 | mAP | R1 | ||
| ResNet50-IBN | Triplet-BH | 57.3 | 80.0 | 83.3 | 93.1 | 75.0 | 86.6 | 65.5 | 67.6 | 62.1 | 65.0 |
| AdaSP | 61.7 | 83.7 | 87.7 | 95.4 | 79.8 | 90.3 | 69.7 | 71.4 | 67.6 | 70.3 | |
| ResNet-152 | Triplet-BH | 57.9 | 80.2 | 84.8 | 93.7 | 77.1 | 88.1 | 69.3 | 72.1 | 64.8 | 68.0 |
| AdaSP | 60.1 | 82.4 | 88.1 | 95.0 | 80.0 | 89.4 | 71.6 | 73.2 | 69.2 | 79.4 | |
| MGN | Triplet-BH | 59.2 | 80.8 | 88.1 | 95.0 | 79.1 | 88.6 | 74.9 | 76.9 | 72.2 | 75.1 |
| AdaSP | 60.6 | 82.1 | 88.5 | 95.5 | 80.3 | 90.1 | 77.7 | 79.7 | 74.5 | 77.3 | |
Generalizing to different networks.
We also test SP loss on other networks, including ResNet50-IBN, ResNet-152 and MGN, with the input size of . The experimental results are shown in Tab. S2. Compared to ResNet-50, the performance of Triplet-BH on each dataset is significantly increased by these well-designed networks. Nevertheless, our approach AdaSP can still facilitate the ReID performance on each dataset, especially the hard ones, such as MSMT17 and CUHK03.
Impact of hyper-parameters.
We adopt the VeRi-776 dataset to explore the impact of hyper-parameters on Vehicle ReID tasks. The experimental results are exhibited in Tab. S3 and S4. The best mAP is achieved at a temperature of and a weight of . In addition, it can be seen that all the mAPs are higher than when the weight of SP loss varies from to , suggesting that the vehicle ReID performance is not sensitive to the weight of SP loss.
| 0.1 | 0.3 | 0.5 | 0.7 | 0.9 | |
|---|---|---|---|---|---|
| mAP | 82.0 | 82.5 | 82.7 | 82.4 | 82.2 |
| R1 | 97.1 | 97.0 | 96.7 | 96.7 | 96.5 |
| 0.01 | 0.02 | 0.03 | 0.04 | 0.05 | 0.06 | 0.07 | 0.08 | 0.09 | |
|---|---|---|---|---|---|---|---|---|---|
| mAP | 67.6 | 76.0 | 79.9 | 82.6 | 82.7 | 82.1 | 81.6 | 78.9 | 77.1 |
| 1 | 90.5 | 94.3 | 95.5 | 96.8 | 96.7 | 97.0 | 96.4 | 96.0 | 95.1 |