Effects of lattice geometry on thermopower properties of the repulsive Hubbard model
Abstract
We obtain the Seebeck coefficient or thermopower , which determines the conversion efficiency from thermal to electrical energy, for the two-dimensional Hubbard model on different geometries (square, triangular, and honeycomb lattices) for different electronic densities and interaction strengths. Using Determinantal Quantum Monte Carlo (DQMC) we find the following key results: (a) the bi-partiteness of the lattice affects the doping dependence of ; (b) strong electronic correlations can greatly enhance and produce non-trivial sign changes as a function of doping especially in the vicinity of the Mott insulating phase; (c) near half filling can show non-monotonic behavior as a function of temperature. We emphasize the role of strong interaction effects in engineering better devices for energy storage and applications, as captured by our calculations of the power factor where is the dc conductivity.
pacs:
71.10.Fd, 71.30.+h, 02.70.UuI Introduction
Over the past decades, a great deal of interest has been given to increasing the efficiency of electrical devices. As a possible route to this end, the thermoelectric materials may play a crucial role, once they exhibit induced voltage in presence of a temperature gradient, whose magnitude is quantified by the Seebeck coefficient, the thermoelectric Power Factor, and, eventually, the Figure of Merit Hébert et al. (2015). However, there are many technical issues that make the development of efficient thermoelectric materials a challenge, e.g., the toxicity of the compounds, or their thermal instability. There are few ways to overcome these problems: (i) optimizing the already known compounds through band-structure engineering and nanostructuration techniques Ding and Li (2015); Heremans et al. (2008); Hicks and Dresselhaus (1993), or (ii) seeking new classes of compounds which exhibit unconventional properties usually related to strong electron-electron interactions Wissgott et al. (2010). In view of the increasing number of novel correlated compounds, controlling and manipulating geometry and correlations to enhance the thermopower properties is an open issue.
Despite intense experimental efforts, further theoretical investigations are required, in particular to understand interacting electronic compounds, such as NaxCoO2 or FeSb2, which exhibit unusual large thermopower response Wissgott et al. (2010, 2011); Tomczak (2018). In the former, the combination of quasi two-dimensional character with band topology and strong electronic correlations make this material an interesting playground to examine thermoelectricity. Once the charge carriers are confined to the hexagonal layers of Co atoms, a disordered distribution of Na ions above and below it can induce a charge imbalance. Using local-density approximation and dynamical mean-field theory, Held et al Wissgott et al. (2010) showed that disorder combined with the pudding-mold band structure and strong correlations enforce the electron-hole imbalance and enhances the thermopower by with respect to the non-interacting case.
The thermopower of superconducting cuprates has been experimentally studied Obertelli et al. (1992); Tallon et al. (1995); Honma and Hor (2008); Benseman et al. (2011), with different compounds displaying very similar behavior with a sign change of the Seebeck coefficient near the maximum critical temperature Obertelli et al. (1992). This nearly universal behavior has been the subject of theoretical interest, being ascribed to a possible underlying critical point Garg et al. (2011), to the presence of a van Hove singularity McIntosh and Kaiser (1996), and has been recently observed for the Hubbard Model with next-nearest neighbor hopping Wen O. Wang and Devereaux (2023).
In view of these stimulating results, we explore how electron-electron interactions and geometry affect the Seebeck coefficient, and the thermoelectric Power Factor. To this end, we use unbiased Quantum Monte Carlo simulations to study the single band repulsive Hubbard model. We analyze the thermoelectric and electrical transport properties in the long wavelength DC limit in two-dimensions, in the square, triangular and honeycomb lattices. Our study finds a strong influence of particle hole symmetry of the many body spectrum and DOS on the behavior of the Seebeck coefficient with respect to doping. We show non trivial sign changes of the Seebeck coefficient that signal a deviation of the Fermi surface from the Luttinger count and a subsequent anomalous change of the type of carriers below and above half filling. The sign change is also accompanied by a significant increase of the Seebeck coefficient near half filling with respect to the non-interacting and weakly interacting case. We show that despite using a simplified thermodynamic formula for the Seebeck coefficient that is independent of dynamical quantities, we are able to capture the effects of strong correlation.
The paper is organized as follows: In Section II we discuss the Hubbard model, an introduction to the Seebeck coefficient, Kelvin formula and the auxiliary field QMC method used to solve it. In Section III we discuss how to calculate the entropy and present our results for this quantity. Section IV shows the Local Density of States and conductivity results. In Section V we discuss the Seebeck coefficient and in Section VI the Power Factor. Finally, in section VII we summarize our findings.
II Model and methods
The repulsive Fermi Hubbard model describes electrons on a lattice with an onsite repulsive interaction, with the Hamiltonian
| (1) |
where the sums run over sites of a given two-dimensional lattice, with denoting nearest-neighbor sites. Here, we use the second quantization formalism, with () being creation (annihilation) operators of electrons on a given site , and spin , while are number operators. The first two terms on the right-hand side of Eq. (II) correspond to the hopping of electrons, and the chemical potential , respectively, with the latter determining the filling of the lattice. The third term describes the local repulsive interaction between electrons, with interaction strength U; the factor of is introduced to ensure invariance of the hamiltonian under particle-hole transformations on bipartite lattices. This implies that for the bipartite lattices we consider here (square and honeycomb lattices), sets half-filling for all temperatures.
Our central quantities of interest are the transport coefficients, and their behavior with respect to doping and strength of interactions. The transport coefficients are defined through the following relations,
| (2) |
where and are the electrical and thermal currents, and the s are rank 2 tensors defining conductivities of the system. The tensors and are the electrical and thermal conductivities, and () are the thermoelectrical(electrothermal) conductivities. The thermopower or Seebeck coefficient is defined as
| (3) |
where the second equality is due to Onsager’s reciprocity relationsOnsager (1931). Using linear response theory with respect to electrical field and temperature, the Seebeck coefficient in the Kubo formalism can also be written as
| (4) |
where
define the electrothermal and electrical conductivities, respectively. Evaluation of a Kubo-like formula (Eq (4)) is not easy for interacting systems in the thermodynamic limit, although it is the most insightful. Alternate formulas like the Mott formulaJonson and Mahan (1980), Heikes-MottHeikes et al. (1961), high frequency SeebeckShastry (2006, 2008); Zdroj (2007) and Kelvin formulaPeterson and Shastry (2010a); Shastry (2008) exist but are limited by their applicability to specific scenarios (weakly correlated metal at low temperatures for the Mott formula, high-temperature limit for the Heikes-Mott formula, and measurement of transport at high frequencies compared to characteristic energy scale for high-frequency Seebeck formula). The Kelvin formula was proposed by Lord Kelvin to provide reciprocity between Seebeck and Peltier coefficients, and is calculated in the slow limit (); it can be derived by taking the slow limit of Eq (4) Peterson and Shastry (2010a). The Kelvin formula for the Seebeck coefficient is
where the second equality follows from Maxwell’s relations. Although expressed in terms of thermodynamic quantities, which are sufficient to capture the effects from the many-body density of states, it misses kinematic factors like contributions from velocities at the Fermi surface and relaxation times. Nonetheless, the effects of strong correlations on the low-frequency transport behavior are taken into account, as it retains the approximation, which the high frequency formula, misses. The justification and benchmark of using the Kelvin formula for strongly interacting systems like the Hubbard model and fractionalized systems like FQHE states have already been establishedArsenault et al. (2013); Peterson and Shastry (2010a).
We investigate the thermodynamics and transport properties of Eq. (II) on three different lattices: square, triangular and honeycomb. In particular, we examine the behavior of the entropy, conductivity, Local Density of States (LDOS), Seebeck coefficient, and Power Factor as functions of lattice filling, for different values of interaction strengths. To this end, we perform unbiased determinant quantum Monte Carlo (DQMC) simulations Blankenbecler et al. (1981); Hirsch (1983, 1985); White et al. (1989), a state-of-the-art numerical method that maps a many-particle interacting fermionic system into a single-particle (quadratic form) one, with the aid of bosonic auxiliary fields. More details about the methodology may be found in, e.g., Refs. Gubernatis et al., 2016; Becca and Sorella, 2017; dos Santos, 2003, and references therein. Our DQMC simulations are performed for finite-sized systems (with 100, 144 and 162 sites for the square, triangular, and honeycomb lattices, respectively), and for interaction strengths , 2, 4, 6, 8, and 10; i.e., from non-interacting to strong coupling regimes. Throughout this work, unless otherwise indicated, we consider , which corresponds to an energy scale low enough to observe the crossover towards an insulating phase at half-filling Kim et al. (2020); Simkovic et al. (2020); Lenihan et al. (2021). Hereafter, we define the lattice constant as unity, and the hopping integral as the energy scale.
III Entropy
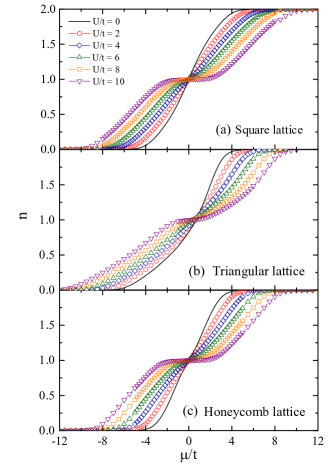
We start our analysis with the electronic density as a function of chemical potential shown in Figure 1 for and the different lattices studied: (a) square, (b) triangular, and (c) honeycomb. Particle-hole symmetry is evident for the square and honeycomb lattices, where . In all geometries, correlations lead to the formation of a Mott plateau (insulating phase) around half-filling, although the critical interaction strength for the onset of “Mottness” is strongly influenced by the lattice geometry.
As the Seebeck coefficient is obtained from the entropy, we now turn to discuss its behavior for these geometries. The entropy can be obtained from the electronic density, , by integrating it over the chemical potential ,
| (6) |
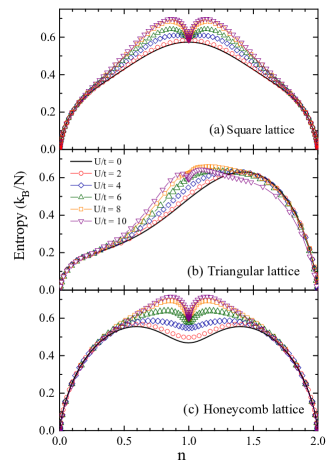
Figure 2 (a) displays as a function of for the square lattice. One may notice that, at , the results for (red circles symbols) and (blue diamond symbols) exhibit very similar behavior to the non-interacting one (solid black curve), once the temperature is high enough to destroy the correlation effects for such small interaction strengths. However as increases, e.g. , 8, and 10 the entropy presents a local minimum at half-filling, being drastically reduced as , due to the Mott gap formation in the ground state Bonča and Prelovšek (2003); Khatami and Rigol (2011); Simkovic et al. (2020); Mikelsons et al. (2009); Paiva et al. (2001). The increased entropy for the metallic state in the vicinity of half-filling in the presence of interactions has been observed for the cubic lattice and is relevant for cold fermionic atoms trapped in optical lattices, where the metallic region of the atomic cloud is used to absorb entropy and allow a central Mott region at a higher entropy per particle Paiva et al. (2011).
Unlike what is observed for the square lattice, the entropy behavior on the triangular geometry only exhibits such a local minimum at , the largest interaction strength considered, as presented in Fig. 2 (b). This suggests an absence of a Mott gap for weak and intermediate interaction strengths. In fact, at , a small dip starts to form around , in line with the expectation for a metal-to-insulator transition occurring for Yoshioka et al. (2009); Shirakawa et al. (2017); Garwood et al. (2022). The lack of particle-hole symmetry in the triangular lattice shown in Fig. 1 (c) is clearly also present in the entropy.
The entropy for the honeycomb lattice is more subtle. Similar to the square and triangular lattices, a local minimum appears at half-filling in presence of strong interaction; however, different from what is seen in the two previous cases, here displays a suppression at half-filling even for the non-interacting case. This behavior is understood by recalling that the honeycomb lattice has a vanishing DOS at half-filling, with van Hove singularities below and above it. That is, the results of Fig. 2 confirm our expectations that the entropy provides hints about the DOS, irrespective of the interaction strengths. These odd features of the honeycomb lattice lead to strong changes for the Seebeck coefficient at , as we shall see in Section V, and may obscure some of the the electronic correlation effects.
IV Local Density of states and conductivity
As discussed before, Fig. 1 signals the occurrence of a Mott insulating state due to the presence of a plateau in the density as a function of chemical potential, driven by correlations. The subtleties in the entropy require an analysis of the suppression of spectral weight for different densities. In order to avoid numerical analytical continuations, we examine the LDOS only at the Fermi level (), which is obtained through Trivedi and Randeria (1995)
| (7) |
where is the real space and imaginary time Green’s function calculated at , and imaginary time (hereafter, is the inverse of temperature, and the Boltzmann constant).
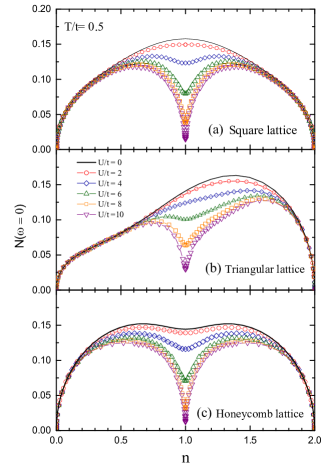
Fig. 3 shows for the (a) square, (b) triangular, and (c) honeycomb lattices. A common feature for all geometries is that the non-interacting case is an upper bound for the LDOS, with data close to the empty and completely filled systems showing a negligible dependence on the interaction strength. For the temperature shown, , we can see that for the square lattice and the dip at half-filling has not developed yet. As correlations increase, the dip starts to form, leading to maxima at and . The non-interacting ground state for the honeycomb lattice is known to be a semi-metal, with a vanishing LDOS at half-filling at . Figure 3(c) shows a dip in the DOS at already for , in line with entropy data. Similar to what is seen for the square lattice, maxima develop as correlations increase, but the positions are moved to and . The triangular lattice LDOS shows a distinct behavior, as can be seen in figure 3(b), with a broad peak for located at . The effects of correlations are only relevant for . For the larger values of considered, a small broad peak is present at and a higher one at , with a dip at half-filling signaling the Mott state for large .
To further investigate the transport properties, we now turn to the longitudinal dc conductivity,
| (8) |
in which
| (9) |
is the current-current correlation function with being the Fourier transform of the unequal-time current operator
| (10) |
Here we also avoid analytical continuation, see, e.g., Refs. Trivedi et al., 1996; Denteneer et al., 1999; Mondaini et al., 2012.
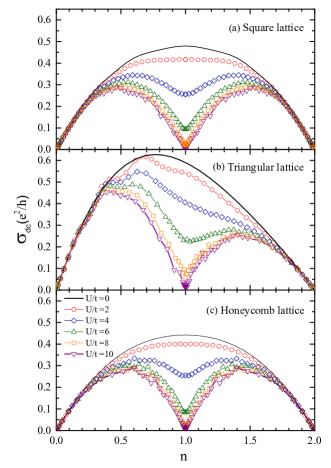
Similar to what is seen for the LDOS, correlations reduce the conductivity, with the non-interacting conductivity as an upper limit for all the geometries studied as shown in Fig. 4. Once again, correlations are shown to be irrelevant to transport properties for densities near the completely empty or filled bands, while its effects increase as half-filling is approached, with as increases. It is interesting to note that, for the honeycomb lattice, the dip in the non-interacting DOS is not accompanied by a dip in the conductivity [shown in Figs. 3(c) and 4(c), respectively]. For large values of , the maxima for the conductivity are not at the same densities as the ones for the LDOS; for the square lattice, the conductivity has maxima at and . For the honeycomb lattice, the maxima are at and and for the triangular lattice, the maxima are at and . For the triangular lattice, one can see that both the peak and the higher intensity peak for the LDOS, which are above half-filling, move to densities below half-filling for the conductivity.
V Seebeck coefficient
We now turn to the Seebeck coefficient, which is obtained from the entropy by using the Kelvin formula Peterson and Shastry (2010b); Arsenault et al. (2013),
| (11) |
Within this approach, Fig. 5 displays the behavior of in units of as a function of the electronic density for the (a) square, (b) triangular, and (c) honeycomb lattices.
At this point, it is worth recalling that the sign of the Seebeck coefficient is directly related to the type of carrier, being negative for holes and positive for electrons. As a consequence of particle-hole symmetry for the square and honeycomb lattices, one has , leading to . For all geometries examined, the effect of correlations is strongly dependent on density, being negligible for and , as previously observed for entropy, DOS and conductivity.
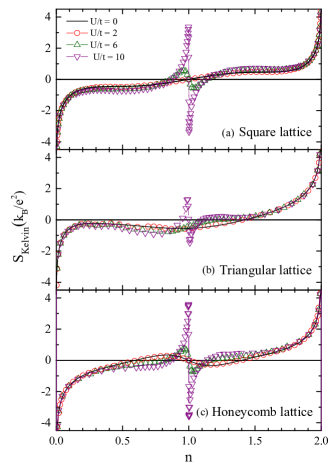
As expected, the Seebeck coefficient for the non-interacting square lattice presents only one sign change, at half-filling, as shown in Fig. 5 (a). However, notice that in the presence of strong correlations () there is an anomalous behavior, characterized by a change of sign for densities away from half-filling, also displayed in Fig. 6 (a) for . In addition, there is a notable increase in the absolute value of Seebeck coefficient, compared to the non-interacting case. For instance, at , , at , while for , . This steep increase can be explained by noting that the Seebeck coefficient, as defined in Eq. (3), is the ratio between the longitudinal thermoelectric and electrical conductivities. As we approach the Mott insulator at half-filling, electrons form local moments and electrical transport is strongly reduced, as shown by both conductivity and LDOS in the previous section. The fast-decreasing electrical conductivity in the vicinity of half-filling must be accompanied by a non-vanishing thermoelectric current for the peaks to form. We can understand this as follows: at half-filling and strong correlations, each site is singly occupied and local moments are completely formed, there is no electric or thermoelectric transport and the Seebeck coefficient is zero. As we move slightly away from half-filling, there is a background of local moments over which carriers lead to thermoelectric and electric currents. This reduced number of carriers is in line with the breaking of Luttinger count Osborne et al. (2021); Gröber et al. (2000); Sakai et al. (2009) that has been established for the Fermi Hubbard model and is in agreement with the change in carrier density in Hall experiments for YBCO Badoux et al. (2016).
Due to absence of particle-hole symmetry in the triangular lattice, the sign change of in the non-interacting limit occurs away from half-filling, at , as shown in Fig. 5 (b), as opposed to the square lattice, which has particle-hole symmetry, and exhibits the sign change symmetrically around half filling. There is a range of densities, around where correlations lead to a small increase in modulus of the Seebeck coefficient. In contrast to the square lattice, the peak in the Seebeck coefficient for the triangular lattice at is only present for very strong interactions. For , , while for , for this electronic density . Strong correlations, around , are needed to change the sign of the Seebeck coefficient at half-filling, as presented in Fig. 6 (b). Interestingly, above half-filling and below the sign-change point for , the correlations are detrimental to the thermopower up to , bringing the Seebeck coefficient closer to zero.
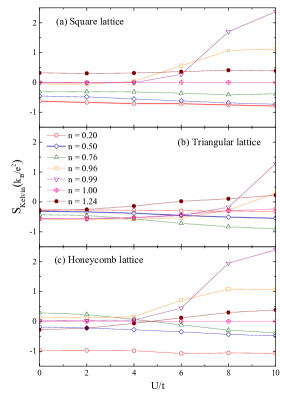
Fig. 5 (c) shows the Seebeck coefficient for the honeycomb lattice. For the non-interacting system, changes sign at , 1.0, and 1.4, therefore the charge of the carriers is negative for and , while it is positive for and . Interestingly, these densities correspond to the peaks and dip positions for the conductivity, as seen in Fig. 4 (c). We recall that such changes in carriers come from the fact that the honeycomb lattice has two bands for the noninteracting case, so one may expect changes from electron to hole properties of the transport coefficients depending on the filling of each band. However, correlations push the sign change to values closer to half-filling, going from and at to and at . One thing to note is that although the behavior of the Seebeck coefficient is very different between the square and the honeycomb lattice in the noninteracting limit, adding interactions and transitioning to the Mott insulating state seems to wash these differences away. This can be understood by noting that in the noninteracting picture, the transport is determined by the Bloch bands which are different for square and honeycomb lattices. However, with strong interactions, Mott physics destroys the Bloch bands, opens up a Mott gap, and forms upper and lower Hubbard bands. While details of the single particle bands are erased, the information about the particle-hole symmetry imprinted in the many body spectrum is still retained. Hence the behavior of the Seebeck coefficient is qualitatively similar between the square and honeycomb lattice but different from the triangular lattice.
Similar to the square lattice, there is a significant increase in the Seebeck coefficient for the honeycomb lattice close to half-filling at , 8 and 10, as shown for and in Fig. 6 (c). For , for example, we have that for , , while in the non-interacting case () for this density value, , an enhancement of two orders of magnitude.
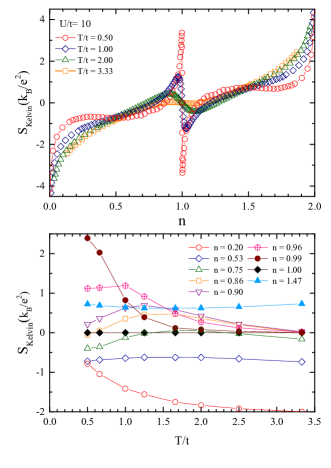
We also analyze the effects of temperature on the thermopower for the square lattice at . Figure 7 (a) displays as a function of for different , while Fig. 7 (b) shows as a function of for different densities. Curves for different temperatures nearly cross around and [Fig. 7(a)], leading to almost horizontal lines for and in Fig. 7(b). For and reducing the temperature is detrimental to the thermopower, as seen by a reduction of the modulus of the Seebeck coefficient for . For densities in the range and , the behavior of with temperature is non-monotonic, and can change sign with , as shown for in figure 7(b). Finally, the anomalous behavior in the vicinity of half-filling has a marked dependence on temperature, increasing the modulus of the Seebeck coefficient as is reduced. This fast increase of the thermopower with decreasing temperature close to half-filling has also been observed in the modelPeterson and Shastry (2010a), Hubbard model on an FCC latticeArsenault et al. (2013) and Hubbard Model Wen O. Wang and Devereaux (2023).
VI Thermoelectric Power factor
Proceeding, we now discuss the effects of correlations to the thermoelectric Power Factor (PF), defined as
| (12) |
where the dc conductivity () and the Seebeck coefficient (S) were obtained in Sections IV and V, respectively. Simultaneously increasing both the modulus of the Seebeck coefficient and the conductivity maximizes the Power Factor. Strategies to determine the Seebeck coefficient that leads to an optimum thermoelectric Power Factor have been sought theoretically for systems that can be described by the Boltzmann transport equation Pichanusakorn and Bandaru (2009) and experimentally for CZTS thin films Ashfaq et al. (2020) and La-doped SrTiO3 Jalana and Stemmerb (2010) thin films.
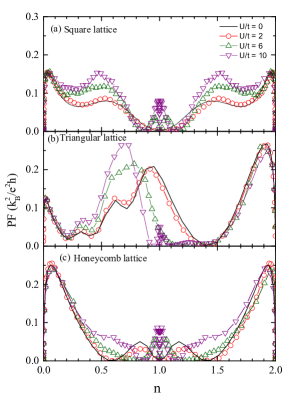
Fig. 8 shows the thermoelectric Power Factor as a function of density for fixed , and for the three analyzed geometries. A common feature to all data is the presence of peaks close to the empty () and completely filled lattices (). Starting with completely empty (filled) lattices, as density increases (decreases) the conductivity increases, and the Seebeck coefficient modulus decreases, leading to peaks that are independent of interaction strength. As the conductivity goes to zero for Mott insulators, at half-filling for a geometry-dependent value of . For the square lattice, the hump in for around (1.4) turns into a peak at (1.5) with the increase of correlations, the dominant contribution coming from the conductivity.
The effect of correlations for the intermediate densities peak of the honeycomb lattice is more subtle, as can be seen in figure 8(c). The peaks for the non-interacting system at () decrease in intensity with correlations for and 4, and then a shoulder develops at lower (higher) densities for larger . Close to half-filling once again correlations drive the Seebeck coefficient peak up which in turn leads to the peaks.
For the triangular lattice one can see that the non-interacting system has a peak at . Correlations move the peak to lower densities and increase its intensity, as clearly seen in figure 8(b), where the peak for is at . As for the other geometries, a peak develops in the vicinity of the Mott insulating state, here only seen for the larger values of studied.
Comparing the overall effects of correlations in the different geometries analyzed, we see that there are clear correlation-induced peaks near half-filling in all cases. For the square and honeycomb lattices, the non-interacting thermoelectric power factor is zero at half-filling and is driven to . Around quarter and three-quarter fillings as well, correlations also play a relevant role in increasing the power factor for the square and honeycomb lattices. Correlations are very effective in increasing the Power Factor in a triangular lattice, where , the largest value obtained, for at . For this geometry, we observe that density can be used to tune the thermoelectric Power Factor.
VII Conclusions
We have studied the thermoelectric properties of strongly interacting two dimensional systems with different geometries. Our results clearly show an anomaly in the Seebeck coefficient in the vicinity of half-filling, characterized by an enhanced response depending on both geometry and interaction strength. The anomaly is characterized by a change in the sign of the carriers which is accompanied by an interaction-induced increase. The anomaly is also intensified with the reduction of temperature.
The thermoelectric Power Factor displays a competition between the Seebeck coefficient and the conductivity. The anomaly in the Seebeck coefficient is reflected in the , with correlation-driven peaks immediately below and above half-filling at geometry-dependent values of . The decreasing conductivity near half-filling is the limiting factor in the intensity of in this region of densities. Away from half-filling, at intermediate densities (around and ) the peaks in have a strong contribution from the conductivity with positions strongly dependent on geometry. For this range of densities, peak position and intensity can be tuned by correlations. Although the Seebeck coefficient is smaller for the triangular lattice, the Power Factor for this geometry shows the higher peak values and the stronger tunability with density and correlations, making it a strong candidate for enhanced thermoelectric properties.
ACKNOWLEDGMENTS
Financial support from Fundação Carlos Chagas Filho de Amparo à Pesquisa do Estado do Rio de Janeiro, grant numbers E-26/204.308/2021 (W.C.F.S.), E-26/200.258/2023 - SEI-260003/000623/2023 (N.C.C.), E-26/200.959/2022 (T.P.), and E-26/210.100/2023 (T. P.); CNPq grant numbers 313065/2021-7 (N.C.C.), 403130/2021-2 (T.P.), and 308335/2019-8 (T.P.) is gratefully acknowledged. We also acknowledge support from INCT-IQ. We acknowledge support from NSF Materials Research Science and Engineering Center (MRSEC) Grant No. DMR-2011876 and NSF-DMR 2138905 (SR,AS,NT). We also acknowledge computational resources from the Unity cluster at the Ohio State University.
References
- Hébert et al. (2015) S. Hébert, D. Berthebaud, R. Daou, Y. Bréard, D. Pelloquin, E. Guilmeau, F. Gascoin, O. Lebedev, and A. Maignan, Searching for new thermoelectric materials: some examples among oxides, sulfides and selenides, Journal of Physics: Condensed Matter 28, 013001 (2015).
- Ding and Li (2015) G. Ding and J. Li, Band structure engineering of multiple band degeneracy for enhanced thermoelectric power factors in MTe and MSe (M = Pb, Sn, Ge), RSC Adv. 5, 91974 (2015).
- Heremans et al. (2008) J. P. Heremans, V. Jovovic, E. S. Toberer, A. Saramat, K. Kurosaki, A. Charoenphakdee, S. Yamanaka, and G. J. Snyder, Enhancement of thermoelectric efficiency in PbTe by distortion of the electronic density of states, Science 321, 554 (2008).
- Hicks and Dresselhaus (1993) L. D. Hicks and M. S. Dresselhaus, Effect of quantum-well structures on the thermoelectric figure of merit, Phys. Rev. B 47, 12727 (1993).
- Wissgott et al. (2010) P. Wissgott, A. Toschi, H. Usui, K. Kuroki, and K. Held, Enhancement of the NaxCoO2 thermopower due to electronic correlations, Phys. Rev. B 82, 201106 (2010).
- Wissgott et al. (2011) P. Wissgott, A. Toschi, G. Sangiovanni, and K. Held, Effects of electronic correlations and disorder on the thermopower of NaxCoO2, Phys. Rev. B 84, 085129 (2011).
- Tomczak (2018) J. M. Tomczak, Thermoelectricity in correlated narrow-gap semiconductors, Journal of Physics: Condensed Matter 30, 183001 (2018).
- Obertelli et al. (1992) S. D. Obertelli, J. R. Cooper, and J. L. Tallon, Systematics in the thermoelectric power of high- oxides, Phys. Rev. B 46, 14928 (1992).
- Tallon et al. (1995) J. L. Tallon, C. Bernhard, H. Shaked, R. L. Hitterman, and J. D. Jorgensen, Generic superconducting phase behavior in high- cuprates: variation with hole concentration in , Phys. Rev. B 51, 12911 (1995).
- Honma and Hor (2008) T. Honma and P. H. Hor, Unified electronic phase diagram for hole-doped high- cuprates, Phys. Rev. B 77, 184520 (2008).
- Benseman et al. (2011) T. M. Benseman, J. R. Cooper, C. L. Zentile, L. Lemberger, and G. Balakrishnan, Valency and spin states of substituent cations in , Phys. Rev. B 84, 144503 (2011).
- Garg et al. (2011) A. Garg, B. S. Shastry, K. B. Dave, and P. Phillips, Thermopower and quantum criticality in a strongly interacting system: parallels with the cuprates, New Journal of Physics 13, 083032 (2011).
- McIntosh and Kaiser (1996) G. C. McIntosh and A. B. Kaiser, van hove scenario and thermopower behavior of the high- cuprates, Phys. Rev. B 54, 12569 (1996).
- Wen O. Wang and Devereaux (2023) E. W. H. B. M. Wen O. Wang, Jixun K. Ding and T. P. Devereaux, Quantitative assessment of the universal thermopower in the Hubbard model, arXiv:2302.13169 (2023).
- Onsager (1931) L. Onsager, Reciprocal relations in irreversible processes. I., Physical Review 37, 405 (1931).
- Jonson and Mahan (1980) M. Jonson and G. Mahan, Mott’s formula for the thermopower and the Wiedemann-Franz law, Physical Review B 21, 4223 (1980).
- Heikes et al. (1961) R. Heikes, R. Ure, and S. Angello, Thermoelectricity: Science and Engineering (Interscience Publishers, 1961).
- Shastry (2006) B. S. Shastry, Sum rule for thermal conductivity and dynamical thermal transport coefficients in condensed matter, Physical Review B 73, 085117 (2006).
- Shastry (2008) B. S. Shastry, Electrothermal transport coefficients at finite frequencies, Reports on progress in physics 72, 016501 (2008).
- Zdroj (2007) L. Zdroj, Theory of dynamical thermal transport coefficients in correlated condensed matter, Lec- ture notes given at the 43rd Karpacz Winter School of Theoretical Physics on Condensed Matter Physics in the Prime of XXI Century:Phenomena, Materials, Ideas, Methods (2007).
- Peterson and Shastry (2010a) M. R. Peterson and B. S. Shastry, Kelvin formula for thermopower, Phys. Rev. B 82, 195105 (2010a).
- Arsenault et al. (2013) L.-F. Arsenault, B. S. Shastry, P. Sémon, and A.-M. S. Tremblay, Entropy, frustration, and large thermopower of doped mott insulators on the fcc lattice, Phys. Rev. B 87, 035126 (2013).
- Blankenbecler et al. (1981) R. Blankenbecler, D. J. Scalapino, and R. L. Sugar, Monte Carlo calculations of coupled boson-fermion systems. I, Phys. Rev. D 24, 2278 (1981).
- Hirsch (1983) J. E. Hirsch, Discrete Hubbard-Stratonovich transformation for fermion lattice models, Phys. Rev. B 28, 4059 (1983).
- Hirsch (1985) J. E. Hirsch, Two-dimensional Hubbard model: Numerical simulation study, Phys. Rev. B 31, 4403 (1985).
- White et al. (1989) S. R. White, D. J. Scalapino, R. L. Sugar, N. E. Bickers, and R. T. Scalettar, Attractive and repulsive pairing interaction vertices for the two-dimensional Hubbard model, Phys. Rev. B 39, 839 (1989).
- Gubernatis et al. (2016) J. Gubernatis, N. Kawashima, and P. Werner, Quantum Monte Carlo Methods: Algorithms for Lattice Models (Cambridge University Press, Cambridge, England, 2016).
- Becca and Sorella (2017) F. Becca and S. Sorella, Quantum Monte Carlo approaches for correlated systems (Cambridge University Press, Cambridge, England, 2017).
- dos Santos (2003) R. R. dos Santos, Introduction to quantum Monte Carlo simulations for fermionic systems, Brazilian Journal of Physics 33, 36 (2003).
- Kim et al. (2020) A. J. Kim, F. Simkovic, and E. Kozik, Spin and charge correlations across the metal-to-insulator crossover in the half-filled 2d Hubbard model, Phys. Rev. Lett. 124, 117602 (2020).
- Simkovic et al. (2020) F. Simkovic, J. P. F. LeBlanc, A. J. Kim, Y. Deng, N. V. Prokof’ev, B. V. Svistunov, and E. Kozik, Extended crossover from a fermi liquid to a quasiantiferromagnet in the half-filled 2d Hubbard model, Phys. Rev. Lett. 124, 017003 (2020).
- Lenihan et al. (2021) C. Lenihan, A. J. Kim, F. Šimkovic IV., and E. Kozik, Entropy in the Non-Fermi-Liquid regime of the doped Hubbard model, Phys. Rev. Lett. 126, 105701 (2021).
- Bonča and Prelovšek (2003) J. Bonča and P. Prelovšek, Thermodynamics of the planar Hubbard model, Phys. Rev. B 67, 085103 (2003).
- Khatami and Rigol (2011) E. Khatami and M. Rigol, Thermodynamics of strongly interacting fermions in two-dimensional optical lattices, Phys. Rev. A 84, 053611 (2011).
- Mikelsons et al. (2009) K. Mikelsons, E. Khatami, D. Galanakis, A. Macridin, J. Moreno, and M. Jarrell, Thermodynamics of the quantum critical point at finite doping in the two-dimensional Hubbard model studied via the dynamical cluster approximation, Phys. Rev. B 80, 140505 (2009).
- Paiva et al. (2001) T. Paiva, R. T. Scalettar, C. Huscroft, and A. K. McMahan, Signatures of spin and charge energy scales in the local moment and specific heat of the half-filled two-dimensional Hubbard model, Phys. Rev. B 63, 125116 (2001).
- Paiva et al. (2011) T. Paiva, Y. L. Loh, M. Randeria, R. T. Scalettar, and N. Trivedi, Fermions in 3d optical lattices: Cooling protocol to obtain antiferromagnetism, Phys. Rev. Lett. 107, 086401 (2011).
- Yoshioka et al. (2009) T. Yoshioka, A. Koga, and N. Kawakami, Quantum phase transitions in the Hubbard model on a triangular lattice, Phys. Rev. Lett. 103, 036401 (2009).
- Shirakawa et al. (2017) T. Shirakawa, T. Tohyama, J. Kokalj, S. Sota, and S. Yunoki, Ground-state phase diagram of the triangular lattice Hubbard model by the density-matrix renormalization group method, Phys. Rev. B 96, 205130 (2017).
- Garwood et al. (2022) D. Garwood, J. Mongkolkiattichai, L. Liu, J. Yang, and P. Schauss, Site-resolved observables in the doped spin-imbalanced triangular Hubbard model, Phys. Rev. A 106, 013310 (2022).
- Trivedi and Randeria (1995) N. Trivedi and M. Randeria, Deviations from Fermi-Liquid behavior above in 2d short coherence length superconductors, Phys. Rev. Lett. 75, 312 (1995).
- Trivedi et al. (1996) N. Trivedi, R. T. Scalettar, and M. Randeria, Superconductor-insulator transition in a disordered electronic system, Phys. Rev. B 54, R3756 (1996).
- Denteneer et al. (1999) P. J. H. Denteneer, R. T. Scalettar, and N. Trivedi, Conducting phase in the two-dimensional disordered Hubbard model, Phys. Rev. Lett. 83, 4610 (1999).
- Mondaini et al. (2012) R. Mondaini, K. Bouadim, T. Paiva, and R. R. dos Santos, Finite-size effects in transport data from quantum Monte Carlo simulations, Phys. Rev. B 85, 125127 (2012).
- Peterson and Shastry (2010b) M. R. Peterson and B. S. Shastry, Kelvin formula for thermopower, Phys. Rev. B 82, 195105 (2010b).
- Osborne et al. (2021) I. Osborne, T. Paiva, and N. Trivedi, Broken luttinger theorem in the two-dimensional Fermi-Hubbard model, Phys. Rev. B 104, 235122 (2021).
- Gröber et al. (2000) C. Gröber, R. Eder, and W. Hanke, Anomalous low-doping phase of the Hubbard model, Phys. Rev. B 62, 4336 (2000).
- Sakai et al. (2009) S. Sakai, Y. Motome, and M. Imada, Evolution of electronic structure of doped mott insulators: Reconstruction of poles and zeros of green’s function, Phys. Rev. Lett. 102, 056404 (2009).
- Badoux et al. (2016) S. Badoux, W. Tabis, F. Laliberté, G. Grissonnanche, B. Vignolle, D. Vignolles, J. Béard, D. Bonn, W. Hardy, R. Liang, et al., Change of carrier density at the pseudogap critical point of a cuprate superconductor, Nature 531, 210 (2016).
- Pichanusakorn and Bandaru (2009) P. Pichanusakorn and P. R. Bandaru, The optimal seebeck coefficient for obtaining the maximum power factor in thermoelectrics, Appl. Phys. Lett. 94, 223108 (2009).
- Ashfaq et al. (2020) A. Ashfaq, J. Jacon, A. Ali, K. Mehboob, K. Mahmood, U. Rehman, W. Ahmad, S. Ikram, N. Amin, S. Tahir, M. I. Arshad, M. Ajaz un Nabi, and S. Hussain, Designing of seebeck coefficient and electrical conductivity in CZTS thin films for giant power factor, Ceramics International 46, 9646 (2020).
- Jalana and Stemmerb (2010) B. Jalana and S. Stemmerb, Large seebeck coefficients and thermoelectric power factor of La-doped SrTiO3 thin films, Appl. Phys. Lett. 97, 042106 (2010).