2022
[1]\fnmThomas \surSiegert
[1]Julius-Maximilians-Universität Würzburg, Fakultät für Physik und Astronomie, Institut für Theoretische Physik und Astrophysik, Lehrstuhl für Astronomie, Emil-Fischer-Str. 31, D-97074 Würzburg, Germany
The Positron Puzzle
Abstract
The Positron Puzzle is a half-century old conundrum about the origin of the Galactic -ray emission line at photon energies of 511 keV, and the shape of its morphology, showing a bulge-to-disk luminosity ratio of – unlike any astrophysical source distribution.
Positrons () that have been cooled to the eV scale capture electrons () and form the intermediate bound state of Positronium (Ps) which decays on a nano-second timescale into two or three photons.
Assuming the emission to originate from the Galactic bulge, centre, and disk, a visible annihilation rate in the Milky Way of has to be explained, either by a quasi-steady state of production and annihilation, or by possibly multiple burst-like events that flood the Galaxy with , then fading away on a Myr timescale.
In this paper, I will review what the real Positron Puzzle is, where data and simulations have been used inadequately which resulted in false claims and an apparent quandary, what we really know and absolutely not know about the topic, and how this epistemic problem might be advancing.
keywords:
Positrons, Cosmic rays, Gamma rays, Interstellar medium, Dark matter1 Introduction
1.1 What do we see?
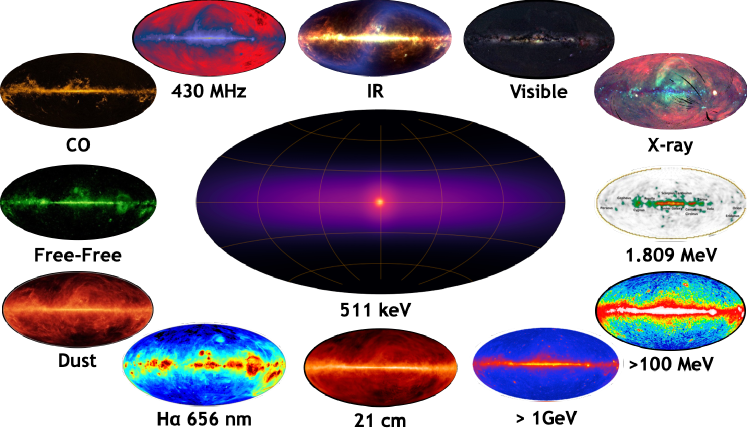
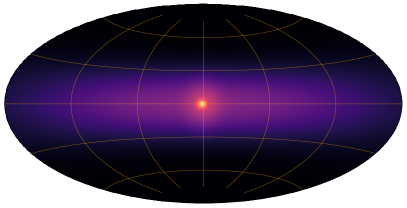
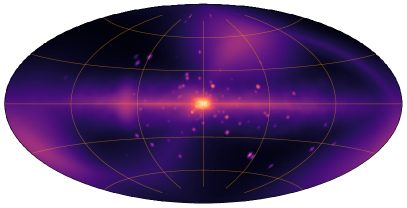
The Galactic 511 keV signal has been measured with multiple instruments for the last 50 years. Acknowledging the pioneering balloon experiments in the 1960s and ’70s (Haymes et al, 1969), as well as the first identification of its ‘diffuse’ nature with satellite experiments in the ’90s (CGRO/OSSE, Purcell et al, 1997) (see also (Albernhe et al, 1981; Lingenfelter and Ramaty, 1989)), the most extensive information in this topic has been gathered from INTEGRAL/SPI measurements (Winkler et al, 2003; Vedrenne et al, 2003). With increasing exposure time since 2002, SPI measurements allowed us to refine earlier conjectures about its possible dark matter (DM, Boehm et al, 2004) origin, conditions as to how annihilate (e.g., Jean et al, 2006; Churazov et al, 2005; Siegert et al, 2019a), and tried to infer whether, and if how far, propagate (e.g., Jean et al, 2009; Martin et al, 2012; Alexis et al, 2014; Siegert et al, 2022c). The image that we can obtain with SPI at 511 keV photon energies is unique compared to other wavelengths and emission processes (Fig. 1). The latest measurement of 511 keV fluxes in the Galaxy are from Skinner et al (2014) and Siegert et al (2016b), finding –, –, and – for the Galactic bulge, disk, and centre, respectively. The flux ratio between the bulge and disk emission is (Skinner et al, 2014; Siegert et al, 2016b), which results in a luminosity ratio of when assuming an effective distance to the bulge of 8.2 kpc and to the disk of 6.5 kpc (Siegert et al, 2016b). Historically, the bulge-to-disk ratio was even larger because the disk was not detected in earlier measurements with SPI with less exposure time (e.g., Knoedlseder et al, 2005; Bouchet et al, 2010). It is not excluded that the disk may actually not be the Galactic disk, but rather halo emission or even foreground. In the latter two cases, inferences with SPI would suffer from its coded aperture mask design, being almost incapable of measuring isotropic emission or shallow gradients (Caroli et al, 1987; Siegert et al, 2022d). In addition, Siegert et al (2019b) showed that there is hardly a trend of Doppler-shifts in the 511 keV line along Galactic longitudes, which would verify a rotation curve and the extended emission beyond the bulge as the Galactic disk. Certainly, at the MeV scale are produced inside the Galactic disk (Sec. 2.2), but how far they propagate, where they finally annihilate, and at what rate is a matter of debate (see also the works by Prantzos (2006) and Higdon et al (2009) for more details about a possible scenario to channel from the disk to the bulge).
The central map in Fig. 1 shows a maximum likelihood fit to the raw SPI count data, requiring four components: a disk, and three components to describe the bulge, including a point-like source coincident with the Galactic centre. Note that the angular resolution of SPI is , so that this point source encompasses about 400 pc in diameter – reminiscent of the entire Central Molecular Zone. The bulge component also shows an asymmetry, peaking around , which is consistently found in different analyses with different states of accumulated exposure (Weidenspointner et al, 200; Bouchet et al, 2010; Skinner et al, 2014; Siegert et al, 2016b, 2022c). Structured, i.e. more granular images from reconstruction algorithms show a similar trend of where the flux is enhanced, and could reveal details if were it not for the strong instrumental background in MeV telescopes. While the basic structure is also found with Richardson-Lucy (Knoedlseder et al, 2005), Maximum Likelihood (Bouchet et al, 2010), or Maximum Entropy (Siegert, 2017) deconvolutions, image artefacts naturally emerge from the finite number of photons detected and to be distributed over a large number of pixels. High-resolution spectroscopy of the 511 keV line for the bulge and disk components suggests that the annihilation of occurs dominantly in the interstellar medium (ISM), which would partly explain the ‘diffuse’ nature of the image:
1.2 Positron annihilation spectroscopy
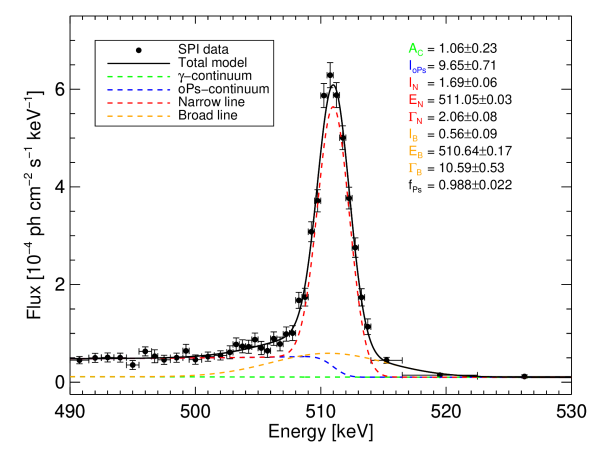
Previous works (e.g., Churazov et al, 2005, 2011; Jean et al, 2006; Guessoum et al, 2005, 2010; Siegert et al, 2016b) consistently find that, assuming annihilate in the ISM, the temperature and ionisation state of the gas in which they are annihilating is 7000–40000 K and 2–25 %, respectively. The dominant annihilation process is then charge exchange with neutral and moderately warm gas. Charge exchange, for example with hydrogen, is only possible if the have a kinetic energy of at least 6.8 eV (binding energy of H minus the binding energy of Ps), which would correspond to an ISM temperature of 80000 K. If reach the temperature of the ISM, they ‘thermalise’, i.e. they are relaxing their kinetic energies to that of a Maxwellian distribution, so that the energy thresholds can be overcome only in the tail of the distribution. One model that fits the narrow and broad 511 keV line in the Milky Way is described as 49 % annihilation in the warm neutral phase and 51 % in the warm ionised phase (Jean et al, 2006): In the ionised phase, annihilate after thermalisation by the formation of Ps via radiative recombination with free (no energy threshold), and to a lesser extent direct annihilation with , forming a keV broad line (FWHM), without any Ps formation in flight. In the warm phase, most form Ps in flight, resulting in a keV broad line, and a small percentage thermalises, again forming Ps, now with a narrow keV line. The total Ps fraction,
| (1) |
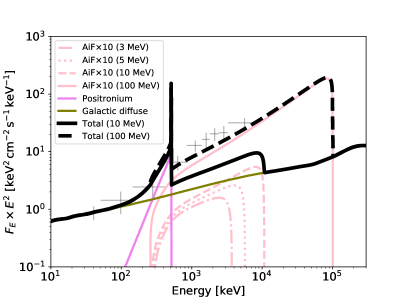
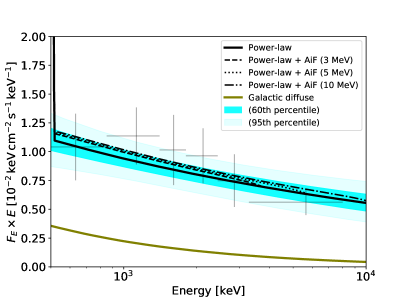
with being the flux ratio between the ortho-Ps continuum and the 511 keV line, describes the fraction of that undergo the formation of Ps (e.g., Leventhal et al, 1978). In the warm ionised medium is 88 % and in the warm neutral medium %, resulting in a total Ps fraction across the Galaxy of – %. In fact, some of the broadening of the Galactic 511 keV line may also be due to velocity broadening from Galactic rotation (Siegert et al, 2019a). Furthermore, the line is not the only witness of annihilating : the ortho-Ps component (Ore and Powell, 1949) is also clearly visible in the combined spectra across the Galaxy, rising almost linearly with a sharp cut off at 511 keV, and containing a times larger annihilation flux, depending on (Fig. 2).
All these assumptions make perfect sense, if the premise of ‘annihilation in the ISM’ is correct. However, the density of target particles also has a considerable impact on the line shape and Ps fraction, once the densities of the gas is much higher than that of the ISM: Murphy et al (2005) calculate the Ps fraction as a function of temperature and gas density in the context of solar flares, finding that keV broad 511 keV lines can be explained in gas with densities and temperatures K. Also the broad- to narrow-line ratio is found to be below for temperatures above K. Finally, the Ps fraction, albeit on the lower side, can also be met in conditions typical to solar flares.
1.3 A puzzling picture
The ‘Positron Puzzle’ may be summarised in three basic questions:
-
1.
What do we see?
-
2.
Where do the positrons come from?
-
3.
Why does it look like that?
The answer to the first question, albeit somewhat ambiguous considering the limitations of current instrumentation in the MeV -ray band, is outlined in Secs. 1.1 and 1.2. Measurements in the MeV regime suffer from a scarcity of photons from astrophysical sources, carrying a million times more energy in one quantum than optical photons, for example, large instrumental background (Diehl et al, 2018; Siegert et al, 2019b), and apertures which align more with particle detectors in space rather than telescopes (Siegert et al, 2022d). Images are therefore often either ‘reconstructed’, i.e. it is attempted to unfold the non-invertible imaging response matrices of MeV instruments, or models are directly fitted to the raw data. In performing these imaging techniques, however, comparisons to other wavelengths, that could be more directly measured, can result in false conclusions. But in addition to the imaging capabilities, also the spectroscopic information of the 511 keV line will help to decipher ‘how’ the are annihilating. In the paragraphs in Sec. 1.4, I outline possible tracers of -annihilation, based on first, the visual comparison of all-sky surveys from Fig. 1, and second, a thorough likelihood comparison.
The second question is the historically initial question after Leventhal et al (1978) unambiguously identified the -ray line from the Galactic centre as due to -annihilation. “Undoubtedly, the positrons giving rise to the observed feature come from a variety of processes”, said Leventhal et al (1978) about this first and strongest -ray line detected. Indeed, where the come from, i.e. in which astrophysical sources they originate, is related to how can be produced in terms of particle physics processes. I will summarise possible sources and production mechanisms in Sec. 2, together with measurements of how much which source population might contribute to the Galactic budget.
But the budget alone is not enough to gain complete insight into the ‘Positron Puzzle’ because the sources of may in fact not be the sinks of annihilation. This is related to the third question of why the emission looks so different than the putative sources, and also different to the supposedly preferred annihilation regions of dense gas in the Milky Way. Positrons are typically produced at mildly- or highly-relativistic energies (see Sec. 2). This means, unless they experience favouring annihilation conditions, such as high gas or densities and low temperatures, they are cosmic rays, and propagate through the ISM. In Sec. 3, I will summarise the current knowledge of propagation of in the ISM, which links to the distortion of the potential source distributions towards the measured 511 keV image. The injection of and into the ISM will transport the particles on timescales of 0.1–10 Myr to distances (path lengths) of 0.1–10 kpc away from their initial sources (e.g., Jean et al, 2009; Panther, 2018). Consequently, to first order, the 511 keV image could be a smeared-out version of the initial source distribution due to the propagation effects, which may be similar to the gas distribution of the Galaxy.
The Milky Way can either be described in terms of its stellar population (putative sources) or in terms of its gas content (possible annihilation regions). The stellar population can be subdivided in the Galactic bulge and the Galactic disk (Freudenreich, 1998). The bulge shows a scale size of kpc, an old stellar population ( Gyr), and a stellar mass of . The disk can be divided further into a thin (young(er) stars, on average Gyr) with scale height and radius of pc and kpc, respectively, and a thick disk (old stars, Gyr) with scale heigh and radius of pc and kpc, respectively. The stellar masses of the thin and thick disk are and , respectively. The gas in the Galaxy can be roughly subdivided into a molecular, an atomic, and an ionised component, with scale heights of pc (Dame et al, 2001), pc (Dickey and Lockman, 1990), and pc (Gaensler et al, 2008), respectively. The total gas mass of the disk (2–20 kpc) is on the order of , similar to that of the bulge gas mass (Ferrière, 2001; Ferrière et al, 2007). In addition to the bulge and disk gas reservoirs, there is also the Central Molecular Zone (CMZ, Morris and Serabyn, 1996) encompassing the Galactic centre. It is pc in size with a strong concentration of molecular gas.
1.4 Positron annihilation tracers
With the information above, we can investigate Fig. 1 for tracers of annihilation:
Ionisation:
Ionisation and recombination of hydrogen (Seaton, 1959), as would happen as a consequence of the charge exchange process and radiative recombination with , may be traced in the ISM by H in the Milky Way at photon wavelengths of 656 nm (Finkbeiner, 2003). The H emission appears clumpy with several hotspots along the Galactic plane as well as nearby star forming regions, such as Orion, Scorpius Centaurus, Cygnus, Carina, or Vela. There is no definite bulge emission that would outshine the disk, and the bulge-to-disk ratio is tiny.
Warm ISM:
The distribution of neutral and partly warm gas in the Milky Way is visible in the 21 cm line of atomic hydrogen (HI; e.g., Kerp et al, 2011). The emission is concentrated in a thin disk along the Galactic plane with visible cavities, so-called superbubbles (Weaver et al, 1977; Castor et al, 1975), that have been formed by massive star winds and supernovae (SNe) over Myr timescales. The cavities may extend to several kpc above the Galactic plane so that the total HI emission may be described by a thin and a thick disk. The map shows where the gas might be found for the to annihilate in, but there is no bright bulge at 21 cm wavelengths.
Cold ISM:
Based on logic arguments and reasonable estimates for the lifetime of in the ISM (Panther et al, 2018b), the higher the density of the ISM, the more should be seen to annihilate. The CO map ( transition, Dame et al, 2001) at 115 GHz shows the dense and cold gas – regions where should naturally tend to reach for annihilation if not quenched by too low temperatures to undergo charge exchange. The thin disk of CO is nothing like the 511 keV map, and also no bulge is present. However, the CMZ would be coincident with the point-like source at 511 keV.
Dust grains:
It appears that annihilation on dust grains is not excluded by the spectral data although the emission morphology, again, would be disfavoured by direct comparison of the dust map (e.g., Bennett et al, 2013; Planck Collaboration et al, 2016) in Fig. 1 to the 511 keV map. Also PAHs (polycyclilc aromatic hydrocarbon molecules) may be traced by dust emission, and would make excellent targets for to annihilate with because of their huge ‘effective charge number’, , and therefore reaction cross section. PAHs show values of up to , so that their cumulative effect in the ISM may lead to reaction rates of % of the dominating processes in the warm neutral and ionised medium, even though their number abundance is only (Guessoum et al, 2010). It is apparent that the Milky Way dust map does not trace the 511 keV map, except again for the possible high latitude emission.
Particle acceleration and propagation:
Annihilation of in flight (see Sec. 3, and, e.g., Beacom and Yüksel, 2006; Sizun et al, 2006), either through charge exchange or directly, may be traced by several processes that should show their paths of transport. Positrons should be bound to the large-scale magnetic field of the Galaxy, so that the synchrotron emission (e.g. at 408 MHz, Haslam et al, 1981) could show places where annihilate. Likewise, bremsstrahlung (free-free emission, and N. Aghanim et al, 2016) could possibly show the catastrophic energy loss of , being removed from the scheme due to annihilation in flight. Electron bremsstrahlung and bremsstrahlung are hardly distinguishable, so that the free-free emission map in Fig. 1 may show both particle populations. At very high energies, beyond 100 MeV, the Galactic emission is dominated by pion decay (, Bjorklund et al, 1950) as a result of high-energy cosmic-ray interactions with the dense ISM (e.g., Ackermann et al, 2013). Therefore, this emission might represent both, production site and destruction site of . But also for pion decay, the bulge emission would be missing as seen in the Fermi/LAT image above GeV in Fig. 1. At these photon energies, there is also no high-latitude component111The Fermi Bubbles (e.g., Su et al, 2010) are high-latitude emission but confined to longitudes . and the emission is clustered around star-forming regions, dense molecular clouds, and spiral arms.
In-situ annihilation:
If the propagation of is not ballistic (Sec. 3), i.e. not determined by collisional transport (Jean et al, 2009), they might be advected with the Galactic velocity field rather than diffusing several kpc. This may result in morphologies that would resemble the possible sources of ( Sec. 2), such as nucleosynthesis ejecta (e.g. shown as the 1.809 MeV map), X-ray binaries (XRBs; e.g. shown as the X-ray all-sky map from ROSAT), or, indeed, stars themselves through flares (traced by infrared and visible light, Bisnovatyi-Kogan and Pozanenko, 2017). Especially in the latter case, the need for propagation in the ISM would be weakened as parts of the emission are entirely explained so that a different set of constraints will emerge. This may include only propagation inside the bulge, for example, and no channelling of from the disk into the bulge (e.g., Higdon et al, 2009). For XRBs, a population of point-like sources would be expected for the 511 keV emission, or, after propagation, again an image similar to the HI, CO, or dust maps. The hot tenuous X-ray gas with temperatures above 1 MK is probably too thin for to efficiently cool down and annihilate in large numbers (see, however, Sec. 3.2). The 1.809 MeV emission from , a -decaying massive star nucleosynthesis product, shows potentially the negative image of HI, i.e. instead of the shell boundaries now the interiors. These cavities are filled with hot gas streaming away from the stellar groups into lower pressure regions (Krause et al, 2015). Again, would start out at low densities and high temperatures, so that only after reaching the HI walls, they would annihilate, then in the vicinity of the sources. More information about the possible sources of Galactic are presented in Sec. 2.
Statistical comparison:
The visual inspection of these maps with the physical arguments from spectroscopy should not be over-interpreted because the reconstruction of the 511 keV emission itself is biased by the assumptions of how a Galaxy may look like. Instead, one can define an adequacy-of-fit criterion222This is not a goodness-of-fit criterion, since it is not statistically sound to judge a fit based on such a likelihood comparison., . This may be interpreted as a relative measure, which template maps, either by wavelength or physical process, fit the raw data best. I want to stress, that this is not an absolute measure of how good the fit is, nor is this intended. Fig. 3, shows the -values as a function of tracer map photon energy for the ortho-Ps band, the 511 keV line band, and the continuum band above the -annihilation line (Siegert, 2017). It can be seen that the line and ortho-Ps behave similarly as a function of tracer map photon energy, except for the 10–200 keV range. This is understandable because the continuum emission above the line is nicely traced by X-ray sources as seen by the dip (improvement) in in the lower panel, and also impacts the emission below the line. The only all-sky maps that consistently show an improvement in for both 511 keV and ortho-Ps are the infrared maps below 1 eV (–) from COBE/DIRBE. This improvement is not seen in the continuum band, so that it is prone to -annihilation.
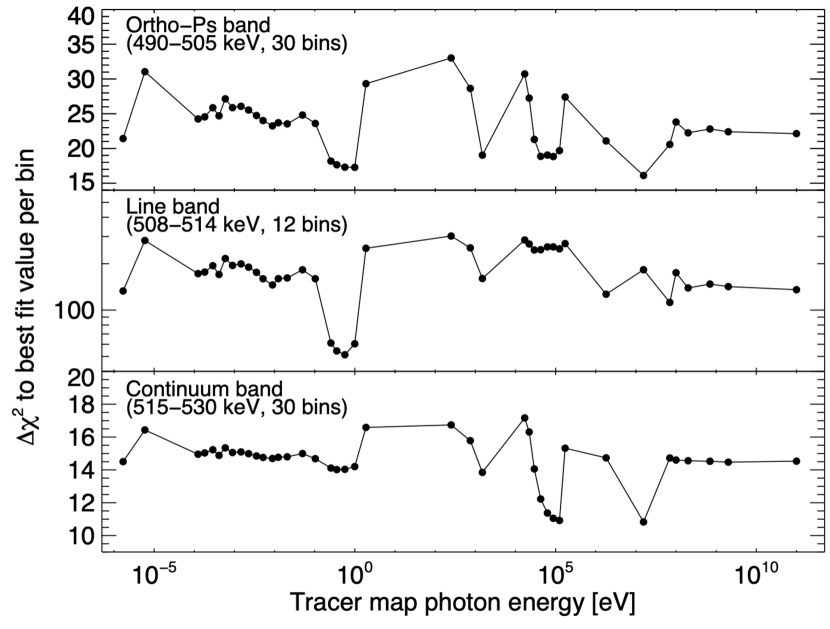
This means that star light (and the zodiacal light, which has not been removed from the maps; see also Sec. 4.1) apparently traces annihilating – not their presumed sources, nor the ISM. Stars may be both, the dominant sources and the natural sinks, of in the Galaxy. In fact, contemporaneous to Siegert (2017), Bisnovatyi-Kogan and Pozanenko (2017) suggested flaring stars to be a major contributor to the Galactic 511 keV signal.
Such a template-fit analysis has also been performed by Knoedlseder et al (2005) to the 511 keV line, with only 1.5 yr of exposure in the Galaxy, resulting in similar conclusions that the emission might be related to the or an old stellar population (see also Siegert et al, 2022c). These types of analyses may appear odd for non--ray astronomers, but because of the fact that we cannot directly (or only hardly) image the -ray sky leads us to such fundamental comparisons. Knödlseder (1999) performed also a similar study for the origin of the 1.8 MeV line from decaying , finding that the free-free emission at 53 GHz is correlating with the measurements from COMPTEL. This result was part of the solid proof that massive stars are indeed responsible for the observed . The conjecture for the sources is ‘the old stellar population’, but what exactly this entails is not yet clear, since the interpretations are still versatile.
2 Positron sources
The general, straight-forward, question of the Positron Puzzle is ‘Where do the positrons come from?’, meaning, what are the sources to explain the amount that annihilates in the Milky Way. The list of potential candidate sources is large because nearly every astrophysical source can produce either directly or through secondary interactions with the surroundings. Consequently, the actual problem is not which sources are responsible, but rather that there are too many possibilities333Quoted after a lecture by G. K. Skinner..
Another fundamental predicament of the Positron Puzzle is that it appears that its solution will only benefit the puzzle itself, then being solved. But the fact that nearly every astrophysical source indeed is able to produce (and annihilate) may turn the 511 keV emission line into an independent astrophysical messenger, a tool to study other unsolved problems, a way to gain a perspective orthogonal to other measurable quantities. When the puzzle is solved, and it eventually turns out that many different astrophysical source types contribute to the Galactic 511 keV emission, a dedicated observatory may revolutionise our understanding in the multiple fields of astrophysics associated with it. In the following, I will summarise candidate sources and put them into the context of available observations to estimate their contribution, given measurement uncertainties and systematics from model assumptions. This is closely following Siegert (2017) but will be more concise. For completeness, I will briefly describe the particle physics processes that can lead to .
2.1 Positron production mechanisms
-decay:
The most intuitive answer to the question where could emerge from is the radioactive decay of isotopes with a proton excess. The generic equation for -decay is
| (2) |
where a nucleus with charge number and atomic number decays within its lifetime of to another nucleus with reduced charge number but same atomic number by the emission of a and an electron-neutrino . For most nuclei, this is not the sole decay branch so that it is associated with a branching ratio, or equivalently, a probability for this path. Astrophysically important nuclei can be associated to different objects (see Sec. 2.2) and are listed in Tab. 1 for completeness. It becomes clear that there is a variety of eleven orders of magnitude in lifetime of these relevant isotopes. This means may either annihilate far away from their initial production sites, or they cool down quickly due to a possibly large density and find to recombine with at the position of their sources. A mixture of annihilation after propagation and in-situ would be the result.
| Nucleus | Sources | |||
|---|---|---|---|---|
| 1.03 Myr | 0.82 | 1.809 | Massive stars, AGB stars, Supernovae | |
| 81 yra | 0.94 | 1.157 | Supernovae | |
| d | 23.1 yr | 0.50 | 0.983, 1.312 | Supernovae |
| 3.75 yr | 0.90 | 1.275 | Novae | |
| 111.4 db | 0.20 | 0.847, 1.238 | Supernovae | |
| d | 2.14 d | 0.43 | 0.127, 1.378, 1.920, 0.122c, 0.136c | Supernovae |
| 2.64 h | 0.97 | – | Novae, Solar flares | |
| d | 30.4 min | 0.29 | 0.744, 0.936 | Supernovae |
| d | 29.3 min | 0.99 | – | Cosmogenic (cosmic-ray interactions, spallation), Solar flares |
| 14.4 min | 0.99 | – | Novae, Earth atmosphere / lightning, Solar flares | |
| 2.94 min | 0.99 | – | Novae, Earth atmosphere / lightning, Solar flares | |
| \botrule |
a The nucleus only has a half-life time of 3.9 h and exists only as an intermediate step from the decay of . The relevant astrophysical timescale, for example for heating of supernova remnants, is that of the longer-living .
b The nucleus is the daughter product of the shorter-lived that is dominantly produced in supernovae. The relevant timescale here is again that of the longer-living .
c The -rays at 122 and 136 keV come from the daughter nucleus’ decay, which is no -decay, but the -rays might indicate that positrons have been emitted throughout the decay chain.
d These isotopes have not been considered for the Positron Puzzle so far but may play a role.
Particle acceleration:
Positively charged mesons, such as pions and kaons, may also emit , formally involving the same process of -decay. However, their production is only possible from the interaction of high-energy particles (including photons). Hadronic processes of the shape
| (3) |
and
| (4) |
are possible for threshold energies above MeV ( MeV, MeV). For pp-interactions, Eq. (3), the production cross section rises logarithmically, reaches a plateau on the order of above TeV, and may rise afterwards again. Each produced will eventually lead to one , either directly or through the decay of an anti-muon. Because the pions produced will have large kinetic energies, the will carry away this energy with Lorentz factors of and more, but with a peak around 30–40 MeV (Murphy et al, 1987). Cosmic-ray production of secondary will therefore lead to a very smeared out annihilation morphology as the may be prone to large-scale propagation. For photo-pion production, Eq. (4), the arguments are similar, but the interaction cross section is reduced to . Neutral pions have a dominant decay branch into two photons with 98.8 %; the remaining % allow for a decay into one photon and an --pair. The effective production rate of from neutral pions is then about 1 % of that of positively charged pions.
In addition to meson production, cosmic rays also lead to spallation reactions on ISM nuclei, thereby forming -unstable isotopes, such as .
Pair production:
Electron-positron pairs can be created by the interaction of high-energy photons in the electric field of a nucleus (or ), in a magnetic field, or by photon-photon pair production. The first reaction has a cross section proportional to , and rises logarithmically with photon energy, showing typical values of above its threshold energy of 1.022 MeV (Maximon and Olsen, 1962). The second requires strong magnetic fields on the order of G to show an efficient photon to pair conversion. One cannot ascribe this process a cross section but rather an attenuation coefficient for a magnetic field of G for photon energies above the threshold. Finally, photon-photon pair production has a maximum cross section close to the Thomson cross section of at a centre of momentum energy of keV. The cross section is suppressed for energies near the threshold and decreases for higher energies. Photon-photon absorption is important in the context of the mean free path, or, equivalently, the optical depth of very high-energy photons, for example from AGN or Galactic ‘pevatrons’: High-energy photons interact with the ubiquitous photon field of the cosmic microwave background (CMB) or the interstellar and intergalactic radiation field at infrared to optical wavelengths, leading to a cutoff in the TeV regime due to pair production. The rate of pair production in the intergalactic medium (IGM) due to photon-photon absorption from TeV emitting AGN has, to the knowledge of the author, not yet been calculated/estimated.
Svensson (1982a) studied the bahaviour of a thermal proton-electron-positron-photon plasma, including the radation mechanisms of bremsstrahlung, Inverse Compton (IC) scattering, pair annihilation and pair production through all the above-mentioned processes (except magnetic fields). This is particularly important in the case of black holes (BHs) with accretion disks, forming photon spectra up to MeV energies and therefore leading to an atmosphere that may be carried away in an optically thin wind (Beloborodov, 1999). This pair-plasma would then annihilate according to its plasma temperature (Svensson, 1982b, 1983). It should be noted that pair-plasma annihilation will not produce a narrow 511 keV line unless the plasma temperature is particularly low. Instead, a blueshifted (Doppler-boosted), and broadened feature will emerge – searches for narrow annihilation lines in sources where pair-plasma would be expected will therefore always be negative even though pair-annihilation may have occurred.
Hawking radiation:
The evaporation of BHs due to Hawking radiation is the suggested cooling (and therefore mass loss) mechanism of these compact objects (e.g., Hawking, 1975). Hawking radiation is believed to be a quasi-thermal emission mechanism with a temperature MeV, with being the mass of the BH, of not only photons but also particles – and therefore also . The kinetic energies of the particles will also have a blackbody distribution so that a large variety of energies are possible according to the range of BH masses. Primordial black holes (PBHs, Hawking, 1971) may have masses on the order of g (e.g., Siegert et al, 2022b; Berteaud et al, 2022; Iguaz et al, 2021) which would result in average energies of keV, potentially not propagating far from the sources. The associated -ray signature would provide a smoking-gun evidence that PBHs may be responsible for the DM phenomenon as well as a major contributor to the annihilating . It should be noted that Hawking radiation is not proven by observations to actually exist.
Dark matter:
If DM is composed of beyond-standard-model particles, their decay (e.g., Hooper et al, 2004), annihilation (e.g., Boehm et al, 2004), or excitation (e.g., Finkbeiner and Weiner, 2007) might result in --pairs. Depending on the actual particle candidate, i.e. its mass, carry away the parent particles’ rest mass energy as kinetic energy. Thus, may annihilate close to their production sites of light DM particles, leading to a 511 keV emission reminiscent of a DM halo, or far away because they diffuse over large distances from GeV–TeV mass scale WIMPs. In the latter case, the annihilation branch into massive quark-antiquark pairs is dominating over --pairs (Jungman et al, 1996). However, the intermediate formation of charged mesons will eventually lead to , and potentially more than one per WIMP co-annihilation. It should also be noted here that there is no observational evidence of particle DM.
2.2 Astrophysical sources
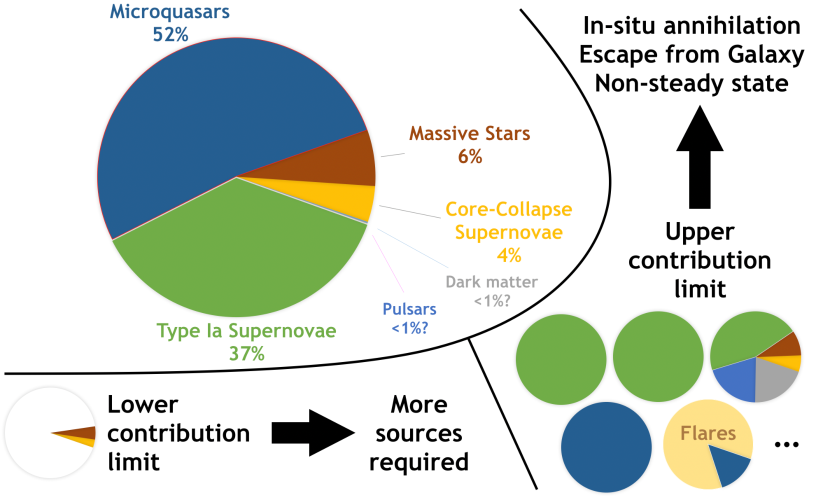
Given the production mechanisms, Sec. 2.1, astrophysical sources can be associated, and, if observations are available, from individual candidate populations can be budgetised. Such an approach does not take into account the possible propagation of (Sec. 3) and shows that the puzzle is indeed either under- or over-explaining the annihilation rate in the Milky Way. Tab. 2 summarises the rates at which candidate populations (see following paragraphs) produce , including uncertainties from measurements as well as systematics from unknown population sizes, for example.
| Source | Galaxy | Bulge | Disk |
|---|---|---|---|
| 26Al | |||
| 44Ti | |||
| 56Ni | |||
| Sources | |||
| Target Rate | |||
| Galaxy % | Bulge % | Disk % | |
| 26Al | |||
| 44Ti | |||
| 56Ni | |||
| Sources | |||
| Target % |
Massive stars and core-collapse supernovae:
Through massive star winds and their ultimate core-collapse supernovae (ccSNe), the ISM is enriched by freshly produced elements. For the production of , the most important isotopes in stellar evolution are probably , , and . To a lesser extent also , , and may play a role, but have so far not been considered in the context of the Positron Puzzle, probably because of their small yields and shorter lifetimes (see, however, Panther et al, 2021). The -production rate follows directly from the radioactive decay law: If a mass of radioactive, -unstable, isotope is produced, the number of particles that decay per time is , with being the isotope mass, its lifetime, and the probability of undergoing -emission (branching ratio). The -production rate, , from isotope is then
| (5) |
It should be noted here – and is true for most other production sites – that the production rate, , is not (necessarily) the annihilation rate, . Most are produced at relativistic energies and supposedly propagate in the ISM on Myr timescales until they annihilate, which makes it difficult to judge whether the 511 keV phenomenon is actually a steady state. In this context, also the escape of from the Galaxy should be considered as they would be lost for current observational techniques444Coded-mask telescopes, such as the currently best telescope to observe the 511 keV emission, INTEGRAL/SPI, cannot, or only hardly, observe isotropic emission as they rely on the contrast between emission and no emission to distinguish the instrumental background from the total signal. Shallow gradients in the morphology are also difficult to reliably detect with coded aperture masks (Siegert et al, 2022d), even if they do annihilate in the IGM, for example. This means that the -production rate in the Milky Way may be larger or smaller than the measured -annihilation rate.
The advantage of a nucleosynthesis origin of in the Galaxy is that we can directly measure the mass of ejecta, given we have a 3D geometrical model of the Galaxy and the -ray opacity of SN remnants as a function of time. Because each nucleus can only decay once, and if the possible -ray emission from daughter nuclei can be measured, we obtain a generic luminosity per isotope per solar mass, , which directly converts to a -production rate, given Eq. (5):
| (6) |
where is the nucleon number of isotope .
For example, given the estimate of of in the Milky Way (Siegert, 2017; Pleintinger, 2020), and a probability for -decay of of , we obtain a production rate555Detailed modelling then provides the numbers in Tab. 2. of . These are at most 10 % of the total annihilate rate in the Milky Way, which means that alone cannot explain the measured 511 keV line, unless there was a star burst from which the are still annihilating now (e.g., Prantzos et al, 2011; Alexis et al, 2014).
Considering the shorter-lived isotopes, such as , for example, we have to rely on the only direct measurement of in the Milky Way so far, the SN remnant Cassiopeia A (Cas A), to estimate the production rate. Assuming all from to escape from the remnant, the total number produced is given by , and the total production rate by the SN rate in the Milky Way, , as
| (7) |
With a ejecta mass produced in Cas A to be around (e.g., Renaud et al, 2006; Martin and Vink, 2008; Iyudin et al, 1997; Siegert et al, 2015; Weinberger et al, 2020), and a branching ratio of , we get a total number of produced of . With a ccSN-rate of (e.g., Diehl et al, 2006), the -production from ccSNe in the Milky Way is about – of the same order of magnitude as . It should be noted that this may even be considered an upper bound of the production rate from because the yield per ccSN may indeed be lower and Cas A exceptional, and because it has been shown in the case of SN1987A that are responsible for heating the remnant at early times (Seitenzahl et al, 2014). However, also thermonuclear SNe produce , which enhances the -production rate by about a factor of 2.
Type Ia supernovae:
The case for type Ia supernovae (SNe Ia) in the Galaxy is even more insecure: While the amount of produced in SNe Ia is about – (from Arnett’s rule, Arnett, 1982; Stritzinger et al, 2006), and the branching ratio for -decay of the daughter nucleus about 20 %, the escape fraction of from the expanding remnant is very uncertain. Because and have lifetimes of only 8 d and 111 d, respectively, it can be expected that most do not manage to escape into the ISM but rather annihilate in situ. Milne et al (1999) showed that the escape of is probably on the order of 3 %, as estimated from the late lightcurves of a sample of SNe Ia. The only direct measurement of the mass from a SN Ia is from SN2014J, estimating – (Churazov et al, 2014; Diehl et al, 2015). The data suggest that there indeed is a broadened 511 keV line, but the flux uncertainties make it difficult to reliably estimate a escape fraction. At face value, the average escape fraction from SN2014J during the half-year observation time is (Siegert, 2017). Therefore, similar to the case, the -production rate from in SNe Ia is
| (8) |
Using the -ray measurements from SN2014J and an estimated SNe Ia rate in Milky Way of , the -production rate is . At a face value of and a canonical ejecta mass of , the production rate would be – again of similar magnitude than the previous two nucleosynthetic origins. It is clear that from SNe Ia may either explain the complete signal, none of it, or even more than is measured.
Classical novae:
Classical novae (CNe) have never been detected in MeV -rays, so that a direct estimate of the important ejecta masses has not been possible so far. In CNe, two contributions may be of interest, either the ‘511 keV flash’ from very short-lived -unstable nuclei, such as (2.64 h) or (14.4 min), or from the longer-lived (3.75 yr). While the latter is dominantly only produced in ONe novae, the former are expected in all types of CNe. Models (e.g., Gomez-Gomar et al, 1998; José and Hernanz, 1998; Hernanz et al, 2000; José et al, 2001; Hernanz and José, 2006; Hernanz, 2014) suggest a -ray flash at the onset of the CN – the explosion on the surface of the white dwarf –, several days before the optical emission maximum. The exact time is unknown, but the flux from the annihilating directly on the surface is on the order of – at 511 keV for a distance of 1 kpc for a duration of about 1 h. This would be easily detectable by current -ray telescopes, but has never been observed. This might, in fact, cast doubts on the strength of the 511 keV line from the very-short-lived isotopes, and it has been suggested by Leung and Siegert (2022) that the flux would be heavily suppressed because the initial ejecta velocity could be much smaller than expected, so that the opacity stays at higher values at early times. With a flux of – at 511 keV, these lines could never be detected with current instrumentation. In any case, these would most probably fall into the in-situ annihilation case unless they also escape.
For , we have to rely so far on stellar evolution models and nucleosynthesis calculations to estimate the contribution of CNe to the remaining Positron Puzzle. While 1/3 of all CNe are considered ONe novae, and the CNe rate in the Milky Way is about – (Shafter, 2017), the expected contribution of is . Measurements only find an upper limit on the cumulative flux of -rays at 1275 keV in the Milky Way of per nova, which converts to an upper bound of the -production rate of (Siegert et al, 2021c) – about ten times higher than the theoretical expectation. CNe make at most 10 % of the total annihilation rate in the Milky Way if a steady state is assumed, and it is suggested from yield models that their contribution is even less than 1 %. It should be noted here that the contribution of CNe to Galactic is still debated, so that the -budget for massive stars might be decreased and for CNe increased, but will not change in total.
Other nucleosynthesis origins:
In the above considerations, we only took into account the standard classes of objects. Rare but strong events (or similarly weak but frequent events) may contribute significantly to the production of in the Galaxy. There are no direct measurements on which we could base our estimates on, so that here, we only list these objects as possible additions(!) to the total production rate.
Hypernovae, for example, which may be related to pair-instability supernovae, could produce – of , as suggested from SN2006gy in NGC1260 (Smith et al, 2007). If such an event happened every 1000 yr, the Milky Way annihilation rate could be sustained by hypernovae alone, even with an escape fraction of 1 %. However, the hypernova interpretation has been contested with other scenarios, for example as interactions with the ISM would strongly decrease the mass (e.g., Jerkstrand et al, 2020; Fox et al, 2015).
Another scenario which may explain all the in the Galaxy required to meet its annihilation rate is by Crocker et al (2017). In a similar fashion as the superluminous supernovae, a rare type of SN Ia, SN1991bg, may produce large amounts of . In this scenario, a low-mass He white dwarf merges with a low-mass CO white dwarf to produce a subluminous SN Ia. Because of the large amounts of He available, the yields of may be as high as , – times more than expected (and measured) for ‘normal’ ccSNe and SNe Ia. With a rate of these objects of 1 every 500 yr, averaging to about 15 % of all SNe Ia to be of SN1991bg-type, the total production rate would be on the order of . There is indeed evidence that these objects produce Ti as measured from absorption spectra around (see also Higdon et al, 2009).
Compact objects:
In compact objects, i.e. in particular neutron stars (NSs) and BHs, pair production by photon-photon interactions is probably the dominant production channel. Despite the fact that the production cross section of photon-photon-pair-production is calculated as
| (9) |
which has a maximum at for , i.e. on the same order of magnitude as the Thomson cross section, photon-photon-pair-production has never been unambiguously observed in laboratory experiments. Due to the high densities of high-energy photons needed, this process is only efficient when the optical depth , with being the physical size of the emitting objects, is larger than unity. This can be expressed in terms of the so-called compactness parameter , as
| (10) |
where is the Eddington luminosity and is the Schwarzschild radius of the source, both being a function of the object’s mass (Lightman and Zdziarski, 1987). For efficient pair production, , which means that for small objects and/or large luminosities, pair production is inevitable. Such compactness values are naturally possible for BHs, NSs, and to a smaller extent also WDs.
X-ray binaries (XRBs), and in particular low-mass XRBs (LMXRBs) were discussed in terms of the ‘Positron Puzzle’ shortly after the launch of INTEGRAL (Prantzos, 2004). They raised even more attention because their spatial distribution appeared similar to that of the 511 keV image with an enhancement towards negative longitudes (Weidenspointner et al, 2008). It turned out that the INTEGRAL/SPI measurements at this point in time were not representative of the full Galaxy so that a claim considering an XRB-origin due to the similar spatial distribution is flawed. Nevertheless are XRBs promising -producers as the annihilation of the pair-plasma that is produced in these objects has supposedly been measured in three different objects, the ‘Great Annihilator’ (1E1740.7-2942, Bouchet et al, 1991), Nova Musca (GRS1124-68, Goldwurm et al, 1992; Sunyaev et al, 1991), and V404 Cygni (GS2023+338, Siegert et al, 2016a). All of these measurements are contentious because independent analyses could not confirm the, most of time, weak signals.
The models for pair production in XRBs (e.g., Beloborodov, 1999), their annihilation as plasma (e.g., Svensson, 1983), and possible escape into the ISM (e.g., Beloborodov, 1999) result in order of magnitude estimates for the total population of compact objects in the Galaxy. Given the measurements of V404 Cygni, for example, we can estimate a -production rate of . Note that even if the pair-plasma annihilation feature in the spectra are doubted, the MeV spectrum extends significantly above 511 keV, so that pair production is inevitable (Svensson, 1987; Maciolek-Niedzwiecki et al, 1995). In the case of V404 Cygni with a luminosity of 20 % Eddington (Rodriguez et al, 2015), the photon-photon absorption has to take place within . This leads to an efficient absorption of -rays as they can interact with the more numerous X-rays, which leads to a suppression of photon energies . Estimates of the GeV flux of corroborate this scenario (Siegert et al, 2016a; Harvey et al, 2021).
Assuming a power-law-shaped seed spectrum (Beloborodov, 1999), the luminosity that potentially contributes to the -production in XRBs can be estimated. Assuming further that the -ray measurements in V404 Cygni are indeed pair-plasma-annihilations, the escape fraction of can be estimated to be . The theoretical value should be at most 20 %; other analyses of the same source would suggest an escape close to 100 % (Roques et al, 2015; Jourdain et al, 2017). These values are all of the same order of magnitude, and a canonical production rate per XRB in outburst in the Milky Way can be given as – corroborated by measurements.
To estimate the total contribution of microquasars and other XRBs to the -production in the Galaxy, one needs to estimate the duty cycle of such sources, and the total number of objects from population synthesis calculations (Guessoum et al, 2006). The duty cycle may be on the order of –, since per year, about one XRB is found in outburst for about 1–10 d. The total number of XRBs in the Galaxy may be in the range of as suggested by several works (e.g., Romani, 1992; Portegies Zwart et al, 1997; Bandyopadhyay et al, 2009). The total number of from the population of XRBs in the Milky Way is then
| (11) |
Again, at face value, and motivated by observations, XRBs may explain the entire annihilation rate in the Galaxy if a steady state is assumed. However because their escape is uncertain, the seed spectrum is uncertain, the duty cycle is uncertain, and the number of objects in the Galaxy is uncertain, the population of XRBs may also contribute insignificant amounts of for the Positron Puzzle.
Pulsars:
The contribution from pulsars, i.e. pair production in magnetic fields, can only be estimated theoretically, or by considering the measurements of cosmic-ray in the Solar System. Based on geometrical models, the -production rate by pulsars can be estimated as
| (12) |
where is the dipole magnetic field strength of the pulsar and its rotation period (Cheng et al, 1986; Zhang and Cheng, 1997). Given the population of pulsars in the Milky Way, including normal ones, millisecond pulsars, and magnetars666For millisecond pulsars and magnetars, the dipole assumptions may not be valid anymore., a total production rate of can be estimated.
Interestingly, Eq. (12) can be used to estimate the distance a single pulsar must have to explain the entire 511 keV flux from the direction of the Galactic bulge: In this ‘one neutron star’ solution, the 511 keV flux of – from the entire Milky Way is used and placed at a distance away from the Solar System. Clearly, this estimate suggests that all slow down in a way that the 511 keV morphology is recovered, which may not be the case, but the scenario is easily scalable. Assuming that the pulsar -production rate and observed flux are a steady state, the resulting plane of - can be found in Fig. 4. Given typical numbers for normal, millisecond pulsars (MSPs), and highly magnetised NSs (magnetars), the entire measured 511 keV line flux can be explained by a single magnetar at a distance of 100–200 pc. Smaller fluxes may still be explained by regular pulsars at such a distance.
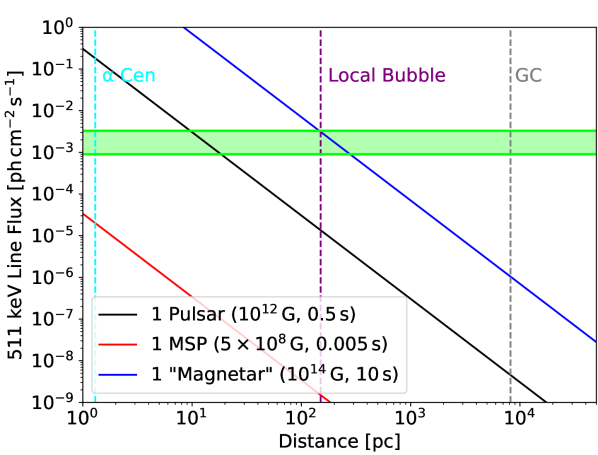
It is intriguing that the high-energy -excess from cosmic-ray measurements with AMS-02 also suggests a nearby ( pc) and young ( Myr) pulsar (Aharonian et al, 1995; Faherty et al, 2007). Indeed, including the Geminga pulsar significantly improves the description of the AMS-02 data (Yin et al, 2013; Di Mauro et al, 2014).
The question emerges: ‘why not relating the two problems?’ The canonical answer to this question is that ‘the kinetic energies of the would be too large.’ As I will argue in Sec. 3, such a statement may be flawed, first in terms of astrophysics, and second in terms of analysis. This dogma reappears also in the case of general cosmic-ray -production as well in the case of DM.
Supermassive black holes – the case of Sgr A*:
Similar to stellar mass black holes, supermassive black holes (SMBHs) with masses of to could also produce --pairs in the vicinity of their event horizons, near the hot inner accretion disk, above in their coronae, or in relativistic jets. For the SMBH in the centre of the Milky Way, Sgr A* (e.g. Genzel et al, 2003; Ghez et al, 2004), the accretion history is the most important factor in the context of the ‘Positron Puzzle’. In the quiescent state it is now, its accretion rate is on the order of – (Baganoff et al, 2003). If Sgr A* had phases of higher activity, an accretion rate of up to might have been possible, which would have increased the inner accretion disk temperature up to K (Totani et al, 2006). Such a large accretion rate may be due to tidal disruption events of low-mass stars (Cheng et al, 2007), massive star winds (Quataert, 2004), or from the ionised halo surrounding the SMBH (Totani et al, 2006). In either case, this may be enough to produce thermal MeV -rays, which in turn would create --pairs, but on a much shorter timescale than the annihilation is expected to happen.
The model by Totani et al (2006) suggests that Sgr A* alone could provide a 511 keV line flux on the order of if the accretion rate about 300 yr ago was – times higher than now. Another possibility could be periodic tidal disruption events with a timescale of 100 kyr (Cheng et al, 2007), or episodic interruptions of production in Sgr A* due to quenching from nearby SN explosions (Totani et al, 2006). Steady production of due to proton-proton interactions in the vicinity of Sgr A* would then occur on shorter timescales than in the ISM, for example. The might then diffuse outwards and fill up the bulge, but which has been shown to come with energetic constraints (Panther et al, 2018a).
In any case, the measured point-like source in the centre of the Galaxy (Skinner et al, 2014; Siegert et al, 2016b) may be due to from Sgr A*, but the narrow 511 keV line instead of the expected pair-plasma feature for BHs would point to the enhanced gas density in the CMZ rather than the SMBH itself.
Cosmic ray secondaries and -ray albedo of the Solar System:
Cosmic rays that have been accelerated by SN remnants, for example, reaching up to eV, in addition to ultra-high-energy cosmic rays up to eV, can lead to secondary as a result of high-energy collision. Porter et al (2008) estimated the secondary -production from cosmic rays by propagation models, taking into account energy losses, diffusion, and escape, to be between –. Again, the contribution is on the order of a few percent of the total measured annihilation rate, but this time with large kinetic energies, peaking around – MeV and extending to several GeV–TeV (Murphy et al, 1987). Such may again be ‘too fast’ to explain the Galactic 511 keV signal for which eV-scale particles are required (see Sec. 3.2).
In addition to secondary -production of cosmic rays with interstellar gas and molecular clouds, primary cosmic rays also interact with solid bodies in the Solar System. Moskalenko and Porter (2007) and Moskalenko et al (2008) calculated the -ray spectrum of cosmic rays interacting with small Solar System bodies as well as the Earth Moon. The 511 keV line from rapid energy losses of secondary in the rock material followed by direct annihilation is on the order of distributed along the ecliptic. This emission would in fact be time variable as the asteroids and trojans move significantly with respect to the Earth orbit around the Sun, so that different hot spots may emerge at different times (Siegert 2023, in prep.; see also Sec. 4.1). This might also be the reason why this emission component has so far not been detected. The Moon would show a 511 keV line on the order of , and would make a significant foreground component if observed with large-field-of-view instruments. The quiet Sun, Earth itself and planets are also plausible 511 keV contributors from cosmic-ray bombardment.
Dark matter:
Dark matter density profiles to explain the observed phenomena of flat rotation curves, structure formation, and high mass-to-light ratios in dwarf galaxies, are reminiscent of the 511 keV morphology, without the disk. It can be shown that an NFW profile squared, as suggested from the co-annihilation of DM particles, can replace the three bulge components to describe the -ray data statistically (Skinner et al, 2014). There are, however, more astrophysically relevant templates that fit the data better (Siegert et al, 2021b), such as a combination of a (smoothed) infrared bulge (Freudenreich, 1998) plus a (smoothed) nuclear stellar cluster (Launhardt et al, 2002). If DM particles are on the GeV–TeV mass scale, multiple and are emitted from their annihilation, resulting in a strong contribution to the IC spectrum in the Milky Way at MeV energies. These DM annihilation products have also been invoked to explain the cosmic-ray -excess as an alternative to the nearby pulsar scenario (see review by, e.g., Serpico, 2011).
Associating the 511 keV line in the Milky Way to DM products is difficult because, as shown above, the contribution of many other sources would produce an irreducible fore- and background. Other galaxies, and in particular dwarf galaxies, may provide better targets to distinguish 511 keV models. Siegert et al (2016c) found a hint at 511 keV from the dwarf galaxy Reticulum II (Ret II) – contemporary to a hint at GeV energies (Geringer-Sameth et al, 2015). With increased exposure and refined data analysis, it was shown that this signal was a fluke. It was further argued by Siegert et al (2016c) that the DM contribution to the 511 keV signal in the Milky Way, based on the serendipitous signal from Ret II, would be at most 1 %. Because the signal in Ret II may in fact be smaller than what has been measured before, and assuming no astrophysical background in Ret II to the 511 keV signal, the previous statement only holds if the DM cool down quickly and annihilate fast without escaping to the IGM. Since the only loss would be due to IC scattering, the escape is probably inevitable, but would also show a strong contribution again at the MeV continuum.
If the DM particles, instead, are of MeV scale, the behaviours would be similar to that of nucleosynthesis and pair production origins. As will be discussed in Sec. 3, the propagation may either be ballistic (collisional) for which large distances could be travelled within a typical lifetime of 0.1–10 Myr in the ISM, or advective, following the Galactic gas flow with diffusion length scales on the order of 1 pc due to the small gyro-radii. MeV may either emerge from particle DM or PBHs in the mass range of – g.
It is difficult to estimate relevant parameters, such as DM annihilation cross sections, from the measurements of the Milky Way alone. Attempts that claim to be ‘conservative’ and overplot the maximum possible spectrum at 511 keV from a population of DM particles in the Milky Way are not useful: Gamma-ray data analyses rely on model expectations versus measured count rates – a model comparison that uses already-extracted fluxes, i.e. values that already assumed a model (e.g. a power-law per energy bin), is flawed and can lead to much tighter limits than the anticipated ‘conservative’ approach. Instead, all models that are required to explain the data should be included, so that their intrinsic degeneracy given the measurement methods, are taken care of. The uncertainties per model component can and will be much larger than the sum of all components because of the covariance between components. This means that overplotting DM models on total spectra of the Milky Way in the keV–TeV range is wrong and upper limits from such attempts are not meaningful.
In addition to DM annihilation to pairs, also their internal bremsstrahlung should be taken into account, their IC scattering off the interstellar radiation field and the CMB, the annihilation in flight of , and the final annihilation resulting in the 511 keV line and ortho-Ps spectrum. The renewed analyses of Ret II is doing that (except for IC) and determines upper bounds on DM decay and annihilation cross sections as well as PBH mass limits. The velocity averaged cross section has an upper bound of and excludes PBH masses to make the gross of DM of g (Siegert et al, 2021a). The particle DM limits are among the strongest compared to current literature (see also Laha et al, 2020; Slatyer, 2016; Ng et al, 2019, for more limits). The strongest PBH evaporation limit is derived from the Cosmic Gamma-ray Background (CGB) including the redshift-integrated 511 keV contribution as well as the isotropic DM halo component of the Milky Way by Iguaz et al (2021), and from the DM halo of the Milky Way itself, taking into account any possible foreground to obtain a DM-only spectrum by Berteaud et al (2022). From BH evaporation, PBH masses of g are excluded to account for 100 % of the DM mass in the Milky Way. To exclude higher masses, the keV emission in the Milky Way must be studied as also fewer will be produced.
Stellar flares:
From RHESSI, SMM, Fermi/GBM, and INTEGRAL measurements, for example, we know that solar flares can lead to a strong 511 keV line and ortho-Ps continuum due to particle acceleration and subsequent production of pions and their decay. Whether the line is ubiquitous for all flare strengths and for all stars is a plausible, yet unproven assumption. From Kepler and TESS measurements (e.g., Shibayama et al, 2013), it is known that also other stars flare in a similar fashion as the Sun, with a flare-frequency-energy-distribution of . From the rare X-class flares with energies above erg, RHESSI could measure high-resolution spectra in the MeV range, finding also nuclear excitation lines in addition to the strong neutron capture line at 2.2 MeV and the -annihilation line at 511 keV (Lin et al, 2002). Murphy et al (2005), Murphy et al (2014), and Share et al (2004) studied the annihilation of in the solar atmosphere during flares in great detail, including line shapes and Ps-fractions as functions of temperature, density, and ionisation state: For low-energy ions, and -particle reactions are the dominant contributors to -unstable isotopes during a flare, resulting in large abundances of , , , , and , depending on the initial / ratio and the ion spectral index. As soon as the energy per ion reaches beyond , -production via proton-reactions is the only significant contribution to the -content. The slowing-down timescale from such in the solar atmosphere is on the order of 20 s (Murphy et al, 2014) so that a significant amount of annihilate directly in the atmosphere. Escape into the interplanetary medium may also be possible due to this timescale.
X-class solar flares are rare, but the only ones in which the 511 keV line has been detected, yet. Assuming that all flares produce which annihilate either directly in the stellar atmosphere or escape the star and annihilate in their vicinity, Bisnovatyi-Kogan and Pozanenko (2017) estimated from a benchmark solar flare that 50–100 % of the 511 keV line in the bulge may indeed be due to intermittently flaring stars. The model can easily be extended to include the Galactic disk. A relation between the 511 keV line flux and flare energy would refine this scenario as it is not clear how many are really produced per flare and how many annihilate in situ. Such a scenario would immediately reduce the need for many different source types because the estimated and measured number for nucleosynthesis would now only need to explain a small fraction of the total flux. It would also reduce the need for far propagation (Sec. 3) because, as stated in Sec. 1.1, the stellar population already fits the data quite well. See Fig. 5 for an overview of the production rates of different models assumptions vs. the measured annihilation rate in the Milky Way.
A smoking gun evidence for a stellar flare scenario would be the detection of 511 keV lines from globular clusters that correlate with the number of stars in each cluster. Alternative scenarios in globular clusters are also possible, but they might show a different correlation, e.g. with the GeV flux from MSPs (Bartels et al, 2018).
3 Positron propagation
3.1 High-energy positrons
The propagation of in the ISM is not well understood. From AMS-02, PAMELA, and other particle detectors around Earth, we know that at least high-energy , with Lorentz-factors of reach Earth. Lower energy are, similar to the case of other cosmic-ray species, heavily affected by the solar modulation potential. There appears to be an excess of cosmic-ray above the expectations from secondary production of hadronic cosmic rays with the ISM that dominates the spectrum above GeV (Aguilar et al, 2013, 2019). This component has been interpreted in terms of a nearby ( pc) pulsar that manages to accelerate to Lorentz factors of (e.g., Di Mauro et al, 2014; Yin et al, 2013), or in terms of heavy ( TeV) DM particles, co-annihilating into pairs (e.g., Kopp, 2013). While the first scenario may have been excluded by HAWC measurements (Abeysekara et al, 2017), the latter may be corroborated by ongoing measurements of AMS-02 within the next years. The fundamental problem in all of the scenarios is the assumption that cosmic-ray secondary production and -propagation in the Galaxy is understood.
Cowsik et al (2014) showed that the positron fraction , as measured by AMS-02, can be explained without additional sources. In their Nested Leaky-Box model, acceleration of cosmic rays happens in many sources across the Galaxy and -propagation follows the established works of Moskalenko and Strong (1998), resulting in a source term with a power-law spectrum and spatial distribution according to the hydrogen density in the Galaxy. The propagation can then be described as spatial diffusion with radiative energy losses, and the leakage from the Galaxy, so that may in fact escape on a characteristic time scale.
In summary, for highly relativistic , even though we can measure directly the cosmic-ray spectrum at the position of the Solar System, it is not established, how propagate in the ISM. An inaccurate assumption on the high-energy propagation led to conjectures of additional sources, but which may not be required at all if the premise is wrong.
3.2 Low-energy positrons
Now, in terms of low-energy , either having Lorentz-factors of 1–3 in the case of nucleosynthesis or a few 10s to 100s in the case of pulsars, the gross of secondary from cosmic-ray interactions in the ISM (Murphy et al, 1987), pair-plasma ejections from XRBs, light DM particle annihilations, or Hawking radiation, we have no direct information on these particles. Therefore, we have to rely on theoretical assumptions as to how long and how far propagate in the ISM, how many escape the Galaxy, how many annihilate in flight, and how many thermalise with the ISM.
Thermalisation:
The annihilation rates for cooled ( K; keV) in interstellar gas as a function of temperature are well understood (Guessoum et al, 2005), so that annihilation after thermalisation occurs inevitably after a characteristic timescale of about 1 Myr for ISM conditions of K and . Panther et al (2018b) showed that including the much less abundant alkali metals in the ISM reduces this timescale to Myr. Propagation after thermalisation is expected to follow the flow of the gas in which the are thermalised, i.e. they will be advected rather than transported diffusively, and annihilate according to the conditions in the ISM. This is then either by charge exchange with hydrogen (only possible for kinetic energies eV, i.e. in gas with temperatures not much cooler than K, but also not hotter than eV ( K) as all hydrogen will be ionised) or by radiative recombination with free . The gas and densities will determine the annihilation rate, given the density distribution and motion.
Collisional transport:
The processes between the injection of mildly relativistic and the formation of Ps and final decay have been investigated in many studies (e.g., Prantzos, 2006; Jean et al, 2009; Martin et al, 2012; Alexis et al, 2014; Higdon et al, 2009; Rothschild, 2009; Siegert et al, 2021b). In collisional transport, propagate almost ballistically and are guided by the large-scale magnetic field in the Galaxy. Through pitch-angle scatterings in a turbulent magnetic field, the generic stopping distance for in typical ISM conditions is only reduced by 25 % (Jean et al, 2009), resulting in an effective distance of kpc. At MeV energies, energy losses are mainly due to ionisation and excitation of atoms, i.e. in general Coulomb interactions. Inverse Compton scattering, bremsstrahlung and synchrotron losses are only important for higher energies ( GeV) or when the gas density is small (), such as in the Galactic halo or in superbubbles. On the one hand, this length scale is larger than the typical phases of the warm ISM phase in which most presumably annihilate as inferred from spectral analyses (Jean et al, 2006). On the other hand, Churazov et al (2011) showed that the 511 keV line profile is also consistent with annihilation in a cooling ISM, or within gas phases of temperatures around K with only small ionisation fractions on the percent level. Both of these solutions appear realistic as the annihilation rate increases significantly when approach denser regions, but the mixing from the hot ionised gas with HI regions or molecular clouds, for example at the edges of superbubbles, allows also warmer regions and a temperature and thus ionisation gradient (Krause et al, 2013). These ambiguous solutions may also imply that the assumed turbulence power spectrum has another shape, or that -propagation occurs through collisionless transport.
Collisionless transport:
In collisionless transport, propagate according to pitch-angle scattering which may be described by an angular diffusion coefficient, and (re-)acceleration in a turbulent plasma which is governed by a momentum diffusion coefficient. The basis of this approach is that the gyroradii of – in multiphase ISM conditions (–), are on the order of – cm, much smaller than the ballistic length scale, so that the exact path of the can be averaged over the drift length scale. The cooling in collisionless transport then happens via particle interactions with magnetohydrodynamic (MHD) waves. In addition to -wave interactions, adiabatic losses, for example in Galactic ‘winds’ or expanding superbubbles, may be significant in this regime.
It is unknown how propagate in the ISM: Different approaches that test the collisional or collisionless transport, either using Monte Carlo simulations (Alexis et al, 2014) or state-of-the-art cosmic-ray propagation codes (Martin et al, 2012), fall short in explaining the 511 keV morphology as measured with INTEGRAL/SPI. For example, Alexis et al (2014) expect that the spiral arm structure of the Milky Way would also be seen at 511 keV. Given the latest measurements, this is not detected.
3.2.1 Cosmic-ray transport equation
In general, the distribution of as a function of time, position, and momentum, can be described as the solution of an appropriate Fokker-Planck-equation with drift (re-acceleration, convection, advection, energy losses), diffusion (coefficients due to transport mode and conditions), source (see Sec. 2), and sink (annihilation rates, cross sections, escape, leakage timescales) terms. Such a treatment requires realistic 3D-distributions of sources that are parametrised by their production rate and injection spectrum. As the -decay spectrum is unique for different isotopes, the pair-plasma spectrum nearly thermal, pulsar accelerated resulting in a power-law, and cosmic-ray secondary peaking around 30 MeV, one cannot assume one generic spectrum for the injection in the Galaxy – and certainly no mono-energetic . Furthermore, the gas (target) distributions cannot just be generic, smooth, models because the annihilation rates depend strongly on the varying temperature, ionisation state, target density, and current -density. The energy losses also change as a function of the same parameters, so that an average gas component in such a model will never show the structure of where and at what temperature really annihilate. Diffusion will also change as a function of Galactic component: For example could the Galactic wind from superbubble blowouts (Krause et al, 2021) be a region of either ballistic or advective transport up to 10 kpc into the halo. Above such a height, turbulence might set in again so that stronger diffusion could be expected. Similar arguments may be true for the bulge and disk as discussed in Higdon et al (2009). An important, albeit often neglected, term in the diffusion-convection equation is the destruction of : It is typically assumed that are removed from the scheme if their kinetic energy is below a threshold of, say, 100 eV (Martin et al, 2012). This assumption may be flawed since the cooling down time scale for MeV is on the order of Myr whereas the annihilation timescale after thermalisation might be similar. The timescales depend on the exact conditions of the ISM at the time, but the cooling down time is generally larger than the annihilation time after thermalisation (Guessoum et al, 2005; Jean et al, 2009). Nevertheless, in a time of 0.1–1 Myr, interstellar gas, especially in low-density regions, may be propagating 10–100 pc and therefore significantly changing the annihilation morphology.
3.2.2 Annihilation in flight
Martin et al (2012) also included the process of -annihilation ‘in flight’, i.e. the direct annihilation of with without forming Ps first, that also removes from the scheme. This process is only governed by the annihilation cross section as a function of energy, given the densities of the interacting particles. There appears to be a consensus that annihilation in flight is negligible for MeV because of two reasons: 1) The probability that this process is happening at higher energies is very low, and 2) Beacom and Yüksel (2006) and Sizun et al (2006) claim that the annihilation in flight of must not happen at energies above several MeV due to spectral constraints. I will argue here that both these reasons should be considered only on the premise of a steady state between production and annihilation inside the Galaxy, and that the model comparison to the available data was inadequately performed.
e^+sE_in_H≲10^5γ≲100PF_IAf_Ps0 ≤r_32 ≤4.5f_Psm_e/2e^+sk_BT ≲10e^+se^+e^+se^+sγe^+e^+sγγ5^∘e^+sγe^-γe^+γγe^-
4 Future avenues
The Positron Puzzle appears to require a smoking-gun-evidence measurement to proceed.
But solving the puzzle does not only rely on better measurements with future instrument – of course the latter will tremendously help –, it also relies on understanding the MeV sky itself better as well as more solid data analyses.
4.1 Foreground emission
While the 511 keV line is the strongest astrophysical -ray line known, the will to take ‘pictures’ of the MeV sky unavoidably results in ambiguities, image reconstruction artefacts, and finally doubt about the results. But many of the low-significance features in MeV images might in fact not be artefacts but due to a time variable foreground emission. As described in Sec. 2.2, the cosmic-ray bombardment of small Solar System bodies leads to nuclear excitation and pion production, followed by de-excitation via -ray emission and -annihilation on top of a bremsstrahlung spectrum. It is known from -ray measurements of the asteroid 433 Eros (Peplowski, 2016), that there is indeed a 511 keV line, plus de-excitation lines that inform about the asteroid’s composition. From the entire population of asteroids in the main belt between Mars and Jupiter (torus at 2.0–3.5 AU), the Kuiper belt beyond Neptune (torus at 30–50 AU), the Jovian trojans (accumulation at Lagrange points of the Jupiter-Sun-system; orbital time 11 yr), the plausible Neptunian trojans (orbital time 165 yr), and the suspected but not proven Oort-cloud (spherical accumulation between – AU) would all contribute to a time variable foreground emission, predominantly in the ecliptic (see also Moskalenko et al, 2008, for estimates). The Oort-cloud, if real, would even lead to an isotropic 511 keV, and in general broadband MeV, emission. For coded aperture masks, this emission would be invisible, but would be detected by Compton telescopes, such as the Compton Spectrometer and Imager (COSI, Tomsick et al, 2019, planned for launch in 2027), if the flux is large enough. The ecliptic has an intriguing overlap with the Galaxy, almost exactly at the Galactic bulge, so that the bulge emission at 511 keV with a flux of could actually be expected to change as a function of planetary time scales by 1–5 %. Such a measurement is on the verge of possibilities with current instrumentation. Since the ecliptic is rarely observed with INTEGRAL/SPI, the possibility to detect the foreground emission directly requires a time variable diffuse emission model. If emission from apparently moving sources is analysed time independent, their resulting picture, or map, may include high-flux regions which can hardly be explained by astrophysical sources outside the Solar System.
The 511 keV line sensitivity we would need to identify the time-averaged components we probably already have with INTEGRAL/SPI, about ( point source sensitivity for 1 Ms). But the current exposure of SPI, being mostly concentrated along the Galactic plane and bulge, makes it difficult to identify any high-latitude component. Since the individual components would be large on the sky, possibly with several tens of degrees in diameter, the line sensitivity to disentangle these foreground components should be below . The future COSI-SMEX mission (Tomsick et al, 2019) will shed light on the Solar System foreground.
4.2 Isotropic Emission
In addition to the Oort cloud, there may be even more isotropic components, especially for the 511 keV line. From the Nested Leaky-Box-Model of Cowsik et al (2014), it is clear that a large portion of may leave the Galaxy. But also in the Galactic halo and the IGM, would eventually find their to annihilate with. Depending on the temperature where recombine with , the 511 keV line would be broadened accordingly. Given the direct measurements, and accounting for all uncertainties, even within , more than five times the seen to annihilate could be produced in the Milky Way. Within , up to a factor of ten is possible. Only with a Compton telescope or vastly improved coded-mask apertures, or in general MeV telescopes, could such an isotropic component be detected from the Milky Way.
A similar isotropic emission component at 511 keV might be expected from DM, as the line-of-sight integration into all directions always leads to an offset, which would result in an isotropic part. From the CGB, such a component would then also include a red-shift dependence, so that both, a strong 511 keV line, and a continuum-like component due to integration across red-shifts would be expected (Iguaz et al, 2021).
Finally, also the pair-absorption of very- and ultra-high-energy photons will create --pairs in the Galaxy and the IGM which will eventually annihilate and plausibly produce an isotropic 511 keV line. The mean free path of PeV photons, for example, is less than 10 kpc so that any ‘pevatron’ inside the Galaxy will also create through pair production with the CMB and the interstellar radiation field. For extragalactic sources, this also applies, and the shear number of extragalactic TeV sources will lead to the inevitable pair production in the IGM.
The possibility of an isotropic 511 keV line is an going research topic and there are hardly any flux expectations or predictions. As mentioned above, coded aperture masks can hardly identify isotropic emission unless specific satellite orbit manoeuvres are performed. INTEGRAL Earth occultation observations allowed us to measure the cosmic X-ray background up to keV, but did not consider the 511 keV line (e.g. Churazov et al, 2007; Türler et al, 2010). A current all-sky sensitivity of SPI of is estimated from the previous results. A ten-fold sensitivity improvement in the 511 keV line might already show if there are annihilating in the halo which current instruments are blind for.
4.3 Imaging might not be enough
With new MeV telescopes, i.e. improved angular resolution and better sensitivity, new images of the 511 keV sky will be created. But even with the identification of 511 keV point sources, there may be open questions, as to why the morphology is what it is. The comparison of tracer maps, and ranking them according to relative likelihoods gives an idea of what the sources or sinks are, but the physics cannot be probed on this basis.
Pleintinger et al (2019) tried to disentangle the overall morphology of the line at 1809 keV by slicing the data into longitude-bins and measuring the scale height by a maximum likelihood fit. The regions were chosen independent from each other, so that a statistic about scale heights could be generated. From Hydrodynamics simulations, for example, or population synthesis calculations, a similar statistic can then be calculated which includes all the astrophysical input. From this treatment it was found that indeed, chimney-like structures could exist in the Galaxy, which was not possible before.
A more advanced approach would be a decomposition similar to the CMB power spectrum. If the raw data, or in a weaker version the reconstructed images, can be analysed through spherical harmonics, a meaningful multipole series expansion up to would be possible with future telescopes. In this way, the physical interpretation does not rely dramatically on the background model, and inferences from costly hydrodynamics simulations are made possible. Especially in the case of the 511 keV emission with its many source distributions, the full (unknown) propagation, and final annihilation sites, will benefit from structured, high-resolution, simulations to understand the full impact of the puzzle.
Structural comparisons will be better the better the sensitivity of the instrument and the more homogeneous the exposure. Size and angular scales can be more solidly compared if the sensitivity is improved by another decade with respect to INTEGRAL/SPI, for example. The COSI-SMEX mission will have a 511 keV line point source sensitivity of less than for each position in the sky after its two-year nominal mission, thanks to its large field of view of (Tomsick et al, 2019).
4.4 What gives?
With new measurements from a new telescope, further analyses towards understanding the MeV foreground, and data analysis tools that focus on the astrophysical parameters, the Positron Puzzle may solve more than just the origin of in galaxies. With current instrumentation, it is already now possible to develop astrophysical models that are bound by the total emission in the Galaxy. The 511 keV line, and associated also the ortho-Ps continuum as well as the in-flight annihilation component, can be used to study other unsolved problems in astrophysics. I will outline two examples here that have, at first glance, nothing in common, but are indeed connected through -annihilation.
Dark matter:
As described above, DM in the form of beyond-standard-model particles or PBHs will eventually lead to non- or highly-relativistic , or a mixture in between. These and will be responsible for additional spectral components from GHz to GeV. As the PBHs evaporate or DM particles co-annihilate, the secondary particles will decay and result in a prompt emission spectrum around the scale of the PBH or DM mass, typically peaking at about 10 % of the particles’ masses. The secondary high-energy and created propagate diffusively and experience losses from IC scattering off of CMB and infrared/optical photons (e.g., Saxena et al, 2011; Cirelli and Panci, 2009). This would create a characteristic IC bump that should be consistent throughout all astrophysical observation possibilities (Milky Way, dwarf galaxies, isotropic with redshift integration). For GeV pairs, this would result in peaks in the MeV range (see Fig. 3.2.2). In addition will the pairs experience synchrotron losses, so that a characteristic synchrotron spectrum would be visible, also with a peak that depends on the pairs’ energies and hence the initial DM particle mass. When the pairs are then cooled and the IC, synchrotron and bremsstrahlung losses are sub-dominant, Coulomb losses set in, and and require on the order of 0.1–10 Myr to cool down to thermal temperatures (see Sec. 3.2). During this entire time, the may also annihilate in flight, leading to another characteristic feature that depends on the initial spectrum. Then, after thermalisation, eventually annihilate via the formation of Ps, showing the strong 511 keV line and the ortho-Ps component.
Building a full model of the secondary and tertiary particles from DM annihilation (or PBH evaporation) in the Milky Way, and adequately comparing this to the available data from radio to -rays is difficult as the astrophysical foreground has to be understand. But especially the IC MeV continuum and 511 keV line are orthogonal to most other wavelengths (see Fig. 1) in which a ‘prompt’ DM annihilation may be visible. This makes them an invaluable messenger in the indirect search for DM. The cosmic-ray and , for example measured with AMS-02, should also be used to constrain the DM searches in addition to photon observations – not independently.
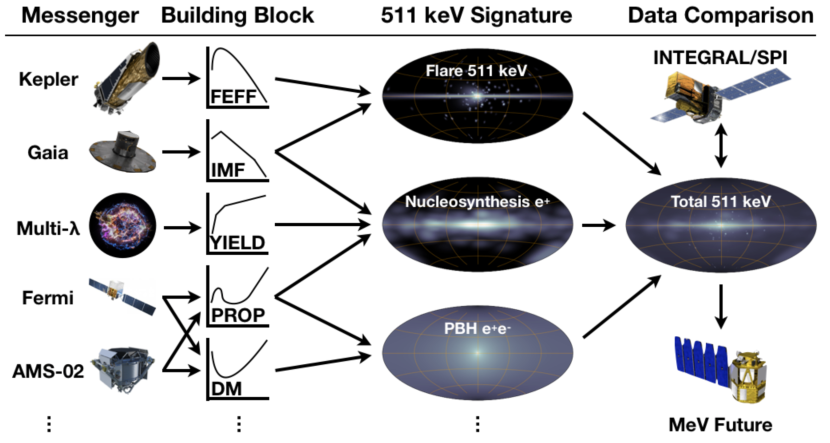
Solar coronal heating problem:
Assuming instead that the 511 keV emission that is coincident with the positions of stars (i.e. a considerable fraction, see Fig. 3) comes from stellar flares, one can build a model to determine the lower and upper cut-off energy of the flare-frequency-energy distribution. Determining the lower cut-off energy from the entire population of stars may inform the solar coronal heating problem as it is believed that micro- and nano-flares are responsible for the high temperatures of the Sun’s corona. Instead of observing a single star in 511 keV, which is only possible for the Sun, the Galactic 511 keV emission provides a means to observe all stars at the same time. For such an endeavour, one needs to build a hierarchical model that eventually predicts the total flux at 511 keV (and ortho-Ps). Again, for the entire Milky Way, such a model will be difficult, but hotspots, such as expected from globular clusters, would result in characteristic ratios among the 157 globular clusters of the Milky Way (Harris, 2010). Such a ratio will be very rigid so that different models, which may also be tested in globular clusters (Bartels et al, 2018), could easily be distinguished.
In particular, for each of the globular clusters of the Milky Way, an initial mass function (IMF) with shape and total number of stars determines the masses of stars in each object. Each star with mass has its own flare-frequency-energy distribution that determines the average number of in each flare. The flare distribution depends on three parameters, the low-energy cut-off, , high-energy cut-off , and a steepness parameter , where and could also depend on the stellar mass. The star’s mass also determines the density profile, , of the stellar atmosphere, from which finally the number of annihilation photons (flux) can be calculated. Given the distances to all globular clusters in the Milky Way, a flux pattern of 511 keV point sources would be result (see Fig. 7, right). The only fitted parameters of such a model would be and since other parameters would be determined from independent measurements. These cut-offs serve as normalisation parameters for the final 511 keV flux because if is too small or too large, too many stars would flare too frequently, so that the globular clusters would appear brighter than what is actually measured.
Based on a correlation with the GeV flux (Bartels et al, 2018), one can estimate to an order of magnitude how bright several objects would be in the 511 keV line. There could be 19 globular cluster with a flux of or more, with Omega Centauri, 47 Tucanae, Terzan 5, and NGC 6397 as potentially the brightest ones with fluxes of –. COSI would easily detect these objects within its two year mission (Tomsick et al, 2019). The total 511 keV flux of all globular cluster combined would be around . Only a few objects would be seen individually, but since they follow a certain hierarchy given their GeV fluxes, they can be treated as one population and discovered as one entity.
For a stellar flare scenario (Bisnovatyi-Kogan and Pozanenko, 2017), i.e. roughly scaling with stellar mass, the expected fluxes would be mostly below for individual objects. Again Omega Centauri and 47 Tucanae would be the brightest, but not individually detectable, even with COSI. The total flux of all 157 objects would be on the edge of the detection limit for future instruments in the case of a 511 keV line purely from stellar flares.
5 Putting it all together
It is clear that both exemplary models from above, DM and stellar flares, may in fact contribute to the entire Galactic signal. Extrapolating the models from individual objects to the entire Milky Way signal will turn out to be more complex as they might be interdependent – but are bound by the morphology and total flux measured. Such models, if -transport is properly taken into account, can actually be fitted to data instead of just building the advanced models. The resulting 3D emissivities need to be line-of-sight integrated which leads to 2D-images, parametrised by only a few parameters, similar to heuristic models but with physical meaning. The final all-sky images (i.e. the Milky Way, plus all other contributions from dwarf galaxies, globular clusters, nearby sources, isotropic emission), and spectral differences (not just the 511 keV line but annihilation in hot gas, Ps fraction, annihilation in flight, IC components, etc.) can be directly compared to raw data of instruments.
In order to build a full understanding of the Positron Puzzle, it cannot be solved by arguing about individual sources – they must all be described together. This means that for each -source population, a realistic -production mechanism, escape, and injection to the ISM needs to be built. But all these source populations and injected are required to experience the same propagation mechanism through which the final annihilation image is tied together. If the do not escape, a fraction of the Galactic 511 keV emission will come from in-situ annihilation, for example from stellar flares and SN remnants.
The two important messages to understand here are: 1) Occam’s razor must not be misinterpreted in the case of finding the source responsible for annihilating in the Milky Way. It is clear from a multitude of observational evidence that there must be more than one source that contributes to the entire measured signal. 2) Only by considering more data than just the 511 keV line will lead to reasonable progress in solving the Positron Puzzle (Fig. 8). In turn, by having this unique astrophysical messenger, we will gain insights to other unsolved astrophysical problems.
Supplementary information Not applicable
Acknowledgments I thank Martin G. H. Krause, Karl Mannheim, Roland Diehl, Jochen Greiner, John Tomsick, and Steve Boggs for support throughout the years and for fruitful discussions.
Declarations
Not applicable.
Editorial Policies for:
Springer journals and proceedings: https://www.springer.com/gp/editorial-policies
Nature Portfolio journals: https://www.nature.com/nature-research/editorial-policies
Scientific Reports: https://www.nature.com/srep/journal-policies/editorial-policies
References
- \bibcommenthead
- Abeysekara et al (2017) Abeysekara AU, Albert A, Alfaro R, et al (2017) Extended gamma-ray sources around pulsars constrain the origin of the positron flux at earth. Science 358(6365):911–914. 10.1126/science.aan4880
- Ackermann et al (2013) Ackermann M, Ajello M, Allafort A, et al (2013) Detection of the Characteristic Pion-Decay Signature in Supernova Remnants. Science 339:807–811. 10.1126/science.1231160, URL http://arxiv.org/abs/1302.3307
- Aguilar et al (2013) Aguilar M, Alberti G, Alpat B, et al (2013) First Result from the Alpha Magnetic Spectrometer on the International Space Station: Precision Measurement of the Positron Fraction in Primary Cosmic Rays of 0.5-350 GeV. Physical Review Letters 110(14):141,102. 10.1103/PhysRevLett.110.141102
- Aguilar et al (2019) Aguilar M, Ali Cavasonza L, Ambrosi G, et al (2019) Towards Understanding the Origin of Cosmic-Ray Positrons. Physical Review Letters 122(4):67. 10.1103/PhysRevLett.122.041102, URL https://link.aps.org/doi/10.1103/PhysRevLett.122.041102
- Aharonian et al (1995) Aharonian FA, Atoyan AM, Voelk HJ (1995) High energy electrons and positrons in cosmic rays as an indicator of the existence of a nearby cosmic tevatron 294:L41–L44
- Albernhe et al (1981) Albernhe F, Le Borgne JF, Vedrenne G, et al (1981) Detection of the positron annihilation gamma ray line from the Galactic Center region. Astronomy & Astrophysics 94:214–218. URL http://adsabs.harvard.edu/abs/1981A&A....94..214A
- Alexis et al (2014) Alexis A, Jean P, Martin P, et al (2014) Monte Carlo modelling of the propagation and annihilation of nucleosynthesis positrons in the Galaxy. Astronomy & Astrophysics 564:A108. 10.1051/0004-6361/201322393, URL http://adsabs.harvard.edu/cgi-bin/nph-data_query?bibcode=2014A%26A...564A.108A&link_type=EJOURNAL
- Arnett (1982) Arnett WD (1982) Type I supernovae. I - Analytic solutions for the early part of the light curve 253:785–797
- Baganoff et al (2003) Baganoff FK, Maeda Y, Morris M, et al (2003) Chandra X-Ray Spectroscopic Imaging of Sagittarius A* and the Central Parsec of the Galaxy 591:891–915. 10.1086/375145
- Bandyopadhyay et al (2009) Bandyopadhyay RM, Silk J, Taylor JE, et al (2009) On the origin of the 511-keV emission in the Galactic Centre. arXivorg 392:1115–1123. 10.1111/j.1365-2966.2008.14113.x, URL http://arxiv.org/abs/0810.3674
- Bartels et al (2018) Bartels R, Calore F, Storm E, et al (2018) Galactic binaries can explain the Fermi Galactic centre excess and 511 keV emission. Monthly Notices of the Royal Astronomical Society 480(3):3826–3841. 10.1093/mnras/sty2135, URL http://adsabs.harvard.edu/cgi-bin/nph-data_query?bibcode=2018MNRAS.480.3826B&link_type=EJOURNAL
- Beacom and Yüksel (2006) Beacom JF, Yüksel H (2006) Stringent Constraint on Galactic Positron Production. Physical Review Letters 97(7):071,102—-. 10.1103/PhysRevLett.97.071102, URL http://dx.doi.org/10.1103/PhysRevLett.97.071102
- Beloborodov (1999) Beloborodov AM (1999) Electron-positron outflows from gamma-ray emitting accretion discs 305:181–189. 10.1046/j.1365-8711.1999.02384.x
- Bennett et al (2013) Bennett CL, Larson D, Weiland JL, et al (2013) Nine-year Wilkinson Microwave Anisotropy Probe (WMAP) Observations: Final Maps and Results. arXivorg 208:20. 10.1088/0067-0049/208/2/20, URL http://arxiv.org/abs/1212.5225
- Berteaud et al (2022) Berteaud J, Calore F, Iguaz J, et al (2022) Strong constraints on primordial black hole dark matter from 16 years of INTEGRAL/SPI observations. arXivorg p arXiv:2202.07483. URL http://adsabs.harvard.edu/abs/2022arXiv220207483B, https://arxiv.org/abs/2202.07483
- Bisnovatyi-Kogan and Pozanenko (2017) Bisnovatyi-Kogan GS, Pozanenko AS (2017) Can Flare Stars Explain the Annihilation Line from the Galactic Bulge? Astrophysics 60(2):223–227. 10.1007/s10511-017-9477-6, URL https://link.springer.com/article/10.1007/s10511-017-9477-6
- Bjorklund et al (1950) Bjorklund R, Crandall WE, Moyer BJ, et al (1950) High energy photons from proton-nucleon collisions. Physical Review 77(2):213–218. 10.1103/physrev.77.213
- Boehm et al (2004) Boehm C, Hooper D, Silk J, et al (2004) MeV Dark Matter: Has It Been Detected? Physical Review Letters 92(10):101,301. 10.1103/PhysRevLett.92.101301, URL https://journals.aps.org/prl/abstract/10.1103/PhysRevLett.92.101301
- Bouchet et al (1991) Bouchet L, Mandrou P, Roques JP, et al (1991) Sigma discovery of variable e(+)-e(-) annihilation radiation from the near Galactic center variable compact source 1E 1740.7 - 2942. Astrophysical Journal 383:L45–L48. 10.1086/186237, URL http://adsabs.harvard.edu/doi/10.1086/186237
- Bouchet et al (2010) Bouchet L, Roques JP, Jourdain E (2010) On the Morphology of the Electron-Positron Annihilation Emission as Seen by Spi/integral. The Astrophysical Journal 720(2):1772–1780. 10.1088/0004-637X/720/2/1772, URL http://adsabs.harvard.edu/cgi-bin/nph-data_query?bibcode=2010ApJ...720.1772B&link_type=EJOURNAL
- Bouchet et al (2011) Bouchet L, Strong AW, Porter TA, et al (2011) Diffuse Emission Measurement with the SPectrometer on INTEGRAL as an Indirect Probe of Cosmic-Ray Electrons and Positrons. The Astrophysical Journal 739(1):29. 10.1088/0004-637X/739/1/29, URL http://adsabs.harvard.edu/cgi-bin/nph-data_query?bibcode=2011ApJ...739...29B&link_type=EJOURNAL
- Caroli et al (1987) Caroli E, Stephen JB, Di Cocco G, et al (1987) Coded aperture imaging in X- and gamma-ray astronomy. Space Science Reviews 45(3):349–403. 10.1007/BF00171998, URL https://link.springer.com/article/10.1007/BF00171998
- Castor et al (1975) Castor J, McCray R, Weaver R (1975) Interstellar bubbles 200:L107–L110. 10.1086/181908
- Cheng et al (1986) Cheng KS, Ho C, Ruderman M (1986) Energetic radiation from rapidly spinning pulsars. I - Outer magnetosphere gaps. II - VELA and Crab 300:500–539. 10.1086/163829
- Cheng et al (2007) Cheng KS, Chernyshov DO, Dogiel VA (2007) Diffuse gamma-ray emission from the Galactic center - a multiple energy injection model. arXivorg 473:351–356. 10.1051/0004-6361:20077538, URL http://arxiv.org/abs/0706.4351
- Churazov et al (2005) Churazov E, Sunyaev R, Sazonov S, et al (2005) Positron annihilation spectrum from the Galactic Centre region observed by SPI/INTEGRAL. Monthly Notices of the Royal Astronomical Society 357(4):1377–1386. 10.1111/j.1365-2966.2005.08757.x, URL http://adsabs.harvard.edu/cgi-bin/nph-data_query?bibcode=2005MNRAS.357.1377C&link_type=EJOURNAL
- Churazov et al (2007) Churazov E, Sunyaev R, Revnivtsev M, et al (2007) INTEGRAL observations of the cosmic X-ray background in the 5-100 keV range via occultation by the Earth. Astronomy & Astrophysics 467(2):529–540. 10.1051/0004-6361:20066230, URL http://adsabs.harvard.edu/cgi-bin/nph-data_query?bibcode=2007A%26A...467..529C&link_type=EJOURNAL
- Churazov et al (2011) Churazov E, Sazonov S, Tsygankov S, et al (2011) Positron annihilation spectrum from the Galactic Centre region observed by SPI/INTEGRAL revisited: annihilation in a cooling ISM? Monthly Notices of the Royal Astronomical Society 411(3):1727–1743. 10.1111/j.1365-2966.2010.17804.x, URL http://adsabs.harvard.edu/cgi-bin/nph-data_query?bibcode=2011MNRAS.411.1727C&link_type=EJOURNAL
- Churazov et al (2014) Churazov E, Sunyaev R, Isern J, et al (2014) Cobalt-56 -ray emission lines from the type Ia supernova 2014J. Nature 512(7):406–408. 10.1038/nature13672, URL http://adsabs.harvard.edu/cgi-bin/nph-data_query?bibcode=2014Natur.512..406C&link_type=EJOURNAL
- Cirelli and Panci (2009) Cirelli M, Panci P (2009) Inverse compton constraints on the dark matter e+e- excesses. NuclPhysB821:399-416,2009 10.1016/j.nuclphysb.2009.06.034, https://arxiv.org/abs/arXiv:0904.3830 [astro-ph.CO]
- Cowsik et al (2014) Cowsik R, Burch B, Madziwa-Nussinov T (2014) THE ORIGIN OF THE SPECTRAL INTENSITIES OF COSMIC-RAY POSITRONS. The Astrophysical Journal 786(2):124. 10.1088/0004-637x/786/2/124
- Crocker et al (2017) Crocker RM, Ruiter AJ, Seitenzahl IR, et al (2017) Diffuse Galactic antimatter from faint thermonuclear supernovae in old stellar populations. Nature Astronomy 1:0135. 10.1038/s41550-017-0135, URL http://arxiv.org/abs/1607.03495
- Dame et al (2001) Dame TM, Hartmann D, Thaddeus P (2001) The Milky Way in Molecular Clouds: A New Complete CO Survey. The Astrophysical Journal 547(2):792–813. 10.1086/318388, URL http://adsabs.harvard.edu/cgi-bin/nph-data_query?bibcode=2001ApJ...547..792D&link_type=EJOURNAL
- Di Mauro et al (2014) Di Mauro M, Donato F, Fornengo N, et al (2014) Interpretation of AMS-02 electrons and positrons data. arXivorg 4:006. 10.1088/1475-7516/2014/04/006, URL http://arxiv.org/abs/1402.0321
- Dickey and Lockman (1990) Dickey JM, Lockman FJ (1990) H I in the Galaxy. IN: Annual review of astronomy and astrophysics Vol 28 (A91-28201 10-90) Palo Alto 28(1):215–261. 10.1146/annurev.aa.28.090190.001243, URL http://www.annualreviews.org/doi/10.1146/annurev.aa.28.090190.001243
- Diehl et al (2006) Diehl R, Halloin H, Kretschmer K, et al (2006) Radioactive 26Al from massive stars in the Galaxy. Nature 439(7072):45–47. 10.1038/nature04364, URL https://www.nature.com/articles/nature04364
- Diehl et al (2015) Diehl R, Siegert T, Hillebrandt W, et al (2015) SN2014J gamma rays from the 56Ni decay chain. Astronomy & Astrophysics 574:A72. 10.1051/0004-6361/201424991, URL http://adsabs.harvard.edu/cgi-bin/nph-data_query?bibcode=2015A%26A...574A..72D&link_type=EJOURNAL
- Diehl et al (2018) Diehl R, Siegert T, Greiner J, et al (2018) INTEGRAL/SPI -ray line spectroscopy. Response and background characteristics. Astronomy & Astrophysics 611:A12. 10.1051/0004-6361/201731815, URL http://adsabs.harvard.edu/cgi-bin/nph-data_query?bibcode=2018A%26A...611A..12D&link_type=EJOURNAL
- Faherty et al (2007) Faherty J, Walter FM, Anderson J (2007) The trigonometric parallax of the neutron star Geminga 308:225–230. 10.1007/s10509-007-9368-0
- Ferrière et al (2007) Ferrière K, Gillard W, Jean P (2007) Spatial distribution of interstellar gas in the innermost 3 kpc of our galaxy. Astronomy and Astrophysics 467(2):611–627. 10.1051/0004-6361:20066992
- Ferrière (2001) Ferrière KM (2001) The interstellar environment of our galaxy. Reviews of Modern Physics 73:1031–1066. 10.1103/RevModPhys.73.1031
- Finkbeiner (2003) Finkbeiner DP (2003) A full-sky h-alpha template for microwave foreground prediction. The Astrophysical Journal Supplement Series 146(2):407–415. 10.1086/374411
- Finkbeiner and Weiner (2007) Finkbeiner DP, Weiner N (2007) Exciting dark matter and the INTEGRAL/SPI 511keV signal. Physical Review D 76(8):083,519. 10.1103/PhysRevD.76.083519, URL http://adsabs.harvard.edu/cgi-bin/nph-data_query?bibcode=2007PhRvD..76h3519F&link_type=EJOURNAL
- Fox et al (2015) Fox OD, Smith N, Ammons SM, et al (2015) What powers the 3000-day light curve of sn 2006gy? 10.48550/ARXIV.1509.06407
- Freudenreich (1998) Freudenreich HT (1998) A COBE Model of the Galactic Bar and Disk. The Astrophysical Journal 492(2):495–510. 10.1086/305065, URL https://iopscience.iop.org/article/10.1086/305065
- Gaensler et al (2008) Gaensler BM, Madsen GJ, Chatterjee S, et al (2008) The vertical structure of warm ionised gas in the milky way. Publications of the Astronomical Society of Australia 25(4):184–200. 10.1071/as08004
- Genzel et al (2003) Genzel R, Schödel R, Ott T, et al (2003) The Stellar Cusp around the Supermassive Black Hole in the Galactic Center 594:812–832
- Geringer-Sameth et al (2015) Geringer-Sameth A, Walker MG, Koushiappas SM, et al (2015) Indication of Gamma-Ray Emission from the Newly Discovered Dwarf Galaxy Reticulum II. Physical Review Letters 115(8):081,101. 10.1103/PhysRevLett.115.081101, URL http://arxiv.org/abs/1503.02320
- Ghez et al (2004) Ghez AM, Wright SA, Matthews K, et al (2004) Variable infrared emission from the supermassive black hole at the center of the milky way. The Astrophysical Journal 601(2):L159–L162. 10.1086/382024
- Goldwurm et al (1992) Goldwurm A, Ballet J, Cordier B, et al (1992) Sigma/GRANAT soft gamma-ray observations of the X-ray nova in Musca - Discovery of positron annihilation emission line 389:L79–L82. 10.1086/186353, URL http://dx.doi.org/10.1086/186353
- Gomez-Gomar et al (1998) Gomez-Gomar J, Hernanz M, José J, et al (1998) Gamma-ray emission from individual classical novae 296:913–920. 10.1046/j.1365-8711.1998.01421.x
- Guessoum et al (2005) Guessoum N, Jean P, Gillard W (2005) The lives and deaths of positrons in the interstellar medium. Astronomy & Astrophysics 436(1):171–185. 10.1051/0004-6361:20042454, URL http://adsabs.harvard.edu/cgi-bin/nph-data_query?bibcode=2005A%26A...436..171G&link_type=EJOURNAL
- Guessoum et al (2006) Guessoum N, Jean P, Prantzos N (2006) Microquasars as sources of positron annihilation radiation. Astronomy & Astrophysics 457(3):753–762. 10.1051/0004-6361:20065240, URL http://dx.doi.org/10.1051/0004-6361:20065240
- Guessoum et al (2010) Guessoum N, Jean P, Gillard W (2010) Positron annihilation on polycyclic aromatic hydrocarbon molecules in the interstellar medium. arXivorg 402:1171–1178. 10.1111/j.1365-2966.2009.15954.x, URL http://arxiv.org/abs/0911.0582
- Harris (2010) Harris WE (2010) A New Catalog of Globular Clusters in the Milky Way. ArXiv e-prints astro-ph.GA. URL http://arxiv.org/abs/1012.3224
- Harvey et al (2021) Harvey M, Rulten CB, Chadwick PM (2021) V404 cygni with fermi-LAT. Monthly Notices of the Royal Astronomical Society 506(4):6029–6038. 10.1093/mnras/stab2097
- Haslam et al (1981) Haslam CGT, Klein U, Salter CJ, et al (1981) A 408 MHz all-sky continuum survey. I - Observations at southern declinations and for the North Polar region 100:209–219
- Hawking (1971) Hawking S (1971) Gravitationally collapsed objects of very low mass. Monthly Notices of the Royal Astronomical Society 152:75–. 10.1093/mnras/152.1.75, URL http://adsabs.harvard.edu/cgi-bin/nph-data_query?bibcode=1971MNRAS.152...75H&link_type=EJOURNAL
- Hawking (1975) Hawking SW (1975) Particle creation by black holes. Communications In Mathematical Physics 43(3):199–220. 10.1007/BF02345020, URL http://adsabs.harvard.edu/cgi-bin/nph-data_query?bibcode=1975CMaPh..43..199H&link_type=EJOURNAL
- Haymes et al (1969) Haymes RC, Ellis DV, Fishman GJ, et al (1969) Observation of Hard Radiation from the Region of the Galactic Center 157:1455. 10.1086/150164
- Hernanz (2014) Hernanz M (2014) Gamma-ray Emission from Nova Outbursts. In: Woudt PA, Ribeiro VARM (eds) arXiv.org, p 319, URL http://arxiv.org/abs/1305.0769
- Hernanz and José (2006) Hernanz M, José J (2006) Radioactivities from novae 50:504–508. 10.1016/j.newar.2006.06.012
- Hernanz et al (2000) Hernanz M, Smith DM, Fishman J, et al (2000) BATSE observations of classical novae. In: THE FIFTH COMPTON SYMPOSIUM. AIP Conference Proceedings, Institute for Spatial Studies of Catalonia (IEEC/CSIC/UPC), Gran Capità 2-4, 08034 Barcelona (Spain). American Institute of PhysicsAIP, pp 82–86, 10.1063/1.1303179, URL http://adsabs.harvard.edu/cgi-bin/nph-data_query?bibcode=2000AIPC..510...82H&link_type=EJOURNAL
- Higdon et al (2009) Higdon JC, Lingenfelter RE, Rothschild RE (2009) The Galactic Positron Annihilation Radiation and the Propagation of Positrons in the Interstellar Medium. The Astrophysical Journal 698(1):350–379. 10.1088/0004-637X/698/1/350, URL http://adsabs.harvard.edu/cgi-bin/nph-data_query?bibcode=2009ApJ...698..350H&link_type=EJOURNAL
- Hooper et al (2004) Hooper D, Ferrer F, Boehm C, et al (2004) Possible Evidence for MeV Dark Matter in Dwarf Spheroidals. Physical Review Letters 93(16):161,302
- Iguaz et al (2021) Iguaz J, Serpico PD, Siegert T (2021) Isotropic X-ray bound on Primordial Black Hole Dark Matter. arXivorg p arXiv:2104.03145. URL http://adsabs.harvard.edu/abs/2021arXiv210403145I, https://arxiv.org/abs/2104.03145
- Iyudin et al (1997) Iyudin AF, Diehl R, Lichti GG, et al (1997) Cas A in the Light of the 44Ti 1. 15 MeV Gamma-Ray Line Emission. The Transparent Universe 382:37–37. URL http://adsabs.harvard.edu/abs/1997ESASP.382...37I
- Jean et al (2006) Jean P, Knoedlseder J, Gillard W, et al (2006) Spectral analysis of the Galactic e+e- annihilation emission. Astronomy & Astrophysics 445(2):579–589. 10.1051/0004-6361:20053765, URL https://www.aanda.org/articles/aa/abs/2006/02/aa3765-05/aa3765-05.html
- Jean et al (2009) Jean P, Gillard W, Marcowith A, et al (2009) Positron transport in the interstellar medium. Astronomy & Astrophysics 508(3):1099–1116. 10.1051/0004-6361/200809830, URL http://adsabs.harvard.edu/cgi-bin/nph-data_query?bibcode=2009A%26A...508.1099J&link_type=EJOURNAL
- Jerkstrand et al (2020) Jerkstrand A, Maeda K, Kawabata K (2020) A type ia supernova at the heart of superluminous transient sn 2006gy 10.48550/ARXIV.2002.10768
- José and Hernanz (1998) José J, Hernanz M (1998) Nucleosynthesis in Classical Novae: CO versus ONe White Dwarfs. The Astrophysical Journal 494(2):680–690. 10.1086/305244, URL https://iopscience.iop.org/article/10.1086/305244
- José et al (2001) José J, Hernanz M, Coc A (2001) Classical novae: sources of CNO-nuclei and gamma-ray emitters. Nuclear Physics A 688:118–121. 10.1016/S0375-9474(01)00680-7
- Jourdain et al (2017) Jourdain E, Roques JP, Rodi J (2017) A Challenging View of the 2015 Summer V404 Cyg Outburst at High Energy with INTEGRAL/SPI: The Finale. arXivorg 834:130. 10.3847/1538-4357/834/2/130, URL http://arxiv.org/abs/1611.02890
- Jungman et al (1996) Jungman G, Kamionkowski M, Griest K (1996) Supersymmetric dark matter 267:195–373. 10.1016/0370-1573(95)00058-5
- Kerp et al (2011) Kerp J, Winkel B, Ben Bekhti N, et al (2011) The Effelsberg Bonn H I Survey (EBHIS). Astronomische Nachrichten 332:637. 10.1002/asna.201011548, URL http://arxiv.org/abs/1104.1185
- Knödlseder (1999) Knödlseder J (1999) Implications of 1.8 MeV Gamma-Ray Observations for the Origin of 26Al. The Astrophysical Journal 510(2):915–929. 10.1086/306601, URL http://adsabs.harvard.edu/cgi-bin/nph-data_query?bibcode=1999ApJ...510..915K&link_type=EJOURNAL
- Knoedlseder et al (2005) Knoedlseder J, Jean P, Lonjou V, et al (2005) The all-sky distribution of 511 keV electron-positron annihilation emission. Astronomy & Astrophysics 441(2):513–532. 10.1051/0004-6361:20042063, URL https://www.aanda.org/articles/aa/abs/2005/38/aa2063-04/aa2063-04.html
- Kopp (2013) Kopp J (2013) Constraints on dark matter annihilation from AMS-02 results. Physical Review D 88(7):076,013. 10.1103/physrevd.88.076013
- Krause et al (2013) Krause M, Fierlinger K, Diehl R, et al (2013) Feedback by massive stars and the emergence of superbubbles. I. Energy efficiency and Vishniac instabilities. arXivorg 550:A49. 10.1051/0004-6361/201220060, URL https://www.aanda.org/articles/aa/abs/2013/02/aa20060-12/aa20060-12.html
- Krause et al (2015) Krause MGH, Diehl R, Bagetakos Y, et al (2015) 26Al kinematics: superbubbles following the spiral arms?. Constraints from the statistics of star clusters and HI supershells. Astronomy & Astrophysics 578:A113. 10.1051/0004-6361/201525847, URL http://adsabs.harvard.edu/cgi-bin/nph-data_query?bibcode=2015A%26A...578A.113K&link_type=EJOURNAL
- Krause et al (2021) Krause MGH, Rodgers-Lee D, Dale JE, et al (2021) Galactic 26Al traces metal loss through hot chimneys. Monthly Notices of the Royal Astronomical Society 501(1):210–218. 10.1093/mnras/staa3612, URL http://adsabs.harvard.edu/cgi-bin/nph-data_query?bibcode=2021MNRAS.501..210K&link_type=EJOURNAL
- Laha et al (2020) Laha R, Muñoz JB, Slatyer TR (2020) I N T E G R A L constraints on primordial black holes and particle dark matter. Physical Review D 101(1):123,514. 10.1103/PhysRevD.101.123514, URL http://adsabs.harvard.edu/cgi-bin/nph-data_query?bibcode=2020PhRvD.101l3514L&link_type=EJOURNAL
- Launhardt et al (2002) Launhardt R, Zylka R, Mezger PG (2002) The nuclear bulge of the Galaxy. III. Large-scale physical characteristics of stars and interstellar matter. Astronomy & Astrophysics 384(1):112–139. 10.1051/0004-6361:20020017, URL http://adsabs.harvard.edu/cgi-bin/nph-data_query?bibcode=2002A%26A...384..112L&link_type=EJOURNAL
- Leung and Siegert (2022) Leung SC, Siegert T (2022) Gamma-ray light curves and spectra of classical novae. MNRAS 516(1):1008–1021. 10.1093/mnras/stac1672, URL https://ui.adsabs.harvard.edu/abs/2022MNRAS.516.1008L, https://arxiv.org/abs/arXiv:2112.06893 [astro-ph.HE]
- Leventhal et al (1978) Leventhal M, MacCallum CJ, Stang PD (1978) Detection of 511 keV positron annihilation radiation from the galactic center direction. Astrophysical Journal 225:L11–L14. 10.1086/182782, URL http://adsabs.harvard.edu/abs/1978ApJ...225L..11L
- Lightman and Zdziarski (1987) Lightman AP, Zdziarski AA (1987) Pair production and Compton scattering in compact sources and comparison to observations of active galactic nuclei 319:643–661. 10.1086/165485
- Lin et al (2002) Lin RP, Dennis BR, Hurford GJ, et al (2002) The reuven ramaty high-energy solar spectroscopic imager (rhessi) 210(1):3–32. 10.1023/A:1022428818870, URL https://ui.adsabs.harvard.edu/abs/2002SoPh..210....3L
- Lingenfelter and Ramaty (1989) Lingenfelter RE, Ramaty R (1989) The nature of the annihilation radiation and gamma-ray continuum from the Galactic center region. Astrophysical Journal 343:686–695. 10.1086/167740, URL http://adsabs.harvard.edu/doi/10.1086/167740
- Maciolek-Niedzwiecki et al (1995) Maciolek-Niedzwiecki A, Zdziarski AA, Coppi PS (1995) Electron / Positron Pair Production and Annihilation Spectral Features from Compact Sources 276:273. 10.1093/mnras/276.1.273
- Martin and Vink (2008) Martin P, Vink J (2008) Linking 44Ti explosive nucleosynthesis to the dynamics of core-collapse supernovae 52:401–404
- Martin et al (2012) Martin P, Strong AW, Jean P, et al (2012) Galactic annihilation emission from nucleosynthesis positrons. Astronomy & Astrophysics 543:A3. 10.1051/0004-6361/201118721, URL http://adsabs.harvard.edu/cgi-bin/nph-data_query?bibcode=2012A%26A...543A...3M&link_type=EJOURNAL
- Maximon and Olsen (1962) Maximon LC, Olsen H (1962) Measurement of Linear Photon Polarization by Pair Production. Phys Rev 126(1):310. 10.1103/PhysRev.126.310, URL https://journals.aps.org/pr/abstract/10.1103/PhysRev.126.310
- Milne et al (1999) Milne PA, The LS, Leising MD (1999) Positron Escape from Type IA Supernovae 124:503–526. 10.1086/313262
- Morris and Serabyn (1996) Morris M, Serabyn E (1996) The Galactic Center Environment 34:645–702. 10.1146/annurev.astro.34.1.645
- Moskalenko and Porter (2007) Moskalenko IV, Porter TA (2007) The Gamma-Ray Albedo of the Moon. The Astrophysical Journal 670(2):1467–1472. 10.1086/522828, URL http://adsabs.harvard.edu/cgi-bin/nph-data_query?bibcode=2007ApJ...670.1467M&link_type=EJOURNAL
- Moskalenko and Strong (1998) Moskalenko IV, Strong AW (1998) Production and Propagation of Cosmic-Ray Positrons and Electrons 493:694–707. 10.1086/305152
- Moskalenko et al (2008) Moskalenko IV, Porter TA, Digel SW, et al (2008) A Celestial Gamma-Ray Foreground Due to the Albedo of Small Solar System Bodies and a Remote Probe of the Interstellar Cosmic-Ray Spectrum. The Astrophysical Journal 681(2):1708–1716. 10.1086/588425, URL http://adsabs.harvard.edu/cgi-bin/nph-data_query?bibcode=2008ApJ...681.1708M&link_type=EJOURNAL
- Murphy et al (1987) Murphy RJ, Dermer CD, Ramaty R (1987) High-energy processes in solar flares. The Astrophysical Journal Supplement Series 63:721. 10.1086/191180
- Murphy et al (2005) Murphy RJ, Share GH, Skibo JG, et al (2005) The Physics of Positron Annihilation in the Solar Atmosphere. The Astrophysical Journal Supplement Series 161(2):495–519. 10.1086/452634, URL https://iopscience.iop.org/article/10.1086/452634
- Murphy et al (2014) Murphy RJ, Kozlovsky B, Share GH (2014) Radioactive Positron Emitter Production by Energetic Alpha Particles in Solar Flares. The Astrophysical Journal Supplement 215(2):18. 10.1088/0067-0049/215/2/18, URL http://adsabs.harvard.edu/cgi-bin/nph-data_query?bibcode=2014ApJS..215...18M&link_type=EJOURNAL
- and N. Aghanim et al (2016) and N. Aghanim, Ashdown M, Aumont J, et al (2016) Planck intermediate resultsxlviii. disentangling galactic dust emission and cosmic infrared background anisotropies. Astronomy and Astrophysics 596:A109. 10.1051/0004-6361/201629022
- Ng et al (2019) Ng KCY, Roach BM, Perez K, et al (2019) New constraints on sterile neutrino dark matter from NuSTAR M31 observations. Physical Review D 99(8):083,005. 10.1103/PhysRevD.99.083005, URL http://adsabs.harvard.edu/cgi-bin/nph-data_query?bibcode=2019PhRvD..99h3005N&link_type=EJOURNAL
- Ore and Powell (1949) Ore A, Powell JL (1949) Three-Photon Annihilation of an Electron-Positron Pair. Physical Review 75:1696–1699. 10.1103/PhysRev.75.1696
- Panther (2018) Panther F (2018) Positron Transport and Annihilation in the Galactic Bulge. Galaxies 6:39. 10.3390/galaxies6020039, URL http://arxiv.org/abs/1801.09365
- Panther et al (2018a) Panther FH, Crocker RM, Birnboim Y, et al (2018a) Positron annihilation in the nuclear outflows of the Milky Way. Monthly Notices of the Royal Astronomical Society: Letters 474(1):L17–L21. 10.1093/mnrasl/slx183, URL http://adsabs.harvard.edu/cgi-bin/nph-data_query?bibcode=2018MNRAS.474L..17P&link_type=EJOURNAL
- Panther et al (2018b) Panther FH, Seitenzahl IR, Crocker RM, et al (2018b) Effect of positron-alkali metal atom interactions in the diffuse interstellar medium. Physical Review D 98(2):023,015. 10.1103/PhysRevD.98.023015, URL http://adsabs.harvard.edu/cgi-bin/nph-data_query?bibcode=2018PhRvD..98b3015P&link_type=EJOURNAL
- Panther et al (2021) Panther FH, Seitenzahl IR, Ruiter AJ, et al (2021) Prospects of direct detection of 48v gamma-rays from thermonuclear supernovae. Monthly Notices of the Royal Astronomical Society 508(2):1590–1598. 10.1093/mnras/stab2701
- Peplowski (2016) Peplowski PN (2016) The global elemental composition of 433 eros: First results from the NEAR gamma-ray spectrometer orbital dataset. Planetary and Space Science 134:36–51. 10.1016/j.pss.2016.10.006
- Planck Collaboration et al (2016) Planck Collaboration, Adam R, Ade PAR, et al (2016) Planck 2015 results. X. Diffuse component separation: Foreground maps. arXivorg 594:A10. 10.1051/0004-6361/201525967, URL http://arxiv.org/abs/1502.01588
- Pleintinger (2020) Pleintinger MMM (2020) Star Groups and their Nucleosynthesis. PhD Dissertation URL http://adsabs.harvard.edu/cgi-bin/nph-data_query?bibcode=2020PhDT........13P&link_type=EJOURNAL
- Pleintinger et al (2019) Pleintinger MMM, Siegert T, Diehl R, et al (2019) Comparing simulated 26Al maps to gamma-ray measurements. Astronomy & Astrophysics 632:A73. 10.1051/0004-6361/201935911, URL http://adsabs.harvard.edu/cgi-bin/nph-data_query?bibcode=2019A%26A...632A..73P&link_type=EJOURNAL
- Portegies Zwart et al (1997) Portegies Zwart SF, Verbunt F, Ergma E (1997) The formation of black-holes in low-mass X-ray binaries. 321:207–212
- Porter et al (2008) Porter TA, Moskalenko IV, Strong AW, et al (2008) Inverse Compton Origin of the Hard X-Ray and Soft Gamma-Ray Emission from the Galactic Ridge. arXivorg 682(1):400–407. 10.1086/589615, URL http://arxiv.org/abs/0804.1774
- Prantzos (2004) Prantzos N (2004) Astrophysical Gamma-Ray Lines: A Probe of Stellar Nucleosynthesis and Star Formation. In: Schoenfelder V, Lichti G, Winkler C (eds) 5th INTEGRAL Workshop on the INTEGRAL Universe, p 15
- Prantzos (2006) Prantzos N (2006) On the intensity and spatial morphology of the 511 keV emission in the Milky Way. Astronomy & Astrophysics 449(3):869–878. 10.1051/0004-6361:20052811, URL https://www.aanda.org/articles/aa/abs/2006/15/aa2811-05/aa2811-05.html
- Prantzos et al (2011) Prantzos N, Boehm C, Bykov AM, et al (2011) The 511 keV emission from positron annihilation in the Galaxy. Reviews of Modern Physics 83(3):1001–1056. 10.1103/RevModPhys.83.1001, URL https://journals.aps.org/rmp/abstract/10.1103/RevModPhys.83.1001
- Purcell et al (1997) Purcell WR, Cheng LX, Dixon DD, et al (1997) OSSE Mapping of Galactic 511 keV Positron Annihilation Line Emission. The Astrophysical Journal 491(2):725–748. 10.1086/304994, URL http://adsabs.harvard.edu/cgi-bin/nph-data_query?bibcode=1997ApJ...491..725P&link_type=EJOURNAL
- Quataert (2004) Quataert E (2004) A Dynamical Model for Hot Gas in the Galactic Center 613:322–325. 10.1086/422973
- Renaud et al (2006) Renaud M, Vink J, Decourchelle A, et al (2006) The Signature of 44Ti in Cassiopeia A Revealed by IBIS/ISGRI on INTEGRAL 647:L41–L44
- Rodriguez et al (2015) Rodriguez J, Cadolle Bel M, Alfonso-Garzón J, et al (2015) Correlated optical, X-ray, and -ray flaring activity seen with INTEGRAL during the 2015 outburst of V404 Cygni. arXivorg 581:L9. 10.1051/0004-6361/201527043, URL http://arxiv.org/abs/1507.06659
- Romani (1992) Romani RW (1992) Populations of low-mass black hole binaries 399:621–626. 10.1086/171953
- Roques et al (2015) Roques JP, Jourdain E, Bazzano A, et al (2015) First INTEGRAL Observations of V404 Cygni during the 2015 Outburst: Spectral Behavior in the 20-650 keV Energy Range. arXivorg 813:L22. 10.1088/2041-8205/813/1/L22, URL http://arxiv.org/abs/1510.03677
- Rothschild (2009) Rothschild RE (2009) Positron propogation and the INTEGRAL/SPI 511 keV bulge/disk ratio. In: Proceedings of 7th INTEGRAL Workshop — PoS(Integral08). Sissa Medialab, 10.22323/1.067.0028
- Saxena et al (2011) Saxena S, Summa A, Elsässer D, et al (2011) Constraints on dark matter annihilation from m87: Signatures of prompt and inverse-compton gamma rays 10.1140/epjc/s10052-011-1815-y, https://arxiv.org/abs/arXiv:1111.3868 [astro-ph.HE]
- Seaton (1959) Seaton MJ (1959) Radiative recombination of hydrogenic ions 119:81. 10.1093/mnras/119.2.81
- Seitenzahl et al (2014) Seitenzahl IR, Timmes FX, Magkotsios G (2014) The Light Curve of SN 1987A Revisited: Constraining Production Masses of Radioactive Nuclides. arXivorg 792:10. URL http://arxiv.org/abs/1408.5986
- Serpico (2011) Serpico PD (2011) Astrophysical models for the origin of the positron "excess" 10.1016/j.astropartphys.2011.08.007, https://arxiv.org/abs/arXiv:1108.4827 [astro-ph.HE]
- Shafter (2017) Shafter AW (2017) The Galactic Nova Rate Revisited. arXivorg 834(2):196. 10.3847/1538-4357/834/2/196, URL http://arxiv.org/abs/1606.02358
- Share et al (2004) Share GH, Murphy RJ, Smith DM, et al (2004) RHESSI e+-e- Annihilation Radiation Observations: Implications for Conditions in the Flaring Solar Chromosphere 615:L169–L172. 10.1086/426478
- Shibayama et al (2013) Shibayama T, Maehara H, Notsu S, et al (2013) Superflares on Solar-type Stars Observed with Kepler. I. Statistical Properties of Superflares. The Astrophysical Journal Supplement 209(1):5. 10.1088/0067-0049/209/1/5, URL http://adsabs.harvard.edu/cgi-bin/nph-data_query?bibcode=2013ApJS..209....5S&link_type=EJOURNAL
- Siegert (2017) Siegert T (2017) Positron-Annihilation Spectroscopy throughout the Milky Way. PhD thesis, Technische Universität München, Published online at https://mediatum.ub.tum.de/node?id=1340342
- Siegert et al (2015) Siegert T, Diehl R, Krause MGH, et al (2015) Revisiting INTEGRAL/SPI observations of 44Ti from Cassiopeia A. Astronomy & Astrophysics 579:A124. 10.1051/0004-6361/201525877, URL http://adsabs.harvard.edu/cgi-bin/nph-data_query?bibcode=2015A%26A...579A.124S&link_type=EJOURNAL
- Siegert et al (2016a) Siegert T, Diehl R, Greiner J, et al (2016a) Positron annihilation signatures associated with the outburst of the microquasar V404 Cygni. Nature 531(7):341–343. 10.1038/nature16978, URL http://adsabs.harvard.edu/cgi-bin/nph-data_query?bibcode=2016Natur.531..341S&link_type=EJOURNAL
- Siegert et al (2016b) Siegert T, Diehl R, Khachatryan G, et al (2016b) Gamma-ray spectroscopy of positron annihilation in the Milky Way. Astronomy & Astrophysics 586:A84. 10.1051/0004-6361/201527510, URL http://adsabs.harvard.edu/cgi-bin/nph-data_query?bibcode=2016A%26A...586A..84S&link_type=EJOURNAL
- Siegert et al (2016c) Siegert T, Diehl R, Vincent AC, et al (2016c) Search for 511 keV emission in satellite galaxies of the Milky Way with INTEGRAL/SPI. Astronomy & Astrophysics 595:A25. 10.1051/0004-6361/201629136, URL http://adsabs.harvard.edu/cgi-bin/nph-data_query?bibcode=2016A%26A...595A..25S&link_type=EJOURNAL
- Siegert et al (2019a) Siegert T, Crocker RM, Diehl R, et al (2019a) Constraints on positron annihilation kinematics in the inner Galaxy. Astronomy & Astrophysics 627:A126. 10.1051/0004-6361/201833856, URL http://adsabs.harvard.edu/cgi-bin/nph-data_query?bibcode=2019A%26A...627A.126S&link_type=EJOURNAL
- Siegert et al (2019b) Siegert T, Diehl R, Weinberger C, et al (2019b) Background modelling for -ray spectroscopy with INTEGRAL/SPI. Astronomy & Astrophysics 626:A73. 10.1051/0004-6361/201834920, URL http://adsabs.harvard.edu/cgi-bin/nph-data_query?bibcode=2019A%26A...626A..73S&link_type=EJOURNAL
- Siegert et al (2021a) Siegert T, Boehm C, Calore F, et al (2021a) Reticulum II: Particle Dark Matter and Primordial Black Holes Limits. arXivorg p arXiv:2109.03791. URL http://adsabs.harvard.edu/abs/2021arXiv210903791S, https://arxiv.org/abs/2109.03791
- Siegert et al (2021b) Siegert T, Crocker RM, Macias O, et al (2021b) Measuring the smearing of the Galactic 511 keV signal: positron propagation or supernova kicks? arXivorg p arXiv:2109.03691. 10.1093/mnrasl/slab113, URL http://adsabs.harvard.edu/abs/2021arXiv210903691S, https://arxiv.org/abs/arXiv:2109.03691 [astro-ph.HE]
- Siegert et al (2021c) Siegert T, Ghosh S, Mathur K, et al (2021c) Nucleosynthesis constraints through -ray line measurements from classical novae. arXivorg p arXiv:2104.00363. URL http://adsabs.harvard.edu/abs/2021arXiv210400363S, https://arxiv.org/abs/2104.00363
- Siegert et al (2022a) Siegert T, Berteaud J, Calore F, et al (2022a) Diffuse Galactic emission spectrum between 0.5 and 8.0 MeV. arXivorg p arXiv:2202.04574. URL http://adsabs.harvard.edu/abs/2022arXiv220204574S, https://arxiv.org/abs/2202.04574
- Siegert et al (2022b) Siegert T, Boehm C, Calore F, et al (2022b) An integral/spi view of reticulum ii: particle dark matter and primordial black holes limits in the mev range. MNRAS 511(1):914–924. 10.1093/mnras/stac008, URL https://ui.adsabs.harvard.edu/abs/2022MNRAS.511..914S, https://arxiv.org/abs/arXiv:2109.03791 [astro-ph.HE]
- Siegert et al (2022c) Siegert T, Crocker RM, Macias O, et al (2022c) Measuring the smearing of the Galactic 511-keV signal: positron propagation or supernova kicks? MNRAS 509(1):L11–L16. 10.1093/mnrasl/slab113, URL http://adsabs.harvard.edu/cgi-bin/nph-data_query?bibcode=2022MNRAS.509L..11S&link_type=EJOURNAL
- Siegert et al (2022d) Siegert T, Horan D, Kanbach G (2022d) Telescope concepts in gamma-ray astronomy arXiv:2207.02248. URL https://ui.adsabs.harvard.edu/abs/2022arXiv220702248S, https://arxiv.org/abs/2207.02248
- Sizun et al (2006) Sizun P, Cassé M, Schanne S (2006) Continuum -ray emission from light dark matter positrons and electrons. Phys Rev D 74(6):063,514. 10.1103/PhysRevD.74.063514, URL https://journals.aps.org/prd/abstract/10.1103/PhysRevD.74.063514
- Skinner et al (2014) Skinner G, Diehl R, Zhang X, et al (2014) The Galactic distribution of the 511 keV e+/e- annihilation radiation. In: Proceedings of the 10th INTEGRAL Workshop: ”A Synergistic View of the High-Energy Sky” (INTEGRAL 2014). 15-19 September 2014. Annapolis, MD, USA. Published online at http://pos.sissa.it/cgi-bin/reader/conf.cgi?confid=228, id.054, p 054
- Slatyer (2016) Slatyer TR (2016) Indirect dark matter signatures in the cosmic dark ages. I. Generalizing the bound on s -wave dark matter annihilation from Planck results. Physical Review D 93(2):023,527. 10.1103/PhysRevD.93.023527, URL http://adsabs.harvard.edu/cgi-bin/nph-data_query?bibcode=2016PhRvD..93b3527S&link_type=EJOURNAL
- Smith et al (2007) Smith N, Li W, Foley RJ, et al (2007) SN 2006gy: Discovery of the Most Luminous Supernova Ever Recorded, Powered by the Death of an Extremely Massive Star like Carinae 666:1116–1128. 10.1086/519949
- Stritzinger et al (2006) Stritzinger M, Leibundgut B, Walch S, et al (2006) Constraints on the progenitor systems of type Ia supernovae 450:241–251
- Strong et al (2007) Strong AW, Moskalenko IV, Ptuskin VS (2007) Cosmic-Ray Propagation and Interactions in the Galaxy. Annual Review of Nuclear and Particle Science 57(1):285–327. 10.1146/annurev.nucl.57.090506.123011, URL http://adsabs.harvard.edu/cgi-bin/nph-data_query?bibcode=2007ARNPS..57..285S&link_type=EJOURNAL
- Su et al (2010) Su M, Slatyer TR, Finkbeiner DP (2010) Giant Gamma-ray Bubbles from Fermi-LAT: Active Galactic Nucleus Activity or Bipolar Galactic Wind? The Astrophysical Journal 724(2):1044–1082. 10.1088/0004-637X/724/2/1044, URL http://adsabs.harvard.edu/cgi-bin/nph-data_query?bibcode=2010ApJ...724.1044S&link_type=EJOURNAL
- Sunyaev et al (1991) Sunyaev R, Churazov E, Gilfanov M, et al (1991) Three spectral states of 1E 1740.7 - 2942 - From standard Cygnus X-1 type spectrum to the evidence of electron-positron annihilation feature 383:L49–L52. 10.1086/186238, URL http://adsabs.harvard.edu/doi/10.1086/186238
- Svensson (1982a) Svensson R (1982a) Electron-positron pair equilibria in relativistic plasmas. ApJ 258:335. 10.1086/160082, URL https://ui.adsabs.harvard.edu/abs/1982ApJ...258..335S
- Svensson (1982b) Svensson R (1982b) The pair annihilation process in relativistic plasmas. ApJ 258:321–334. 10.1086/160081, URL http://adsabs.harvard.edu/doi/10.1086/160081
- Svensson (1983) Svensson R (1983) The thermal pair annihilation spectrum - A detailed balance approach 270:300–304. 10.1086/161122, URL http://adsabs.harvard.edu/doi/10.1086/161122
- Svensson (1987) Svensson R (1987) Non-thermal pair production in compact X-ray sources - First-order Compton cascades in soft radiation fields 227:403–451. 10.1093/mnras/227.2.403
- Tomsick et al (2019) Tomsick JA, Zoglauer A, Sleator C, et al (2019) The Compton Spectrometer and Imager. arXivorg p arXiv:1908.04334. URL http://adsabs.harvard.edu/abs/2019arXiv190804334T
- Totani et al (2006) Totani T, Oda T, Sumi T, et al (2006) Rapid Variability of Serendipitously Discovered Very Low-Luminosity AGNs and Implications for Accretion Disk Theory. In: Gaskell CM, McHardy IM, Peterson BM, et al (eds) Astronomical Society of the Pacific Conference Series, p 55
- Türler et al (2010) Türler M, Chernyakova M, Courvoisier TJL, et al (2010) INTEGRAL hard X-ray spectra of the cosmic X-ray background and Galactic ridge emission. Astronomy & Astrophysics 512:A49. 10.1051/0004-6361/200913072, URL http://adsabs.harvard.edu/cgi-bin/nph-data_query?bibcode=2010A%26A...512A..49T&link_type=EJOURNAL
- Vedrenne et al (2003) Vedrenne G, Roques JP, Schönfelder V, et al (2003) SPI: The spectrometer aboard INTEGRAL. Astronomy & Astrophysics 411(1):L63–L70. 10.1051/0004-6361:20031482, URL http://adsabs.harvard.edu/cgi-bin/nph-data_query?bibcode=2003A%26A...411L..63V&link_type=EJOURNAL
- Weaver et al (1977) Weaver R, McCray R, Castor J, et al (1977) Interstellar bubbles. II - Structure and evolution 218:377–395. 10.1086/155692
- Weidenspointner et al (200) Weidenspointner G, Jean P, Knödelseder J, et al (200) New Clues to the Origin of Galactic Positrons. In: Barret D, Casoli F, Lagache G, et al (eds) SF2A-2006: Semaine de l’Astrophysique Francaise, pp 213—-
- Weidenspointner et al (2008) Weidenspointner G, Skinner G, Jean P, et al (2008) An asymmetric distribution of positrons in the Galactic disk revealed by -rays. Nature 451(7):159–162. 10.1038/nature06490, URL http://adsabs.harvard.edu/cgi-bin/nph-data_query?bibcode=2008Natur.451..159W&link_type=EJOURNAL
- Weinberger et al (2020) Weinberger C, Diehl R, Pleintinger MMM, et al (2020) 44Ti ejecta in young supernova remnants. Astronomy & Astrophysics 638:A83. 10.1051/0004-6361/202037536, URL http://adsabs.harvard.edu/cgi-bin/nph-data_query?bibcode=2020A%26A...638A..83W&link_type=EJOURNAL
- Winkler et al (2003) Winkler C, Courvoisier TJL, Di Cocco G, et al (2003) The INTEGRAL mission. Astronomy & Astrophysics 411(1):L1–L6. 10.1051/0004-6361:20031288, URL https://www.aanda.org/articles/aa/abs/2003/43/aaINTEGRAL9/aaINTEGRAL9.html
- Yin et al (2013) Yin PF, Yu ZH, Yuan Q, et al (2013) Pulsar interpretation for the AMS-02 result. arXivorg 88(2):023,001. 10.1103/PhysRevD.88.023001, URL http://arxiv.org/abs/1304.4128
- Zhang and Cheng (1997) Zhang L, Cheng KS (1997) High-Energy Radiation from Rapidly Spinning Pulsars with Thick Outer Gaps 487:370–379