EFFECTIVE TEMPERATURE ESTIMATIONS FROM LINE DEPTH RATIOS IN THE H AND K-BAND SPECTRA OF IGRINS
Abstract
Determining accurate effective temperatures of stars buried in the dust-obscured Galactic regions is extremely difficult from photometry. Fortunately, high-resolution infrared spectroscopy is a powerful tool for determining the temperatures of stars with no dependence on interstellar extinction. It has long been known that the depth ratios of temperature-sensitive and relatively insensitive spectral lines are excellent temperature indices. In this work, we provide the first extensive line depth ratio (LDR) method application in the infrared region that encompasses both H and K bands (1.48 2.48 ). We applied the LDR method to high-resolution (R 45,000) H and K-band spectra of 110 stars obtained with the Immersion Grating Infrared Spectrograph (IGRINS). Our sample contained stars with 3200 (K) 5500, 0.20 log g 4.6, and 1.5 [M/H] 0.5. Application of this method in the K-band yielded 21 new LDR relations. We also report five new LDR relations found in the H-band region, augmenting the relations already published by other groups. The temperatures found from our calibrations provide reliable temperatures within 70 K accuracy compared to spectral values from the literature.
1 INTRODUCTION
The effective temperature () is of fundamental importance among stellar atmospheric parameters. Knowing the temperature enables assessment of the mass, age and surface gravity of stars, as well as estimation of their evolutionary status and detailed chemical abundances. There are several methods that can be applied for temperature estimation. If radius and absolute luminosity are known for a star then its effective temperature can be directly calculated. The shortcoming of this method is that it can only be applied to nearby stars, and for more distant stars other methods are required. For example calibrated photometric data can be applied to achieve accurate information (e.g. Alonso et al. 1996; Bessell et al. 1998; Ramírez & Meléndez 2005; Masana et al. 2006; Mucciarelli et al. 2021, though reliable color excess values are needed for robust results.
Several alternative methods that have been used for decades in stellar determinations are based on high resolution spectra. Since stellar absorption lines are not affected by interstellar extinction (or reddening), values determined from spectroscopic methods are insensitive to photometric modelling choices, in particular to assumed extinction/reddening parameters. A popular technique requires the absence of any correlation between the abundances obtained from Fe i lines and their excitation potential values. Such analyses often must take into account possible deviations from local thermodynamic equilibrium (LTE), and they depend on the use of reliable oscillator strengths and damping coefficients. Balmer lines also become important indicators for stars cooler than 8000 K because they are almost insensitive to surface gravity in these stars (Gray 2005; Heiter et al. 2002). This method involves the comparison of observed Balmer lines with the theoretical hydrogen absorption line profiles. Correlations between observed and synthetic spectra (e.g. Cayrel et al. 1991; Prugniel et al. 2011) can also be used for determination.
Line-strength ratios of absorption lines have long been used for stellar temperature estimates especially in spectral classification efforts. Gray & Johanson (1991) first proposed quantitative application of line depth ratios (LDRs) for accurate derivation from optical region spectroscopy. This technique relies on the central depth ratio of carefully selected absorption lines that have significantly different responses to . This method is based on the fact that absorption lines with low and high excitation potential (hereafter, E.P.) levels respond differently to the temperature changes. Spectral lines with high E.P. are less responsive to the change in compared to those with low E.P. Therefore, the ratio of line depths is a good temperature indicator, which makes the LDR method an attractive option for determination whenever it is applicable. Other parameters such as metallicity, surface gravity, micro- and macro-turbulence also affect the line strengths, but here one seeks line pairs where temperature sensitivity dominates over other atmospheric parameters. Moreover, taking the ratio of line depths comes with the potential advantage of muting dependencies on atmospheric parameters that affect the absorption lines in the same way.
Gray & Johanson (1991) applied the LDR method just to one atomic line pair, 6251.8 and 6252.6, for 49 dwarf stars. Since then LDR studies have expanded the technique to include other stellar classes and other spectral features. Sasselov & Lester 1990 compared C i and Si i lines near 1m in Cepheids and other cool giants. Gray (1994) increased the 6200 Å region list to 10 line pairs and investigated metallicity corrections for main sequence stars, and later Gray & Brown (2001) provided LDRs for red giants. A series of studies extending LDR method in wavelength region on luminosity class was published by Kovtyukh & Gorlova (2000); Kovtyukh et al. (2003, 2006); Kovtyukh (2007). LDRs applicable to a 3200-7500 K temperature range for evolved stars were derived by Strassmeier & Schordan (2000). Finally Biazzo et al. (2007) examined optical LDRs in detail, providing quantitative assessments of luminosity/gravity effects and the influence on rotational line broadening on various LDR ratios.
However, highly reddened objects suffer from significant interstellar dust extinction, often making them inaccessible in the optical region for high resolution spectroscopic studies. Therefore to obtain any information from the objects that are positioned, for example, towards the Galactic center or bulge, the only option is to collect data at longer wavelengths, 1m. High-resolution infrared spectroscopy is the ideal tool for accessing important stellar atmospheric information from heavily obscured regions. Recent studies suggest that reliable atmospheric parameters of stars can be derived from high-resolution infrared spectral data without any help from the optical region (Özdemir et al. and Garro et al., in preparation).
A determination method of increasing importance in near-IR high resolution spectroscopy involves LDRs. Recently, Fukue et al. (2015) applied the LDR method to the H-band (1.41.8 ) spectral region for the first time in order to measure more robust effective temperatures of highly reddened stars. They obtained high resolution (R = 20,000) spectra of 10 well-known G and K giants/supergiants (4000 (K) 6000) with Subaru/infrared camera and spectrograph. They found nine LDR pairs of absorption lines and determined values of these stars with an accuracy of 60 K. Later, Taniguchi et al. (2018) found 81 LDR relations using the -band (0.90 1.35 ) spectra (R = 28,000) of nine giant stars from G to M type (3700 (K) 5400) obtained with the WINERED spectrograph attached to the 1.3m Araki Telescope.
Recently, Jian et al. (2019) investigated the effects of metallicity and element abundances on line depths from 11 LDR pairs (seven from Fukue et al. 2015) using the H-band spectra (R = 22,500) of thousands of giant stars from the Apache Point Observatory Galactic Evolution Experiment (APOGEE) database (Majewski et al. 2017). Their incorporation of abundance-related terms to the LDR relations resulted in about 3090 K scatter in temperature determination for stars of 3700 (K) 5000 and 0.7 [Fe/H] 0.4 dex. López-Valdivia et al. (2019) used the line depths of Fe i and Al i absorption lines and the molecular OH lines to determine the temperature of 254 K and M dwarfs from the high-resolution H-band spectra obtained with the Immersion Grating Infrared Spectrograph (IGRINS; Yuk et al. 2010; Park et al. 2014).
In this work, we extend LDR studies to a wider wavelength range and investigate the LDR relations in both H- and K-band, using the high-resolution (R 45,000) spectra of 110 stars obtained with the IGRINS. To the best of our knowledge, this is the first study in the literature to use high resolution K band spectra for LDR analyses.
2 OBSERVATIONS AND STELLAR SAMPLE
High-resolution (R 45,000), high signal-to-noise ( 100) spectral data of 110 stars were obtained with IGRINS on the 2.7m Harlan J. Smith Telescope (McDonald Observatory, Texas) and 4.3m Lowell Discovery Telescope (Lowell Observatory, Arizona) between the years of 20142018. The data were reduced using the IGRINS pipeline package version 2.2 (Lee & Gullikson, 2016). IGRINS covers the H and K bands (1.48 2.48 ), simultaneously, with a small gap of about 100 Å between bands. Details of the data reduction process can be found in, e.g., Afşar et al. (2016) and Park et al. (2018).
About 70% of our sample (Table 1) consists of red horizontal branch stars (RHBs, also known as secondary red clump stars) listed in Afşar et al. (2018). The rest of the sample was selected from the IGRINS Spectral Library (Park et al., 2018) mainly to expand the temperature range of our sample, but the selection of these low temperature stars also extended the surface gravity edges from about 0.2 up to 4.6. Figures 1 shows a Kiel diagram containing the positions of our sample (black dots) along with the stars from APOGEE DR17 (grey dots; Abdurro’uf et al. 2022). The Afşar et al. (2018) sample was assembled to investigate the properties of G-K evolved stars warmer than the red giant clump. This accounts for the appearance of stars in Figures 1 with 5000 K and log g 2 that lie apart from most of the APOGEE sample. The APOGEE DR17 data used for this diagram contains about 47000 stars with S/N 400. The cross-match of our sample with APOGEE DR17 data yielded only 11 stars in common. Overall, the stars in our study have temperature, log g and metallicity ranges of 3200 (K) 5500, 0.20 log g 4.6, and 1.5 [M/H] 0.5, as listed in Table 1.
3 SPECTRAL LINE IDENTIFICATION
The LDR method is fundamentally based on the depth-ratio of metallic absorption lines with different E.P. values. As is well known (e.g. Gray & Johanson 1991; Kovtyukh et al. 2003; Fukue et al. 2015 and references therein), lines with low E.P. are more responsive to change in temperature than the ones with high E.P. Therefore, different line pairs with low- and high E.P. values are needed to establish the LDR- relations. To find the useful LDR line pairs, we first carried out an atomic line identification process. We carefully examined the whole spectral region by segregating into wavelength intervals of 10 to 50 Å. For each small interval we generated a synthetic spectrum using the local thermodynamic equilibrium (LTE) line analysis and synthetic spectrum code MOOG (Sneden, 1973)111Available at http://www.as.utexas.edu/chris/moog.html. The process of atomic line identification was performed on the spectra of three stars from Afşar et al. (2018) that have high S/N, and well represent the temperature range of our entire sample: HIP 64378 (= 4357 K), HIP 62653 (= 4804 K), and HIP 54048 (= 5099 K).
During this process we made use of the following atomic line sources: NIST (Kramida A. & NIST ASD Team, 2021); VALD3 (Ryabchikova et al., 2015); ATOMIC LINE LIST v2.05b21 (Van Hoof, 2018); and papers based on laboratory and stellar spectra (Shetrone et al., 2015; Meléndez & Barbuy, 1999). We identified the lines with the simultaneous use of synthetic and observed spectra displayed with the IRAF222IRAF is distributed by the National Optical Astronomy Observatory, which is operated by the Association of Universities for Research in Astronomy (AURA) under cooperative agreement with the National Science Foundation. task. Line lists needed for synthetic spectra were generated with the Linemake tool (Placco et al., 2021),333https://github.com/vmplacco/linemake which includes atomic lines mainly from Kurucz (2011, 2018), and also contains line transition data from Den Hartog et al. (2021) (and references therein). This process led us to identify about 2500 atomic lines in both H and K bands.
4 Finding LDR line-pairs and LDR relations
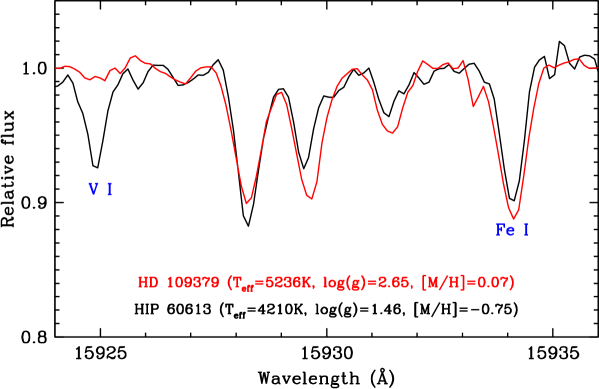
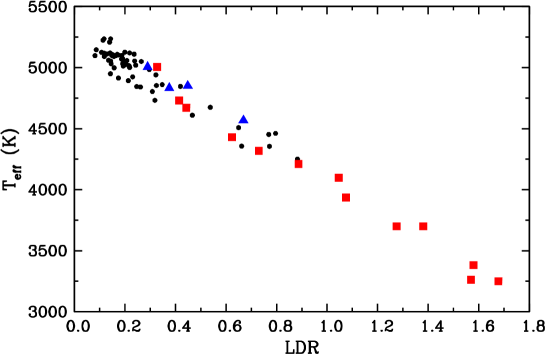
After identifying atomic lines for the complete spectral region, we listed the elements according to their low and high E.P. values. After careful selection of plausible atomic absorption lines by eliminating other atomic and molecular contamination as much as possible, we found about 50 potential line-pairs. To obtain useful LDR- relations, we first measured their central line depths by applying a Gaussian fitting function using the IRAF task. We first selected an initial set of approximately 20 stars from Table 1 that represent the overall temperature range of our sample. Then we measured the ratio of the line depths and plotted against spectral values for this small sample. After examining the LDR calibrations, we found 32 atomic lines (Table 2) to be useful for LDR method application. Matching these atomic lines yielded 26 LDR line-pairs (Table 3) with significant LDR relationships. An example line-pair of V i (15924.8 Å) and Fe i (15934.0 Å) is given in Figure 2. It is important to select LDR line-pairs at wavelengths as close as possible to minimize the errors that might originate from the continuum level setting (e.g. Figure 4 in Biazzo et al. 2007, and Table 5 in Taniguchi et al. 2018). Unfortunately, there are not many absorption lines that can satisfy this constraint in the H and K-band wavelength region. Therefore, we were forced to pair the lines that are not in the same spectral order, and to use the same absorption line in different line-pairs.
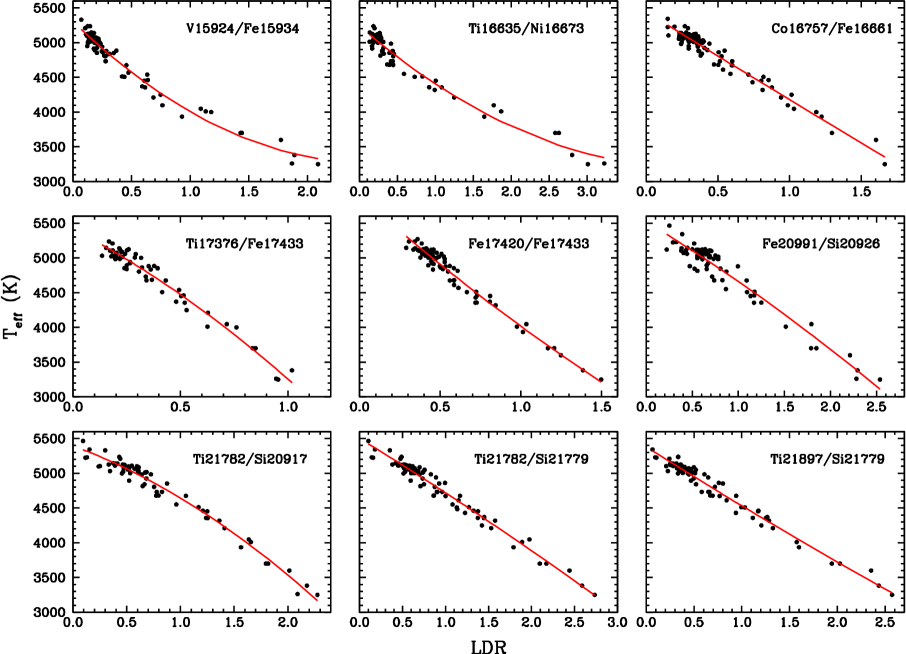
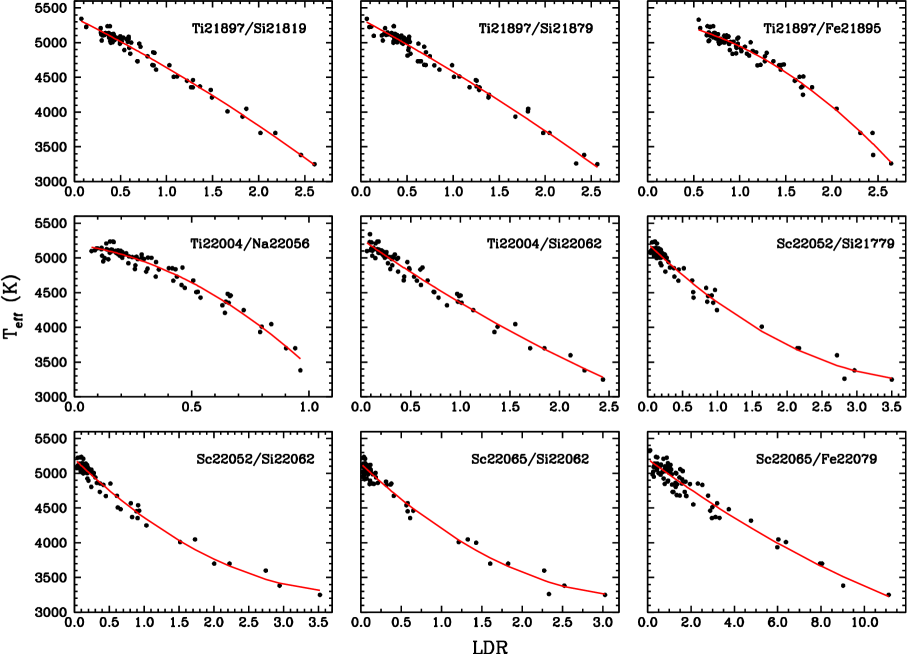
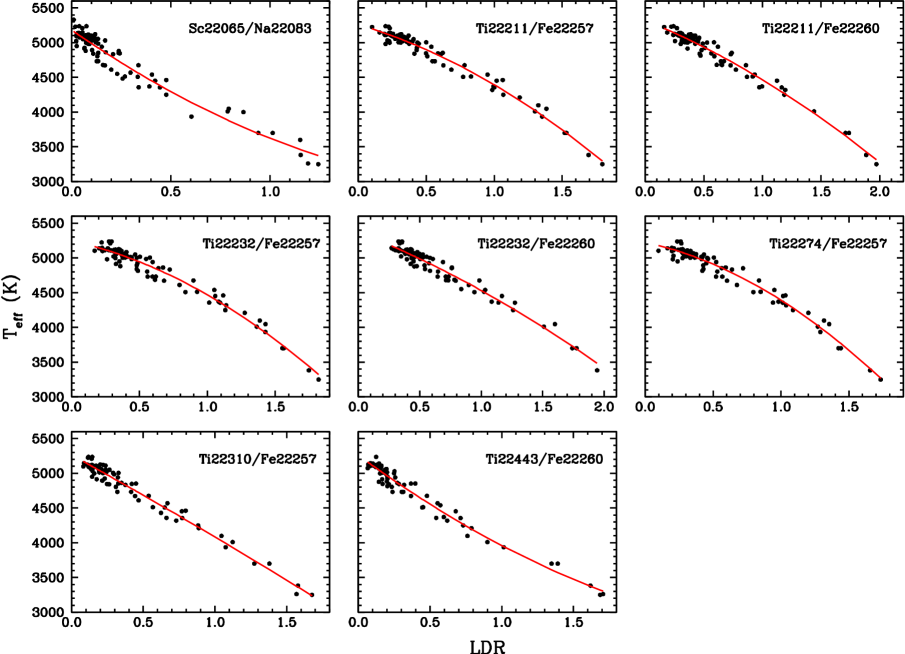
Finally, we carried out the line depth measurements for the overall sample (Table 1). The ratios of the line-pairs (low E.P. / high E.P.) were plotted against the spectral values that were collected from various literature sources (the reference list for the spectral values is given in Table 1). It should be noted here that not all the line depths could be measured for every star. For example, some weak atomic lines could not be detected in metal-poor stars ([M/H] 1). A couple of stars turned out to be spectroscopic binaries that had not been previously noticed. Additionally, some data problems such as low S/N or problematic telluric line removal resulted in the elimination of some of the line pairs in a few stars. To characterize the LDR- relationships we used quadratic polynomial functions (=a+b+c, where is a particular LDR) to best represent the distribution of data points in all of the calibrations. To increase the sensitivity of the calibrations we ran multiple iterations to identify and eliminate aberrant data points. The method we used for iterations requires the difference between the actual (spectral values, Table 1) and calculated LDR temperatures ( = ) to be below the level of the distribution. We ran the iterations until all the values satisfy this requirement, in other words all the outlier data with values higher than level were removed through these iterations, which in turn led us to use about 70 to 90 stars for the final LDR calibrations, depending on the line-pairs studied. All of the final LDR relationships are plotted in Figures 3, 4, and 5, and the quadratic polynomial coefficients are provided in Table 3.
4.1 Uncertainties in determination
In Table 4, we list the mean LDR temperatures () for the entire sample, except for HIP 79248, where we could not measure the LDRs from any of the line-pairs listed in Table 3. The temperatures were obtained by taking the simple average of the individual LDR temperatures calculated from the quadratic polynomial functions given in Table 3. The standard errors (SE=/) and values for the LDR temperatures of each star range between 4 SE 60, and 20 150. The mean of the standard errors () and standard deviations () were found as = 15 K and = 59 K, showing the overall internal uncertainty level of the temperatures obtained from each line-pair.
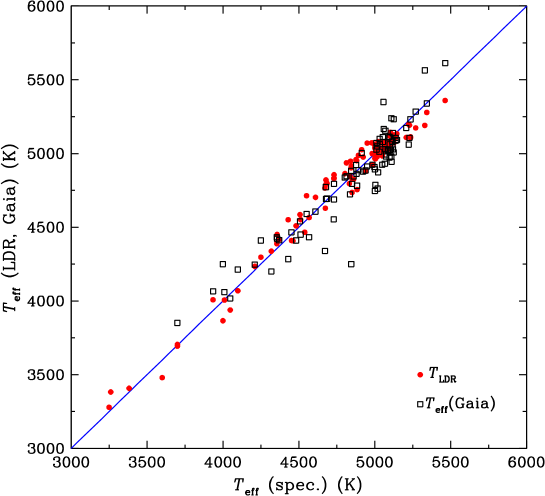
We cross-matched our sample with Gaia DR3 (Gaia Collaboration et al., 2016, 2022), finding Gaia spectral temperatures (Recio-Blanco et al., 2022) for 94 of our sample stars. We also calculated photometric temperatures for 107 stars with available 2MASS J and K magnitudes (Skrutskie et al., 2006) using the relations provided by (González Hernández & Bonifacio, 2009). The spectral temperatures gathered from the literature (, see also Table 1), (Gaia) spectral, and (JK) photometric temperatures are also listed in Table 4 for comparison. The uncertainty level of the temperatures resulting from the application of our LDR method was estimated by comparing the temperatures with the ones gathered from the literature, . The standard deviation of the () differences yielded the uncertainty level of our method as () 70 K.
We also compared our results with the spectral Gaia temperatures (Recio-Blanco et al., 2022) and obtained ((Gaia)) 145 K. A plot that compares the spectral values with the and (Gaia) temperatures is given in Figure 6. The good agreement between the temperatures is noteworthy.
Although obtained using two different measurement methods, we also compared our LDR temperatures with the (JK) photometric temperatures and found ((JK)) 340 K. This substantial deviation between the temperatures mainly originates from the J and K magnitude uncertainties reported in the 2MASS catalog. For example, an uncertainty about 0.25 mag in J magnitude results in an uncertainty level of about 1000 K in the (JK) temperature. When we narrow down the 2MASS sample by limiting the uncertainties in both J and K magnitudes by taking into account only the stars with J and K magnitude uncertainties of lower than 0.2 mag, the cross-match of our sample yields only 58 stars in common, which in turn gives ((JK)) 175 K.
Unfortunately there are not many G-K standard stars that have been observed with IGRINS, which makes it difficult to test the accuracy level of our LDR relations for stars that are outside our current sample. The only prominent star for which we have IGRINS spectral data is Arcturus. Running all the LDR relations on Arcturus we obtained = 426314 K ( = 62 K) from 19 line-pairs, in excellent agreement with the temperature reported by, e.g., Ramírez & Allende Prieto (2011) ( = 428630 K), and with the literature in general. The LDR relations that we did not receive reliable temperature information for Arcturus were mostly the ones with Sc involved (Table 3), and two additional line-pairs in the K-band (Fe20991/Si20926, Ti21897/Fe21894) also could not be used. In §5 we will discuss these line-pairs in more detail.
We also tested the LDR relations on two open cluster members; NGC 6940 MMU 105, and NCG 752 MMU 77, of which were previously observed with IGRINS by our group (Böcek Topcu et al., 2016, 2019, 2020). For NGC 6940 MMU 105 we found = 481310 K ( = 41 K) from 18 line-pairs, which is in good agreement with = 4765100 K from Böcek Topcu et al. (2016). The same few anomalous line pairs that we identified in Arcturus showed a similar behaviour in MMU 105 case. Additionally, we could not measure the depths of two line-pairs; Ti17376/Fe17433 and Ti22310/Fe22257, for this star.
For NCG 752 MMU 77, we calculated the LDR temperatures from 21 line-pairs. Taking an average of the individual values yielded = 486912 K ( = 60 K), which is in quite a good agreement with = 4874100 K from Böcek Topcu et al. (2015).
Setting the continuum level in both H and K-band spectra of especially cool stars is difficult because they have rich spectra of many complex absorption and molecular features. Despite our effort to select the absorption lines of LDR with no obvious blending issues, crowded spectral regions in the H- and K-bands are still inevitable in cool stars. Therefore continuum placement is not perfectly defined for every LDR pair. To be able to minimize the temperature uncertainties caused by the continuum placement between central line depth measurements, we preferred to place the continuum locally during the Gaussian line-fitting to the related absorption lines. To estimate the temperature uncertainties arising from continuum level placement, we used a small set of stars that well represent the temperature distribution of our overall sample: HD 148783, HD 119667, HIP 97599, HIP 27091, HIP 33578 (Table 1). We applied a simple approximation and measured the depths of the lines six times for the same star by varying the local continuum to form a set of 30 LDR measurements for the individual line-pairs in both H and K bands. The average temperature uncertainties that emerge from the LDRs obtained for both regions are 395 K ( = 29 K) and 234 K ( = 22 K) for the H and K bands, respectively.
5 DISCUSSION
5.1 The luminosity dependency of LDRs
The use of line depth ratios of luminosity sensitive and non-sensitive absorption lines for luminosity classification dates back many decades (e.g. Wright & Jacobson 1965). The effect of luminosity, in other words surface gravity, on LDRs has been discussed in several studies, such as Gray & Brown (2001), Biazzo et al. (2007), and Jian et al. (2020). The latter paper investigated the gravity effect on LDRs obtained from the -band spectra of a group of stars with a range of 35008000 K, including dwarfs, giants and supergiants. They found that some of the line-pairs they use for LDR calibrations show systematic offsets between the three luminosity groups. Their investigation led to a conclusion that the depths of some neutral lines (e.g. Si i at 10371) in their LDR pairs are sensitive to log g while others not (e.g. Ca i at 10343).
Recently, Matsunaga et al. (2021) proposed a method that uses the LDRs as indicators of the and log g. They found empirical relations between , log g, and LDRs, of which they derived using the selected line-pairs of Fe iFe ii and Ca iCa ii lines from the -band spectra of a sample of stars from dwarfs to supergiants. From this method, they reported a precision level of 50 K and 0.2 dex for the and log g determinations, respectively.
In general, ionized species are more sensitive to the changes in gravity than the neutral ones in cool stars, though strong lines of neutral species such as Mg i b triplet near 5170 Å (e.g. Gray 2005) are known to be sensitive to the surface gravity changes due to mainly the pressure sensitivity of the damping constant. Our sample has stars with surface gravities between 0.20 log g 4.6, but it mainly contains giant stars with only a few main-sequence and supergiant stars. The cool end of our sample contains fewer stars with log g 1.75, leaving not enough room to statistically investigate the LDR relations for supergiants. On the other hand, having mostly weak lines as LDR pairs, our investigation of the log g effect on the LDR calibrations (e.g. Figure 7) showed no systematic offsets for different luminosity groups, allowing us to use the LDR relations as listed in Table 3 without any apparent need for log g correction on LDRs.
5.2 The metallicity effect on LDRs
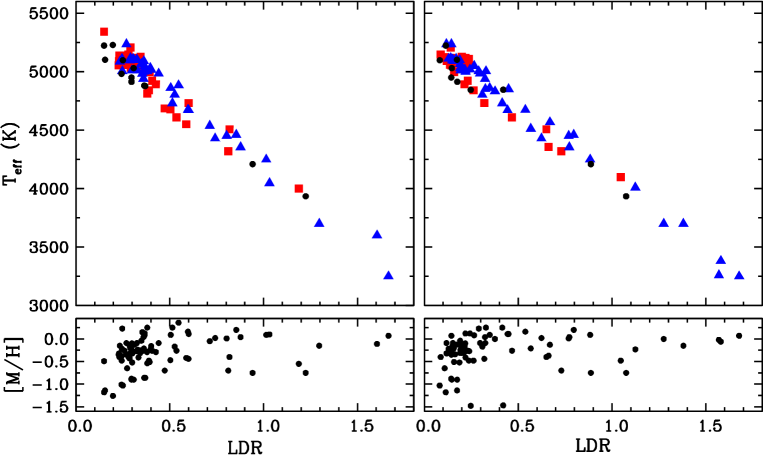
Metallicity dependence of LDRs has been previously discussed in several studies. Gray & Brown (2001) noted the effects of metallicity, absolute magnitude, and temperature on spectral lines. To improve the precision of the LDR-temperature calibrations in their work, they applied corrections for metallicity variations to the LDRs. The H-band studies of Fukue et al. (2015) and Jian et al. (2019) also investigated the effects of metallicity and abundance ratios on LDR relations. The Jian et al. analysis is especially useful, as they used a large number of H-band spectra (3700 5000K) from APOGEE survey with a metallicity range of 0.7 [Fe/H] 0.4 dex. They interpreted the saturations on abundance ratios to explain the metallicity effect on the LDRs. Our sample has a metallicity range of 1.5 [M/H] 0.5. Investigating the metallicity range on LDRs, we found no clear relation between LDRs and the metallicities. An example plot that searches for the effect of [M/H] on LDR relations is given in Figure 8. However, our stellar sample of 110 stars is too small to explore all of the possible parameter dependencies of these newly-defined LDR relationships. Expansion of our sample size will be taken up in a future LDR calibration study.
5.3 Line-pairs with blended features
For cool stars the near-infrared, especially the K-band spectral region, is dominated by many molecular lines, making it difficult to find unblended atomic lines. We noticed that some of the LDR calibrations listed in Table 3 tend to give temperatures about 100-200 K higher than the literature values (Table 1) when applied to stars that are not included in our sample (§4.1): Arcturus, NGC 6940 MMU 105, NCG 752 MMU 77. These LDR calibrations are usually the ones that have atomic lines paired with Sc i 22052 and 22065 Å lines (also numbered as 15, 16, 17, 18, and 19 in Table 3). Closer examination of scandium lines indicated that Sc i 22052 line blended with a Si i line (22051.93 Å). Although the 22065 Sc i line is unblended, a nearby CO feature becomes more intrusive at temperatures 4800 K. Two additional line-pairs; Fe i 20991/Si i 20926, and Ti i 21897/Fe i 21895, were found to be also affected by the contribution of CO features that seem to become more potent especially for stars with 4800 K. These LDR line pairs should be applied with caution.
6 Summary and Conclusion
In this study, we have applied the LDR method to high-resolution near infrared
spectra of 110 stars, of which were obtained with IGRINS in the H and
K-band, simultaneously. To our knowledge, this is the first study that reports
the LDR relations in the K-band spectral region.
Our sample covers mostly giant stars along with several
main-sequence stars and supergiants. Performing LDR calibrations
we found 26 LDR line-pairs that are mostly composed of Fe-peak elements
(Table 3) and provide temperatures comparable
to literature values within the accuracy of about 70 K.
Investigation of our LDR relations
for the dependence of LDRs on log g and [M/H] resulted in no clear relation.
We suggest further investigation of these parameters with more extensive sample
drawn from the Raw and Reduced IGRINS Spectral Archive
(RRISA444https://igrinscontact.github.io/, Sawczynec et al. 2022) in a future LDR study.
We thank our referee for helpful comments that improved this paper. Our work has been supported by The Scientific and Technological Research Council of Turkey (TÜBİTAK, project No. 119F076), by the US National Science Foundation grant AST-1616040 and by the University of Texas Rex G. Baker, Jr. Centennial Research Endowment. This work used the Immersion Grating Infrared Spectrometer (IGRINS) that was developed under a collaboration between the University of Texas at Austin and the Korea Astronomy and Space Science Institute (KASI) with the financial support of the Mt. Cuba Astronomical Foundation, of the US National Science Foundation under grants AST-1229522 and AST-1702267, of the McDonald Observatory of the University of Texas at Austin, of the Korean GMT Project of KASI, and Gemini Observatory. This material is based upon work supported by the National Science Foundation under Grant No. AST-1908892 to G. Mace. RLV acknowledges support from CONACYT through a postdoctoral fellowship within the program “Estancias Posdoctorales por México”. SÖ also acknowledges support by the National Science Centre, Poland, project 2019/34/E/ST9/00133. This work has made use of data from the European Space Agency (ESA) mission Gaia (https://www.cosmos.esa.int/Gaia), processed by the Gaia Data Processing and Analysis Consortium (DPAC, https://www.cosmos.esa.int/web/Gaia/dpac/consortium). Funding for the DPAC has been provided by national institutions, in particular the institutions participating in the Gaia Multilateral Agreement. This publication makes use of data products from the Two Micron All Sky Survey, which is a joint project of the University of Massachusetts and the Infrared Processing and Analysis Center/California Institute of Technology, funded by the National Aeronautics and Space Administration and the National Science Foundation. This research has made use of the SIMBAD database, operated at CDS, Strasbourg, France.
References
- Abdurro’uf et al. (2022) Abdurro’uf, Accetta, K., Aerts, C., et al. 2022, ApJS, 259, 35, doi: 10.3847/1538-4365/ac4414
- Afşar et al. (2018) Afşar, M., Bozkurt, Z., Böcek Topcu, G., et al. 2018, AJ, 155, 240, doi: 10.3847/1538-3881/aabe86
- Afşar et al. (2016) Afşar, M., Sneden, C., Frebel, A., et al. 2016, ApJ, 819, 103, (Afşar16), doi: 10.3847/0004-637X/819/2/103
- Alonso et al. (1996) Alonso, A., Arribas, S., & Martinez-Roger, C. 1996, A&AS, 117, 227
- Bessell et al. (1998) Bessell, M. S., Castelli, F., & Plez, B. 1998, A&A, 333, 231
- Biazzo et al. (2007) Biazzo, K., Frasca, A., Catalano, S., & Marilli, E. 2007, Astronomische Nachrichten, 328, 938, doi: 10.1002/asna.20071078110.1002/asna.200610781
- Böcek Topcu et al. (2015) Böcek Topcu, G., Afşar, M., Schaeuble, M., & Sneden, C. 2015, MNRAS, 446, 3562, doi: 10.1093/mnras/stu2380
- Böcek Topcu et al. (2016) Böcek Topcu, G., Afşar, M., & Sneden, C. 2016, MNRAS, 463, 580, doi: 10.1093/mnras/stw1974
- Böcek Topcu et al. (2019) Böcek Topcu, G., Afşar, M., Sneden, C., et al. 2019, MNRAS, 485, 4625, doi: 10.1093/mnras/stz727
- Böcek Topcu et al. (2020) —. 2020, MNRAS, 491, 544, doi: 10.1093/mnras/stz3008
- Cayrel et al. (1991) Cayrel, R., Perrin, M. N., Barbuy, B., & Buser, R. 1991, A&A, 247, 108
- da Silva et al. (2015) da Silva, R., Milone, A. d. C., & Rocha-Pinto, H. J. 2015, A&A, 580, A24, doi: 10.1051/0004-6361/201525770
- Delgado Mena et al. (2017) Delgado Mena, E., Tsantaki, M., Adibekyan, V. Z., et al. 2017, A&A, 606, A94, doi: 10.1051/0004-6361/201730535
- Den Hartog et al. (2021) Den Hartog, E. A., Lawler, J. E., Sneden, C., et al. 2021, ApJS, 255, 27, doi: 10.3847/1538-4365/ac04b1
- Feuillet et al. (2016) Feuillet, D. K., Bovy, J., Holtzman, J., et al. 2016, ApJ, 817, 40, doi: 10.3847/0004-637X/817/1/40
- Fukue et al. (2015) Fukue, K., Matsunaga, N., Yamamoto, R., et al. 2015, ApJ, 812, 64, doi: 10.1088/0004-637X/812/1/64
- Gaia Collaboration et al. (2016) Gaia Collaboration, Prusti, T., de Bruijne, J. H. J., et al. 2016, A&A, 595, A1, doi: 10.1051/0004-6361/201629272
- Gaia Collaboration et al. (2022) Gaia Collaboration, Vallenari, A., Brown, A. G. A., et al. 2022, arXiv e-prints, arXiv:2208.00211, doi: 10.48550/arXiv.2208.00211
- González Hernández & Bonifacio (2009) González Hernández, J. I., & Bonifacio, P. 2009, A&A, 497, 497, doi: 10.1051/0004-6361/200810904
- Gray (1994) Gray, D. F. 1994, PASP, 106, 1248, doi: 10.1086/133502
- Gray (2005) —. 2005, The Observation and Analysis of Stellar Photospheres, Cambridge University Press, Cambridge, UK
- Gray & Brown (2001) Gray, D. F., & Brown, K. 2001, PASP, 113, 723, doi: 10.1086/320811
- Gray & Johanson (1991) Gray, D. F., & Johanson, H. L. 1991, PASP, 103, 439, doi: 10.1086/132839
- Heiter et al. (2002) Heiter, U., Kupka, F., van’t Veer-Menneret, C., et al. 2002, A&A, 392, 619, doi: 10.1051/0004-6361:20020788
- Hekker & Meléndez (2007) Hekker, S., & Meléndez, J. 2007, A&A, 475, 1003, doi: 10.1051/0004-6361:20078233
- Jian et al. (2019) Jian, M., Matsunaga, N., & Fukue, K. 2019, MNRAS, 485, 1310, doi: 10.1093/mnras/stz237
- Jian et al. (2020) Jian, M., Taniguchi, D., Matsunaga, N., et al. 2020, MNRAS, 494, 1724, doi: 10.1093/mnras/staa834
- Jofré et al. (2015) Jofré, E., Petrucci, R., Saffe, C., et al. 2015, A&A, 574, A50, doi: 10.1051/0004-6361/201424474
- Jofré et al. (2014) Jofré, P., Heiter, U., Soubiran, C., et al. 2014, A&A, 564, A133, doi: 10.1051/0004-6361/201322440
- Jones et al. (2011) Jones, M. I., Jenkins, J. S., Rojo, P., & Melo, C. H. F. 2011, A&A, 536, A71, doi: 10.1051/0004-6361/201117887
- Jönsson et al. (2017) Jönsson, H., Ryde, N., Nordlander, T., et al. 2017, A&A, 598, A100, doi: 10.1051/0004-6361/201629128
- Koleva & Vazdekis (2012) Koleva, M., & Vazdekis, A. 2012, A&A, 538, A143, doi: 10.1051/0004-6361/201118065
- Kovtyukh (2007) Kovtyukh, V. V. 2007, MNRAS, 378, 617, doi: 10.1111/j.1365-2966.2007.11804.x
- Kovtyukh & Gorlova (2000) Kovtyukh, V. V., & Gorlova, N. I. 2000, A&A, 358, 587
- Kovtyukh et al. (2003) Kovtyukh, V. V., Soubiran, C., Belik, S. I., & Gorlova, N. I. 2003, A&A, 411, 559, doi: 10.1051/0004-6361:20031378
- Kovtyukh et al. (2006) Kovtyukh, V. V., Soubiran, C., Bienaymé, O., Mishenina, T. V., & Belik, S. I. 2006, MNRAS, 371, 879, doi: 10.1111/j.1365-2966.2006.10719.x
- Kramida A. & NIST ASD Team (2021) Kramida A., Ralchenko Yu., R. J., & NIST ASD Team. 2021, NIST Atomic Spectra Database (version 5.9), National Institute of Standards and Technology, Gaithersburg, MD., doi: https://doi.org/10.18434/T4W30F
- Kurucz (2011) Kurucz, R. L. 2011, Canadian Journal of Physics, 89, 417, doi: 10.1139/p10-104
- Kurucz (2018) Kurucz, R. L. 2018, in Astronomical Society of the Pacific Conference Series, Vol. 515, Workshop on Astrophysical Opacities, 47
- Lee & Gullikson (2016) Lee, J.-J., & Gullikson, K. 2016, Plp: V2.1 Alpha 3, v2.1-alpha.3, Zenodo, Zenodo, doi: 10.5281/zenodo.56067
- López-Valdivia et al. (2019) López-Valdivia, R., Mace, G. N., Sokal, K. R., et al. 2019, ApJ, 879, 105, doi: 10.3847/1538-4357/ab2129
- Luck (2014) Luck, R. E. 2014, AJ, 147, 137, doi: 10.1088/0004-6256/147/6/137
- Luck (2017) —. 2017, AJ, 153, 21, doi: 10.3847/1538-3881/153/1/21
- Luck & Challener (1995) Luck, R. E., & Challener, S. L. 1995, AJ, 110, 2968, doi: 10.1086/117741
- Lyubimkov et al. (2010) Lyubimkov, L. S., Lambert, D. L., Rostopchin, S. I., Rachkovskaya, T. M., & Poklad, D. B. 2010, MNRAS, 402, 1369, doi: 10.1111/j.1365-2966.2009.15979.x
- Majewski et al. (2017) Majewski, S. R., Schiavon, R. P., Frinchaboy, P. M., et al. 2017, AJ, 154, 94, doi: 10.3847/1538-3881/aa784d
- Maldonado et al. (2013) Maldonado, J., Villaver, E., & Eiroa, C. 2013, A&A, 554, A84, doi: 10.1051/0004-6361/201321082
- Mallik (1998) Mallik, S. V. 1998, A&A, 338, 623
- Masana et al. (2006) Masana, E., Jordi, C., & Ribas, I. 2006, A&A, 450, 735, doi: 10.1051/0004-6361:20054021
- Matsunaga et al. (2021) Matsunaga, N., Jian, M., Taniguchi, D., & Elgueta, S. S. 2021, MNRAS, 506, 1031, doi: 10.1093/mnras/stab1770
- McWilliam (1990) McWilliam, A. 1990, ApJS, 74, 1075, doi: 10.1086/191527
- Meléndez & Barbuy (1999) Meléndez, J., & Barbuy, B. 1999, ApJS, 124, 527, doi: 10.1086/313261
- Mucciarelli et al. (2021) Mucciarelli, A., Bellazzini, M., & Massari, D. 2021, A&A, 653, A90, doi: 10.1051/0004-6361/202140979
- Pakhomov & Yu. v. (2013) Pakhomov, & Yu. v. 2013, VizieR Online Data Catalog, J/PAZh/39/58
- Park et al. (2014) Park, C., Jaffe, D. T., Yuk, I.-S., et al. 2014, in Society of Photo-Optical Instrumentation Engineers (SPIE) Conference Series, Vol. 9147, Society of Photo-Optical Instrumentation Engineers (SPIE) Conference Series, 1, doi: 10.1117/12.2056431
- Park et al. (2018) Park, S., Lee, J.-E., Kang, W., et al. 2018, ApJS, 238, 29, doi: 10.3847/1538-4365/aadd14
- Placco et al. (2021) Placco, V. M., Sneden, C., Roederer, I. U., et al. 2021, Research Notes of the American Astronomical Society, 5, 92, doi: 10.3847/2515-5172/abf651
- Prugniel et al. (2011) Prugniel, P., Vauglin, I., & Koleva, M. 2011, A&A, 531, A165, doi: 10.1051/0004-6361/201116769
- Ramírez & Allende Prieto (2011) Ramírez, I., & Allende Prieto, C. 2011, ApJ, 743, 135, doi: 10.1088/0004-637X/743/2/135
- Ramírez et al. (2013) Ramírez, I., Allende Prieto, C., & Lambert, D. L. 2013, ApJ, 764, 78, doi: 10.1088/0004-637X/764/1/78
- Ramírez & Meléndez (2005) Ramírez, I., & Meléndez, J. 2005, apj, 626, 465, doi: 10.1086/430102
- Recio-Blanco et al. (2022) Recio-Blanco, A., de Laverny, P., Palicio, P. A., et al. 2022, arXiv e-prints, arXiv:2206.05541, doi: 10.48550/arXiv.2206.05541
- Ryabchikova et al. (2015) Ryabchikova, T., Piskunov, N., Kurucz, R. L., et al. 2015, Phys. Scr, 90, 054005, doi: 10.1088/0031-8949/90/5/054005
- Sasselov & Lester (1990) Sasselov, D. D., & Lester, J. B. 1990, ApJ, 360, 227, doi: 10.1086/169111
- Sawczynec et al. (2022) Sawczynec, E., Mace, G., Gully-Santiago, M., & Jaffe, D. 2022, in American Astronomical Society Meeting Abstracts, Vol. 54, American Astronomical Society Meeting Abstracts, 203.06
- Shetrone et al. (2015) Shetrone, M., Bizyaev, D., Lawler, J. E., et al. 2015, ApJS, 221, 24, doi: 10.1088/0067-0049/221/2/24
- Skrutskie et al. (2006) Skrutskie, M. F., Cutri, R. M., Stiening, R., et al. 2006, AJ, 131, 1163, doi: 10.1086/498708
- Smith & Lambert (1985) Smith, V. V., & Lambert, D. L. 1985, ApJ, 294, 326, doi: 10.1086/163300
- Smith & Lambert (1990) —. 1990, ApJS, 72, 387, doi: 10.1086/191421
- Sneden (1973) Sneden, C. 1973, ApJ, 184, 839, doi: 10.1086/152374
- Strassmeier & Schordan (2000) Strassmeier, K. G., & Schordan, P. 2000, Astronomische Nachrichten, 321, 277, doi: 10.1002/1521-3994(200012)321:5/6<277::AID-ASNA277>3.0.CO;2-H
- Tabernero et al. (2012) Tabernero, H. M., Montes, D., & González Hernández, J. I. 2012, A&A, 547, A13, doi: 10.1051/0004-6361/201117506
- Takeda et al. (2005) Takeda, Y., Ohkubo, M., Sato, B., Kambe, E., & Sadakane, K. 2005, PASJ, 57, 27, doi: 10.1093/pasj/57.1.27
- Takeda et al. (2008) Takeda, Y., Sato, B., & Murata, D. 2008, PASJ, 60, 781, doi: 10.1093/pasj/60.4.781
- Taniguchi et al. (2018) Taniguchi, D., Matsunaga, N., Kobayashi, N., et al. 2018, MNRAS, 473, 4993, doi: 10.1093/mnras/stx2691
- Tody (1993) Tody, D. 1993, in Astronomical Society of the Pacific Conference Series, Vol. 52, Astronomical Data Analysis Software and Systems II, ed. R. J. Hanisch, R. J. V. Brissenden, & J. Barnes, 173
- Van Hoof (2018) Van Hoof, P. A. M. 2018, Galaxies, 6, doi: 10.3390/galaxies6020063
- Wright & Jacobson (1965) Wright, K. O., & Jacobson, T. V. 1965, Publications of the Dominion Astrophysical Observatory Victoria, 12, 373
- Yuk et al. (2010) Yuk, I.-S., Jaffe, D. T., Barnes, S., et al. 2010, in Society of Photo-Optical Instrumentation Engineers (SPIE) Conference Series, Vol. 7735, Society of Photo-Optical Instrumentation Engineers (SPIE) Conference Series, 1, doi: 10.1117/12.856864
| Star | (K) | log g | [M/H] | (km/s) | RefaaReference Numbers: (1) Smith & Lambert (1985), (2) Koleva & Vazdekis (2012), (3) Prugniel et al. (2011), (4) Mallik (1998), (5) Smith & Lambert (1990), (6) Afşar et al. (2018), (7) Pakhomov & Yu. v. (2013), (8) McWilliam (1990), (9) Luck & Challener (1995), (10) Luck (2014), (11) Jönsson et al. (2017), (12) Lyubimkov et al. (2010), (13) Feuillet et al. (2016), (14) Delgado Mena et al. (2017), (15) Hekker & Meléndez (2007), (16) Ramírez et al. (2013), (17) Maldonado et al. (2013), (18) da Silva et al. (2015), (19) Jones et al. (2011), (20) Jofré et al. (2014), (21) Takeda et al. (2008), (22) Luck (2017), (23) Jofré et al. (2015), (24) Tabernero et al. (2012), (25) Takeda et al. (2005), (26) this study. |
|---|---|---|---|---|---|
| HIP 80704 | 3250 | 0.20 | 0.07 | 2.70 | 1 |
| HIP 69038 | 3261 | 0.59 | 0.02 | 2.00 | 2 |
| HIP 92791 | 3382 | 0.55 | 0.06 | 2.30 | 3 |
| HIP 113881 | 3600 | 1.20 | 0.11 | 2.00 | 1 |
| HIP 50801 | 3700 | 1.35 | 0.00 | 2.01 | 4 |
| HIP 67070 | 3700 | 1.00 | 0.15 | 2.40 | 5 |
| HIP 77272 | 3935 | 0.59 | 0.75 | 1.66 | 6 |
| HIP 26386 | 4000 | 1.25 | 0.55 | 1.10 | 7 |
| HIP 102635 | 4010 | 1.78 | 0.23 | 2.30 | 8 |
| HIP 3083 | 4048 | 1.13 | 0.10 | 2.10 | 3 |
(This table is available in its entirety in machine-readable form.)
| Species | Wavelength (Å) | E.P. (eV) | log |
|---|---|---|---|
| V i | 15924.822 | 2.136 | -1.200 |
| Fe i | 15934.020 | 6.310 | -0.430 |
| Ti i | 16635.160 | 2.350 | -1.582 |
| Fe i | 16661.390 | 6.340 | -0.070 |
| Ni i | 16673.710 | 6.040 | 0.100 |
| Co i | 16757.640 | 3.410 | -1.310 |
| Ti i | 17376.577 | 4.489 | 0.747 |
| Fe i | 17420.880 | 3.882 | -2.880 |
| Fe i | 17433.635 | 6.411 | 0.030 |
| Si i | 20917.151 | 6.727 | 0.575 |
| Si i | 20926.149 | 6.727 | -1.074 |
| Fe i | 20991.037 | 4.143 | -2.684 |
| Si i | 21779.660 | 6.718 | 0.420 |
| Ti i | 21782.940 | 1.749 | -1.160 |
| Si i | 21819.671 | 6.721 | 0.170 |
| Si i | 21879.324 | 6.721 | 0.410 |
| Fe i | 21894.996 | 6.144 | -0.360 |
| Ti i | 21897.370 | 1.739 | -1.450 |
| Ti i | 22004.500 | 1.730 | -1.910 |
| Sc i | 22051.985 | 1.448 | -0.840 |
| Na i | 22056.400 | 3.191 | 0.290 |
| Si i | 22062.710 | 6.727 | 0.540 |
| Sc i | 22065.306 | 1.439 | -0.830 |
| Fe i | 22079.852 | 5.849 | -1.400 |
| Na i | 22083.662 | 3.191 | -0.013 |
| Ti i | 22211.238 | 1.734 | -1.780 |
| Ti i | 22232.858 | 1.739 | -1.690 |
| Fe i | 22257.107 | 5.064 | -0.710 |
| Fe i | 22260.179 | 5.086 | -0.941 |
| Ti i | 22274.027 | 1.749 | -1.790 |
| Ti i | 22310.617 | 1.733 | -2.071 |
| Ti i | 22443.925 | 1.739 | -2.370 |
| # | Species | Wavelength (Å) | LowE.P. (eV) | Species | Wavelength (Å) | HighE.P. (eV) | a | b | c |
|---|---|---|---|---|---|---|---|---|---|
| 1 | V i | 15924.822 | 2.136 | Fe i | 15934.020 | 6.310 | 325.80 | -1623.00 | 5302.2 |
| 2 | Ti i | 16635.160 | 2.350 | Ni i | 16673.710 | 6.040 | 109.47 | -940.02 | 5237.0 |
| 3 | Co i | 16757.640 | 3.410 | Fe i | 16661.390 | 6.340 | 12.43 | -1273.00 | 5440.5 |
| 4 | Ti i | 17376.577 | 4.489 | Fe i | 17433.635 | 6.411 | -544.70 | -1615.90 | 5417.1 |
| 5 | Fe i | 17420.880 | 3.882 | Fe i | 17433.635 | 6.411 | 172.50 | -2039.50 | 5884.8 |
| 6 | Fe i | 20991.037 | 4.143 | Si i | 20926.149 | 6.727 | -57.92 | -802.41 | 5521.3 |
| 7 | Ti i | 21782.940 | 1.749 | Si i | 20917.151 | 6.727 | -179.63 | -570.72 | 5394.5 |
| 8 | Ti i | 21782.940 | 1.749 | Si i | 21779.660 | 6.718 | -24.00 | -759.71 | 5501.4 |
| 9 | Ti i | 21897.370 | 1.739 | Si i | 21779.660 | 6.718 | 21.27 | -871.57 | 5382.1 |
| 10 | Ti i | 21897.370 | 1.739 | Si i | 21819.671 | 6.721 | -58.17 | -661.10 | 5360.5 |
| 11 | Ti i | 21897.370 | 1.739 | Si i | 21879.324 | 6.721 | -45.67 | -714.48 | 5340.6 |
| 12 | Ti i | 21897.370 | 1.739 | Fe i | 21894.996 | 6.144 | -239.59 | -155.53 | 5341.8 |
| 13 | Ti i | 22004.500 | 1.730 | Na i | 22056.400 | 3.191 | -1311.80 | -442.95 | 5193.8 |
| 14 | Ti i | 22004.500 | 1.730 | Si i | 22062.710 | 6.727 | 71.95 | -991.17 | 5274.7 |
| 15 | Sc i | 22051.985 | 1.448 | Si i | 21779.660 | 6.718 | 117.55 | -966.01 | 5208.8 |
| 16 | Sc i | 22051.985 | 1.448 | Si i | 22062.710 | 6.727 | 120.91 | -962.31 | 5204.5 |
| 17 | Sc i | 22065.306 | 1.439 | Si i | 22062.710 | 6.727 | 158.02 | -1098.40 | 5135.6 |
| 18 | Sc i | 22065.306 | 1.439 | Fe i | 22079.852 | 5.849 | 4.70 | -230.17 | 5205.1 |
| 19 | Sc i | 22065.306 | 1.439 | Na i | 22083.662 | 3.191 | 429.44 | -1988.20 | 5182.1 |
| 20 | Ti i | 22211.238 | 1.734 | Fe i | 22257.107 | 5.064 | -285.66 | -581.50 | 5260.3 |
| 21 | Ti i | 22211.238 | 1.734 | Fe i | 22260.179 | 5.086 | -164.53 | -694.44 | 5323.4 |
| 22 | Ti i | 22232.858 | 1.739 | Fe i | 22257.107 | 5.064 | -341.30 | -439.41 | 5248.7 |
| 23 | Ti i | 22232.858 | 1.739 | Fe i | 22260.179 | 5.086 | -135.50 | -707.92 | 5374.1 |
| 24 | Ti i | 22274.027 | 1.749 | Fe i | 22257.107 | 5.064 | -405.20 | -428.16 | 5225.9 |
| 25 | Ti i | 22310.617 | 1.733 | Fe i | 22257.107 | 5.064 | -42.72 | -1135.70 | 5262.3 |
| 26 | Ti i | 22443.925 | 1.739 | Fe i | 22260.179 | 5.086 | 219.42 | -1518.80 | 5259.2 |
| Star | (K) | (Gaia) | (JK) | |
|---|---|---|---|---|
| HIP 80704 | 3250 | 3279 | 3555 | |
| HIP 69038 | 3261 | 3383 | 3451 | |
| HIP 92791 | 3382 | 3408 | 3610 | |
| HIP 113881 | 3600 | 3480 | 3982 | |
| HIP 67070 | 3700 | 3694 | 3851 | 3711 |
| HIP 50801 | 3700 | 3705 | 4084 | |
| HIP 77272 | 3935 | 4008 | 4065 | 3727 |
| HIP 26386 | 4000 | 3866 | 4250 | 3695 |
| HIP 102635 | 4010 | 4006 | 4061 | 4014 |
| HIP 3083 | 4048 | 3939 | 4017 | 3802 |
(This table is available in its entirety in machine-readable form.)