Learning a Deep Color Difference Metric for Photographic Images
Abstract
Most well-established and widely used color difference (CD) metrics are handcrafted and subject-calibrated against uniformly colored patches, which do not generalize well to photographic images characterized by natural scene complexities. Constructing CD formulae for photographic images is still an active research topic in imaging/illumination, vision science, and color science communities. In this paper, we aim to learn a deep CD metric for photographic images with four desirable properties. First, it well aligns with the observations in vision science that color and form are linked inextricably in visual cortical processing. Second, it is a proper metric in the mathematical sense. Third, it computes accurate CDs between photographic images, differing mainly in color appearances. Fourth, it is robust to mild geometric distortions (e.g., translation or due to parallax), which are often present in photographic images of the same scene captured by different digital cameras. We show that all four properties can be satisfied at once by learning a multi-scale autoregressive normalizing flow for feature transform, followed by the Euclidean distance which is linearly proportional to the human perceptual CD. Quantitative and qualitative experiments on the large-scale SPCD dataset demonstrate the promise of the learned CD metric. Source code is available at https://github.com/haoychen3/CD-Flow.
1 Introduction
For a long time in vision science community, the modular and segregated view of cortical color processing predominated [46]: the visual perception/processing of color-related quantities is separate from and in parallel with the perception/processing of form (i.e., object shape and structure), motion direction, and depth order in natural scenes. As a result, vision scientists preferred to investigate color perception under minimal conditions on form [20, 46], for example, using uniformly colored patches.
The idea that color as a visual sensation can be analyzed separately had a profound impact on the development of computational formulae for color difference (CD) assessment. Till now, the most well-established and widely used CD metrics are primarily built upon the three-dimensional spatially-isotropic CIELAB coordinate system [32], recommended by the International Commission on Illumination (abbreviated as CIE from its French name Commission Internationale de l’Èclairage) in 1976. However, the uniformity111A system is perceptually uniform if a small perturbation to a component value is approximately equally perceptible across the range of that value [43]. of the CIELAB space is not as ideal as intended [28], even for uniformly colored patches. Thus, more complex and parametric formulae are proposed to rectify different aspects of perceptual non-uniformity. Representative methods include JPC79 [33], CMC(:)222 and are two multiplicative parameters in the model to be fitted. [9], BFD(:) [31], CIE94 [34], and CIEDE2000 [29], in which the parameters are calibrated by fitting the human perceptual CD measurements of uniformly colored patches. A naïve application of these metrics to photographic images is to compute the mean of the CDs between co-located pixels, which has been empirically shown to correlate poorly to human perception of CDs [38].
Back to the vision science community, with more supporting evidence from psychophysical and perceptual studies [27, 47, 6, 2], vision scientists have gradually come to agree on an alternative and more persuasive view of color perception: color and form (and motion) are inextricably interdependent as a unitary process of perceptual organization [46, 19]. Even the primary visual cortex (i.e., V1) plays a significant role in color perception through two types of color-sensitive neurons: single-opponent and double-opponent cells. The single-opponent cells are sensitive to large areas of color, while the double-opponent cells respond to color patterns, textures, and boundaries [24, 46]. At later stages, color is transformed to more complex and abstract features, which represent the integral properties of objects, and remain consistent against the changes of the environmental illumination [37, 17].
Inspired by these scientific findings, researchers and engineers began to take spatial context (i.e., local surrounding regions) into account, when designing CD formulae. Representative strategies include low-pass spatial filtering [57], histograming [18], patch-based comparison [49], and texture-based segmentation [38]. Most recently, Wang et al. [51] established the largest photographic image dataset, SPCD, for perceptual CD assessment. They further trained a lightweight deep neural network (DNN) for CD assessment of photographic images in a data-driven fashion, as a generalization of several existing CD metrics built on the CIE colorimetry. Nonetheless, the learned formula may not be a proper metric, due to reliance on the possibly surjective mapping for feature transform.
In this work, we further pursue the data-driven approach. We aim to learn a deep CD metric for photographic images with four desirable properties.
-
•
It is conceptually inspired by color perception in the visual cortex. The design of our approach should respect the view that color and form interact inextricably through all stages of visual cortical processing.
-
•
It is a proper metric that satisfies non-negativity, symmetry, identity of indiscernibles, and triangle inequality. Such design has been proven useful for perceptual optimization of image processing systems [11].
-
•
It is accurate in predicting the human perceptual CDs of photographic images, with good generalization to uniformly colored patches.
-
•
It is robust to mild geometric distortions (e.g., translation and dilation), which are often present in photographic images of the same scene captured with different camera settings or along different lines of sight.
We show that all the four desirable properties can be satisfied at once by learning a multi-scale autoregressive normalizing flow (a variant of RealNVP [13] to be specific) for feature transform, followed by Euclidean distance measure in the transformed space. More specifically, we achieve the first property by the squeezing operation (also known as invertible downsampling) in the normalizing flow, which trades space size for channel dimension. The second property is a direct consequence of the bijectivity of the normalizing flow and the Euclidean distance measure. We achieve the third property by optimizing the model parameters to explain the human perceptual CDs in SPCD [51]. We achieve the fourth property by enforcing the normalizing flow to be multi-scale and autoregressive, in which the features at a particular scale are conditioned on those at a higher (i.e., coarser) scale. By doing so, our metric automatically learns to preferentially rely on coarse-scale feature representations with more built-in tolerance to geometric distortions for CD assessment.
We conduct extensive experiments on the large-scale SPCD dataset [51], and find that our proposed metric, termed as CD-Flow, outperforms CD formulae in assessing CDs of photographic images, produces competitive multi-scale local CD maps without any dense supervision, and is more robust to geometric distortions. Moreover, we empirically verify the perceptual uniformity of the learned color image representation from multiple aspects.
2 Related Work
In this section, we first review CD formulae in a broader context, and then discuss normalizing flow-based models, which are core to the proposed CD metric.
CD Formulae. The CD assessment is necessary for day-to-day color control, and is indispensable for color matching in color industries. Admittedly, CD formulae have accelerated the instrumental pass/fail devices for color judgments, but much still needs to be done for complete satisfaction. The scientific investigation of perceptual CDs can be dated at least back to Young and Helmholtz, who proposed and developed the trichromatic theory of color, which is the foundation of the metameric color matching experiment. CIELAB [32] is one of the most successful CD metrics recommended by CIE in 1976, and has been widely adopted in industry for a long time. However, the CIELAB color space is not perceptually uniform [30], which motivates the development of CIE94 [34] and CIEDE2000 [29] through the introduction of application-specific parameters. Other CIELAB-based CD metrics include JPC79 [33], BFD(:) [31], and CMC(:) [9]. The introduced parameters are primarily calibrated using uniformly colored patches, digital or printed, which are statistically and semantically different from photographic images. Thus, the generalization of these metrics to photographic images is somewhat limited, especially when misalignment due to geometric distortions is present.
To incorporate spatial context into CD assessment, Zhang and Wandell [57] presented S-CIELAB, which extends CIELAB by adding spatial low-pass filtering as pre-processing. Similarly, Ouni et al. [39] provided a spatial extension of CIEDE2000. Lee et al. [26] re-examined histogram intersection, which is widely used in color image index, for the purpose of color image similarity assessment. Hong and Luo [18] chose to give larger weights to areas with spatially homogeneous colors and pixels with larger CDs. This method was later augmented by spatial filtering [41]. Lee and Plataniotis [25] built upon the philosophy of color structural similarity, and gave the hue component careful treatment with circular statistics. Jaramillo et al. [38] grouped the same texture areas for human-like CD assessment, using local binary patterns as texture descriptors.
General-purpose image quality models, including full-reference ones - SSIM [49], VSI [55], LPIPS [56] and DISTS [10], reduced-reference ones - Wang05 [50] and Yu09 [54], and no-reference ones - BRISQUE [35], NIQE [36] and Gao13 [14] can be directly adopted for CD assessment, regarding CDs as a particular form of “visual degradations.” Meanwhile, just-noticeable difference (JND) methods, e.g., Butteraugli [1] and F LIP [3], also attempt to characterize visually indistinguishable color changes between two images. In the era of deep learning, due to the lack of sufficient human-labeled training data, DNN-based CD formulae are rarely proposed. Wang et al. [51] created the first largest image dataset, SPCD, for perceptual CD assessment, and made one of the first attempts to train a DNN-based CD measure for photographic images. However, the underlying feature transform is not mathematically bijective.
Normalizing Flow-based Models. Normalizing flow-based generative models are constructed by bijective functions , with typically easy-to-compute analytical inverse . The primary goal of is to map raw data to samples from a simple probability distribution . Many classic machine learning algorithms can be cast in this framework, such as principal component analysis (PCA, where is a linear transform and is standard Gaussian) and independent component analysis (ICA, where is again linear and is factorized and heavy-tailed).
In 2014, Dinh et al. [12] proposed non-linear independent component estimation (NICE), as a generalization of ICA. NICE is considered the first normalizing flow with the introduction of the additive coupling to ease the calculation of the Jacobian determinant. To make flow-based models more suitable for image-related tasks, Dinh et al. [13] extended NICE to RealNVP, which admits a multi-scale autoregressive architecture, implemented by squeezing and affine coupling. Kingma and Dhariwal [22] introduced the invertible convolution (i.e., the linear transform in PCA) to replace the fixed random permutation for splitting the channel dimension during multi-scale processing. The batch normalization in RealNVP is also replaced with activation normalization (i.e., actnorm). To allow unconstrained architectural design, Grathwohl et al. [16] leveraged the Hutchinson’s trace estimator for scalable and unbiased estimation of the log-density. Similarly, Behrmann et al. [4] proposed invertible residual networks (i-ResNet), introducing a tractable estimation to the Jacobian log-determinant of a residual block. Other representative normalizing flow work includes hierarchical recursive coupling [23] for increasing flow expressiveness, Wavelet Flow [53] for scaling flow to ultra-high dimensional data, and Discrete Flow [48] for discrete data modeling. In this paper, we do not use normalizing flow for generative modeling, but for invertible feature transform.
3 Proposed CD-Flow
In this section, we detail our proposed CD metric, CD-Flow, consisting of two key components: the feature transform and the distance measure [32, 29]. The feature transform is built upon a variant of RealNVP [13], which is a learnable invertible transformation between input data and samples from a pre-fixed latent distribution. The CD distance is then computed using the Euclidean distance.
3.1 Problem Definition
We denote the RGB image space as with an unknown distribution and the transformed representation space as with a latent distribution . We are given a training dataset , where form the -th image pair of the same visual content but different color appearances, represents the corresponding human perceptual CD collected from a subjective experiment, and is the number of training pairs. Our goal is to learn a normalizing flow-based invertible and differentiable transform , which maps RGB images to latent representations with Gaussian conditionals for CD assessment.
3.2 CD-Flow
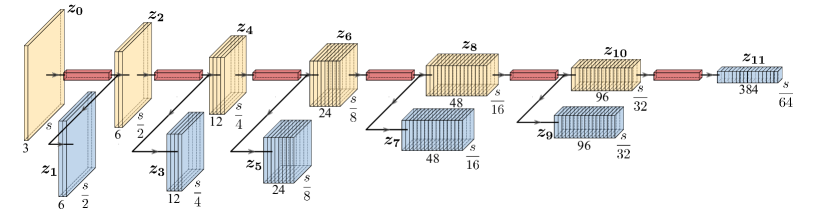
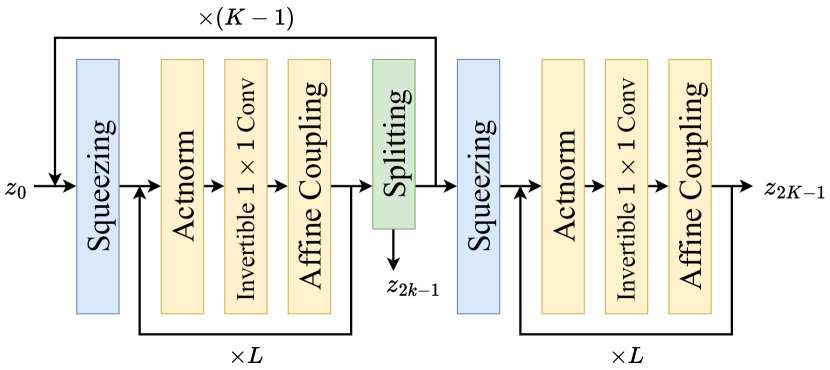
Feature Transform. Figure 1 illustrates the system diagram of the multi-scale autoregressive normalizing flow for the feature transform, which consists of scales of flow processing: for multi-scale color and form interaction and abstraction. At the -th scale, is processed and split into and , the latter of which further undergoes the -th scale of processing and splitting. At the final -th scale, we only process to without splitting. By this notation, we assume that is the input RGB image. The probability density of the latent representation can then be conditionally factorized as
| (1) |
The second equality is due to the bijectivity of the normalizing flow. , for , can conveniently be modeled as conditionally independent Gaussians. That is, the mean vector and the diagonal covariance matrix are computed from through say a tiny neural network [13]. Similarly, is modeled as (unconditionally) independent Gaussians, where the parameters are directly estimated via backpropagation. As shown in Figure 2, each scale of flow processing consists of a squeezing operation, multiple flow steps, and a splitting operation. Each flow step is further decomposed into three operations: actnorm, invertible convolution, and affine coupling.
-
•
Actnorm is introduced to replace the batch normalization to avoid degenerated performance when the mini-batch size is small. Given an input of size , the output of the same size can be computed by
(2) with the log-determinant . are learnable scaling and bias parameters.
-
•
Invertible Convolution is a learnable linear transform for channel mixing. Given a input and a weight matrix , we have
(3) with the log-determinant .
-
•
Affine Coupling constrains its Jacobian to be a triangular matrix, which facilitates the log-determinant computation. Specifically, the input of dimensions is first split into two non-overlapping subsets: and , where . The output of the same dimension can be computed by
(4) where and are the scaling and translation functions, respectively, which are not necessarily invertible. The inverse is easily and analytically derived as
(5)
CD Distance. We adopt the Euclidean distance, i.e., the square root of mean squared differences between two latent color representations and , as the CD distance between two input images and :
| (6) |
| Method | Perfectly aligned pairs | Non-perfectly aligned pairs | All | ||||||
|---|---|---|---|---|---|---|---|---|---|
| STRESS | PLCC | SRCC | STRESS | PLCC | SRCC | STRESS | PLCC | SRCC | |
| CIELAB [45] | |||||||||
| CIE94 [34] | |||||||||
| CIEDE2000 [29] | |||||||||
| S-CIELAB [57] | |||||||||
| Hong06 [18] | |||||||||
| Ouni081 [39] | |||||||||
| Jaramillo19 [38] | |||||||||
| SSIM [49] | |||||||||
|
F |
|||||||||
| PieAPP [44] | |||||||||
| LPIPS [56] | |||||||||
| DISTS [10] | |||||||||
| Chou07 [8] | |||||||||
| Butteraugli [1] | |||||||||
| CD-Net [51] | |||||||||
| CD-Flow | |||||||||
-
1
The spatial extension of CIEDE2000.
3.3 Loss Function
It is straightforward to measure the -norm induced distance between the predicted CD computed by Eq. (6) and the perceptual CD of the given image pair :
| (7) |
To encourage the robustness of CD-Flow to mild geometric distortions, which are often unavoidable in practice, we introduce a multi-scale version of Eq. (7) to put more emphasis on coarser-scale latent representations:
| (8) |
where
| (9) |
, and is the number of feature dimensions of . That is, makes an estimate of using the -th to -th scale latent representations, and we have equal to in Eq. (6).
It is noteworthy that if the transform is supervised by the CD loss in Eq. (8) solely, the bijectivity of may not be necessarily guaranteed. This is because the adopted normalizing flow is not bijective by design. For example, the “invertible ” convolution as the channel mixer becomes non-invertible when is degenerate. Empirically, we observe that the scaling factor of the affine-coupling layer is close to zero after optimizing Eq. (8). Since the inverse transform includes operations of dividing by the scaling factor, there will easily result in the exploding inverse problem [5]. Thus, we incorporate the commonly used maximum likelihood objective in normalizing flow [40] into our training objective. We work with the negative log-likelihood loss:
| (10) | ||||
During training, we randomly sample a mini-batch from the training dataset in each iteration, and make use of a variant of stochastic gradient descent to optimize the parameters in CD-Flow:
| (11) |
where denotes the cardinality of , and is the trade-off to balance the magnitudes of different loss terms.
| Method | Translation | Rotation | Dilation | ||||||
|---|---|---|---|---|---|---|---|---|---|
| STRESS | PLCC | SRCC | STRESS | PLCC | SRCC | STRESS | PLCC | SRCC | |
| CIELAB[45] | |||||||||
| CIE94[34] | |||||||||
| CIEDE2000[29] | |||||||||
| CD-Net[51] | |||||||||
| CD-Flow | |||||||||
4 Experiments
In this section, we begin by presenting the experimental setups. We then compare the proposed CD-Flow with CD measures. We last conduct extensive ablation studies to justify the key designs of CD-Flow.
4.1 Experimental Setups
CD Dataset. We conduct experiments on SPCD [51], so far the largest natural image dataset tailored for perceptual CD assessment. SPCD consists of color images out of distinct natural scenes spanning a variety of realistic shooting scenarios. A total of image pairs are sampled for human labeling, where are non-perfectly aligned image pairs. For each image pair, there are human ratings. We randomly split , , and of image pairs in SPCD as training, validation, and test sets, respectively, according to the image content to ensure content independence.
Network Architecture. We employ a variant of RealNVP [22], which consists of scales, and each scale includes a squeezing operation, steps of flow, and a splitting operation. We do not split at the last scale. The squeezing operation trades the spatial size for the channel number by transforming an tensor to an tensor, where is the spatial size and is the number of channels. The splitting operation divides the latent representation of the same scale into two halves along the channel dimension. One is used as the color features for CD assessment, and the other is subject to further processing.
Training and Testing Details. We employ the Adam as the stochastic optimizer, where the batch size is , and the initial learning rate is with a decay factor of for every epochs. We train CD-Flow for epochs in total.
Evaluation Criteria. We use three standard criteria to quantify the performance of CD-Flow against existing CD measures, including the standardized residual sum of squares (STRESS) [15], Pearson linear correlation coefficient (PLCC), and Spearman’s rank correlation coefficient (SRCC). STRESS measures both prediction accuracy and statistical significance, which is defined by
| (12) |
where is the number of test pairs and is the scale correction factor between and , defined as
| (13) |
STRESS generally ranges from to , where a small value suggests a tight-fitting between model predictions and ground truths. SRCC and PLCC measure the prediction monotonicity and prediction linearity, respectively. Before calculating PLCC, we linearize model predictions by regressing a four-parameter monotonic function.
4.2 Main Results
SPCD Results. We compare the proposed CD-Flow with existing CD measures which can be grouped into four categories: 1) CD measures for homogeneous color patches: CIELAB [45], CIE94 [34] and CIEDE2000 [29], 2) CD measures for natural images: S-CIELAB [57], Hong06 [18], Ouni08 [39], Jaramillo19 [38] and CD-Net [51], 3) full-reference image quality model: SSIM [49], F LIP [3], PieAPP[44], LPIPS [56] and DISTS [10], and 4) JND methods: Chou07 [8] and Butteraugli [1]. We employ official implementations of Butteraugli and F LIP, and retrain PieAPP, LPIPS, and DISTS on the same training set as CD-Flow. The rest methods are implemented and made publicly available by Jaramillo et al. [38].
The comparison results are documented in Table 1. Several interesting observations merit attention. First, CIE94 and CIEDE2000 rectify the non-uniformity of CIELAB on color patches by incorporating weight coefficients. Nonetheless, when it comes to natural photographic images, these approaches do not show noticeable improvements compared to the original CIELAB formula. This provides a strong indication that humans perceive CDs of uniformly colored patches and natural images in drastically different manners. Naïve extensions such as spatial filtering and texture grouping may not be sufficient to bridge the gap as evidenced by the results in the second section of Table 1. Second, despite being retrained on the same training set as CD-Flow, general-purpose DNN-based image quality models PieAPP [44], LPIPS [56], and DISTS [10] do not deliver comparable performance. We believe this arises for PieAPP because it requires a much larger labeled set to support training from scratch, and training pairs, even with data augmentation, are less likely to overcome overfitting. LPIPS and DISTS rely on pre-trained VGG features, which are empirically proven to be more structure and texture inductive. As a result, they may be less ideal for assessing CDs. Third, DNN-based CD formulae, i.e., CD-Net [51] and CD-Flow, outperform all other competing models, which are primarily attributed to their superior representation learning capabilities. This observation confirms the potential of employing DNNs in the field of color science. Fourth, CD-Flow achieves the most remarkable results, thereby demonstrating the promise of the multi-scale autoregressive normalizing flow for CD assessment.
Robustness Results to Geometric Distortions. We conduct experiments to evaluate the robustness of CD-Flow to mild geometric distortions, including translation, rotation, and dilation. Specifically, we translate randomly one image with respect to the other image in an image pair by up to pixels in both horizontal and vertical directions, rotate randomly one image clockwise by up to , and zoom in one image by a factor of . The corresponding results are presented in Table 2. We find that the performance of all models degrades due to the presence of geometric distortions. CIELAB-based formulae are particularly sensitive to geometric distortions because of pixel-by-pixel CD computation. In contrast, CD-Flow demonstrates the best robustness results, which is as expected because it is designed to abstract color features, characterized by the interdependence between color and form for CD assessment.
| Method | STRESS | PLCC | SRCC |
|---|---|---|---|
| CIEDE2000 [29] | |||
| PieAPP [44] | |||
| LPIPS [56] | |||
| DISTS [10] | |||
| CD-Net [51] | |||
| CD-Flow |
Generalizability Results on Other Datasets. We examine the generalizability of CD-Flow on the COM dataset [29] and the TID2013 subset [42]. The COM dataset consists of four subsets: BFD-P [31], Leeds [21], Witt [52], and RIT-DuPont [7], which include uniformly colored patches used for the development of CIEDE2000. The comparison results are reported in Table 3. It is clear that two DNN-based CD models perform better than CIELAB on the COM dataset, despite not being exposed to color patch data during training. Although underperforming CIE94 and CIEDE2000, CD-Flow exhibits better generalization compared to CD-Net. We then test the generalizability of the TID2013 subset, which contains three types of color-related distortions: quantization noise, image color quantization with dither, and chromatic aberration. Table 4 lists the comparison results. We find that CD-Flow performs much better than the best-performing CIELAB-based CD formula CIEDE2000, and is on par with general-purpose image quality methods LPIPS and DISTS, which may have been exposed to similar distortion appearances during training. All these results constitute supportive evidence that the multi-scale autoregressive normalizing flow provides a compelling embodiment of the hypothesis: “color and form are inextricably interdependent as a unitray process of perceptual organization [46, 19].”
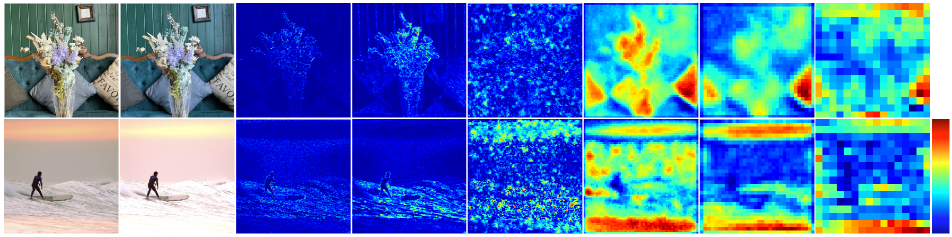
Visualization of Local CD Maps. We further visualize the multi-scale local CD maps generated by CD-Flow, as illustrated in Figure 3. Our observations are as follows. First, local CDs are generally small at the first three scales compared to those at later scales, indicating that CD-Flow indeed relies more on coarser-scale representations to assess perceptual CDs, as encouraged by the multi-scale training objective in Eq. (8). Second, interestingly, the effects of single-opponent and double-opponent cells emerge in the computation of CD-Flow. At coarser scales, local CDs are evaluated over a large image area, and exhibit reasonable sensitivity, resembling single-opponent cells in V1. At finer scales, local CDs are more responsive to textures and boundaries, consistent with the response characteristics of double-opponent cells in V1.
| # of flow steps | STRESS | PLCC | SRCC |
|---|---|---|---|
| # of scales | STRESS | PLCC | SRCC |
|---|---|---|---|
4.3 Ablation Studies
We conduct two ablation experiments to evaluate the key design choices of CD-Flow. First, we study the impact of the number of flow steps (i.e., the hyperparameter ) on the model performance. In Table 5, we find that the performance of CD-Flow increases with the number of flow steps, which in turn expands the non-linear representational capacity of CD-Flow. Nevertheless, too many steps may substantially increase the computational complexity, and negatively impact generalization as well due to potential overfitting. We select as the default setting to strike a good balance between model performance and complexity. Next, we examine the effect of the number of scales (i.e., the hyperparameter ) on the model performance. Table 6 reports the results. We find that increasing the number of scales from to significantly improves the CD assessment performance. However, further increasing does not bring extra performance improvements, not as the case of increasing . We attribute this to the setting of the current training input resolution (i.e., ). When and at the coarsest scale, we are essentially comparing the difference of two “globally averaged” color values over the entire images, which is less biologically plausible and less practically meaningful.
5 Conclusion
We have introduced CD-Flow, a normalizing flow-based CD metric for photographic images. Our approach is inspired by the scientific evidence that humans perceive color based on the interdependence of color and form in images. We utilized a multi-scale autoregressive normalizing flow to learn a coordinate transform, followed by computing the Euclidean distance in the transformed space. Remarkably, the learned feature transform enjoys four desirable properties: 1) consistent with the working mechanism of human color perception, 2) proper as a mathematical metric, 3) accurate to explain human data of perceptual CDs, and 4) robust to slight geometric distortions. We hope that the proposed CD-Flow can benefit related fields in imaging/illumination, vision science, and color science.
Acknowledgement
We would like to thank Keshuo Xu for the technical support and code sharing. This work was supported in part by the National Natural Science Foundation of China under Grant 62071407, the Hong Kong ITC Innovation and Technology Fund (9440288), and the CUHKSZ University Development Fund (UDF01002437).
References
- [1] Jyrki Alakuijala, Robert Obryk, Ostap Stoliarchuk, Zoltan Szabadka, Lode Vandevenne, and Jan Wassenberg. Guetzli: Perceptually guided JPEG encoder. arXiv preprint arXiv:1703.04421, 2017.
- [2] Liliana Albertazzi, Gert J. Van Tonder, and Dhanraj Vishwanath. Perception Beyond Inference: The Information Content of Visual Processes. MIT Press, 2011.
-
[3]
Pontus Andersson, Jim Nilsson, Tomas Akenine-Möller, Magnus Oskarsson,
Kalle Åström, and Mark D. Fairchild.
LIP: A difference evaluator for alternating images. ACM on Computer Graphics and Interactive Techniques, 3(2):1–23, 2020.
F
- [4] Jens Behrmann, Will Grathwohl, Ricky T. Q. Chen, David Duvenaud, and Jörn-Henrik Jacobsen. Invertible residual networks. In International Conference on Machine Learning, pages 573–582, 2019.
- [5] Jens Behrmann, Paul Vicol, Kuan-Chieh Wang, Roger Grosse, and Jörn-Henrik Jacobsen. Understanding and mitigating exploding inverses in invertible neural networks. In International Conference on Artificial Intelligence and Statistics, pages 1792–1800, 2021.
- [6] Ohad Ben-Shahar and Steven W. Zucker. Hue geometry and horizontal connections. Neural Networks, 17(5-6):753–771, 2004.
- [7] Roy S. Berns, David H. Alman, Lisa Reniff, Gregory D. Snyder, and Mitchell R. Balonon-Rosen. Visual determination of suprathreshold color-difference tolerances using probit analysis. Color Research & Application, 16(5):297–316, 1991.
- [8] Chun-Hsien Chou and Kuo-Cheng Liu. A fidelity metric for assessing visual quality of color images. In International Conference on Computer Communications and Networks, pages 1154–1159, 2007.
- [9] Frank J. J. Clarke, Roderick McDonald, and Bryan Rigg. Modification to the JPC79 colour–difference formula. Journal of the Society of Dyers and Colourists, 100(4):128–132, 1984.
- [10] Keyan Ding, Kede Ma, Shiqi Wang, and Eero P. Simoncelli. Image quality assessment: Unifying structure and texture similarity. IEEE Transactions on Pattern Analysis and Machine Intelligence, 44(5):2567–2581, 2020.
- [11] Keyan Ding, Kede Ma, Shiqi Wang, and Eero P. Simoncelli. Comparison of full-reference image quality models for optimization of image processing systems. International Journal of Computer Vision, 129(4):1258–1281, 2021.
- [12] Laurent Dinh, David Krueger, and Yoshua Bengio. NICE: Non-linear independent components estimation. In International Conference on Representations Workshops, 2015.
- [13] Laurent Dinh, Jascha Sohl-Dickstein, and Samy Bengio. Density estimation using real NVP. In International Conference on Learning Representations, 2017.
- [14] Chen Gao, Karen Panetta, and Sos Agaian. No reference color image quality measures. In IEEE International Conference on Cybernetics, pages 243–248, 2013.
- [15] Pedro A. Garcia, Rafael Huertas, Manuel Melgosa, and Guihua Cui. Measurement of the relationship between perceived and computed color differences. Journal of the Optical Society of America A, 24(7):1823–1829, 2007.
- [16] Will Grathwohl, Ricky T. Q. Chen, Jesse Bettencourt, Ilya Sutskever, and David Duvenaud. FFJORD: Free-form continuous dynamics for scalable reversible generative models. International Conference on Learning Representations, 2019.
- [17] Thorsten Hansen, Maria Olkkonen, Sebastian Walter, and Karl R. Gegenfurtner. Memory modulates color appearance. Nature Neuroscience, 9(11):1367–1368, 2006.
- [18] Guowei Hong and Ming Ronnier Luo. New algorithm for calculating perceived colour difference of images. The Imaging Science Journal, 54(2):86–91, 2006.
- [19] Gaetano Kanizsa. Organization in Vision: Essays on Gestalt Perception. Praeger Publishers, 1979.
- [20] David Katz. The World of Colour. Routledge, 1935.
- [21] Dong-Ho Kim. New weighting functions for the modified CIELAB colour-difference formulae. Textile Coloration and Finishing, 9(6):51–57, 1997.
- [22] Durk P. Kingma and Prafulla Dhariwal. Glow: Generative flow with invertible 1x1 convolutions. Neural Information Processing Systems, 2018.
- [23] Jakob Kruse, Gianluca Detommaso, Ullrich Köthe, and Robert Scheichl. HINT: Hierarchical invertible neural transport for density estimation and bayesian inference. AAAI Conference on Artificial Intelligence, pages 8191–8199, 2021.
- [24] Edwin H. Land. The retinex theory of color vision. Scientific American, 237(6):108–129, 1977.
- [25] Dohyoung Lee and Konstantinos N. Plataniotis. Towards a novel perceptual color difference metric using circular processing of hue components. In IEEE International Conference on Acoustics, Speech, & Signal Processing, pages 166–170, 2014.
- [26] Sang-Mi Lee, John Haozhong Xin, and Stephen Westland. Evaluation of image similarity by histogram intersection. Color Research & Application, 30(4):265–274, 2005.
- [27] Peter Lennie. Color coding in the cortex. Color Vision: From Genes to Perception, pages 235–247, 1999.
- [28] Ming Ronnier Luo. Colour science: Past, present and future. Colour Imaging Vision and Technology, pages 381–404, 1999.
- [29] Ming Ronnier Luo, Guihua Cui, and Bryan Rigg. The development of the CIE 2000 colour-difference formula: CIEDE2000. Color Research & Application, 26(5):340–350, 2001.
- [30] Ming Ronnier Luo and Bryan Rigg. Chromaticity-discrimination ellipses for surface colours. Color Research & Application, 11(1):25–42, 1986.
- [31] Ming Ronnier Luo and Bryan Rigg. BFD(:) colour-difference formula. Journal of the Society of Dyers and Colourists, 103(2):86–94, 1987.
- [32] Marc Mahy, Luc Van Eycken, and André Oosterlinck. Evaluation of uniform color spaces developed after the adoption of CIELAB and CIELUV. Color Research & Application, 19(2):105–121, 1994.
- [33] Roderick McDonald. Industrial pass/fail colour matching. Journal of the Society of Dyers and Colourists, 96(7):372–376, 1980.
- [34] Roderick McDonald and Kenneth J. Smith. CIE94-A new colour-difference formula. Journal of the Society of Dyers and Colourists, 111(12):376–379, 1995.
- [35] Anish Mittal, Anush Krishna Moorthy, and Alan C. Bovik. No-reference image quality assessment in the spatial domain. IEEE Transactions on Image Processing, 21(12):4695–4708, 2012.
- [36] Anish Mittal, Rajiv Soundararajan, and Alan C. Bovik. Making a “completely blind” image quality analyzer. IEEE Signal Processing Letters, 20(3):209–212, 2012.
- [37] Ken Nakayama and Shinsuke Shimojo. Experiencing and perceiving visual surfaces. Science, 257(5075):1357–1363, 1992.
- [38] Benhur Ortiz-Jaramillo, Asli Kumcu, Ljiljana Platisa, and Wilfried Philips. Evaluation of color differences in natural scene color images. Signal Processing: Image Communication, 71:128–137, 2019.
- [39] Sonia Ouni, Ezzeddine Zagrouba, Majed Chambah, and Michel Herbin. A new spatial colour metric for perceptual comparison. In International Conference on E-Systems Engineering, Communication and Information, pages 413–428, 2008.
- [40] George Papamakarios, Eric T. Nalisnick, Danilo Jimenez Rezende, Shakir Mohamed, and Balaji Lakshminarayanan. Normalizing flows for probabilistic modeling and inference. Journal of Machine Learning Research, 22(57):1–64, 2021.
- [41] Marius Pedersen and Jon Yngve Hardeberg. A new spatial hue angle metric for perceptual image difference. In International Workshop on Computational Color Imaging, pages 81–90, 2009.
- [42] Nikolay Ponomarenko, Lina Jin, Oleg Ieremeiev, Vladimir Lukin, Karen Egiazarian, Jaakko Astola, Benoit Vozel, Kacem Chehdi, Marco Carli, Federica Battisti, and Chung-Chieh Jay Kuo. Image database TID2013: Peculiarities, results and perspectives. Signal Processing: Image Communication, 30:57–77, 2015.
- [43] Charles A. Poynton. A Technical Introduction to Digital Video. John Wiley & Sons, Inc., 1996.
- [44] Ekta Prashnani, Hong Cai, Yasamin Mostofi, and Pradeep Sen. PieAPP: Perceptual image-error assessment through pairwise preference. In IEEE Conference on Computer Vision and Pattern Recognition, pages 1808–1817, 2018.
- [45] Alan R. Robertson. The CIE 1976 color-difference formulae. Color Research & Application, 2(1):7–11, 1977.
- [46] Robert Shapley and Michael J. Hawken. Color in the cortex: Single-and double-opponent cells. Vision Research, 51(7):701–717, 2011.
- [47] Steven K. Shevell and Frederick A. A. Kingdom. Color in complex scenes. Annual Review of Psychology, 59:143–166, 2008.
- [48] Dustin Tran, Keyon Vafa, Kumar Agrawal, Laurent Dinh, and Ben Poole. Discrete flows: Invertible generative models of discrete data. Advances in Neural Information Processing Systems, 2019.
- [49] Zhou Wang, Alan C. Bovik, Hamid R. Sheikh, and Eero P. Simoncelli. Image quality assessment: From error visibility to structural similarity. IEEE Transactions on Image Processing, 13(4):600–612, 2004.
- [50] Zhou Wang and Eero P. Simoncelli. Reduced-reference image quality assessment using a wavelet-domain natural image statistic model. In Human Vision and Electronic Imaging X, pages 149–159, 2005.
- [51] Zhihua Wang, Keshuo Xu, Yang Yang, Jianlei Dong, Shuhang Gu, Lihao Xu, Yuming Fang, and Kede Ma. Measuring perceptual color differences of smartphone photography. IEEE Transactions on Pattern Analysis and Machine Intelligence, 2023.
- [52] Klaus Witt. Geometric relations between scales of small colour differences. Color Research & Application, 24(2):78–92, 1999.
- [53] Jason J. Yu, Konstantinos G. Derpanis, and Marcus A. Brubaker. Wavelet flow: Fast training of high resolution normalizing flows. Advances in Neural Information Processing Systems, pages 6184–6196, 2020.
- [54] Ming Yu, Huijuan Liu, Yingchun Guo, and Dongming Zhao. A method for reduced-reference color image quality assessment. In International Conference on Image and Signal Processing, pages 1–5, 2009.
- [55] Lin Zhang, Ying Shen, and Hongyu Li. VSI: A visual saliency-induced index for perceptual image quality assessment. IEEE Transactions on Image Processing, 23(10):4270–4281, 2014.
- [56] Richard Zhang, Phillip Isola, Alexei A. Efros, Eli Shechtman, and Oliver Wang. The unreasonable effectiveness of deep features as a perceptual metric. In IEEE Conference on Computer Vision and Pattern Recognition, pages 586–595, 2018.
- [57] Xuemei Zhang and Brian A. Wandell. A spatial extension of CIELAB for digital color-image reproduction. Journal of the Society for Information Display, 5(1):61–63, 1997.