Finite temperature effects on the structural stability of Si-doped HfO2 using first-principles calculations
Abstract
The structural stabilities of the monoclinic and tetragonal phases of Si-doped HfO2 at finite temperatures were analyzed using a computational scheme to assess the effects of impurity doping. The finite temperature effects considered in this work represented lattice vibration and impurity configuration effects. The results show that 6% Si doping stabilizes the tetragonal phase at room temperature, although a higher concentration of Si is required to stabilize the tetragonal phase at zero temperature. These data indicate that lattice vibration and impurity configuration effects are important factors determining structural stability at finite temperatures.
I Introduction
Hafnium-based materials, typically HfO2, have found numerous applications in the semiconductor industry as high-k dielectric compounds Wilk et al. (2001) and are also promising ferroelectric and antiferroelectric materials Park et al. (2015). These compounds were first employed in the 200s, such as during the 45 nm technology node in 2007 Mistry et al. (2007) and in certain earlier applications in dynamic random-access memory Kim and Popovici (2018). The application of high-k materials allowed the continued scaling of various devices by suppressing the gate leakage associated with greater physical thicknesses exhibited by conventional SiO2 dielectric materials. Since then, HfO2 and analogues obtained by doping have become crucial components of many advanced device structures, ranging from gate-all-around transistors Ernst et al. (2006) to post-silicon 2D channels such as transition metal dichalcogenides Li et al. (2019); Xia et al. (2017).
The exceptional electronic properties of HfO2 appear primarily in the tetragonal and orthorhombic phases. Notably, the dielectric constant, , of tetragonal HfO2 is and so is approximately twice that of stable monoclinic HfO2 Tomida et al. (2006). However, the tetragonal and orthorhombic phases are not stable at room temperature Wang et al. (1992); Tomida et al. (2006). Consequently, to allow the application of these materials in various devices, it is important to develop techniques to stabilize the tetragonal phase.
Techniques for controlling the phase have been developed through doping of impurities at different concentration. As an example, a prior study produced a Si-doped HfO2 thin film having a ferroelectric orthogonal structure Böscke et al. (2011a, b). Additionally, recent experimental work fabricated heterogeneous Hf1-xZrxO2 almost entirely composed of a non-monoclinic phase using physical vapor deposition with a composition depth profile suggested by a machine learning model (that is, using Bayesian optimization) Ni and Matsui (2022). Fischer et al. studied doping with the group IV elements Si, C, Ge, Sn, Ti and Ce into bulk HfO2 Fischer and Kersch (2008a, b) and found that Si and Ge stabilize the tetragonal structure. Doping with Si, P, Ge, Al, Y, Ti, Zr, Gd and Sc was also investigated in HfO2 by Lee et al. Lee et al. (2008), who identified the microscopic mechanisms by which these dopants stabilize the tetragonal structure on the basis of ionic radii. In other work Barabash (2017), possible metastable phases of HfO2 were analyzed using first-principles calculations. As well, a systematic screening of dopants capable of inducing ferroelectric characteristics in HfO2 has been performed Batra et al. (2017).
When assessing the viability of synthesizing a particular phase, a theoretical analysis of the structural stability at finite temperatures is required. In addition, the total energies obtained from first-principles calculations based on density functional theory indicate structural stability at zero temperature. To investigate the stabilization imparted by doping with impurities at finite temperatures, it is necessary to consider both lattice vibration effects and impurity configuration effects. In a previous study Fischer and Kersch (2008b), calculations were performed that incorporated the lattice vibrational free energy based on considering phonon dispersion. Typically, the impurity configuration is assumed to be homogeneous, such that the impurity atoms are periodically aligned within the host lattice. Recently the authors performed a systematic search for elements capable of stabilizing HfO2 and ZrO2 using first-principles calculations Harashima et al. (2022). In this prior work, several impurity atoms were included in a supercell and the total energies for all possible impurity configurations in the supercell were estimated. In this manner, the most stable configuration at zero temperature was ascertained. The results indicated that Si substituted at 6 % was aligned along linearly and thus not homogeneously distributed throughout the host matrix, suggesting that the dopant configuration cannot be neglected when calculating energy values.
The present study investigated the finite temperature phase stability of Si-doped HfO2, based on a computational scheme that simultaneously considered lattice vibration and impurity configuration effects. On the basis of the results, the transformation between the tetragonal and monoclinic phases of HfO2 in association with Si doping is discussed. The data indicate that 6% Si doping stabilizes the tetragonal structure at room temperature while the monoclinic structure is the most stable at zero temperature.
II Methods
This work determined the free energies of impurity substituted systems considering impurity configurations and lattice vibrations. The calculations are based on a system having impurity configuration and lattice vibrational degrees of freedom . The state of is dependent on but this relationship is not explicitly written. In this process, the partition function is expressed as the sum over all possible of , written as
| (1) | ||||
| (2) | ||||
| (3) |
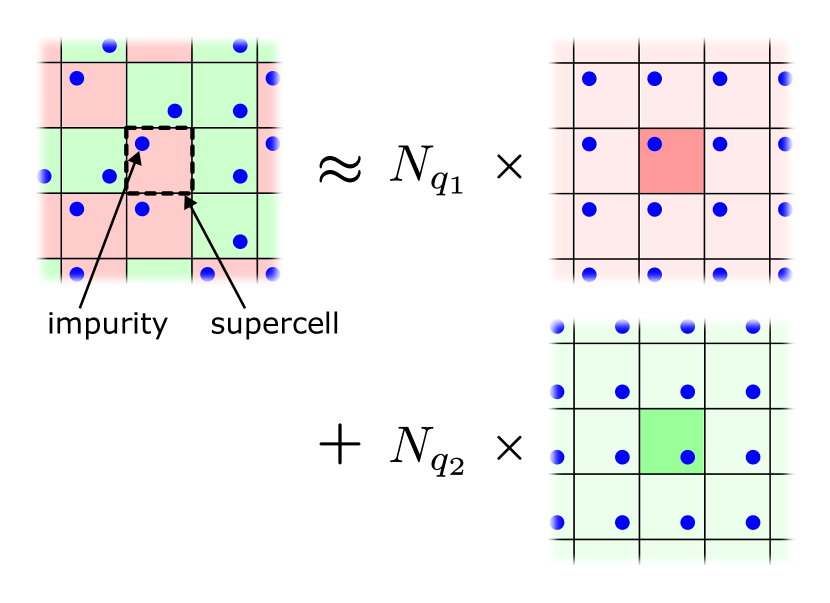
Here, denotes the electronic and vibrational energy of the configuration and is the partition function for this configuration. It is not feasible to calculate the exact value of or even of because the system size is very large (or even infinite at the thermodynamic limit). Therefore, the system is separated into supercells and the energy of the overall system is approximated by summing over these supercells. This process can be expressed in terms of as
| (4) |
In this case, the impurities are distributed in each supercell . The energies for a single supercell can be approximated as the energies for a system of periodically aligned impurities (see Fig. 1). Considering the free energy of a periodically aligned supercell, we can write
| (5) | ||||
| (6) | ||||
| (7) |
Here, denotes the energy of supercell . These energies include contributions from vibrational modes in the approximated periodic system, such that the free energy in cell is
| (8) |
Note that this is the value per supercell. Because the supercell size is finite, there is only a finite number of impurity configuration patterns that need to be considered. The partition function for the overall system is therefore written in terms of the free energy of each pattern as
| (9) | ||||
| (10) | ||||
| (11) |
where is the proportion of cells having pattern in the entire system and is the number of supercells which, as noted, will be huge or even infinite at the thermodynamic limit. The energy value is approximated by summing over the patterns and the summation over can be obtained by summation over , as when going from Eq. (10) to (11). Using Stirling’s approximation, the weight can be estimated as
| (12) |
denotes . Substituting Eq. (12) to Eq. (11), we obtain
| (13) |
At the thermodynamic limit (), the most probable set is realized and this set satisfies the conditions
| (14) | |||
| (15) |
By solving this equation, we obtain
| (16) |
The dominant contribution in Eq. (13) is given by the set of Eq. (16). Taking the logarithm, the free energy per supercell can be written as
| (17) |
This formula includes the contributions of configurational entropy, by summing over , and of vibrational free energy via . The derivation of this formula is similar to that of the canonical ensemble but uses , instead of energy.
III Results and Discussion
The relationships derived in the preceding section were employed to analyze the phase stability of Si-doped HfO2. HfO2 can exist as a monoclinic phase having a low dielectric constant or a tetragonal phase having a high dielectric constant. The former is stable at room temperature and the transformation from the monoclinic to the tetragonal phases occurs at 2052 K Wang et al. (2006). Here, the free energy values for both phases at finite temperatures were compared.
The term was obtained using first-principles calculations, employing the Vienna Ab initio Simulation Package (VASP) based on the projector augmented-wave method Blöchl (1994); Kresse and Furthmüller (1996); Kresse and Joubert (1999). The generalized gradient approximation was also employed for the exchange-correlation energy functional Perdew et al. (1996). The crystal structures were numerically optimized based on preserving the lattice symmetry of the pristine compound and applying and for the tetragonal phase and and for the monoclinic phase. Each dimension of the supercell was twice that of the conventional cell ( of the conventional cell), which contains 96 atoms in total. The impurity configuration patterns could be classified into several groups based on spatial symmetry. As an example, 2 Hf substitutions in the tetragonal supercell can produce impurity configurations that can be classified into nine symmetrically equivalent groups. The supercell code Okhotnikov et al. (2016) was used to identify these groups. The configurations are separated into 128 patterns 2 groups, 64 patterns 2 groups, 32 patterns 2 groups, and 16 patterns 3 groups. 2 Hf substitution into the monoclinic supercell produces 23 groups which contains and groups. In the case of practical calculations (that is, for 2 Hf substitutions in the tetragonal structure), Eq. (17) is estimated as
| (18) | ||||
| (19) |
such that nine values can be calculated using first-principles calculations as explained below. By comparing for the tetragonal and monoclinic phases, the effect of temperature on phase stability and the structural transformation temperature could be obtained.
In this study, the vibrational free energy of each impurity configuration, , was estimated using the Debye-Grüneisen model Moruzzi et al. (1988) based on the equations
| (20) | |||
| (21) |
and
| (22) |
where and are the Debye temperature and Debye function, respectively. and are averaged volume and mass per atom in supercell, and is a bulk modulus. The free energy term in Eq. (20) is calculated by first ascertaining the bulk modulus. This can be accomplished by considering the Murnaghan equation of states
| (23) | |||
| (24) |
The total energies were calculated for volumes expanded and contracted from the stable structure by several percent and and were obtained by regression of these total energies. The stable lattice structure for a given temperature was determined as the minimum value of Eq. (20) and the free energy values were estimated for an arbitrary temperature. It should be noted that the present approach involved a systematic error. Specifically, the structural transformation temperatures for pristine HfO2 and ZrO2 were estimated using this process as benchmarks and values of 1000 K and 750 K were obtained. These values are scaled by a factor of 2 with respect to the experimental data, and so the calculated transformation temperatures for the doped systems should possible be scaled by a factor of 2 as well. The accuracy of these calculations could possibly be improved by replacing the process used to assess vibrational modes with first-principles phonon calculations Togo and Tanaka (2015); Tadano et al. (2014); Kuwabara et al. (2005); Luo et al. (2009) More sophisticated calculations such as these will be examined in future work.
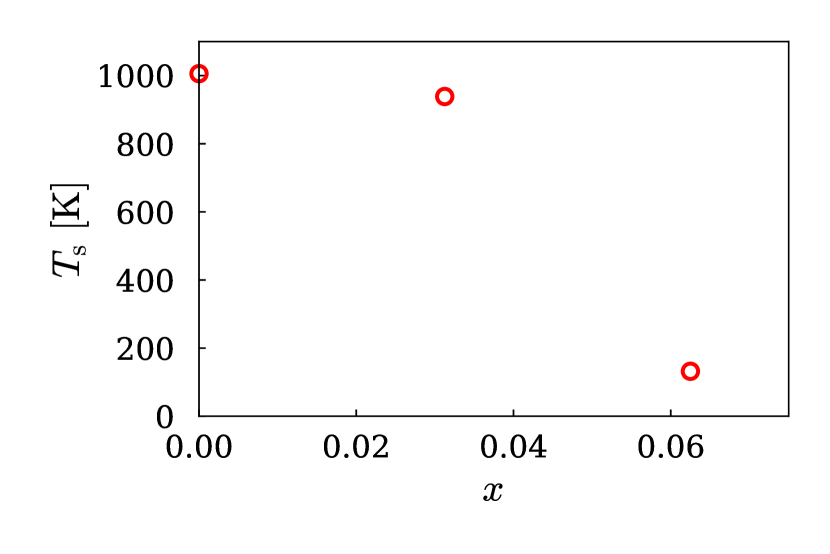
The transformation temperature was estimated based on the crossing point of the free energies of the tetragonal and monoclinic phases. Figure 2 plots the structural transformation temperature of HfO2 versus the extent of Si doping and demonstrates that the correlation between the two is not linear. The value for 3% Si doping is almost the same as that of the pristine compound but rapidly decreases as the extent of substitution increases from 3% to 6%. The decreasing trend against Si concentration is consistent with the results of the previous studies. Fischer and Kersch (2008b) The value determined for 6% substitution was 130 K. Although, as noted, this temperature may be underestimated and could possibly be scaled by a factor of 2, the value would still be lower than room temperature. This finding indicates that a 6% Si-doped HfO2 dielectric layer in a typical device will exist in the tetragonal phase at a normal operating temperature.
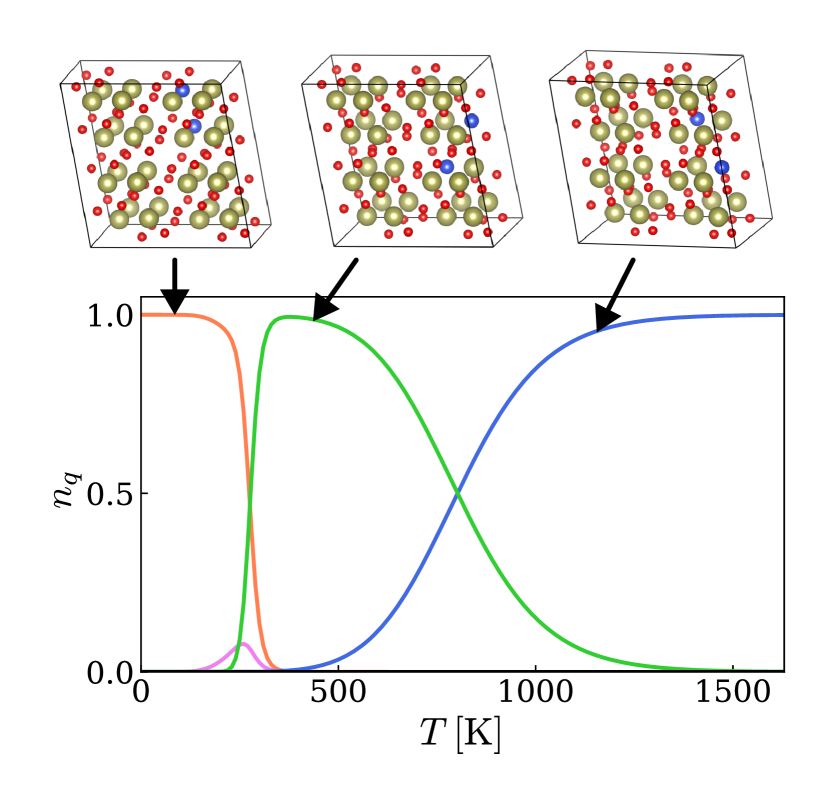
The temperature dependence of the impurity configurations was also examined. The proportion of each impurity configuration in a system defined as in Eq. (16) can be estimated from the calculated for each temperature. In the tetragonal phase, a single configuration (and symmetrically equivalent configurations) was dominant up to K. In contrast, in the case of the monoclinic phase, three impurity configurations appeared depending on temperature. Figure 3 summarizes the effect of temperature on for the monoclinic phase. It is evident that the most stable configuration varied with temperature, indicating that the local structure of the impurities affected phase stability. Even though the calculated transformation temperature was lower than the temperatures at which several configurations were mixed, K or K, the temperatures at which such compounds are synthesized will be similar to or much higher than these values. Hence, it is important to take into account the appearance of several configurations during the synthetic process.
IV Conclusion
This work analyzed the structural stability of Si-doped HfO2 using the scheme that estimated the free energy and considered impurity configurations and lattice vibrations. The present process is evidently a useful means of assessing the phase stability of doped polymorphic compounds. The structural transformation from the monoclinic phase to the tetragonal phase was also investigated based on analyzing the free energy difference. The transformation temperature values indicate that a tetragonal structure with 6% Si doping will be stable at room temperature while a monoclinic structure is more stable at zero temperature. In the case of a device operating at room temperature, doping with 6% Si was found to be sufficient to stabilize the tetragonal HfO2 phase.
In general, the physical properties of a compound will be highly correlated with its crystal structure, as demonstrated by the HfO2 used in this work as a model case. The proposed method in this paper is expected to be applicable to a variety of scenarios. As an example, in permanent magnets, certain compounds exhibit excellent magnetic properties but are unstable and so it is important to stabilize these substances Miyake et al. (2014); Harashima et al. (2016, 2018, 2020). In particular, stabilization at the high temperatures at which these compounds are synthesized has recently attracted much attention Xing et al. (2021). We expect that the method demonstrated herein will be effective in such cases and could be helpful in the search for structural stabilizers.
Acknowledgements.
This work was supported by JSPS KAKENHI grant number JP22K03449. The computation was partly conducted using the facilities of the Supercomputer Center at the Institute for Solid State Physics in the University of Tokyo, the Multidisciplinary Cooperative Research Program at the Center for Computational Sciences in University of Tsukuba, Subsystem B of the ITO system in Kyushu University, and Research Center for Computational Science, Okazaki, Japan (Project: 22-IMS-C104).References
- Wilk et al. (2001) G. D. Wilk, R. M. Wallace, and J. M. Anthony, Journal of Applied Physics 89, 5243 (2001), https://doi.org/10.1063/1.1361065 .
- Park et al. (2015) M. H. Park, Y. H. Lee, H. J. Kim, Y. J. Kim, T. Moon, K. D. Kim, J. Müller, A. Kersch, U. Schroeder, T. Mikolajick, and C. S. Hwang, Advanced Materials 27, 1811 (2015), https://onlinelibrary.wiley.com/doi/pdf/10.1002/adma.201404531 .
- Mistry et al. (2007) K. Mistry, C. Allen, C. Auth, B. Beattie, D. Bergstrom, M. Bost, M. Brazier, M. Buehler, A. Cappellani, R. Chau, C.-H. Choi, G. Ding, K. Fischer, T. Ghani, R. Grover, W. Han, D. Hanken, M. Hattendorf, J. He, J. Hicks, R. Huessner, D. Ingerly, P. Jain, R. James, L. Jong, S. Joshi, C. Kenyon, K. Kuhn, K. Lee, H. Liu, J. Maiz, B. McIntyre, P. Moon, J. Neirynck, S. Pae, C. Parker, D. Parsons, C. Prasad, L. Pipes, M. Prince, P. Ranade, T. Reynolds, J. Sandford, L. Shifren, J. Sebastian, J. Seiple, D. Simon, S. Sivakumar, P. Smith, C. Thomas, T. Troeger, P. Vandervoorn, S. Williams, and K. Zawadzki, in 2007 IEEE International Electron Devices Meeting (2007) pp. 247–250.
- Kim and Popovici (2018) S. K. Kim and M. Popovici, MRS Bulletin 43, 334 (2018).
- Ernst et al. (2006) T. Ernst, C. Dupre, C. Isheden, E. Bernard, R. Ritzenthaler, V. Maffini-Alvaro, J.-C. Barbe, F. De Crecy, A. Toffoli, C. Vizioz, S. Borel, F. Andrieu, V. Delaye, D. Lafond, G. Rabille, J.-M. Hartmann, M. Rivoire, B. Guillaumot, A. Suhm, P. Rivallin, O. Faynot, G. Ghibaudo, and S. Deleonibus, in 2006 International Electron Devices Meeting (2006) pp. 1–4.
- Li et al. (2019) W. Li, J. Zhou, S. Cai, Z. Yu, J. Zhang, N. Fang, T. Li, Y. Wu, T. Chen, X. Xie, K. Ma, Haibo Yan, N. Dai, X. Wu, H. Zhao, Z. Wang, D. He, L. Pan, Y. Shi, P. Wang, W. Chen, K. Nagashio, X. Duan, and X. Wang, Nature Electronics 2, 563 (2019).
- Xia et al. (2017) P. Xia, X. Feng, R. J. Ng, S. Wang, D. Chi, C. Li, Z. He, X. Liu, and K.-W. Ang, Scientific Reports 7, 40669 (2017).
- Tomida et al. (2006) K. Tomida, K. Kita, and A. Toriumi, Applied Physics Letters 89, 142902 (2006), https://doi.org/10.1063/1.2355471 .
- Wang et al. (1992) J. Wang, H. P. Li, and R. Stevens, Journal of Materials Science 27, 5397 (1992).
- Böscke et al. (2011a) T. S. Böscke, J. Müller, D. Bräuhaus, U. Schröder, and U. Böttger, Applied Physics Letters 99, 102903 (2011a), https://doi.org/10.1063/1.3634052 .
- Böscke et al. (2011b) T. S. Böscke, S. Teichert, D. Bräuhaus, J. Müller, U. Schröder, U. Böttger, and T. Mikolajick, Applied Physics Letters 99, 112904 (2011b), https://doi.org/10.1063/1.3636434 .
- Ni and Matsui (2022) Z. Ni and H. Matsui, Japanese Journal of Applied Physics 61, SH1009 (2022).
- Fischer and Kersch (2008a) D. Fischer and A. Kersch, Applied Physics Letters 92, 012908 (2008a), https://aip.scitation.org/doi/pdf/10.1063/1.2828696 .
- Fischer and Kersch (2008b) D. Fischer and A. Kersch, Journal of Applied Physics 104, 084104 (2008b), https://doi.org/10.1063/1.2999352 .
- Lee et al. (2008) C.-K. Lee, E. Cho, H.-S. Lee, C. S. Hwang, and S. Han, Phys. Rev. B 78, 012102 (2008).
- Barabash (2017) S. V. Barabash, J. Comput. Electron. 16, 1227 (2017).
- Batra et al. (2017) R. Batra, T. D. Huan, G. A. J. Rossetti, and R. Ramprasad, Chemistry of Materials 29, 9102 (2017), https://doi.org/10.1021/acs.chemmater.7b02835 .
- Harashima et al. (2022) Y. Harashima, H. Koga, Z. Ni, T. Yonehara, M. Katouda, A. Notake, H. Matsui, T. Moriya, M. K. Si, R. Hasunuma, A. Uedono, and Y. Shigeta, in 2022 International Symposium on Semiconductor Manufacturing (ISSM) (2022) pp. 1–3.
- Wang et al. (2006) C. Wang, M. Zinkevich, and F. Aldinger, Journal of the American Ceramic Society 89, 3751 (2006), https://ceramics.onlinelibrary.wiley.com/doi/pdf/10.1111/j.1551-2916.2006.01286.x .
- Blöchl (1994) P. E. Blöchl, Phys. Rev. B 50, 17953 (1994).
- Kresse and Furthmüller (1996) G. Kresse and J. Furthmüller, Phys. Rev. B 54, 11169 (1996).
- Kresse and Joubert (1999) G. Kresse and D. Joubert, Phys. Rev. B 59, 1758 (1999).
- Perdew et al. (1996) J. P. Perdew, K. Burke, and M. Ernzerhof, Phys. Rev. Lett. 77, 3865 (1996).
- Okhotnikov et al. (2016) K. Okhotnikov, T. Charpentier, and S. Cadars, J. Cheminform. 8, 17 (2016).
- Moruzzi et al. (1988) V. L. Moruzzi, J. F. Janak, and K. Schwarz, Phys. Rev. B 37, 790 (1988).
- Togo and Tanaka (2015) A. Togo and I. Tanaka, Scripta Materialia 108, 1 (2015).
- Tadano et al. (2014) T. Tadano, Y. Gohda, and S. Tsuneyuki, Journal of Physics: Condensed Matter 26, 225402 (2014).
- Kuwabara et al. (2005) A. Kuwabara, T. Tohei, T. Yamamoto, and I. Tanaka, Phys. Rev. B 71, 064301 (2005).
- Luo et al. (2009) X. Luo, W. Zhou, S. V. Ushakov, A. Navrotsky, and A. A. Demkov, Phys. Rev. B 80, 134119 (2009).
- Miyake et al. (2014) T. Miyake, K. Terakura, Y. Harashima, H. Kino, and S. Ishibashi, J. Phys. Soc. Jpn. 83, 043702 (2014).
- Harashima et al. (2016) Y. Harashima, K. Terakura, H. Kino, S. Ishibashi, and T. Miyake, J. Appl. Phys. 120, 203904 (2016).
- Harashima et al. (2018) Y. Harashima, T. Fukazawa, H. Kino, and T. Miyake, J. Appl. Phys. 124, 163902 (2018).
- Harashima et al. (2020) Y. Harashima, T. Fukazawa, and T. Miyake, Scripta Materialia 179, 12 (2020).
- Xing et al. (2021) G. Xing, T. Ishikawa, Y. Miura, T. Miyake, and T. Tadano, Journal of Alloys and Compounds 874, 159754 (2021).