for full-author list see https://www.auger.org/archive/authors_2022_10.html
Testing Model Predictions of Depth of Air-Shower Maximum and Signals in Surface Detectors using Hybrid Data of the Pierre Auger Observatory
Abstract
We present a method for testing the predictions of hadronic interaction models and improving their consistency with observed two-dimensional distributions of the depth of shower maximum, , and signal at the ground level as a function of zenith angle. The method relies on the assumption that the mass composition is the same at all zenith angles, while the atmospheric shower development and attenuation depend on composition in a correlated way. In the present work, for each of the three leading LHC-tuned hadronic interaction models, we allow a global shift of the predicted shower maximum, which is the same for every mass and energy, and a rescaling of the hadronic component at the ground level which is constant with the zenith angle.
We apply the analysis to 2297 events reconstructed with both the fluorescence and surface detectors of the Pierre Auger Observatory with energies eV and zenith angles below 60∘. Given the modeling assumptions made in this analysis, the best fit reaches its optimum value when shifting the predictions of hadronic interaction models to deeper values and increasing the hadronic signal. This change in the predicted scale alleviates the previously identified model deficit in the hadronic signal (commonly called the muon puzzle) but does not fully remove it. Because of the size of the adjustments and and the large number of events in the sample, the statistical significance of need for these adjustments is large, greater than 5, even for the combination of the systematic experimental shifts within 1 that are the most favorable for the models.
1 Introduction
The cosmic rays of ultra-high energy (above eV) are still of unknown origin and uncertain mass composition despite the huge effort of the community for more than 50 years since their discovery. The main complications are their very low flux and uncertainties coming from the extrapolation of hadronic interactions that take place in the development of air-showers initiated by the primary cosmic rays. The Pierre Auger Observatory PACosmicObservatory provides an unprecedented large amount of high-quality air showers reconstructed using two detection techniques - Surface Detector (SD) and Fluorescence Detector (FD), providing an excellent opportunity to test predictions of hadronic interaction models.
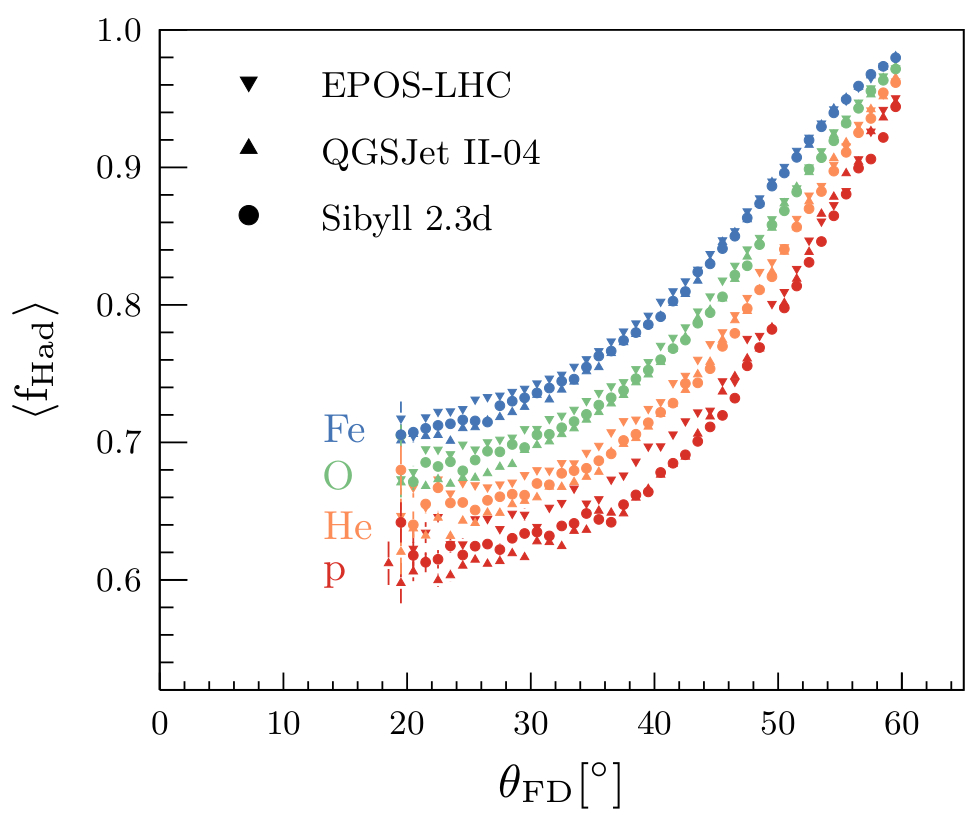
The SD measurement of the ground signal estimates the shower size using the signal expected at 1000 m from the shower core, SDEnergySpectrum2020 . In this work, the signal is assumed to be composed of the hadronic and electromagnetic components. The signal is induced by muons, and electromagnetic (EM) particles from muon decays and low-energy neutral pions according to the 4-component shower universality description ShowerUniversality ,ShowerUniversality2 . The signal is induced by EM particles originating from high-energy neutral pions. The muon component attenuates less with the zenith angle () than the EM component and its size is a measure of the primary mass. As a consequence, the fraction of the hadronic signal to is increasing with and mass of the primary (protons p, and He, O, Fe nuclei), see Fig. 1.
The FD measurement of the deposited energy on the shower depth provides a precise estimation of the shower energy () and depth of the shower maximum () Auger-LongXmaxPaper . The latter quantity is another measure of the mass of primary particle initiating the shower.
In this work, we use the showers reconstructed in both SD and FD to analyse simultaneously the mass composition of primary particles and deficiencies of Monte Carlo (MC) predictions on and . We test in this way predictions of three models of hadronic interactions Epos-lhc EposLHC , Qgsjet II-04 Qgsjet , Sibyll 2.3d Sibyll in the energy range around the ankle region SDEnergySpectrum2020 .
1.1 Data Selection and Observables
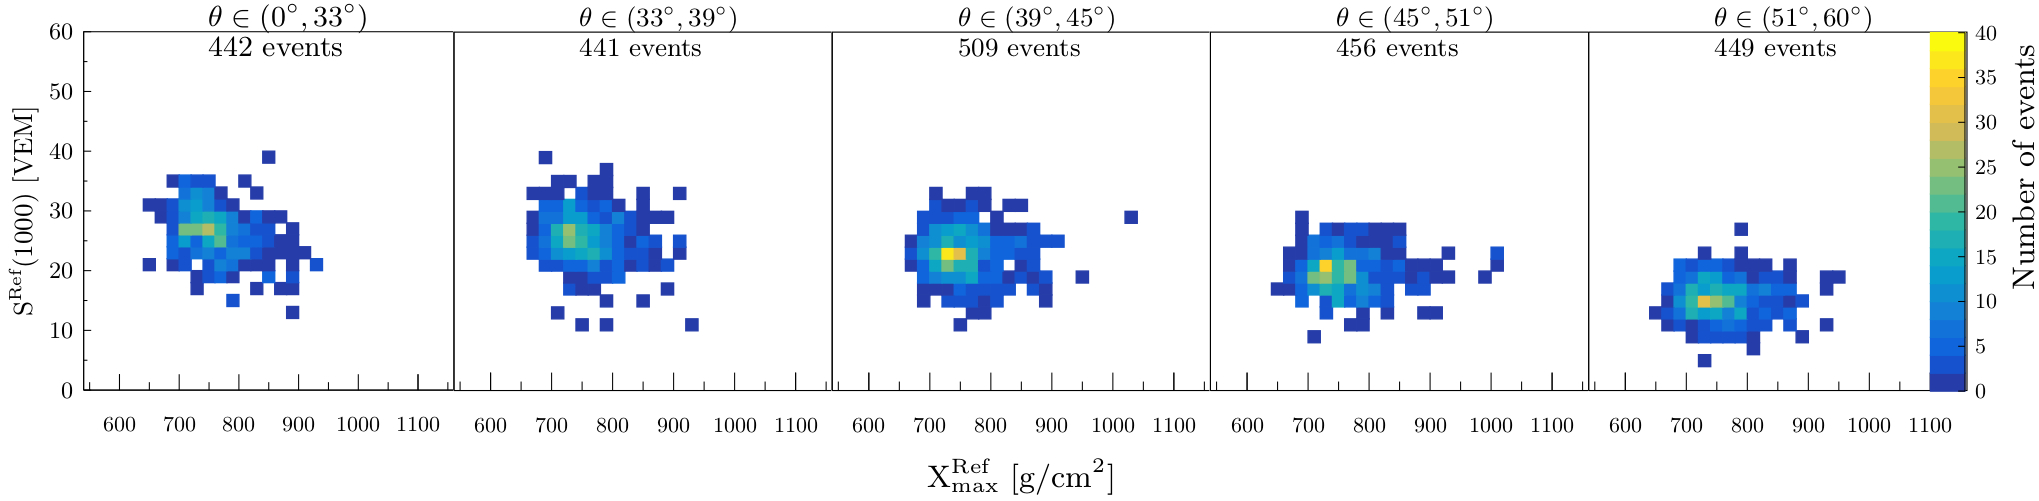
We select 2297 events detected with FD energies and within 60∘ during the period 1. 1. 2004 - 31. 12. 2018. These events survive high-quality selection criteria used to derive the SD energy spectrum SDEnergySpectrum2020 and FD analysis of Auger-LongXmaxPaper ; XmaxICRC19 . These events are divided into 5 zenith-angle ranges containing nearly the same and sufficiently large number of events.
| Epos-lhc | Qgsjet II-04 | Sibyll 2.3d | |
|---|---|---|---|
| none | 2097.410 | 4650.070 | 2581.530 |
| 764.090 | 1746.945 | 1060.795 | |
| 518.146 | 720.086 | 550.954 | |
| & | 479.456 | 515.055 | 480.611 |
The observables and contain corrections for the energy evolution of and using the FD energy as
| (1) |
and
| (2) |
where = 1.031 is the SD energy calibration parameter SDEnergySpectrum2020 and the elongation rate of a single primary g/cm2 is taken as the average value over the four primary particles and the three hadronic interaction models. The reference energy is set to eV.
2 Adjustments to Monte Carlo Predictions
There are persistent inconsistencies in the mass interpretation of measurements and ground-signal measurements TestingHadronicInteractions , AmigaMuons . All these interpretations are based on the assumption of scale, at given energy, predicted by a given model of hadronic interactions and driving this way an assumption on the mass composition. Another assumption in these analyses is a tension between the data and simulations coming only from the lack of hadronic (muon) signal in the MC predictions.
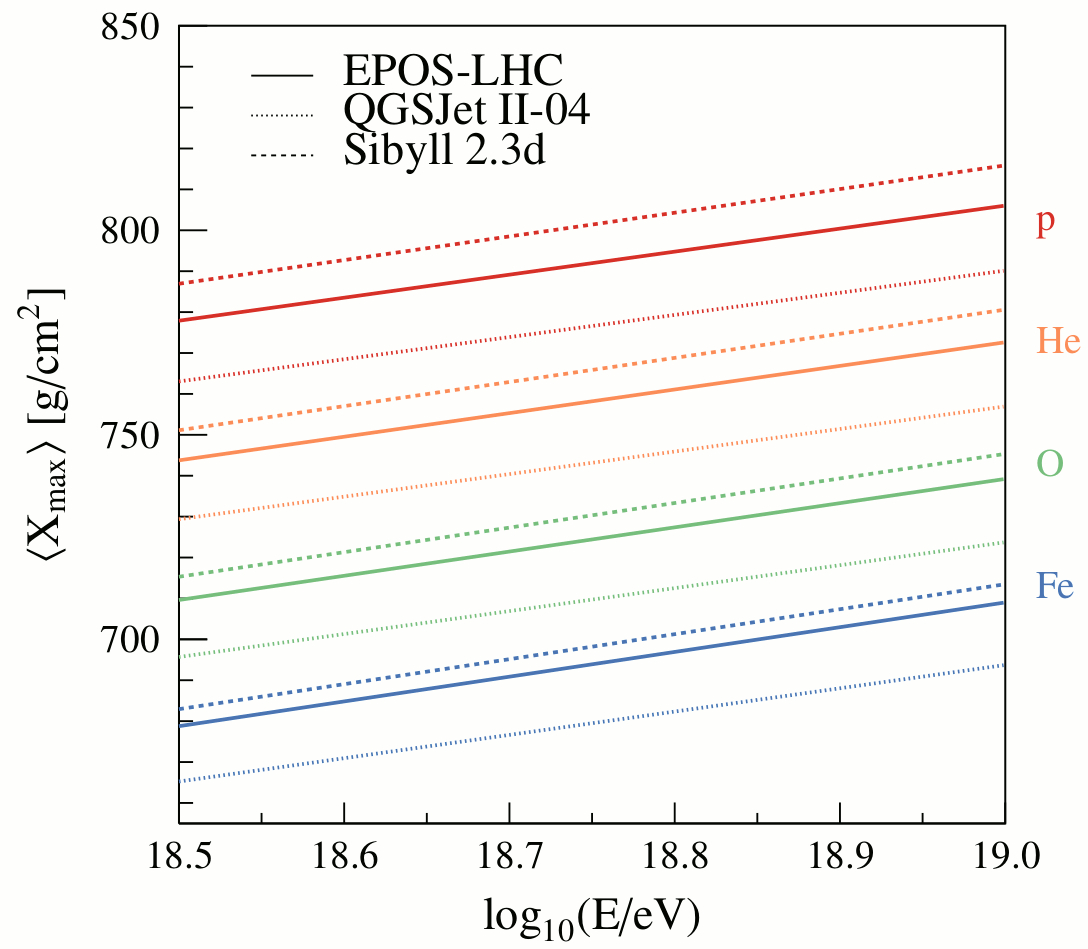
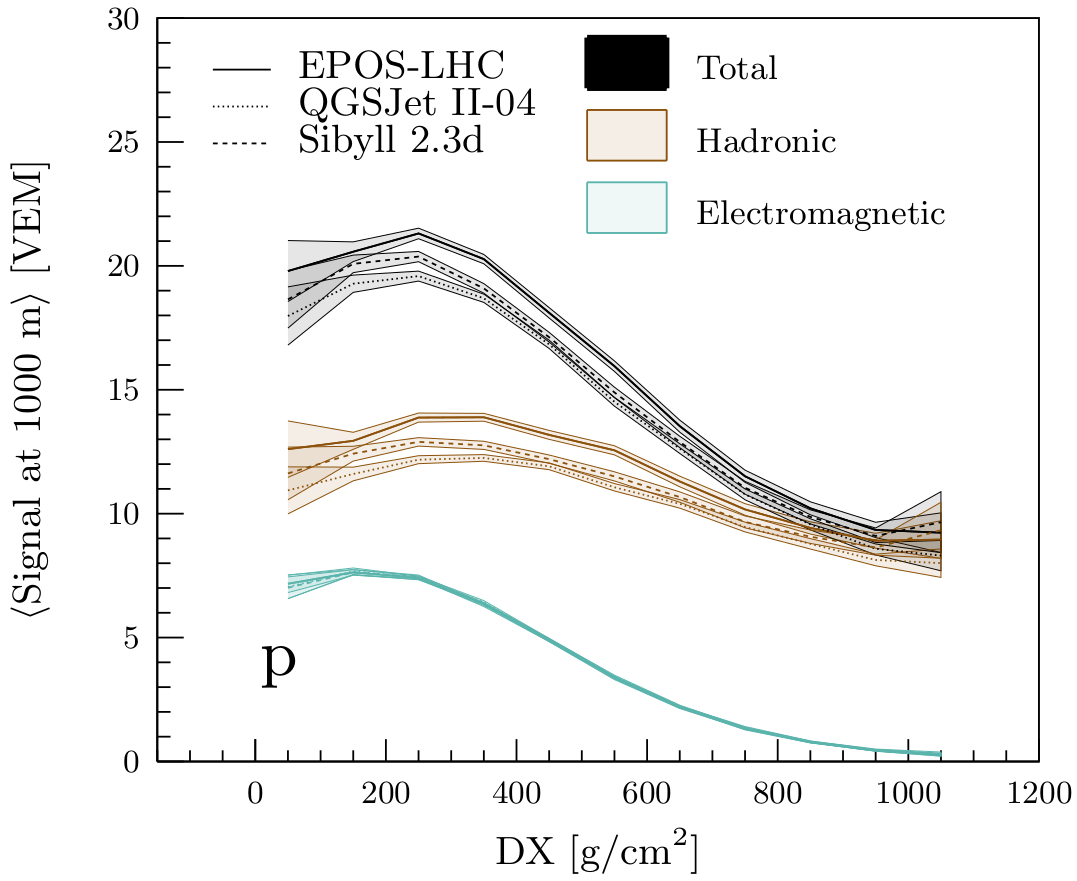
Recently, a novel method considering insufficiencies not only in the predictions of ground signal, but also in the predicted scale was applied to the data of the Pierre Auger Observatory MethodAugerDataICRC21 . The motivation for such a generalized approach is indicated on the left panel of Fig. 2 where the differences in model predictions of are approximately energy and primary-mass independent. On the right panel of Fig. 2, the difference in the ground signal predicted by different models of hadronic interactions is stemming from the different scales of hadronic signal. The EM part of signal is very universal within the applied shower-universality approach to the ground signal.
2.1 Fitting Method in Nutshell
In this work, we show the application of this novel method to the data of the Pierre Auger Observatory considering simultaneously freedom in the mass composition and the predicted hadronic and scale. The freedom in the predicted hadronic signal is assumed to be a constant function of the zenith angle on the contrary to the more general assumptions made in MethodAugerDataICRC21 , where more details can be found.
In short, we perform a composition fit simultaneously to five two-dimensional (2D) distributions of and corresponding to five zenith-angle ranges between 0∘ and 60∘, see Fig. 3, with a combination of MC templates for four primary species (p, He, O, Fe). A constant freedom in the predicted scale ( = +) and hadronic scale () in these templates is considered. The effect of the change of on the ground signal is incorporated through the separate effects on the hadronic and EM signals estimated from the parameterized evolution of the mean ground signal parts with the distance of to the ground (). In this way, the total ground signal in a given -range is estimated to be modified by about 7% at most in case of a change of by 50 g/cm2.
The likelihood-ratio expression that is minimized in the method for a given model of hadronic interactions is of the form
| (3) |
with the sums running over the 2D-bins and five -bins . The number of showers measured in a 2D-bin and a -bin is denoted by and the predicted number of MC showers for the same bin by . These MC predictions at the reconstruction level are obtained from parameterization of MC templates for each of the three models of hadronic interactions.
3 Results
3.1 Data Description
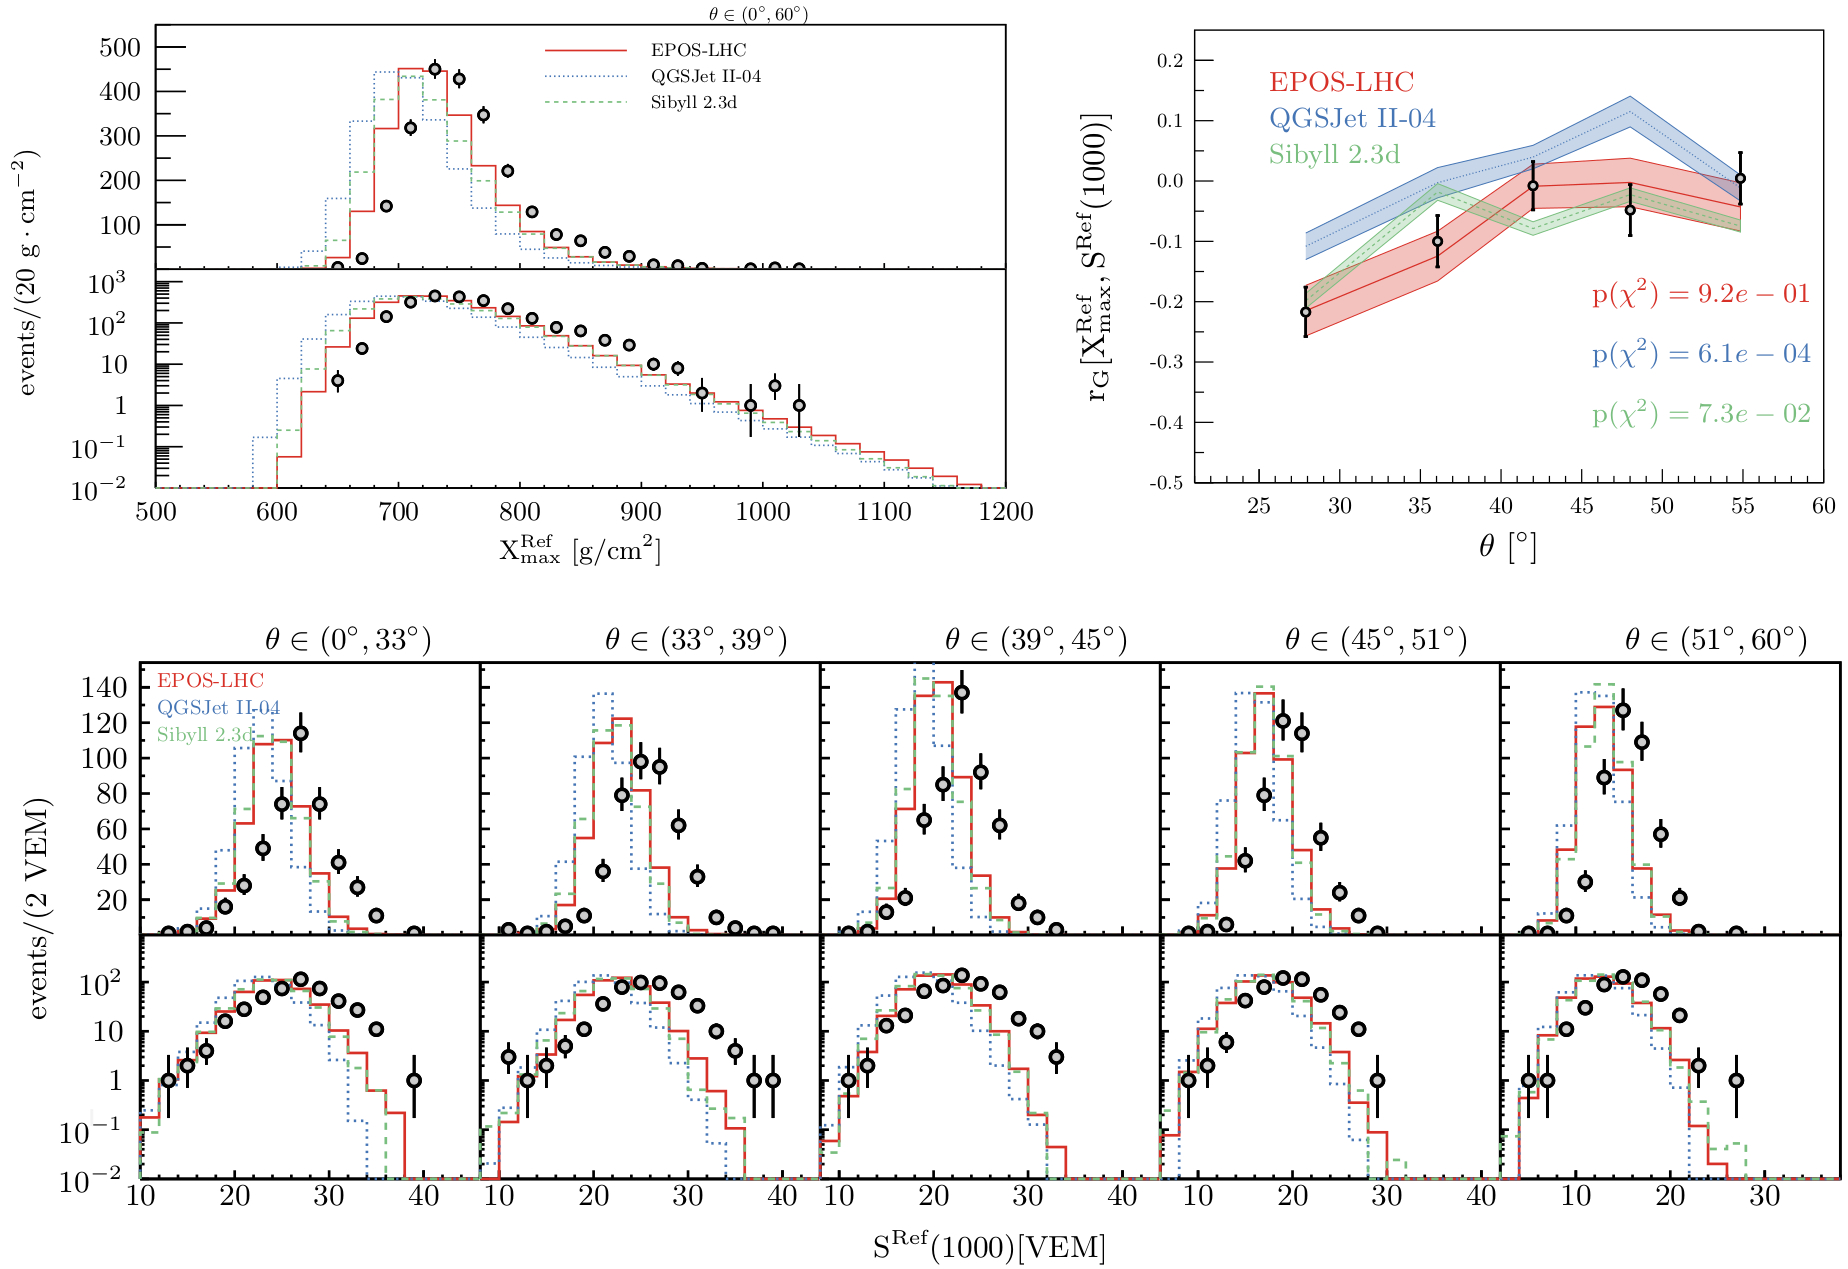
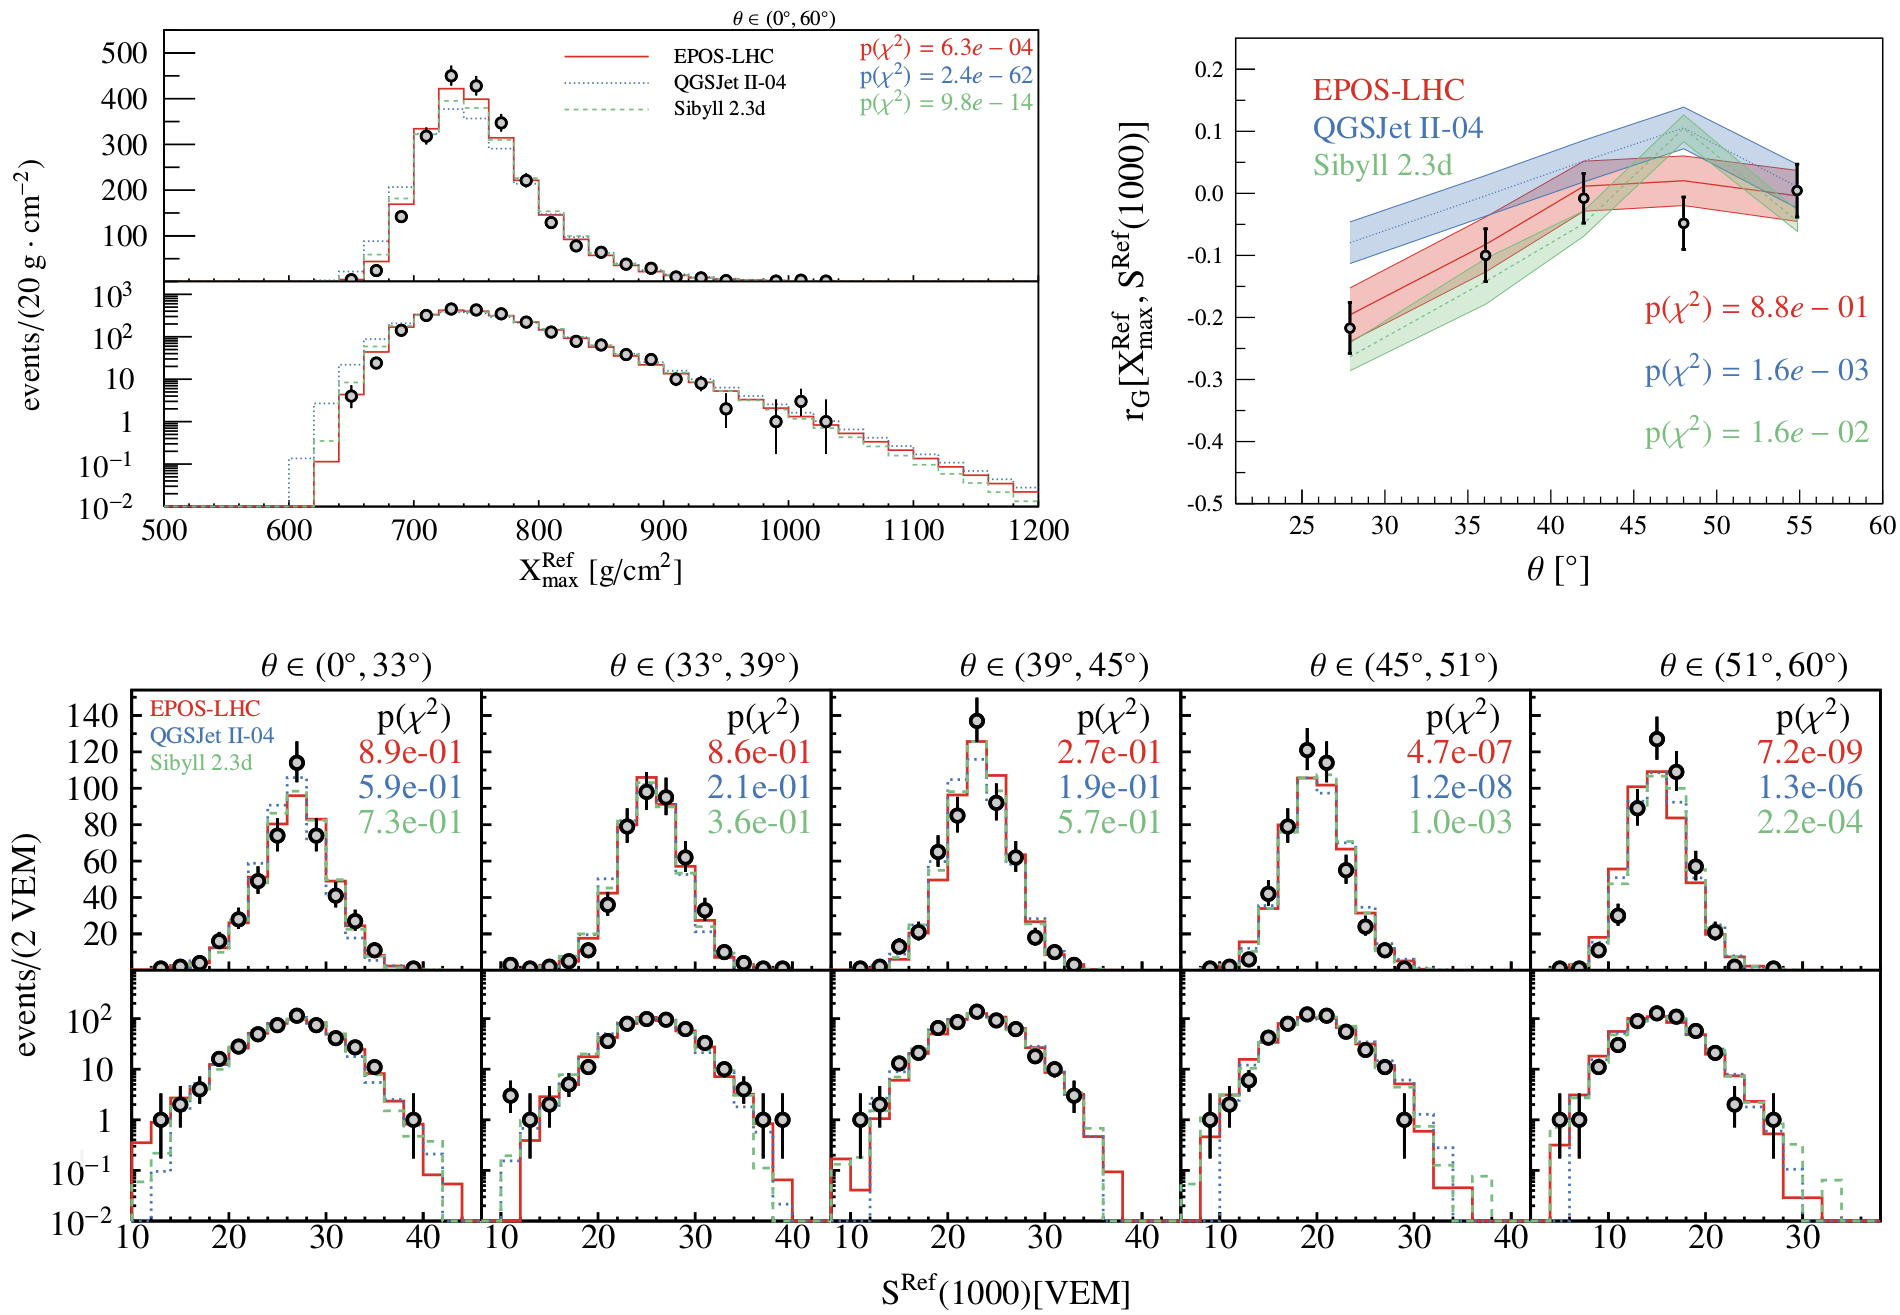
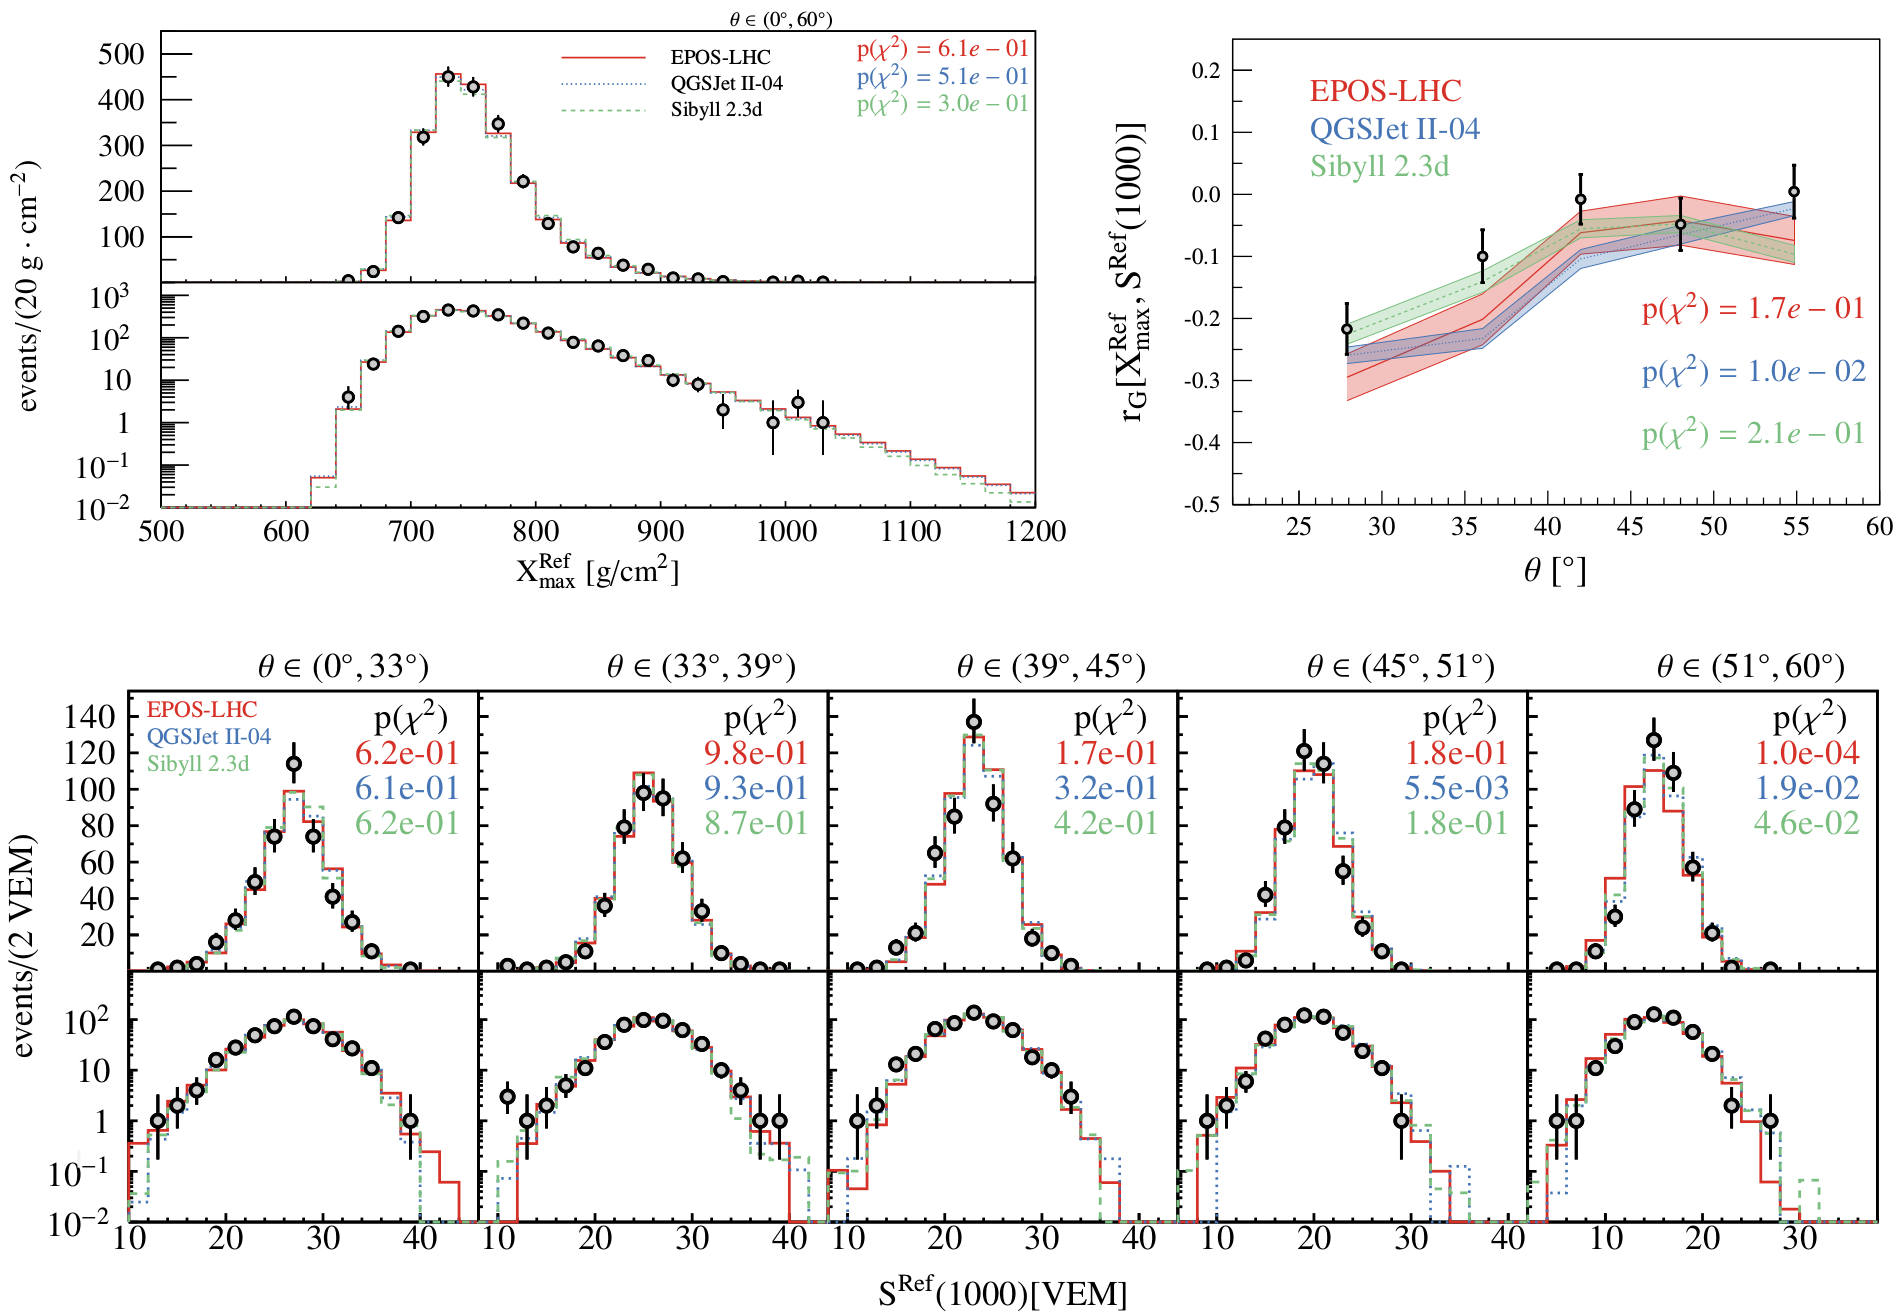
The resulting minimal likelihood-ratio value for different adjustments on the MC predictions is listed in Tab. 1 for all three hadronic interaction models. This value is a measure how well the observed data are described by the adjusted MC templates. A large improvement in the data description is obtained considering freedom in the predicted hadronic scale and further significant improvement is achieved combining with the freedom in the predicted scale as well. This improvement of data description is further demonstrated in Figs. 4, 5 and 6 for no adjustments to MC predictions, adjusted hadronic scale and adjusted hadronic and scales, respectively. These figures include projected distributions of the ground signal and , together with their zenith-dependent correlation (rGcoeff, ). The improvement, especially in case of comparison Figs. 5 and 6, is also quantified by p-values of a test. For all three models, the overall p-value of 2D data description using freedom in both hadronic and scales is at a level of several percent based on MC-MC tests.
3.2 Fitted Parameters
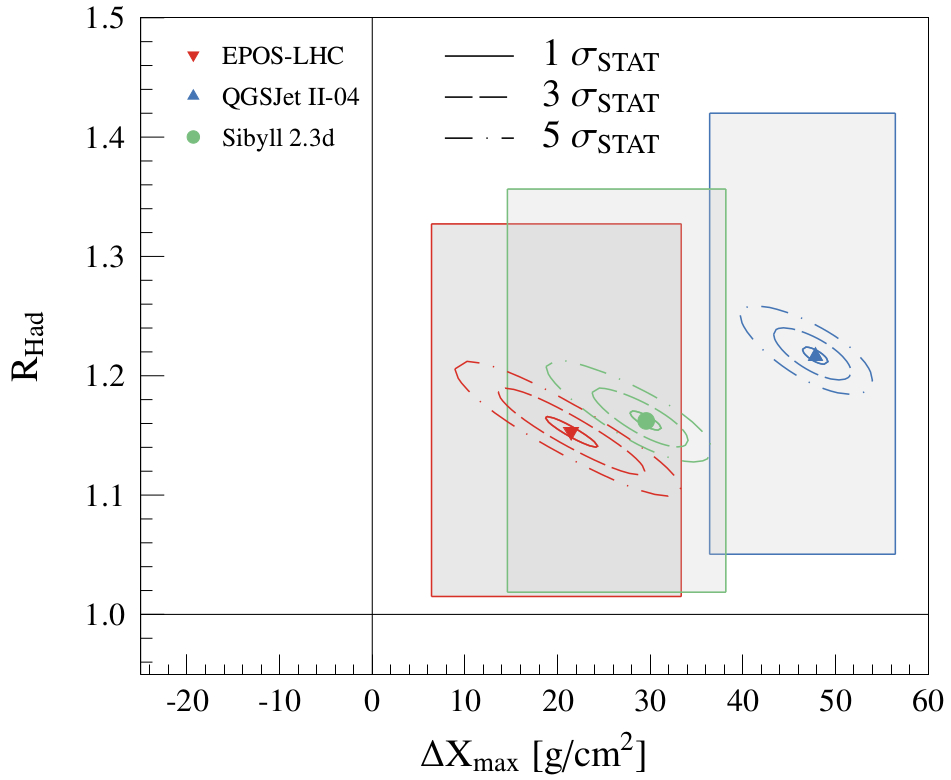
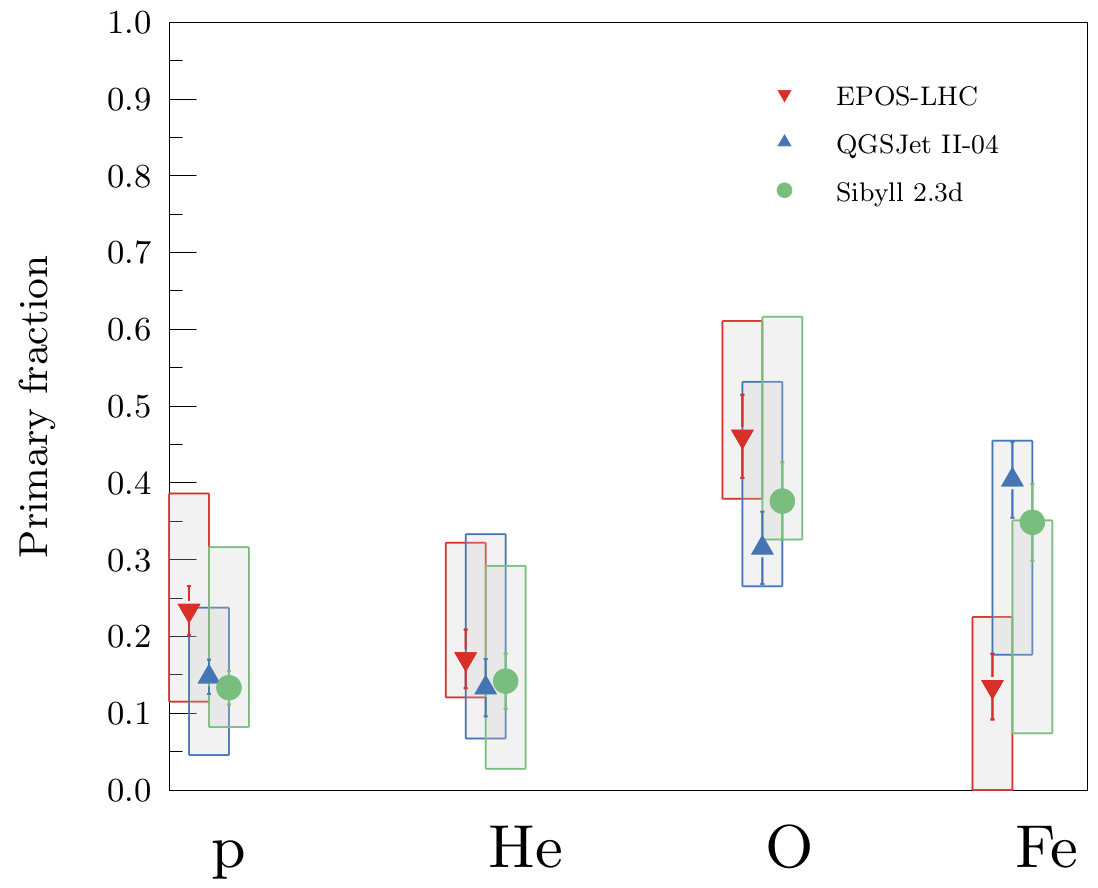
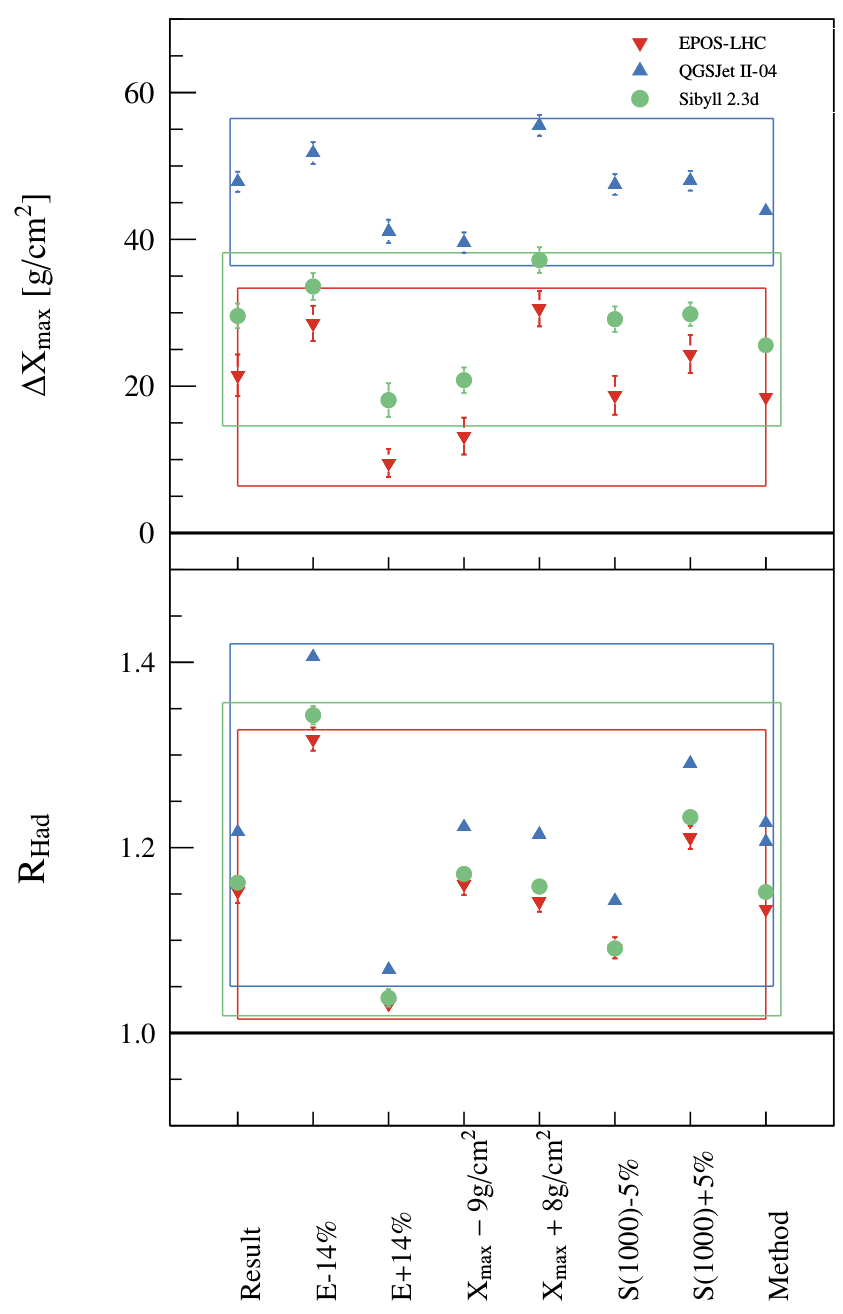
The most likely values of adjustments to the MC templates that describe the Pierre Auger Observatory data are shown on the left panel of Fig. 7. The measured data are best described when the MC predictions on are on average deeper by 20, 50 and 30 g/cm2 for Epos-lhc, Qgsjet II-04 and Sibyll 2.3d, respectively. In case of the predicted hadronic signal, an increase by 15-25% is simultaneously needed for all three hadronic interaction models. The adjusted scales have a consequence of heavier mass compositions preferred by the fits to describe the measured data, see the right panel of Fig. 7, than in case of the mass-composition fits to the measured distributions with the unmodified predictions on by the hadronic interaction models as in XmaxFits2014 ; XmaxIcrc2017 in the corresponding energy range. As our method removes the main differences in the predictions of models of hadronic interactions by introducing freedom in hadronic and scales, the fitted primary fractions show smaller model dependence of the primary fractions than in case of the distribution fits with the unmodified predictions.
3.3 Systematic Uncertainties
There are 4 dominant sources of systematic uncertainties: energy scale (), measurement ( g/cm2), measurement () and biases of the method. The individual contributions of these systematic effects to the MC adjustments are shown in Fig. 8 together with their quadratic sums.
The systematic effects on the energy correction parameters (, , ) and the long-term effects have negligible contribution compared to the above-mentioned systematic uncertainties as well as the effect of idealization of Auger detectors in the simulations.
3.4 Tests of Models
To quantify the significance of the assumed adjustments to the model predictions, we scan all possible linear combinations of the three experimental systematic uncertainties (energy scale, and measurements). The change of attenuation of total ground signal is correlated with the systematic change of energy scale due to different energy dependence of EM () and hadronic () parts of the signal. The parameter , expressing the growth of hadronic component with energy, is chosen in accordance with KampertUnger2012 . Therefore there is a degeneration between the systematic change of energy scale and change of attenuation of the hadronic signal (EM signal is assumed universal in this method, see the right panel of Fig. 2). The correct way to estimate the significance of a need for the assumed MC adjustments is through the more general approach as in (MethodAugerDataICRC21, ) considering the zenith dependence of . Even for the most favorable combination of experimental systematic uncertainties for each model of hadronic interaction, the statistical significance of a need for these MC adjustments is higher than 5.
4 Conclusions
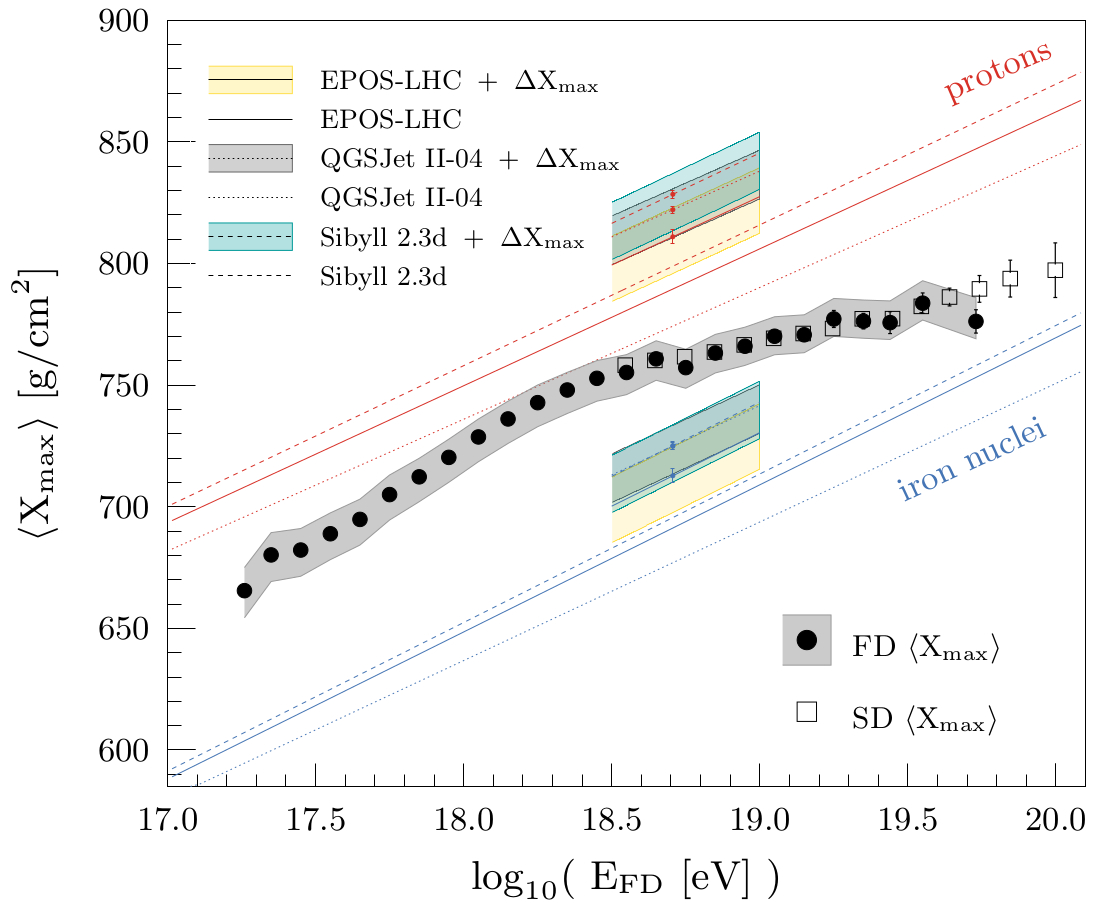
The combined measurements of cosmic rays with energies between and using the Surface Detector and the Fluorescence Detector of the Pierre Auger Observatory provide statistics large enough to apply a novel method allowing a complex testing of the air-shower observables predicted by the hadronic interaction models and simultaneously fit the fractions of primary particles. The results of the method are in tension with the predictions (i.e. and scales) of hadronic interaction models Epos-lhc, Sibyll 2.3d and Qgsjet II-04 by more than 5 with much higher significance in case of the Qgsjet II-04. The best description of the data is obtained when the scale of the MC predictions is deeper by about 20 g/cm2, 30 g/cm2 and 50 g/cm2 for Epos-lhc, Sibyll 2.3d and Qgsjet II-04, respectively. The adjusted scales are shown on the left panel of Fig. 9 together with measured data. At the same time, the differences between the hadronic interaction models in the fitted mass composition fractions are decreased and the mass composition is found heavier than using the unmodified predictions of the three hadronic interaction models. For such heavier mass compositions, the "muon problem" of the hadronic interaction models is alleviated with respect to the previous studies, observing 15-25% deficit of the hadronic component of simulated ground signal for all three studied models.
Acknowledgements
This work was supported by the Ministry of Education, Youth and Sports of the Czech Republic â Grant No. LTT18004, LM2018102 and CZ.02.1.01/0.0/0.0/16_013/0001402.
References
- (1) A. Aab et al. (Pierre Auger Collaboration), Nucl. Instrum. Methods Phys. Res. A 798, 172 (2015)
- (2) A. Aab et al. (Pierre Auger Collaboration), Phys. Rev. D 102, 062005 (2020)
- (3) M. Ave, R. Engel, M. Roth, A. Schulz, Astropart. Phys. 87, 23 (2017)
- (4) M. Ave, M. Roth, A. Schulz, Astropart. Phys. 88, 46 (2017)
- (5) A. Aab et al. (Pierre Auger Collaboration), Phys. Rev. D 90, 122005 (2014)
- (6) T. Pierog, I. Karpenko, J.M. Katzy, E. Yatsenko, K. Werner, Phys. Rev. C 92, 034906 (2015)
- (7) S. Ostapchenko, Phys. Rev. D 83, 014018 (2011)
- (8) F. Riehn, R. Engel, A. Fedynitch, T.K. Gaisser, T. Stanev, Phys. Rev. D 102, 063002 (2020)
- (9) A. Yushkov (Pierre Auger Collaboration) (2019), PoS(ICRC19)482
- (10) A. Aab et al. (Pierre Auger Collaboration), Phys. Rev. Lett. 117, 192001 (2016)
- (11) A. Aab et al. (Pierre Auger Collaboration), Eur. Phys. J. C 210, 751 (2020)
- (12) J. Vícha (Pierre Auger Collaboration) (2021), PoS(ICRC2021)310
- (13) R.A. Gideon, R.A. Hollister, Journal of the American Statistical Association 82, 656 (1987)
- (14) A. Aab et al. (Pierre Auger Collaboration), Phys. Rev. D 90, 122006 (2014)
- (15) J. Bellido (Pierre Auger Collaboration) (2018), PoS(ICRC19)482
- (16) K.H. Kampert, M. Unger, Astropart. Phys. 35, 660 (2012)
- (17) C.J.T. Peixoto (Pierre Auger Collaboration) (2019), PoS(ICRC19)440