The carbon star DY Persei may be a cool R Coronae Borealis variable
Abstract
Optical and near-IR photometry suggests that the carbon star DY Persei exhibits fadings similar to those of R Coronae Borealis (RCB) variables. Photometric surveys of the Galaxy and Magellanic Clouds uncovered new DY Per variables with infrared photometry identifying them with cool carbon stars, perhaps, with an unusual tendency to shed mass. In an attempt to resolve DY Per’s identity crisis – a cool carbon giant or a cool RCB variable? – we analyze a high-resolution H&K band spectrum of DY Per. The CO first-overtone bands in the K-band of DY Per show a high abundance of 18O such that 16O/18O , a ratio sharply at odds with published results for ‘regular’ cool carbon giants with 16O/18O but this exceptionally low ratio is characteristic of RCB-variables and HdC stars. This similarity suggests that DY Per indeed may be a cool RCB variable. Current opinion considers RCB-variables to result from merger of a He onto a CO white dwarf; observed abundances of these H-deficient stars including the exceptionally low 16O/18O ratios are in fair accord with predicted compositions for white dwarf merger products. A H-deficiency for DY Per is not directly observable but is suggested from the strength of a HF line and an assumption that F may be overabundant, as observed and predicted for RCB stars.
1 Introduction
DY Per, a cool carbon N-type star, was suggested by Alksnis (1994) to be a R CrB variable (RCB) on account of its RCB-like fadings at unpredictable times, an extreme behavior unusual among the common N-type carbon stars. As a result of photometric surveys of regions of the Galaxy and the Magellanic Clouds, new identifications of RCB and DY Per variables have been proposed. An initial distinction between RCB and DY Per variables in photometric surveys appears to be based on the observation that these variables exhibit rather similar declines and recoveries but RCB variables show the faster declines and slower recoveries (Alcock et al. 2001). The distinction between RCB and DY Per variables was amplified when infrared photometry was undertaken. For example, the two color plot J-H vs H-K (or an equivalent) shows DY Per variables at maximum light are located among the common N-type carbon stars and well separated from RCB variables at their maximum light- see, for example, Alcock et al. (2001, Fig. 9), Soszyński et al. (2009, Figs. 1 & 3), and Tisserand et al. (2009, Fig. 4). In addition, variables in the Magellanic Clouds clearly show that in the color-magnitude - diagram the DY Per variables are well mixed in with the N-type carbon stars at about and but the RCB variables run from at to at . This sequence encourages the view that DY Per variables and the RCB variables may form a run of connected variables at a similar luminosity but covering a range of effective temperatures111Note that, very recently, Crawford et al. (2023) establishes a spectral classification system for the RCB and HdC stars and discusses how DY Per might fit into this system as well as its possible temperature.. Photometric and low-resolution optical spectroscopic correspondence between DY Per variables and common N-type carbon stars have also encouraged ideas that DY Per variables are unusual variants of normal carbon stars. For example, Soszyński et al. (2009) declare ‘our candidate DY Per stars form a continuity with other carbon-rich long-period variables, so it seems that DY Per stars do not constitute a separate group of variable stars’. And Tisserand et al. (2009) consider that ‘[DY Pers] are ordinary carbon stars with ejection events. However, more spectroscopic observations and abundance analysis will be necessary to really answer this question.’ This question is the principal focus of our analysis of a high-resolution infrared spectrum.
In this paper, we discuss a high-resolution infrared spectrum of DY Per across the K band acquired with the novel spectrograph IGRINS (Park et al. 2014). Key spectroscopic indices 16O/18O and 16O/17O from the CO first-overtone vibration-rotation bands measurable from our spectra provide the opportunity to test the degree to which DY Per is related either to ordinary carbon stars or to the RCB variables. Published analyses of CO lines in high-resolution K band spectra of ordinary carbon stars show 16O/17O 16O/18O (see below for details) as predicted theoretically for C-rich low mass AGB stars. In sharp contrast, cool RCB variables and those HdC stars with CO bands in their K band spectra show remarkable enhancements of 18O beginning with Clayton et al. (2005) reporting a startling 16O/18O for the HdC HD 137613. Such selective enhancement of 18O but not 17O is taken to be a key to identification of DY Per with the family of HdC and RCB stars, all warmer than DY Per. A low 16O/18O isotopic ratio has generally been taken as a signature of the merger of a He white dwarf with a C-O white dwarf. Such a low 16O/18O ratio is exceptional among stellar atmospheres and occurrence of DY Per’s low ratio among low ratios for RCB variables and HdC stars appears to be an indicator of DY Per’s link to these H-deficient stars. We search our IGRINS spectrum of DY Per for additional products of white dwarf mergers including the F abundance obtainable from HF vibration-rotation lines in the K band but our search is thwarted by the inability to obtain independent estimates of the star’s H and F abundances.
2 IGRINS spectra
Our high-resolution H&K band spectrum of DY Per was obtained on 2014 December 4 with the 107-inch Harlan J. Smith telescope at The W.J. McDonald Observatory using the IGRINS spectrograph (Park et al. 2014). Spectra of relevant stars were also obtained in 2014 December or in a 2016 June-July observing run. Observations included the HdC star HD 137613, classical RCBs – XX Cam, UV Cas, R CrB and SU Tau – observed at or near maximum light, and the M giant Peg. None of the observed RCBs show photospheric CO lines and, hence, are not of primary interest to our investigations of the oxygen isotopic ratios.
An IGRINS spectrum covers the whole H (1.491.80 m) and K (1.962.46 m) bands simultaneously with a (2kx2k) HAWAII-2RG array as detector for each camera. Basic data reduction (i.e., sky subtraction, flat-fielding, bad pixel correction, aperture extraction, and wavelength calibration) were performed with the IGRINS Pipeline Package. Telluric features were removed with the help of the spectrum of a hot star observed at a very similar airmass immediately following observation of the program star: removal of telluric lines from the stellar spectrum is generally complete except for the strongest telluric lines. The spectral resolving power as estimated from the Gaussian full width at half maximum of weak telluric lines at 22200 Å in the comparison star is about 45,000, as designed and built. Standard air wavelengths are given here throughout. Stellar lines have been corrected for the radial velocity. Fortunately, these luminous variable stars provide absorption lines with symmetrical profiles without either a hint of splitting or a velocity variation with line strength, as may occur in some luminous stars such as Mira variables, for example.
Prior to the IGRINS observing runs, we had obtained and analyzed high-resolution spectra in selected portions of the K band of five HdC and nine RCB stars (García-Hernández et al. 2009, 2010). Several HdC and RCB stars showed first-overtone CO vibration-rotation bands and yielded measures of the 16O/18O ratio as well as providing measurements of lines from the CN Red, C2 Phillips and Ballik-Ramsay systems, all three systems contaminate the CO first-overtone bands. These spectra from the PHOENIX spectrograph at Gemini South (Hinkle et al. 2003) are at a resolution () and a continuum S/N ratio similar to our IGRINS spectra. Selective use of the PHOENIX spectra will be entertained here.
Finally, the spectrum of the N-type carbon star TX Psc was taken from the collection of high-resolution H&K-band spectra of carbon stars obtained with the Kitt Peak FTS (Lambert, Gustafsson, Eriksson, Hinkle 1986), also at a similar spectral resolution and S/N ratio to the IGRINS spectrum of DY Per. Various results gleaned from this collection of infrared spectra will be referred to below.
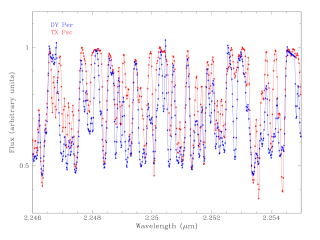
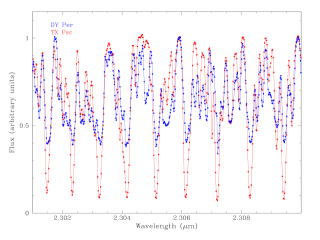
Two portions of the K band (Fig. 1) serve to illustrate the quality of our IGRINS spectra but also highlight a key difference between DY Per and TX Psc, a typical carbon giant. In Fig. 1’s left-hand panel, the spectrum of both DY Per and TX Psc is provided by primarily a mix of CN and C2 lines. CN lines are of similar strengths in the two stars. C2 lines are so much stronger in DY Per that outstanding examples may be easily distinguished. But the vital point is that the strongest CN or C2 lines in DY Per and TX Psc have about the same depth, i.e., where the intensity is referenced to unity at the local continuum. In Fig. 1’s right-hand panel, DY Per and TX Psc are compared in a region dominated by CO lines exclusively from the 2-0 12C16O band; all other bands whatever the CO isotopologues contribute at longer wavelengths. The CO contribution is contaminated with C2, and CN lines which, as anticipated, are intrinsically weaker at these longer wavelengths. Especially striking in this panel is the greater depth of the CO lines in TX Psc than in DY Per: for TX Psc but for DY Per. Constant but different for TX Psc and DY Per are maintained for the strongest 12C16O lines across the K band. For DY Per, the minimum for the strongest lines of C2, CN (Fig. 1’s left-hand panel) and CO (Fig. 1’s right-hand panel ) are similar. DY Per is here set apart from TX Psc and similar carbon stars. This difference in minimum depths of strong CO lines is taken to reflect primarily a lower O abundance for DY Per than TX Psc.
3 Key analytical tools
Our goal is to determine if DY Per is linked more closely to a carbon AGB giant star or to the family of H-deficient RCB and HdC stars or may be the prototype of a new class of rare C-rich giant variable. Abundance analysis of a cool carbon-rich giant is a daunting prospect whatever the chosen wavelength intervals; many abundance goals routinely attainable for warmer stars must be set aside or compromised when analyzing cool carbon-rich giants. Our particular hope for IGRINS spectroscopy was directed at determinations of the 16O/18O ratio and the hydrogen-deficiency. Both quantities afford an opportunity to suggest the identity of DY Per’s closest relative. Our spectroscopic tests are supported by synthetic spectra computed from model atmospheres and a detailed line list. Here, we describe the adopted model atmospheres, calculation of synthetic spectra, and selection of stellar parameters for DY Per.
3.1 Atmospheric models and synthetic spectra
Model atmospheres adopted here are based on MARCS models introduced by Asplund et al. (1997). The model family was extended for the analysis of carbon AGB stars discussed by Lambert et al. (1986). Modifications were made to the models for analysis of warm RCB stars by Asplund et al. (2000) with in particular adaptation of the models to the stars’ severe H-deficiencies. Such models were also used for analyses of cool RCB and HdC stars discussed by García-Hernández et al. (2009, 2010) which focused on the 16O/18O ratio. A few additional models were computed for use with DY Per. Quantitative estimates of our principal clues to DY Per’s identity are not critically dependent on our choice of model atmosphere.
A collection of spherically-symmetric MARCS model atmospheres (Gustafsson et al. 2008) was expanded with atmospheres in the temperature () range of 3000 to 4000 K and surface gravities (g) in the g range of 0.5 to 1.5 with a solar-like mix of metal elements. The metallicity of DY Per was described as solar and lacking -process enrichment by Začs et al. (2005, 2007) from visual comparisons of high-resolution optical spectra of DY Per near-maximum light with spectra of carbon giants. Sample H-deficient atmospheres are included in our grid. The models representing DY Per and other carbon stars include opacities unimportant for warm RCB variables, e.g., contributions from polyatomic molecules like HCN and C2H2.
For the computation of synthetic spectra, we adapted the procedure used in our studies of the high-resolution K-band spectra of warm RCB and HdC stars (see García-Hernández et al. 2009, 2010 for more details). The TURBOSPECTRUM package (Alvarez & Plez 1998; Plez 2012) is used. Line lists for key molecules were taken from the following sources: the CO vibration-rotation transitions from the HITRAN 2016 database (Gordon et al. 2017), the CN Red system from Sneden et al. (2014), and the C2 molecule from Yurchenko et al. (2018). For CO, the isotopologues 12C16O, 13C16O, 12C17O and 12C18O are in the line list. For CN and C2, 12C and 13C are both represented. The HF line list from Jönsson et al. (2014) was used.
3.2 Atmospheric parameters
Parameters include the effective temperature (Teff), the surface gravity (), the composition including the H, He, C, N, O, F and overall metallicity, and the macro- and micro-turbulent velocities.
DY Per’s Teff is estimated from its intrinsic infrared colors and a calibration based on cool carbon giants. The star is reddened by interstellar dust along the line of sight but perhaps also by circumstellar dust which may contribute to the star’s infrared flux. Maps of interstellar reddening versus distance in DY Per’s direction (Neckel 1967) provided Yakovina, Pugach & Pavlenko (2009) with their estimate mag for an assumed distance 1.5 kpc. The recent GAIA parallax confirms the distance (GAIA Collaboration 2021). Inspection of interstellar reddening maps by Fitzgerald (1968) and Neckel & Klare (1980) encourages a view that may be larger than above. Fitzgerald presents maps of reddening by galactic latitude. For the two zones spanning DY Per’s latitude, the average at 1.5 kpc with the bulk of this reddening occurring at distances of less than one kpc and appearing constant beyond that distance. Such an estimate for corresponds to . Neckel & Klare provide a rather more detailed map divided into oddly shaped areas. The area including DY Per shows that at 1.5 kpc. Three areas closer to the Galactic plane at about DY Per’s latitude give . These (and neighboring) maps suggest that interstellar reddening of distant ( kpc) stars is latitude-dependent. For DY Per, is suggested as the interstellar extinction. Tisserand (2012) estimates using Schlegel, Finkbeiner & Davis’s (1998) maps of interstellar extinction. We adopt .
Extensive studies have been made of the effective temperature of carbon giants. We consider here that a Teff – color calibration developed for carbon giants is applicable to DY Per. We adopt a calibration by Bergeat, Knapik & Rutily (2001), which links intrinsic infrared color indices to temperatures estimated from angular diameter determinations and photometry. In particular, we adopt the calibration based on the intrinsic (J-K) color index.
A long-period variable like DY Per changes infrared colors as it varies. Alksnis et al. (2002) report extensive JHKLM measurements as the J magnitude varied from J = 5.9 to 7.1. Alksnis et al. (2009) list more limited measurements for phases at which J faded to 9.0. Not unexpectedly, indices such as (J-H), (H-K) and (J-K) redden as the star fades. In order to determine colors at maximum light, we identify a tight ‘blue’ cluster of 16 observations providing means of J = 5.94 and K = 4.07 with (J-H) = 1.13, (H-K) = 0.74 and (J-K) = 1.87. After correction for , the stellar magnitude becomes K = 3.89 and the color (J-K) = 1.60 – see differential interstellar reddening corrections by Cardelli, Clayton & Mathis (1989). Bergeat, Knapik & Rutily’s calibration gives T K, an estimate compatible with crude estimates drawn from fits to DY Per’s spectral energy distributions over narrow or broad wavelength intervals. Of course, this estimate may be suspect if DY Per is not a typical carbon giant. Presence of a circumstellar dust shell may also affect this temperature estimate which is presumably a lower estimate.
Surface gravity of a cool carbon giant may be set from an estimate of stellar mass and a determination of the de-reddened bolometric magnitude or absolute luminosity. For the GAIA parallax, the bolometric correction = 3.09 for a carbon star with (J-K) = 1.60 (Kerschbaum, Lebzelter, Mekul 2010) which with K = 3.89 converts to = -3.9 or . The inferred surface gravity where we adopt a solar mass for the star (see below).
DY Per’s overall metallicity was estimated by Začs et al. (2007) from inspection of high-resolution optical spectra of DY Per and carbon giants of similarly low temperature: (UV Cam, R Lep, W CMa and U Hya) with previously estimated metallicities. Začs et al. (2007) gave DY Per’s metallicity as solar and the ratio [/Fe] also as solar indicating a lack of -process enrichment. For carbon giants, Lambert et al. (1986) noted the difficulty in identifying atomic lines in H+K band spectra and provided a brief list of possible ‘clean’ lines in the K band short ward of the region dominated by CO lines. Consideration of the 1986 line list and examination of the spectra of DY Per and TX Psc along with fitted synthetic spectra of CN and C2 confirm the great difficulty of isolating atomic lines in our K band spectrum.
3.3 The circumstellar shell, stellar photometry and infrared spectroscopy.
Our initial assessment of the impact of DY Per’s circumstellar dust on its infrared spectrum was provided from the spectral energy distribution (SED) set by optical photometry (B, J, H, K) to infrared photometry ([3.4], [4.6], [12], [22] – WISE, [9.0], [18] – AKARI) for ‘maximum’ light by Tisserand (2012, Fig. 9). This SED and others assembled by Tisserand for RCB and HdC stars were fitted by him using the program DUSTY (Nenkova, Ivezíc, Elitzur 2000) with a black body to represent stellar emission and with a shell composed of amorphous carbon grains with a size distribution suggested by Mathis, Rumpl & Nordsieck (1977), at a uniform shell temperature and a visual optical depth . Obviously, the black body temperature obtained for the star DY Per is no more than a rough approximation to the stellar flux crossed by strong molecular bands. Modeling of the shell emission provides a fair estimate of that shell’s temperature and visual optical depth. For DY Per, Tisserand gives K for the star and K with = 0.36 for the circumstellar shell. Inspection of Tisserand’s SED for DY Per shows that the shell flux may be from 0 – 40 of the stellar flux at K as set by the 3000 K black body. For this study, we assume that the shell does not dilute the stellar spectrum at the K band.
In addition, the circumstellar dust will likely redden the stellar (J-K) (and other indices) which, if uncorrected, results in an underestimate of the Teff. Photometry by Alksnis et al. (2002) describes how infrared magnitudes respond as the star varies. For a change at R of about 3 magnitudes, changes in magnitudes in L and M are only about 0.2 and -0.3, respectively, but considerably greater at J (2.1), H (1.7) and K (1.0). Although these changes indicate that photometry at M is dominated by the shell’s quasi-constant contribution, precise attribution at H and K of the shell’s contribution remains uncertain, even had we access to contemporaneous multi-color photometry across the infra-red. A shell continuum of about 35% contribution to the K band will dilute DY Per’s CO lines relative to the strongest lines in TX Psc and other carbon stars but since this contribution must rather similarly affect the spectrum across the entire K band, the CN lines could be similarly weakened relative to their strength in TX Psc. Thus, the intervals shown in Fig. 1 suggest the DY Per’s shell is not an important contributor to the star’s K band.
4 Chemical clues to DY Per’s identity
Clues to DY Per’s identity are sought from its IGRINS spectrum as well as from published accounts of its spectrum at shorter wavelengths. Is this cool C-rich variable related to the H-deficient HdC and RCB stars or is it an unusually active mass-losing variant of a normal carbon AGB giant? Or, perhaps, DY Per is of an entirely novel origin. Our analysis of the IGRINS spectrum is focused on two potential contrasting distinguishing marks between the H-deficient stars and normal carbon giants: their atmospheric 16O/18O ratio and the hydrogen-deficiency. The O isotopic ratio is obtainable directly by matching the key portion of the observed spectrum with synthetic spectra computed from our molecular line lists and model atmospheres. The result is clear: DY Per is marked by the low 16O/18O ratio, the striking signature of the H-deficient RCB and HdC stars, and not the high ratio found among normal carbon AGB giants. In contrast, DY Per’s H-deficiency can not be closely set from either our K-band spectrum or published discussions of optical spectra. Presence of hydrogen in DY Per’s atmosphere is revealed by HF vibration-rotation 1-0 lines in the K-band but the strength of HF lines may depend on the combination of the H and the F abundances. The expected H-deficiency may possibly be set by the condition that DY Per’s F abundance should not exceed the maximum F abundance of H-deficient RCB and extreme He stars where their F abundance is set from optical spectra possessing atomic fluorine lines.
Our principal tool for extracting abundance data from the IGRINS spectra is to fit DY Per’s observed spectrum with a synthetic spectrum convolved with the instrumental profile. Synthetic spectra are computed from a model atmosphere drawn from a set centered on T K , a gravity , a metallicity [M] of solar, a microturbulence of 7 km s-1. Three different input H-abundances of 12.0 (normal = solar), 10.5 and 9.5 were available for each point on the grid. The spectrum provided by TURBOSPECTRUM was convolved with a macroturbulence of 6 km s-1 and the IGRINS instrumental profile before tested against the observed spectrum.
4.1 Hydrogen content
Alksnis’s (1994) identification from photometry of DY Per as a RCB variable clearly calls for spectroscopic confirmation of the star’s H-deficiency. A first suggestion of H-deficiency came from Keenan & Barnbaum (1997) who remarked that a ‘moderate hydrogen deficiency’ may be present for DY Per from comparison of 3.4Å resolution spectrum of the CH G-band for DY Per, the HdC star HD 182040, and the R-type carbon star RV Sct. Their remark has been widely cited to confirm DY Per as a RCB variable but the claim lacks rigor.
The sole attempt at a quantitative estimate of DY Per’s H-deficiency from the CH transition appears to be by Yakovina, Pugach, Pavlenko (2009) who constructed a model atmosphere grid and assembled atomic and molecular line lists to construct synthetic spectra. Their fit to an observed optical spectrum at 3.4Å resolution did not involve the heart of the CH G-band around 4320 Å where the observed spectrum had too low a S/N ratio but the much weaker CH bands about 4850 Å where fortunately the overlapping bands of the C2 Swan system are weaker but the CH contribution appears to be weaker than the set of CN Violet system lines. From comparisons of observed and their synthetic spectra, Yakovina et al. (2009) put the H/He number ratio in the broad range 1/9 H/He , i.e., a H-deficiency ranging down a factor of 100 but with a solar H/He () ratio also providing an acceptable fit to the spectrum. A feature of their fits to the observed spectrum is that their derived H-deficiency seems correlated with the derived Fe-deficiency; if DY Per’s metallicity is near-solar (see below) DY Per has a quasi-normal H content. Our synthetic spectra around 4840 Å show that the C2 Swan may dominate the observed spectrum with the CN Violet lines on average stronger than the CH lines for a normal H abundance; establishing a H-deficiency will be difficult. This suggestion is confirmed by Crawford et al.’s (2023) observation that the CH G-band was undetectable in spectra of HdC stars “even those with measurable Balmer lines”.
For some carbon stars, it is possible to infer the presence of H absorption contributing to their spectrum dominated by a rich array of CN and C2 absorption lines. In other carbon stars, the spectrum around H appears entirely due to the CN and C2 lines. A valuable survey of Balmer lines in carbon stars was provided by Barnbaum (1994). An instructive discussion of a possible H contribution to carbon stars is provided by Smirnova (2012). When Balmer lines are present, either in emission or absorption, the supposition is that they originate from either a shock traversing the photosphere or a stellar chromosphere. Presence of H most probably eliminates the possibility of serious H-deficiency. Absence of H is consistent with presence of a carbon giant but cannot be taken as a conclusive identifier of a RCB variable.
Začs et al. (2005, Fig. 5) compared the H profile in high-resolution spectra of DY Per and the N-type carbon star U Hya. Across the 30 Å illustrated portion, their U Hya spectrum is very similar to Barnbaum’s (1994) U Hya spectrum which in turn is almost identical to her spectrum of TX Psc. DY Per’s spectrum is very different in that it is dominated by few flux peaks between which the many discrete but blended absorption lines in U Hya have merged (i.e., strengthened) to create a floor with a minimum relative flux of 0.1. This contrast between U Hya (and TX Psc) and DY Per results from strengthening in the latter of CN and C2 lines - see Barnbaum’s templates of these lines. Neither the spectrum of U Hya nor of DY Per at H indicates a contribution in either absorption or emission from H but, as noted above, this result cannot not serve as an indicator of H-deficiency. This statement is compatible with Začs et al ’s (2005) remark that the region around H (and H) is too crowded “to clarify the level of hydrogen deficiency” in DY Per. But in contrast, Začs et al. (2007, Fig. 10) from their comparison of just 5 Å around H of DY Per and carbon-rich giants propose the conclusion that DY Per enjoys a “significant hydrogen deficiency”. We suggest our and the group’s 2005 conclusion is to be preferred to this later one.
Infrared emission from DY Per confirms the presence of hydrogen but an estimate of the H-deficiency is not yet available. The 11.3m and 12.7m emission attributable to polycyclic aromatic hydrocarbon (PAH) molecules (García–Hernández, Rao & Lambert 2013) are present in DY Per but absent from very H-deficient RCB stars. Intriguingly, the PAH features are also present in spectra of three moderately H-deficient RCB stars: the two hot RCB stars DY Cen and HV 2671 and the warm RCB star V854 Cen. Atmospheres of these RCB stars have H-deficiencies of around 100-fold. Such a moderate H-deficiency may apply to DY Per (see below) but the chemistry of PAH production and emission in cool shells is not understood yet and estimating H-deficiencies is a most uncertain procedure.
The H2 quadrupole transition 1-0 S(0) at 2.2226 m offers another possibility, if DY Per is not too seriously H-deficient. This and the S(1) line appear in the infrared spectra of many carbon stars at close to the predicted equivalent width at the predicted wavelength (Lambert et al. 1986). But Ohnaka, Tsuji & Aoki (2000) note that the H2 line in some carbon stars is velocity shifted and may be formed in “a warm molecular envelope” above the stellar photosphere. Lambert et al. (1986), Aoki, Ohnaka & Tsuji (1998) and Ohnaka, Tsuji & Aoki (2000) each conclude that the atmosphere of a typical carbon AGB giant is not H-deficient. Our IGRINS spectrum of DY Per places the S(0) line in the red wing of a weak line. (As expected, the S(0) line is absent from the HdC HD 137613’s IGRINS spectrum.) The strength of S(0) in a carbon star of DY Per’s Teff is such that a slight deficiency of hydrogen reduces the line below its detection limit.
A future and more favorable opportunity to probe the H-deficiency of DY Per may be provided by high-resolution spectra of the CH (and NH) fundamental vibration-rotation lines near 4 m but correction for infrared emission from DY Per’s circumstellar shell may be required. CH (and NH) lines near 4m were exploited previously by Lambert et al. (1986) and Ohnaka, Tsuji & Aoki (2000) in spectroscopic studies of a few carbon giants.
Discussion of DY Per’s H abundance is continued with discussion of the HF vibration-rotation lines (below).
4.2 The 12C/13C ratio
Investigations of the 12C/13C ratio among carbon AGB stars and the H-deficient RCB and HdC stars indicate that the ratio spans overlapping ranges in the two groups of stars. This result effectively eliminates the likelihood that DY Per’s 12C/13C ratio may serve to suggest its identity. Our sample of 12C/13C ratios for carbon stars are taken from analyses by Lambert et al. (1986) who determined estimates from the CN Red system’s bands and the CO first- and second-overtone bands. A majority of carbon star sample have a 12C/13C ratio between 30 and 80 with a few 13C-rich – J-type – having the recognizable ratio 12C/13C for the CN-cycle run at equilibrium.
For warm RCB stars, the 12C/13C ratio has been obtained from C2 Swan bands, particularly with the 1-0 12C13C band head at 4744 Å referenced to the 1-0 12C2 band with its head at 4737 Å. Synthesis of both bands is complicated by the accidental presence of Fe i lines at the heads. Hema, Pandey & Lambert (2012) estimate the 12C/13C ratio for warm RCBs with Swan bands. Synthesis of weak Swan bands, even from high S/N high-resolution spectra often result in a lower limit to the 12C/13C ratio. An interesting result is that the two minority RCBs (i.e., RCBs with abnormally high [Si/Fe] and [S/Fe] ratios) returned 12C/13C ratio estimates from 3 to 6 for VZ Sgr and 8 to 10 for V CrA (see also Rao & Lambert 2008). Majority RCBs with normal [Si/Fe] and [S/Fe] returned 12C/13C ratios of about 20 or lower limits of 8 to 120. Data on the 12C/13C ratio among RCB stars could be expanded from high-resolution infrared spectra, particularly from the CO lines of those cool RCBs with K-band continuum undiluted emission from a dust shell. Unfortunately, the small K-band pieces of the previous PHOENIX spectra of cool RCBs did not covered useful spectral portions for the derivation of the 12C/13C ratio (García-Hernández et al. 2009, 2010).
A large 12C/13C ratio for HdC stars was suggested long ago by Fujita & Tsuji (1977) from high-resolution spectra providing CN Red system lines around 8000 Å and consideration of 12CN and 13CN lines of the same intensity. They found that the ratio was for HD 182040 and for HD 137613. Kipper (2002) obtained 12C/13C for HD 137613 from synthesis of CN lines in the spectrum around 8000 Å. Hema, Pandey, Lambert (2012) from analysis of the Swan bands report the ratio to be for HD 137613 and HD 175893 and slightly lower () for HD 173409 and higher () for HD 182040. From K-band PHOENIX spectra, García-Hernández et al. (2009) put lower limits of 12C/13C10 for these three HdC stars.
DY Per’s spectrum around the 13C16O 2-0 R-branch band head was synthesized for 12C/13C ratios of 4, 15 and 30. This selection of 13C16O lines is crossed by strong lines from 2-0 and 3-1 12C16O bands, CN and C2 lines and very weak 12C17O 2-0 lines. The 13C16O band head and individual lines certainly exclude the ratio 12C/13C = 4 and, hence, serious contamination by CN-cycled material. A limit 12C/13C is accepted from this preliminary search. It seems unlikely that investigation of other portions of the 13C16O spectrum will improve the estimate of the ratio because across these portions lines from all CO isotopologues overlap. Detailed scrutiny of the spectrum short wards of the 2-0 12C16O band (see Fig. 1) might yield a higher 12C/13C ratio from either CN or C2 lines, notably from the latter where the number densities n(13C12C) = 2n(12C2)/ where = 12C/13C.
Although the distribution functions of 12C/13C ratios are not yet well defined for available samples of RCB and HdC stars, the functions possibly span different ranges with HdC stars exhibiting larger 12C/13C ratios than either carbon giants or the RCB stars. A more precise estimate for DY Per seems unlikely to be the key to its identity.
4.3 The isotopic oxygen ratios: 16O/18O and 16O/17O
The 16O/18O ratio appears to be a striking discriminant between N-type AGB carbon giants and typical RCB-variables and HdC stars. Determination of oxygen isotopic ratios for RCB and HdC stars is dependent on these H-deficient stars having a sufficiently cool temperature to provide CO lines in their infrared spectrum dominated by that of the star with no or minor contamination from a dusty cold circumstellar shell. CO bands do not occur in spectra of the warmest RCB stars and certainly not the extreme helium stars and, thus, their O isotopic ratios remain unknown.
Isotopic oxygen ratios in carbon stars are provided in independent analyses by Harris et al. (1987) and by Abia et al. (2017) of CO lines in the high-resolution spectra acquired by Lambert et al. (1986). These analyses of oxygen isotopic ratios are in fair agreement. Abia et al. (2017) give the mean ratios as 16O/17O and 16O/18O , which are lower than Harris et al.(1987)’s values by and , respectively. Equivalently, the ratio of the Abia/Harris r estimates is on average 0.92 and 0.72 for 16O/17O and 16O/18O, respectively. Abia et al. (2017) find that the 16O/18O across the sample runs from to . The 16O/17O shows a similar range. These isotopic ratios are about what are predicted for carbon AGB giants created by the third dredge-up in low-mass stars.
Discovery of the remarkable 16O/18O ratios for HdC and RCB stars from direct inspection of low-resolution spectra took advantage of the displacement of the 12C18O 2-0 R-branch band head at 2.3486 m from the 12C16O 4-2 R-branch at 2.3519 m (Clayton et al. 2005, 2007; García-Hernández et al. 2010). Between these two band heads is the 12C17O 3-1 R-branch band head which was far from prominent signifying that 16O/17O 16O/18O. The region 2.348 to 2.354 m includes not only lines from these CO bands but also lines from the 2-0 and 3-1 12C16O bands, and the 2-0 13C16O band. Crucially, additional lines across this region come from the CN Red system, the C2 Phillips and Ballik-Ramsay systems. When the 18O abundance is high, 12C18O lines from bands other than the 2-0 are detectable but these lines being at longer wavelengths fall amongst an increasing dense multi-band mix of 12C16O and 13C16O lines, frustrating accurate determination of the 16O/18O ratio.
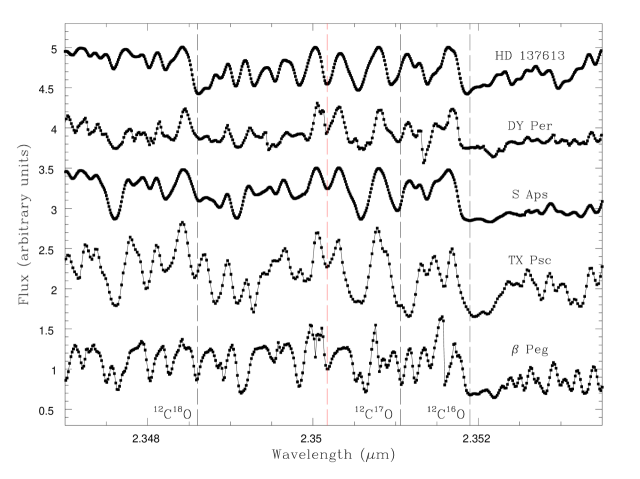
An impression of DY Per’s 16O/18O ratio is provided by the spectra in Fig. 2 of four carbon-rich stars in order of increasing 16O/18O from top to bottom with the M giant Peg’s spectrum at the bottom. Vertical lines mark the locations of the R-branch heads of the 2-0 12C18O, 3-1 12C17O, and the 4-2 12C16O, all degraded to longer wavelengths. HdC HD 137613 clearly has a 16O/18O as shown by the nearly equal depths of the 2-0 12C18O and the 4-2 12C16O band heads and also by the clear rotational structure of the 2-0 12C18O band. RCB S Aps not only has a 2-0 12C18O head weaker than the 4-2 12C16O head indicating that its 16O/18O ratio () is larger than for HD 137613 but the profile of S Aps’s 2-0 12C18O band is interrupted by strong 3-1 R branch 12C16O (and other lines) lines. This H-deficient pair are of higher (5400 K) than either DY Per or TX Psc ( K). DY Per appears to offer a spectrum with the 2-0 R branch 12C18O closer in strength to its 4-2 R branch 12C16O than their relative strength in S Aps. In S Aps, the region shortward of the 2-0 12C18O head is seen to be richer in contamination from CN and C2 lines which are present across the K band and call for careful synthesis before assessing a carbon star’s 16O/18O ratio. Mere inspection of the spectra of TX Psc (T K) and Peg (T K) does not so readily betray their 16O/18O ratios which are the typical high values of giants (16O/18O for TX Psc (Abia et al. 2017) and for Peg (Lebzelter et al. 2019). This seeming betrayal arises in part from contamination by other lines, principally from the CN Red system in the case of TX Psc, contributions from 13C16O lines in the case of Peg, and the necessity to adjust impressions for saturation of strong 12C16O lines, and their high 16O/18O ratio.
Before discussing quantitative estimation of the 16O/18O ratio for DY Per, we note that Fig. 2’s red dashed line denoting the 2-0 12C18O R43 line appears with a similar strength in DY Per, S Aps and TX Psc, and also in our published PHOENIX spectra of RCBs U Aqr and V1783 Sgr but is unsurprisingly much stronger in HD 137613 with its high 18O abundance. The ‘red’ line appears stronger in Peg because this M giant has an appreciable 13C content (12C/13C = 9; Lebzelter, Hinkle, Straniero et al. 2019), also the 2-0 12C18O line is blended with the 2-0 R69 13C16O line. The R68 13C16O line (and similar lines) is also clearly present in Peg. (The illustrated Peg spectrum in the neighborhood of the ‘red line’ and a few places elsewhere shows abrupt local changes of intensity which arise largely from incorrect cancellation for the telluric lines.)
Subject to correction for the 13C16O blend (and for as yet unidentified blends), the ‘red’ line provides an estimate of the atmosphere’s 12C18O abundance. This estimate should be matched with lines of comparable or weaker intensity from 12C16O in order to obtain the 16O/18O ratio with minimal sensitivity to curve of growth effects but an inevitable sensitivity to effective temperature. In HD 137613 and similar stars, there are opportunities to isolate unblended or only weakly-blended lines of 12C18O and 12C16O but for carbon stars like TX Psc where 18O (and also 17O) is a trace isotope and blending CN and C2 lines are a serious contaminant unblended 12C18O lines are rare and weak 12C16O lines uncommon. Differences in excitation potential between the CO varieties also enter into a quantitative comparison.
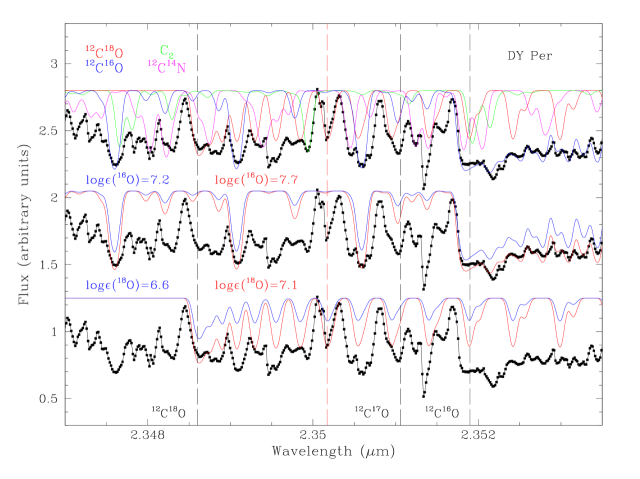
Extraction of the 16O/18O ratio for DY Per is illustrated by Fig. 3 where the IGRINS spectrum from Fig. 2 is repeated. Superimposed on the observed spectrum and distinguished by different colors are predicted contributions from not only 12C16O and 12C18O but also from 12C14N and C2. The individual molecular contributions are displayed in order to show the complexity of the observed spectra and they correspond to the initial guesses for the CNO abundances. Several iterations using specific spectral regions dominated by 12C14N (2.251 m) and 12C16O (2.343 m), among others, were needed to obtain the final elemental abundances of C/N/O=9.4/8.6/7.9 with the T K, , and [M]=0.0 model with an input H-abundance of 10.5 and microturbulence = 7 km s-1).
The synthetic spectrum fitted to the IGRINS spectrum corresponds to 16O/18O . As noted above, the appearance of the spectrum indicates that the 12C16O and 12C18O contributions may be estimated almost independently and this is explored in the lower panels in Fig. 3. The middle panel repeats the synthesis but with two values for the 16O abundance and the bottom panel shows the synthetic spectra for the 12C18O contribution with the 18O abundance assigned two values. We stress that our measurement of the 16O/18O is robust and insensitive to the model atmosphere adopted. For example, very similar results are obtained for [M]=0.0 3000 K models with a H=9.5 and 12 (), a metal-poor [M]=-1.0 3500 K model with H=9.5 and 10.5 (), and even with a normal sequence model atmosphere constructed for the stellar parameters of the C-rich AGB star TX Psc (. This low 16O/18O ratio was anticipated by Bhowmick et al.’s (2018) analysis of an infrared spectrum at the low resolution 900 which gave 16O/18O .
Discovery of high 18O abundances from inspection of low-resolution spectra of HD 137613 and friends showing an unusual depth of the R branch of the 2-0 12C18O band relative to R branch of the 4-2 12C16O band but was not accompanied by remarks on the 17O abundances (Clayton et al. 2005, 2007). The 3-1 12C17O R branch head at 2.3511 m falls between these two heads and just short of the 4-2 12C16O head in an interval dominated by several strong lines such that the strength of 12C17O lines was presumed better examined from high-resolution spectra. Detection of 12C17O lines is likely best attempted from its 2-0 R branch, as first noted by Maillard (1974) for M giants, and exploited by Harris et al. (1987) and Abia et al. (2017) for carbon giants. Inspection of the spectra shows that the 12C17O lines 2-0 R25 to R33 appear absent in both HD 137613 and DY Per, notably lines with J= 27, 32 and 33. For DY Per, the synthetic spectra provide the lower limit 16O/17O80), a lower limit similar to those derived for HD 137613 and other RCB and HdC stars.
DY Per’s high 18O abundance places this C-rich giant among the H-deficient RCB and HdC stars and quite apart from the carbon AGB giants. Karambelkar et al. (2022) analyzed low-resolution (mostly at ) spectra of the CO bands. DY Per and related variables were not observed. Our 16O/18O for DY Per is within the range reported by the authors for their extensive sample of H-deficient giants. Karambelkar et al. (2022) claim that the HdC and RCB stars have “different oxygen isotope ratios”: six of the HdC stars have 16O/18O but in contrast 28 of the 33 RCB stars have 16O/18O but 12 RCB stars are determined to have 16O/18O and even 8 of this sample have 16O/18O . It is surely, as Karambelkar et al. (2022) note, vital to confirm the distribution function for 16O/18O among HdC and RCB stars from high-resolution infrared spectra but these initial differences may point to a difference in origins of HdC and RCB stars. Intriguingly, extension of this hint to DY Per variables could yield insight into a possible relation between these variables and the HdC/RCB stars.
4.4 The Fluorine abundance
Fluorine’s abundance is a potential indicator of DY Per’s heritage. Carbon AGB giants betray F’s presence through vibration-rotation 1-0 lines of HF in their K-band spectrum. Spectra of the warmest RCB-variables and extreme He stars show variously lines of F i and F ii thus providing a measure of the F abundance among these very H-deficient stars. Through a, careful interpretation of the HF lines in DY Per’s spectrum, it may be possible to highlight DY Per’s heritage.
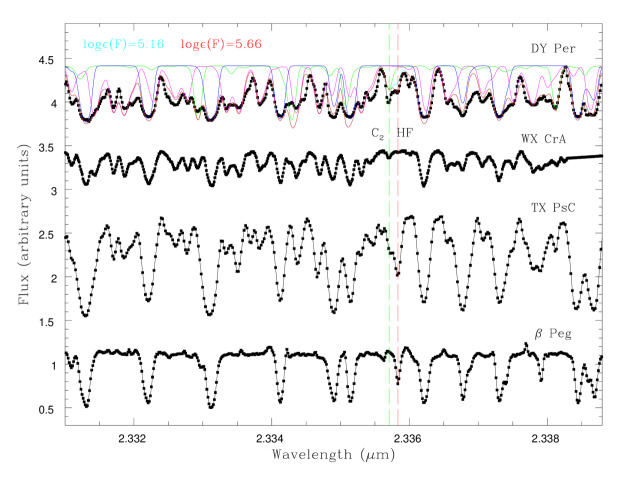
Fluorine in a cool C-rich giant is detectable through vibration-rotation 1-0 lines of HF in the K-band spectrum. Jönsson et al. (2014) review 1-0 vibration-rotation spectrum. The 1-0 R(9) line at 2.33583m appears unblended in spectra of late-type stars. Fig. 4 shows an interval around this HF line in four giants: DY Per, the HdC WX CrA, TX Psc, and the M giant Peg. The HF line is marked by the red dashed line. The green dashed line marks the location of a nearby C2 line. The R(25) 12C17O 2-0 line is blended with the C2 line but is not a serious contributor. This C2 line appears blended with an unidentified line.
Inspection of Fig. 4 confirms expectations about the spectra of the four giants: Peg offers the cleanest spectrum with the HF line, WX CrA has a weak C2 blend but no detectable HF line, the CN and C2 lines between the prominent 12C16O lines in TX Psc and DY Per (also contributing in WX CrA) are a more severe contaminant for DY Per than TX Psc because, as shown by Fig. 1, all CO lines are weaker in DY Per than in TX Psc. This wavelength interval appears not to be populated by lines from 12C18O and 13C16O.
Fig. 4 suggests that a severe H-deficiency and the higher Teff ensure that the HF line is absent from WX CrA. Our PHOENIX observations (García-Hernández et al. 2010, Fig. 2) show the HF line also absent from the HdC HD 137613 and also the observed cool (T K) RCBs – all with strong stellar CO bands and presumably severe H deficiencies – ES Aql, U Aqr, SV Sge, and S Aps. Our conclusion is that the absence of the HF line in these stars may be set primarily by their severe H-deficiency and not offset by an F overabundance is consistent with a compilation of H and F abundances for EHe stars and warm RCB variables (Jeffrey et al. 2011): mean values for abundances (H,F) are (6.8, 6.7) and (6.2,6.8) for EHe and RCB samples, respectively with the H abundances covering a range of at least 3 dex and several RCB and EHe stars with [F/H] at positive values. Exceptional stars exist including the RCB V854 Cen with (H,F) = (9.9,) and DY Cen at H=10.7 and lacking a F estimate.
Published analyses of HF lines in TX Psc and Peg show that these giants have their expected F abundance – assuming a normal H abundance – e.g., [F/Fe] . Abia et al. (2010, 2015, 2019) report that a carbon star’s F abundance increases with its -process enrichment approximately as expected for the third dredge-up phases. Since TX Psc is an -process enriched carbon star, its F abundance of (F) may be considered normal. The HF lines from Galactic M giants including Peg were analyzed by Guerço et al. (2019) to obtain the star’s (F) and [F/Fe] . The fact that TX Psc’s HF line is stronger than Peg’s results primarily from three factors: the M giant has a nearly 600 K hotter than the carbon giant resulting in less of the hydrogen tied up in H2 and it lacks the F enrichment from the third dredge up.
Inspection of Fig. 4 shows that DY Per’s HF line is weaker than in TX Psc. But this weakening may reflect the H-deficiency of DY Per. A H-deficiency affects both the line and the continuous opacities. With H atoms replaced by He atoms the free-free infrared absorption of a He- ion is less effective than of a H- ion, the continuous absorption is reduced but by a smaller factor than the line opacity. Additionally, formation of H2 molecules reduces the partial pressure of H atoms in DY Per and stars of similar temperatures. Our 3000 K solar metallicity model atmosphere with a normal H (=12) abundance fits the HF line with F or [F/Fe] = +0.6 which is hardly an exceptional result given our lack of detailed information on the star’s metallicity and its -process enhancement. The equivalent model with H=10.5 (i.e., He/H = 10 not the solar He/H = 0.1), shows that the fit to DY Per’s HF line is achieved with a F abundance of (F) ([F/Fe]=+1.1; see Fig. 4). The model with H=9.5 requires a F abundance of (F) ([F/Fe]=+1.3. These results are just within the spread of F overabundances found from atomic lines measured in EHes and warm RCB-variables but notably the H-deficiency is far smaller than the typical H-deficiency of 5 to 6 dex for EHe and RCB stars. Model atmospheres constructed for greater H-deficiencies may not yield much greater F abundances because the opacities are already dominated by He-.
4.5 C, N and O abundances
Elemental C, N and O abundances are based on familiar conditions drawn from molecular equilibrium: the abundance drawn from the fit to C2 lines is a measure of (C-O)2 , the CN lines sample the quantity (C-O)N0.5 and the CO lines in this C-rich atmosphere measure the O abundance. The CO density is determined by the O abundance on account of the dominance of CO and N2 in the molecular equilibrium. Our abundance analysis yields a striking difference in C, N, and O abundances between DY Per and carbon giants as represented by TX Psc. Given that DY Per and TX Psc have similar atmospheric parameters, the evident weaker CO lines in DY Per relative to TX Psc but the not dissimilar strengths of C2 and especially the CN lines is a strong hint that DY Per is O-poor relative to the carbon giant TX Psc. In turn, TX Psc is representative of the carbon giants analyzed by Lambert et al. (1986). This inference is confirmed by fits of synthetic spectra to typical K-band windows sampling C2, CN, and CO lines.
Our adoption of the 3000 K and solar metallicity model with moderate H-deficiency represented by H = 10.5 provides the elemental abundances: [C]=0.8, [N ]=0.6 and [O]=-0.9, which may be compared directly with results compiled by Jeffery, Karakas & Saio (2011) for samples of EHe and RCB stars. DY Per’s [C] and [N] are within the range shown by these H-deficient stars for [Fe] = 0 but the [O] is close to the lowest values shown by EHe and RCBs. Overlap between DY Per’s C, N, and O abundances and samples of EHe and RCBs is improved if DY Per is somewhat metal-poor.
Infrared photometry has likened DY Per (and associated variables) to carbon N-type giants. Such a correspondence is contradicted by our demonstration that DY Per’s 16O/18O ratio is thoroughly unrepresentative of values reported for carbon giants. Now, DY Per’s C/O ratio of about 30 stands in sharp disagreement with values C/O found for carbon giants (Lambert et al. 1986: Ohnaka, Tsuji & Aoki 2000). These correspondences point to a conclusion that DY Per’s origin lies not along an exceptional evolutionary path of a carbon giant but within the origin of RCB variables., i.e. by a white dwarf merger and subsequent mass loss and evolution to a hotter star.
5 DY Per’s heritage?
DY Per was isolated among the family of C-rich long period variables by Alksnis’s (1994) proposal that its deep declines showed it ‘probably belongs to the RCB-type variables’. Exploration of this proposal has been the focus of our investigation. Photometric surveys and their follow-up have shown that DY Per and newly discovered DY Per variables have IR colors representative of carbon AGB giants but atypical of RCB variables. DY Per variables, as carbon giants at maximum light have lower effective temperatures than the coolest RCB variables, also at maximum light. Ability to determine the severe H-deficiency is, as we have highlighted, greatly impaired at a carbon giant’s temperature and, thus, a defining marque of a RCB variable is unavailable. Our demonstration that DY Per has the low 16O/18O ratio now (apparently) common among HdC and RCB variables presenting CO vibration-rotation bands in their spectra endorses the DY Per-RCB link. Our analysis of DY Per’s K-band spectrum shows that the star’s C, N, and O abundances overlap well with the abundances of RCB variables and EHe stars but not with the reported compositions of carbon AGB giants. These abundance differences between DY Per and carbon giants support the suggestion that DY Per is likely not an exceptional descendant of the common carbon giants. This suggestion echoes Warner’s (1967) prescient discussion following his bold early abundance analysis of optical photographic spectra and a suggestion reinforced by discovery of abundant 18O in atmospheres of RCB-variables and HdC stars. Association of DY Per rich in 18O with a carbon giant has to accept the challenge that H-burning in the giant’s interior results in a 14N-rich zone which with the onset of He-burning is converted to 18O via -capture. Appearance of abundant 18O in the atmosphere requires not only the avoidance of internal conversion of 18O to 22Ne by -capture but, in the absence of large-scale convective currents between the 18O-rich interior and the atmosphere, serious (unanticipated) mass-loss by the AGB giant is a necessity to expose the 18O-rich hot interior layer as part of the cool atmosphere of a H-deficient giant. This is not to deny that theoretical imagination is incapable of devising schemes for severe mass loss and deep mixing capable of producing a DY Per-like giant. A cautionary note is that we have analyzed just one DY Per variable, not established definitively its H-deficiency nor that it is (or was) a single star.
If extraordinary evolution of a carbon giant is not easily seen as part of DY Per’s heritage, the likely alternative involves a merger of a He white dwarf with a C-O white dwarf leading to theoretical RCB variables and EHe stars in their observed locations in the Hertzsprung-Russell (H-R) diagram and with about their predicted compositions, notably the low 16O/18O ratios. Birth of RCB variables in the merger of a He white dwarf onto a C-O white dwarf was explored broadly by Webbink (1984). Quantitative exploration of the properties including the composition of the merger product poses computational challenges and realistic representation of the physics at all phases from beginning of the merger of the He white dwarf onto the C-O white dwarf through to the emergence of the RCB product. The challenges in modeling may be appreciated by reading a sample of recent studies involving various He and C-O white dwarf pairs of solar and sub-solar metallicities: Menon et al. (2013), Zhang et al. (2014), Crawford et al. (2020), Munson et al. (2021), and Munson, Chatzopoulos & Denissenkov (2022). In broad terms, the RCB variables emerging from a merger may match the observed RCB and EHe stars in terms of H, C, N, O and F abundances. A low 16O/18O ratio is predicted by many models but can not be assumed to be a guaranteed prediction across a family of merger models.
RCB variables are low mass giants with effective temperatures from about 4000 K to 8000 K with luminosities . At temperatures below about 3500 K, the C-rich giant is a spectroscopist’s nightmare; cool RCB stars such as DY Per likely remain undiscovered spectroscopically. A few hotter RCB stars (e.g., DY Cen with a present T K; Jeffery, Rao & Lambert 2020) are known. The high temperature limit is extended and to lower luminosities by EHe stars with similar compositions to RCB stars. This evolution of the supergiants to increasing temperature is driven largely by mass-loss by the RCB as it evolves to higher temperatures. Evolutionary tracks in theoretical H-R diagrams displaying white dwarf merger products predict giants with composition changes at these observed RCB luminosities and effective temperatures. DY Per’s absolute luminosity is close to the range expected for merger products but its Teff appears cooler than presently provided by a representative sample of merger studies using different prescriptions to model the merger process: presently available calculations, for example, Zhang et al. (2014) and Munson, Chatzopoulos & Denissenkov (2022) predict merger products at least about 1000 K warmer than the effective temperature of DY Per. But more detailed accounting of DY Per’s structure including the opacity of the atmosphere and envelope may reduce the effective temperature.
6 Concluding remarks
Alksnis’s (1994) bold suggestion from long-term photometry that the carbon star DY Per is a cool example of a RCB variable is supported but not unerringly proven by our demonstration that DY Per shares with the RCB variables and their undoubtedly close relatives the HdC stars the strikingly low 16O/18O ratio which suggests these stars owe their origin to the merger of a He with a C-O white dwarf. H-deficiency, a signature of RCB, HdC and EHe stars, has yet to be proven for DY Per; the suspicion of H-deficiency for DY Per is encouraged but by no mans proven by the demonstration that a 16O/18O ratio and a F overabundance are generally coupled and the HF line in DY Per is consistent with a moderate to a strong H-deficiency and the typical F overabundance for a RCB and EHe star.
An emphasis on expanded observational studies of DY Per and DY Per variables should not obscure the need for continued theoretical work on the white dwarf merger process. The above challenge is noted that available studies do not produce luminous giants with the cool effective temperature of DY Per and DY Per-variables (see above); predicted luminous giants appear at effective temperatures close to the minimum found for RCB-variables (T K) and not at the roughly 3000 K temperature of DY Per. A likely key ingredient in the modeing of the white dwarf merger event is the rate at which the He white dwarf is merged with the C-O white dwarf. Zhang et al. (2014) explore a model in which the merger and the associated nucleosynthesis is complete in only about 500 years yet the luminous RCB star takes almost 1000,000 yrs to evolve through the EHe stage. Munson, Chatzopoulos & Denissenkov (2022, Fig. 14) highlight that this plausible merger process results in the RCB beginning life rich in 14C not the expected 14N. In the immediate prior stage, almost all 14N experienced neutron capture 14NC. The RCB is now set to experience radioactive dating as 14C decays with its half-life of 5730 yr and 14N builds to its final abundance by at least 1 dex over a period of several 14C half-lives. Although the 2-0 14C16O band is shifted red and amongst bands of all other CO isotopologues (Pavlenko, Yurchenko & Tennyson 2020), a prediction that 14N existed slightly earlier as 14C will surely intrigue prospectors. An interesting time is ahead!
References
- Abia et al. (2010) Abia, C., Cunha, K., Cristallo, S., et al., 2010, ApJ, 715, L94
- Abia et al. (2019) Abia, C., Cristallo, S., Cunha, K., et al. , 2019, A&A, 625, A40
- Abia et al. (2015) Abia, C., Cunha, K., Cristallo, S. et al. , 2015, A&A, 581, A88
- Abia et al. (2017) Abia, C., Hedrosa, R.P., Domínguez, Straniero, O., 2017, A&A, 599, A39
- Alcock et al. (2001) Alcock, C., Allsman, R. A., Alves, D. R., et al. 2001, ApJ, 554, 298
- Alksnis et al. (1994) Alksnis, A. 1994, Balt. Astron., 3, 410
- Alksnis et al. (2002) Alksnis, A., Larionov, V.M., Larionova, L.V., Shenavrin, V.I. 2002, Balt. Astr. 11, 487
- Alksnis et al. (2009) Alksnis, A., Larionov, V.M., Smirnova, O.Arkharov, A.A., et al. 2009, Balt. Astron., 18, 53
- Alvarez et al. (1998) Alvarez, R., Plez, B., 1998, A&A, 330, 1199
- Aoki et al. (1998) Aoki, W., Ohnaka, K., Tsuji, T., 1998, A&A, 340, 222
- Asplund et al. (2000) Asplund, M., Gustafsson, B., Kiselman, D., Eriksson, K. 1997, A&A, 318, 521
- Barnbaum (1994) Barnbaum, C.,1994, ApJS, 90, 317
- Bergeat et al. (2001) Bergeat, J., Knapik, A., Rutily, B., 2001, A&A, 369, 178
- Bhowmick et al. (2020) Bhowmick, A., Pandey, G., Lambert, D.L., 2020, ApJ, 891, 40
- Bhowmick et al. (2018) Bhowmick, A., Pandey, G., Vishal , J. et al. 2018, ApJ. 854. 140
- Cardelli et al. (1989) Cardelli, J.A., Clayton, G.C., Mathis, J.S., 1989, ApJ., 345, 245
- Clayton et al. (2007) Clayton, G.C., Geballe, T.R., Herwig, F., Fryer, C., Asplund, M., 2007, ApJ, 662, 1220
- Clayton et al. (2005) Clayton, G.C., Herwig, F., Geballe, T.R., et al. 2005, ApJ, 623, L141
- Crawford et al. (2020) Crawford, C.L., Clayton, G.C., Munson, B., et al., 2020, MNRAS, 498, 2912
- Crawford et al. (2023) Crawford, C.L., Tisserand, P., Clayton, G.C. et al. 2023, MNRAS, 521, 1674
- Dominy (1985) Dominy, J.F., 1985, PASP, 97, 1104
- Fitzgerald (1968) Fitzgerald, M. Pim, 1968, AJ, 73, 983
- Fujita & Tsuji (1977) Fujita, Y., Tsuji, T., 1977, PASJ, 29, 711
- Brown et al. (2021) Gaia Collaboration, Brown. A.G.A., Vallenari, A. , et al. 2021, A&A, 649, A1
- García-Hernández et al. (2009) García-Hernández, D.A., Hinkle, K.H., Lambert, D.L., Eriksson, K., 2009, ApJ, 696, 1733
- García-Hernández et al. (2010) García-Hernández, D.A., Lambert, D.L., Rao, N.K., Hinkle, K.H., Eriksson, K., 2010, ApJ, 714, 144
- García-Hernández et al. (2013) García-Hernández, D.A., Rao, N. K., Lambert, D. L. 2013, ApJ, 773, 107
- Gordon et al. (2017) Gordon, I. E., Rothman, L. S., Hill, C., et al. 2017, JQSRT, 203, 3
- Guero̧ et al. (2019) Guero̧, G. , Cunha, K., Smith, V.V., et al. 2019, ApJ, 885, 139
- Gustafsson et al. (2008) Gustafsson, B., Edvardsson, B. Eriksson, K., Jørgensen, U.G. , Nordlund, Å. 2008. A&A, 385, 951
- Harris et al. (1987) Harris, M.J., Lambert, D.L., Hinkle, K.H., Gustafsson, B., Eriksson, K., 1987, ApJ. 316, 294
- Hema et al. (2012) Hema, B.P., Pandey, G., Lambert, D.L., 2012, ApJ, 747, 102
- Hinkle et al. (2003) Hinkle, K.H., Blum, R.D., Joyce, R.R., et al. 2003, Proc,SPIE, 4834, 353
- Hinkle et al. (2016) Hinkle, K.H., Lebzelter, T., Straniero, O., 2016, ApJ, 825, 38
- Jeffery et al. (2011) Jeffery, C.S., Karakas, A.I., Saio, H., 2011, MNRAS, 414, 3599
- Jeffery et al. (2020) Jeffery, C. S., Rao, N. K., Lambert, D. L., 2020, MNRAS, 493, 3565
- Jönsson et al. (2014) Jönsson, H., Ryde, N., Harper, G.M., et al. 2014, A&A, 564, A22
- Karambelkar et al. (2022) Karambelkar, V.; Kasliwal, M. M.; Tisserand, P. et al. 2022, A&A, 667, 84
- Keenan & Barnbaum (1997) Keenan, P. C., Barnbaum, C., 1997, PASP, 109, 969
- Kerschbaum et al. (2000) Kerschbaum, F., Lebzelter, T., Mekul. I., 2010, A&A, 524, A87
- Kipper (2002) Kipper, T., 2002, Balt. Astron., 11, 249
- Lambert et al. (1986) Lambert, D.L., Gustafsson, B., Eriksson, K., Hinkle, K.H., 1986, ApJS, 62, 373
- Lebzelter et al. (2019) Lebzelter, T., Hinkle, K.H., Straniero, O. Lambert, D.L., Pilachowski, C.A., Nault, K.A., 2019, ApJ, 886, 117
- Maillard (174) Maillard, J.P., 1974, HiA, 3, 269
- Mathis et al. (1977) Mathis, J.S., Rumpl, W., Nordsieck, K.H., 1977, ApJ, 217, 425
- Menon et al. (2013) Menon, A., Herwig, F., Denissenkov, D., et al., 2013, ApJ., 772, 59
- Munson et al. (2022) Munson, B., Chatzopoulos, E., & Denissenkov, P.A., 2022, ApJ., 939, 45
- Munson et al. (2021) Munson, B., Chatzopoulos, E., Frank, J., et al., 2021, ApJ., 911, 103
- Nenkova et al. (2000) Nenkova, M., Ivezíc, Elitzur, M., 2000, ASPC, 196, 77
- Neckel (1967) Neckel, Th. 1967, Veröffentl. Landessternwarte Heidelberg-Königstuhl, 19, 3
- Neckel & Klare (1980) Neckel, Th., Klare, G., 1980, A&AS, 42, 251
- Ohnaka et al. (2000) Ohnaka, K., Tsuji, T., Aoki, W., 2000, A&A, 353, 528
- Pandey (2006) Pandey, G., 2006, ApJ, 648, 143
- Pandey et al. (2008) Pandey, G., Lambert, D.L., Rao, N.K. 2008, ApJ, 674, 1068
- Park et al. (2014) Park, C., Jaffe, D.T., Yuk, I.-S., et al. 2014, SPIE conf. ser. 9147, 91471D-1
- Pavlenko et al. (2020) Pavlenko, Y.V., Yurchenko, S.N., Tennyson, J., 2020, A&A, 633, A52
- Plez (2012) Plez, B, 2012, Astrophysics Source Code Library, record 1205.004
- Rao & Lambert (2008) Rao, N.K., Lambert, D.L., 2008, MNRAS, 384, 477
- Rao et al. (2007) Rao, N.K., Lambert, D.L.,Allende Prieto, C., Eriksson, K., Wahlin, R., 2007 (unpublished)
- Schlegel et al. (1998) Schlegel. D.J., Finkbeiner, D.P., Davis, M., 1998, ApJ, 500. 525
- Smirnova (2012) Smirnova, O., 2012, MNRAS,, 424, 2468
- Sneden et al. (2014) Sneden, C., Lucatello, S. Ram, R. S. et al. 2014, ApJS, 214, 26
- Soszyński et al. (2009) Soszyński, I., Udalski, A., Szymański, M. K., et al. 2009, Acta Astron., 59, 335
- Tisserand (2012) Tisserand, P. 2012, A&A, 583, 51
- Tisserand et al. (2009) Tisserand, P., Wood, P. R., Marquette, J. B., et al. 2009, A&A, 501, 985
- Warner (1967) Warner, B., 1967, MNRAS, 137, 119
- Webbink (1984) Webbink, R. F., 1984, ApJ, 277, 355
- Yakovina et al. (2009) Yakovina, L.A., Pugach, A.F., Pavlenko, Ya.V., 2009, Astron. Rep., 53, 187
- Yurchenko et al. (2018) Yurchenko, S. N., Szabó, I., Pyatenko, E., Tennyson, J. 2018, MNRAS, 480, 3397
- Začs et al. (2005) Začs, L., Chen, W.P., Alksnis, O., et al. 2005, A&A, 438, L13
- Začs et al. (2007) Začs, L., Mondal, S., Chen, W. P., et al. 2007, A&A, 472, 247
- Zhang et al. (2014) Zhang, X., Jeffery, C.S., Chen, X., et al., 2014, MNRAS, 445, 660